
Abstract
It is of significance to study the damage and destruction of rock under cyclic loading in geotechnical engineering. We determined the trends in damage evolution of sandstone under constant-amplitude and tiered cyclic loading and unloading under uniaxial compression. The results of the study show that (1) the variation of acoustic-emission events was consistent with the stress curves and 89% of all acoustic-emission events occurred during the cycling stages. The observed Kaiser effect was more notable in tiered cycling. (2) The damage variable increased sharply in the cycling stages and its increment was 0.07 higher for tiered cycling than constant-amplitude cycling. Sandstone exhibited greater damage under tiered cyclic loading and unloading. (3) Equations for the evolution of the damage variable under the two cycle modes were obtained by fitting of experimental data. (4) The fractal dimensions of the constant-amplitude cycle were larger than those of the tiered cycle. The process of damage and destruction presents a trend of reducing fractal dimension. The damage accumulation of sandstone under tiered cycling was faster than under constant-amplitude cycling. These results provide references for damage and early warning of rock under both constant-amplitude and tiered cyclic loading and unloading.
Introduction
The mechanical properties of rocks play an important role in assuring stability of underground geotechnical engineering structures, such as subways, tunnels, and mining. Understanding damage and failure processes of rock at high pressure provides an effective basis for design of underground engineering structures and early warning of rock failure. Scholars have used a variety of research methods to study rock deformation and destabilization. Acoustic emission (AE) technology is one of the non-destructive testing methods that uses distributed sensors to study the failure process of rock mass.
Chang and Lee 1 reported that AE in rocks refers to interior deformation accumulation, and its release with loading is in the form of elastic waves. This phenomenon was first used for stability monitoring and rock-burst prediction in mines. AE parameters, its locations, and other information can be extracted during the rock failure process using a collection device. He et al. 2 used a self-designed test facility to analyze the relationship between AE signal amplitude and rock burst mechanisms. Ishida et al. 3 monitored AE events during a progressive chamber excavation and considered the fault-plane solution superior to the moment tensor inversion for identifying the fracture mechanism. Dresen et al. 4 investigated nucleation and propagation of borehole breakouts and predicted a size effect of the critical pressure required to initiate breakouts. A triaxial compression test was carried out by Li et al. 5 and the rock burst mechanism was explained in terms of energy evolution. These methods used AE techniques to study rock failure mechanisms macroscopically and did not use a characteristic parameter to describe the change of rock during the failure process.
Damage mechanics addresses the mechanical laws of material failure under pressure. Damage constitutive models have been established to describe the deterioration of rock failure processes by a damage variable in combination with AE and damage mechanics. Munoz and Taheri investigated the effects of cyclic loading on the deformational characteristics of both the nonlocalized damage zone (NLDZ) and the localized damage zone (LDZ) of rock in the postpeak regime, 6 3D DIC was implemented to study the insights of strain localization evolution and damage evolution throughout the cyclic tests. 7 Aggelis 8 studied AE monitoring of concrete during bending and proposed an early warning scheme. AE parameters for all fracture stages were captured to show the process of rock damage. Shcherbakov et al. 9 found that the duration of the cumulative damage period of micro-damage under uniaxial compression was far greater than that of the failure stage, while the impact loading effect was exactly the opposite. Baud et al. 10 revealed a broad spectrum of geometric complexity and damage evolution associated with failure modes by AE location points. Geng et al. 11 made qualitative predictions of concrete damage from the sharp increase of cumulative AE energy and ringing count based on experimental field monitoring.
Some studies have proposed theoretical calculations and numerical simulations to predict rock damage. Arson and Medina-Cetina 12 developed a method to improve damage prediction in sandstone based on finite element simulations coupled with the Bayesian paradigm. A micromechanical damage model for rocks was proposed by Levasseur et al. 13 Lei et al. 14 considered pre-existing or potential faults and found, based on the analysis of the AE experimental data, that the predictability of catastrophic fault fracture is strongly dependent on fault heterogeneity. Zhao et al. 15 established constitutive models for use in numerical codes for rock response prediction near underground excavations. Hesser et al. 16 considered that the formation of micro- and macrocracks led to volume expansion and that the AE area was consistent with a large deformation zone. Stanchits et al. 17 conducted a series of tests to study the influence of fluid viscosity on hydraulic fracture and obtained large differences when fracturing with water and high-viscosity fluids.
Crack propagation based on AE data is well studied because AE can be used to spatially locate cracks. Manthei et al. 18 monitored micro-cracking to analyze rock integrity in two salt mines. Browning et al. 19 used the onset of AE to pinpoint the onset of new crack damage during cyclic stressing experiments and considered that crack damage is only generated when the differential stress exceeds some threshold value.
Unlike previous predictions of a future rock mass state, AE technology uses collected signal parameters to obtain the basic mechanical parameters of the rock. Cai et al. 20 proposed a back-analysis process using AE monitoring data recorded from a cavern site to identify rock mass strength. Shkuratnik and Novikov 21 established a relationship between ultimate rock strength and temperature under low-temperature conditions using AE experiments. The existence of the Kaiser effect was demonstrated through repetitive loading and unloading during three-point bending tests. Stavrakas et al. 22 Nikolenko and Shkuratnik 23 analyzed AE signals of composite supporting materials, obtained insight into memory effects, and put forward future research hotspots regarding the surrounding rock.
In addition to the study of AE test methods and rock mass mechanical properties, fractal theory as a statistical approach can be used to reveal the internal laws of data and obtain further useful information. Several previous studies involving AE test data have applied fractal theory. Pei et al. 24 developed a column covering method to analyze fractal characteristics of AE spatial event distributions, which provide information for further study into rock mass fracture mechanisms. Wang et al.25,26 studied the relationship between fractal dimension and rock failure processes and provided a good reference for rock mass stability monitoring in onsite excavations. Fractal dimension values of AE time-series were calculated by Kong et al. 27 which revealed microscopic fracturing mechanisms of coal-containing gas.
Some scholars have studied the variation of mechanical property parameters of rock under cyclic loading. Taheri et al. 28 studied the changes in mechanical rock behavior (i.e. strength and deformability) during various cyclic loading conditions under uniaxial and triaxial testing situation. The variation of Young’s modulus, Etan, and Poisson’s ratio with cyclic loading were obtained. Taheri et al. 29 investigated the peak strength variations during triaxial monotonic and cyclic compressive testing and the peak strength of rock was weakened or strengthened by cyclic loading was obtained. Experiments on rock under cyclic loading based on AE have mainly been used to study the rock’s memory effect. Meng et al. 30 conducted a uniaxial cyclic loading and unloading compression experiment and studied the changes of Felicity ratio of the rock specimens over the loading–unloading cycles. Kawai et al. 31 studied the AE response of an AZ31B alloy during cyclic and creep tests and reported that the fracture of magnesium alloys can be predicted on the basis of in situ AE measurements.
A comparative study of AE characteristics of rocks under constant-amplitude and tiered cyclic loading and unloading has not yet been reported, even though AE technology is widely used in geotechnical engineering applications. In addition, previous studies have not used AE to identify the response mechanism of periodically increasing roof pressure and rock failure in coal mining. In this study, AE tests were carried out on sandstone under constant-amplitude and tiered cyclic loading and unloading to simulate periodic roof pressure conditions in a coal mine by cyclic loading. We investigate the stress–strain relationships of sandstone and variation of AE parameters under the two loading modes. We combine damage mechanics and fractal theory to provide a feasible basis for the prediction of rock damage.
Materials and methods
Sample preparation
Sandstone samples were collected from the Xieyi coal mine in Huainan, China. Sample density was 2.6 g/cm3 and average uniaxial compressive strength was 50 MPa. The proposed methods of preparing standard rock samples for uniaxial compression testing recommended by International Society for Rock Mechanics (ISRM) were strictly obeyed. 32 The sandstone was processed into standard cylindrical specimens with a diameter of 50 mm and height of 100 mm. Each face was ground with emery paper to ensure its parallelism and smoothness. Samples with poor homogeneity were excluded by testing with a WSD-3 sonic apparatus (Chongqing Pentium CNC Technology Research Institute). Specimens with sound velocities less than 3000 m/s were excluded. The specimens were divided into two groups with six samples in each group and used for AE tests under constant-amplitude and tiered cyclic loading and unloading at high pressure. The rock samples are shown in Figure 1 and their physical and mechanical parameters are given in Table 1.
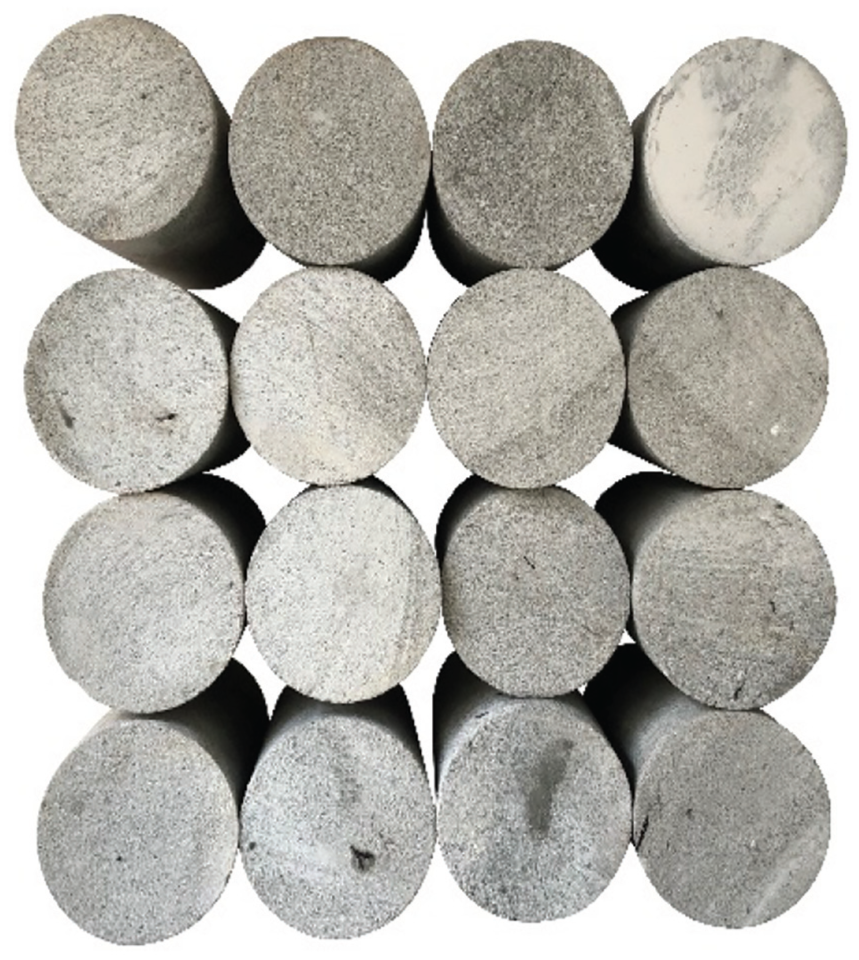
Rock specimens.
Physical and mechanical parameters of rock specimens.

Equipment
The test system consisted of two parts: a stress control system and an AE system. An MTS815 electro-hydraulic servo material testing system was adopted as the stress control system (Figure 2(a)), which recorded stress, strain, and other related data in real time. The AE acquisition was performed using a DS_2 system (Beijing Soft-land Times Scientific & Technology Co., Ltd.) (Figure 2(b)) that recorded AE events, their energy, the number of impacts, ringing, arrival time, and other parameters. The sampling speed was set to 3 MHz and the minimum amplitude was set to 20 mV. The test system is shown in Figure 3.

Photographs of the test system: (a) MTS815 and (b) acoustic-emission equipment.

Schematic of rock acoustic-emission test system.
The AE sensors were attached to rock specimens using fixtures (Figure 2(a)). High-vacuum silicon grease couplant was applied between the fixtures and sensors to improve the positioning accuracy. A total of eight AE sensors were used: four were placed 20 mm from the upper surface of rock specimens and the other four were placed 20 mm from the lower surface, all of which were positioned symmetrically. When the medium is homogeneous, the propagation velocities of transverse wave and longitudinal wave can be expressed by the following formula

where

where
Cyclic loading and unloading
Constant-amplitude and tiered cyclic loading and unloading were implemented by controlling the stress loading. The stress rate for loading and unloading was 0.2 MPa/s. For constant-amplitude cyclic loading and unloading (Figure 4(a)), the specimen was loaded to 85% of the rock strength, and the stress was then increased until the rock failed. The tiered cyclic loading and unloading (Figure 4(b)) employed 10 strength cycles of 45%, 65%, and 85% of the maximum loading to failure. The loading modes are shown in Figure 4.
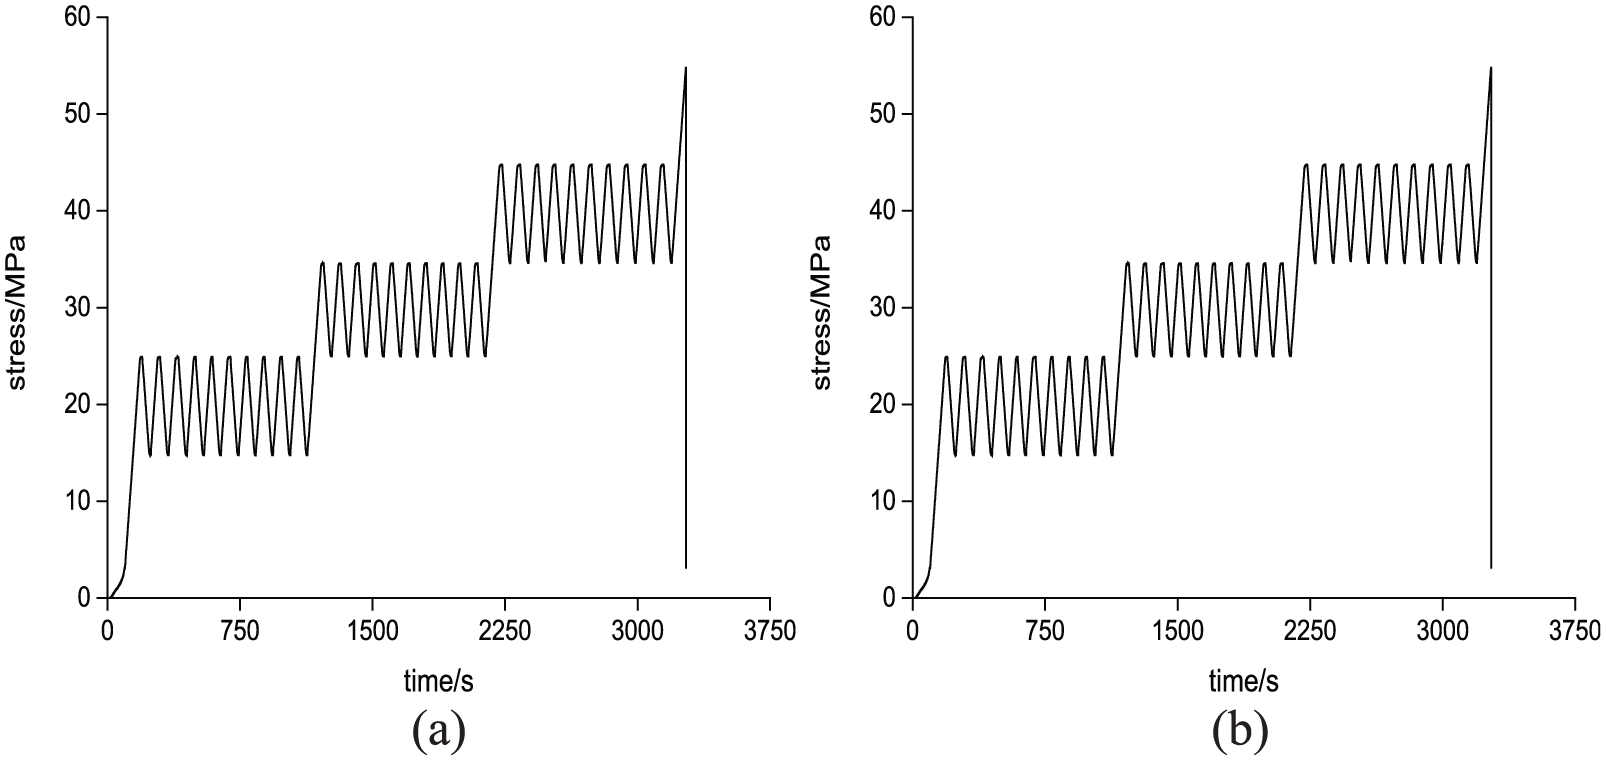
Stress loading under (a) constant-amplitude and (b) tiered cyclic loading and unloading.
Results
Deformation and failure
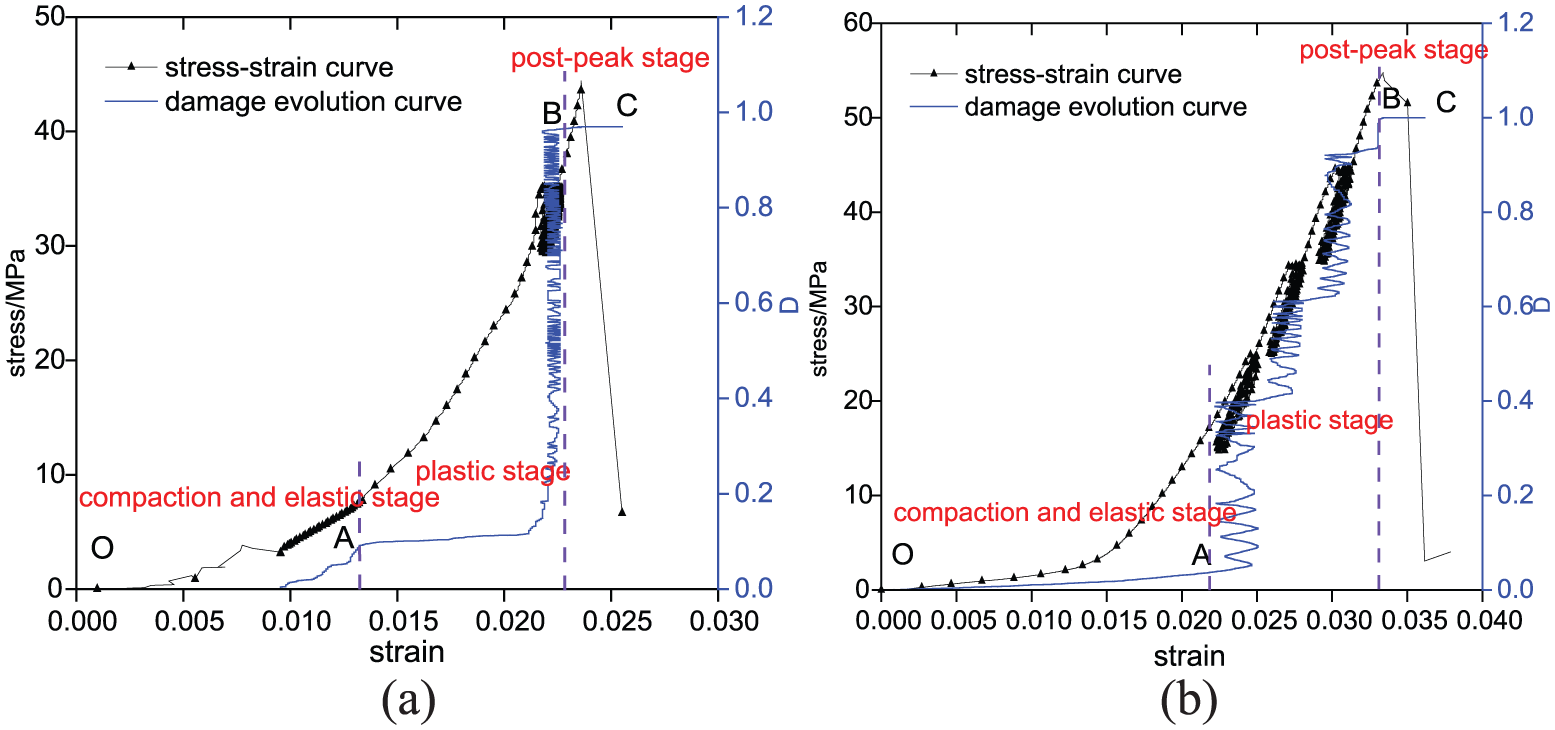
The rock specimens underwent sequential stages of compaction, elastic deformation, inelastic deformation, and failure from deformation to destruction. The stress–strain curves of sandstone under constant-amplitude and tiered cyclic loading and unloading are shown in Figure 5. Indicator for distinguishing elastic stage and inelastic stages is the change of stress–strain curve from straight line to curve. OA is compaction stage and the stress–strain curve is nonlinear. After point A, the stress–strain curve becomes a straight line. If the load is unloaded at this stage, the strain of rock can be completely restored. It indicates that the rock is recoverable at this time. The end of a straight line is point B. The stress–strain curve becomes a curve after point B. The stress corresponding to point B is called yield stress. BC stage is called inelastic stage. When the stress exceeds the yield stress (point B), the curve is concave. The strain increases obviously with the increase in stress, which indicates that the rock has entered the inelastic deformation stage and will produce obvious irreversible inelastic deformation. It indicates that the rock is unrecoverable at this time. The stress corresponding to point C is called peak stress.

Stress–strain curves of sandstone under (a) constant-amplitude and (b) tiered cyclic loading and unloading.
The stress was low during the initial loading stage. Slow deformation of the sandstone appeared after crack-closing. The inherent cracks and pores likely closed due to the external pressure. The stress–strain curves present a low convex shape. When the strain reached 0.01 (constant-amplitude cycling) or 0.015 (tiered cycling), the strain increased linearly with stress, and the sandstone then entered the elastic stage. After strain reached 0.017 (constant-amplitude cycling) or 0.022 (tiered cycling), the strain generated by the unit stress increment increased significantly. The sandstone entered the inelastic stage and cyclic loading and unloading began. Spring-back of strain occurred with increasing and decreasing stress at an early stage, as shown in Figure 5. The rebound value of the strain decreased with increasing number of cycles, while the strain increased because the rock has the ability to recover under low damage. When the damage had accumulated to a certain extent, the rock lost its ability to recover. The damage of rock was an accumulation process. In the initial compression stage, the damage was tiny. Rock had weak self-healing property and this can offset the tiny damage at this time. The rebound value of the strain was large. This occurred when the number of loading cycles was small. When the number of cycles increased, damage accumulation of rock gradually increased. This was beyond the deformation that can be recovered by the self-healing ability of the rock. The rebound value became 0 finally and the strain continued to increasing. The strain increased by 0.003 in the cycling stage under constant-amplitude cycling and by 0.013 under tiered cycling. Strain was clearly greater under tiered cyclic loading and unloading, reflecting greater damage to the sandstone.
Evolution of acoustic-emission events
The variation of stress, time, and AE events under constant-amplitude and tiered cyclic loading and unloading are shown in Figure 6.
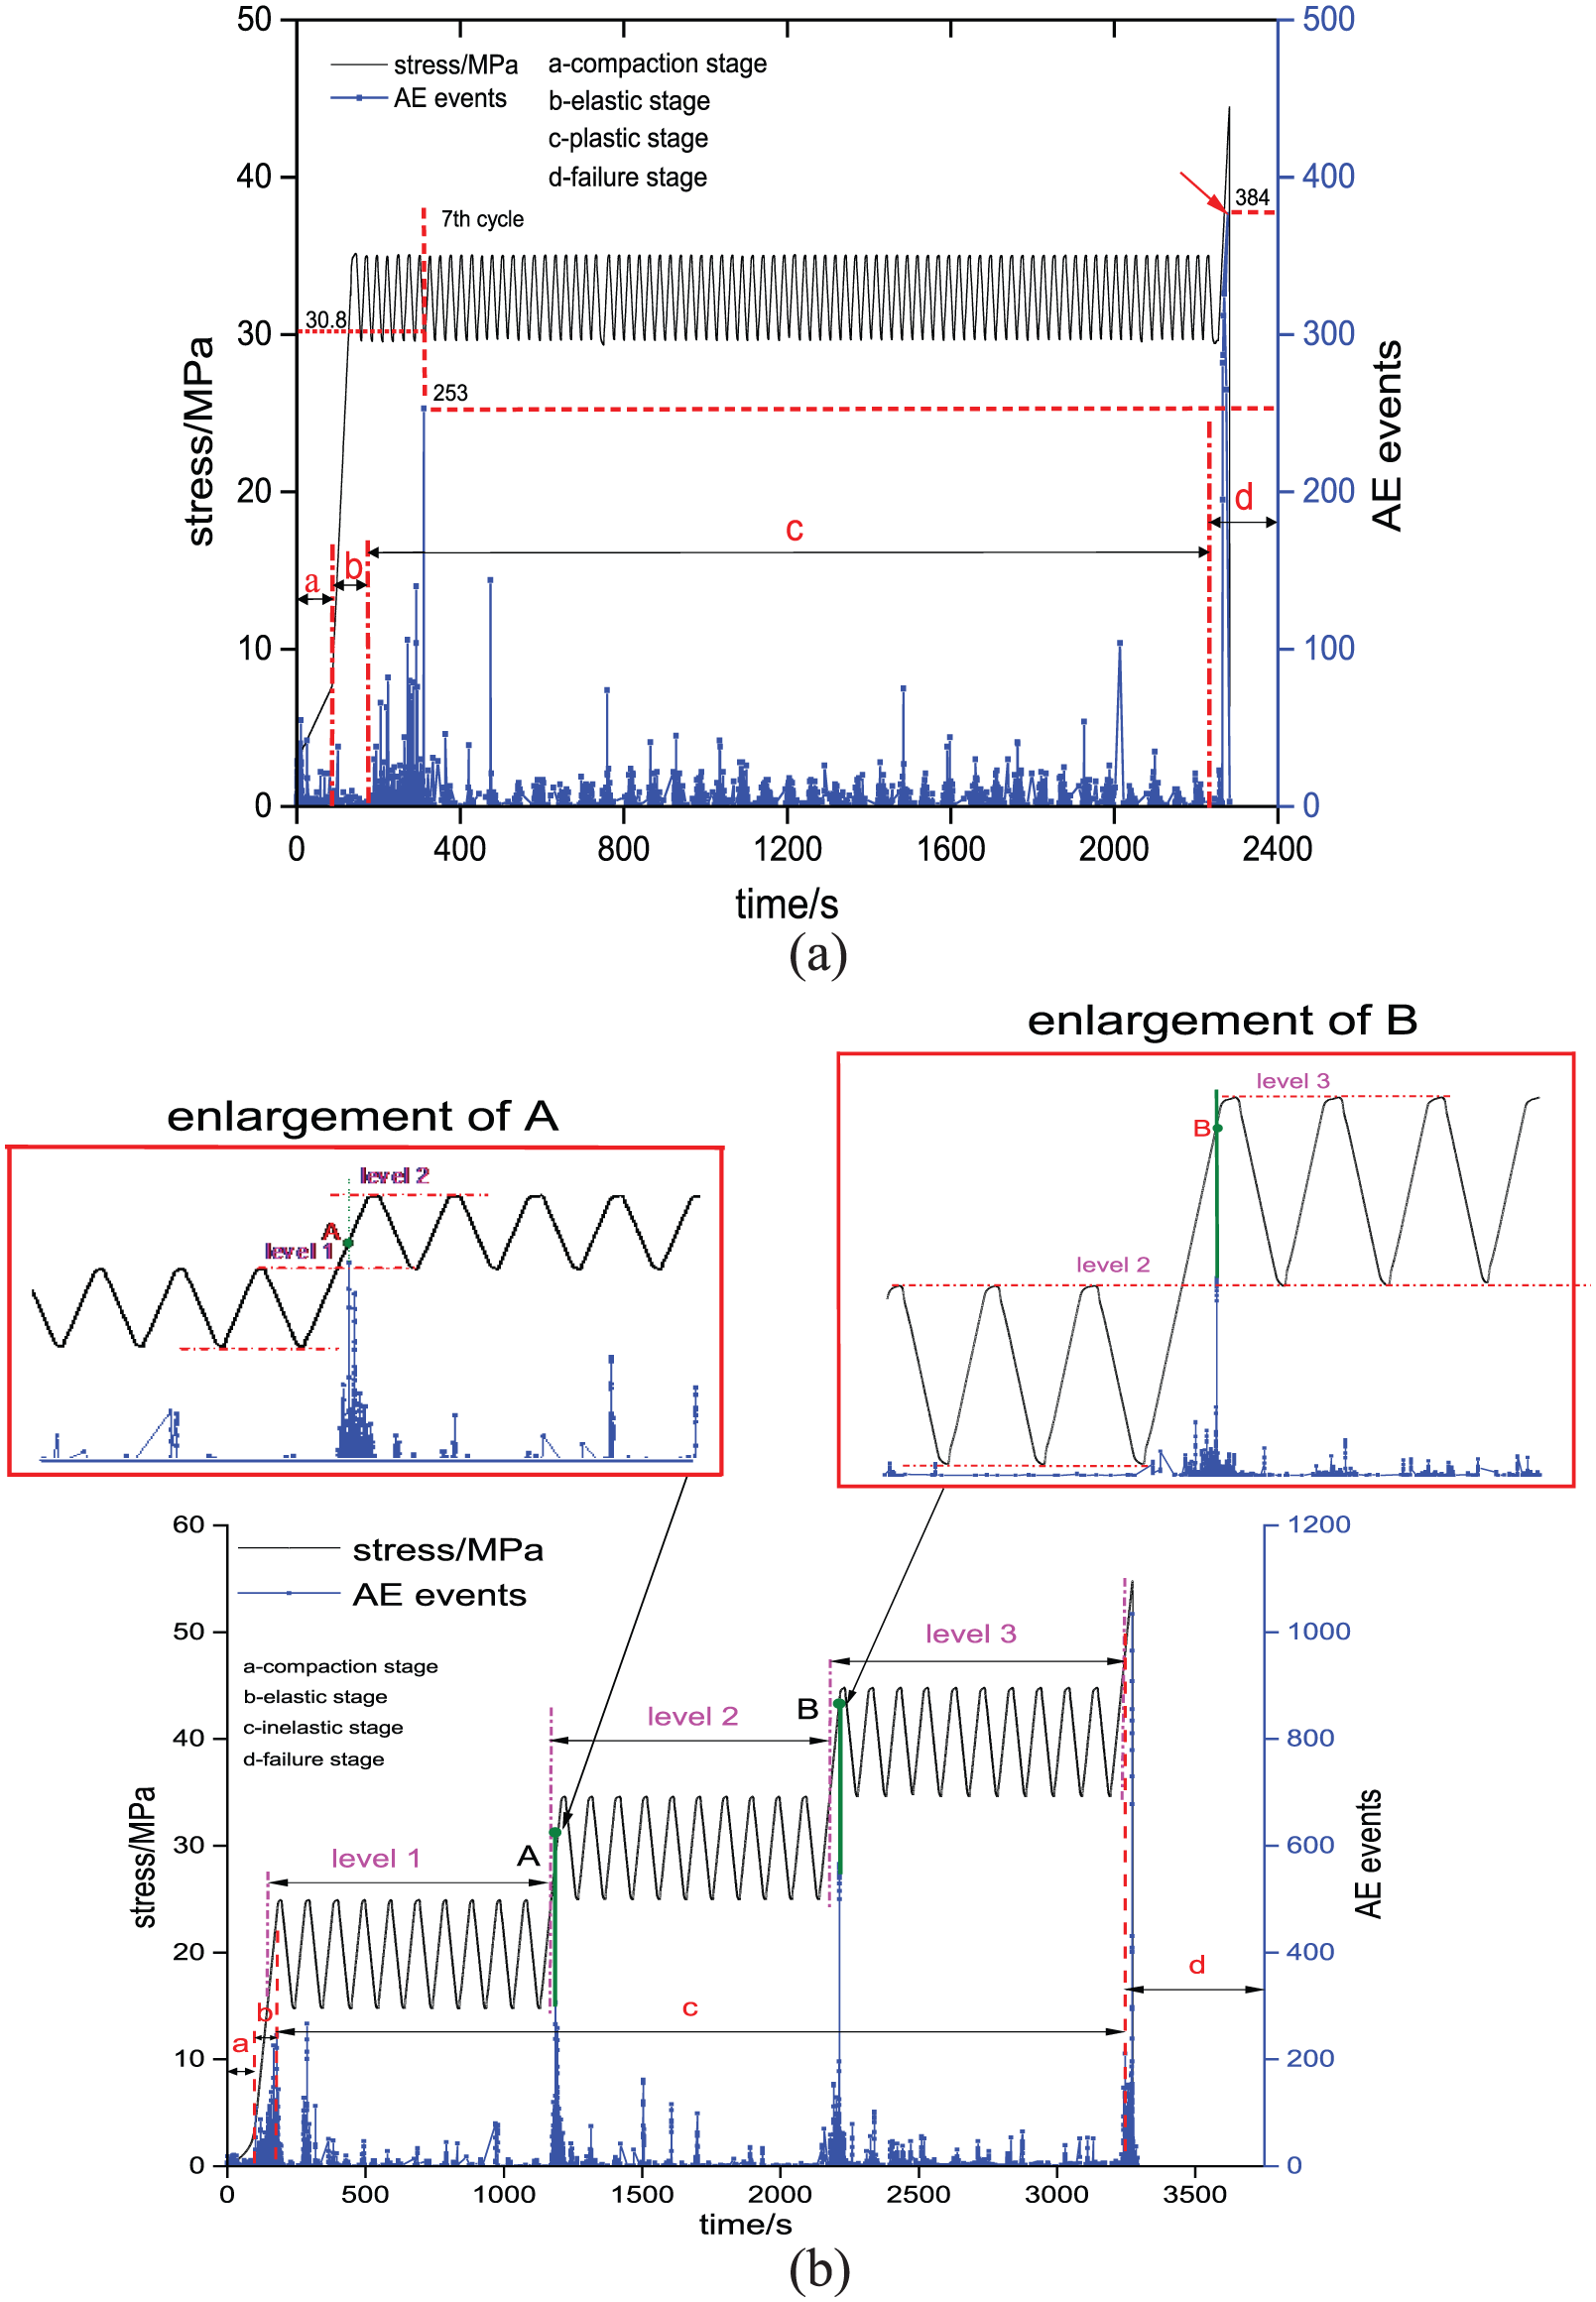
Relationships between sandstone stress, acoustic-emission events, and time under (a) constant-amplitude and (b) tiered cyclic loading and unloading.
The fluctuations of AE events coincided with the stress-time curves, as shown in Figure 6(a) and (b). A small number of AE events appeared during the compaction stage under constant-amplitude and tiered cyclic loading and unloading. As shown in Figure 6(a), the number of AE events increased sharply and reached 253 when the stress reached 70% of the strength (the seventh cycle). The number of AE events then remained low and stable until the onset of peak stress, reaching 326. As shown in Figure 6(b), tiered cyclic loading and unloading was divided into three levels. There were no apparent AE events in different cycles at the same level, and numerous events occurred only when the load in first cycle was greater than the maximum load of the previous level (A and B in Figure 6(b)). The Kaiser effect was clear 33 for sandstones under tiered cyclic loading and unloading and appeared in every cycle. Stress continued to increase after the end of the cyclic loading and unloading, and the number of AE events increased sharply when the rock approached its peak stress value. The sandstone then cracked and the number of AE events dropped to zero.
A Kaiser effect also occurred under tiered cycling. The number of AE events increased significantly during the first cycle of each grade, which differed from constant-amplitude cyclic loading and unloading. It then decreased gradually and the number of AE events varied significantly between the grades. The reason was that microcracks were generated in each cycle, following which many microfractures connected and formed large cracks after the cycle. In tiered cycling, the microfractures produced in each cycle connected with each other with the increase of stress in the next grade, which led to formation of large cracks. This was reflected by a significantly increased number of AE events in each grade. The number of AE events during the three levels of cyclic loading and unloading is shown in Figure 7. The number of AE events during the first and third levels of cyclic loading and unloading was substantially smaller than that of the second level, which indicates that the development and expansion of rock cracks mainly occurred in the second grade of the cycle.

Statistics of AE events in different stress levels under tiered cyclic loading and unloading.
As shown in Figure 6, the number of AE events was almost zero during the period from 2216 to 2246 s in the constant-amplitude cycles and from 3058 to 3231 s in the tiered cycles. A large number of AE events occurred after the rock entering the inelastic stage, but in the short period before the peak stress, the AE events were almost zero. After the quiet period, the rock entered the peak stress state, the AE events increased sharply, and the rock broke. This suggests that once there is a quiet period of AE events, the rock will soon fail. The duration of this period was much longer for tiered cycling than for constant-amplitude cycling. We called this phenomenon the quiet period of AE events and it can be used as a precursor criterion for rock failure. AE events occurred only when the maximum stress value in next cyclic was greater than that of the previous one. This was the reason that AE events reduced after some time of cycling at the same amplitude.
The variations of stress, strain, and AE events under constant-amplitude and tiered cyclic loading and unloading are shown in Figure 8. AE events were mainly concentrated in the cyclic loading stage. The number of AE events in the elastic phase under tiered-cycling was much greater than that of constant-amplitude cyclic loading and unloading. This indicates that the original microfractures of the sandstone tested under tiered cycling exceeded those of the constant-amplitude cycling. In the inelastic stage, the number of AE events before cycling was significantly less than during the cycle. The number of AE events in a cycle stage accounted for 89% of all events. During the damage stage, these accounted for only 3.2% under constant-amplitude but 6.1% under tiered cycling. This indicates that the rock damage mainly occurred during the stages of cyclic loading and unloading.
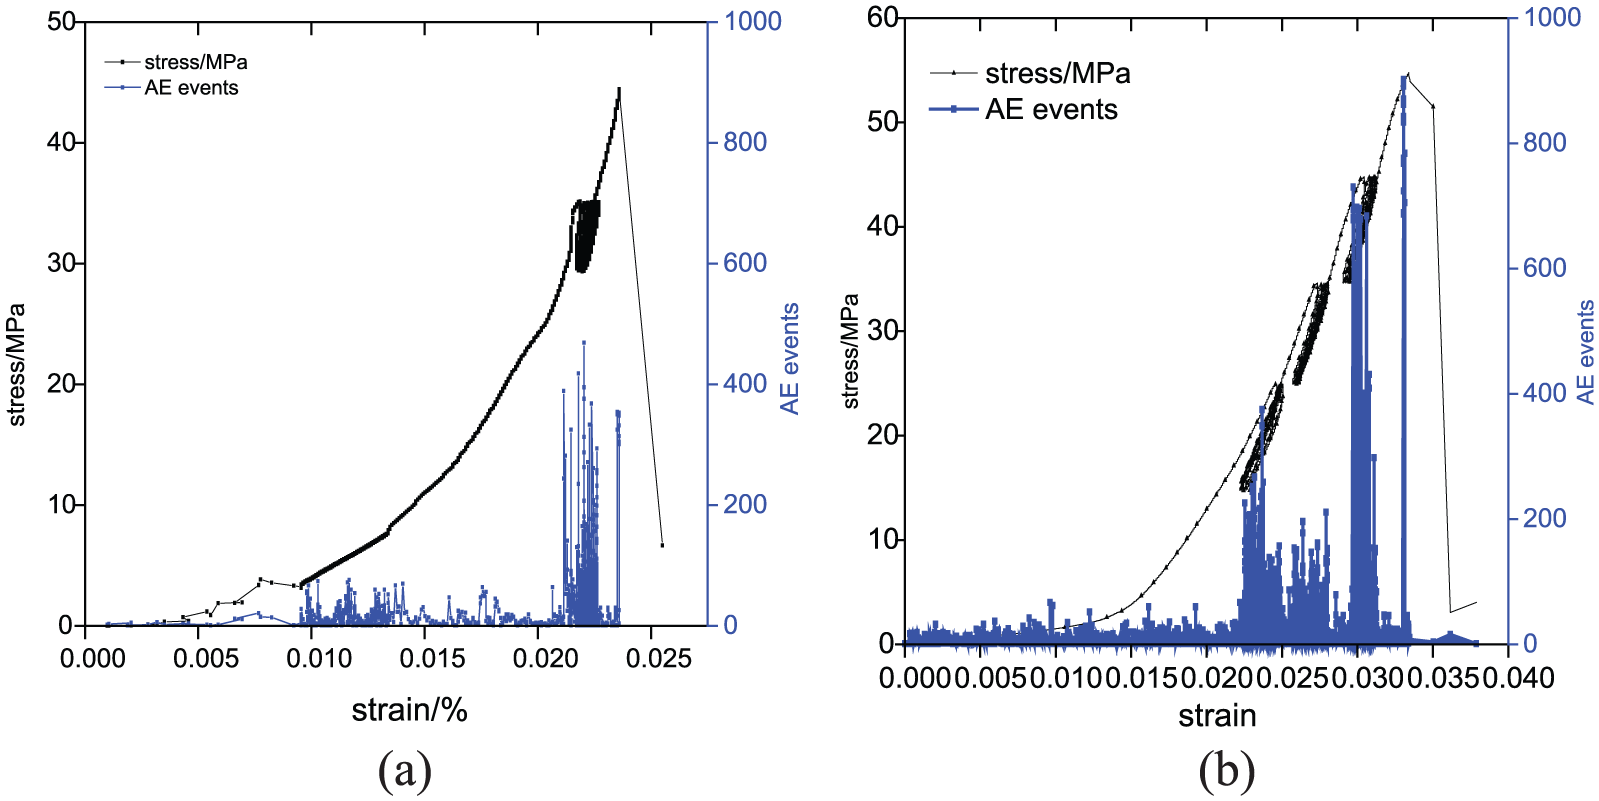
Relationships between sandstone stress, acoustic-emission events, and strain under (a) constant-amplitude and (b) tiered cyclic loading and unloading.
Discussion
Damage variable
Under the action of an external force (including load, temperature, and radiation), a large number of micro-defects can be produced by the internal rock deformation. These lead to rock degradation and failure after having experienced nucleation, expansion, and connection. In essence, these micro-defects are discrete. An approximation to simplify the calculation treats the micro-defects continuously and the damage variable D is used to represent the degree of degradation. According to the experimental data, there is good correspondence between the curves of AE count with time and stress–strain curves of the rock. The number of AE events increased at the stage of cyclic loading. AE events can therefore reflect changes in the extent of rock damage. The relationship between D and the number of AE events can be expressed as Ji et al. 34

where
The damage variables of sandstone under constant-amplitude and tiered cyclic loading and unloading were calculated using equation (3). The relationships between D and the stress–strain curves are shown in Figure 9. The fitting equation has general applicability to the same rock under the same engineering condition. However, the fitting equations are different for rocks from different engineering area or in different loading conditions. It presents an analytical method of monitoring data, which has wider applicability than fitting formula. The relationship between strain and damage variable can be fitted by this analytical method for rocks at different engineering sites and under different loading conditions.
Relationships between sandstone stress, damage variable, and strain under (a) constant-amplitude and (b) tiered cyclic loading and unloading.
According to Figure 9(a) and (b), the damage evolution process of sandstone can be divided into three stages: (1) the compaction and elastic stage (OA), in which the strain increases slightly, there were only a few AE events, and D < 0.1; (2) the inelastic stage (AB), in which D increases to 0.96 and the strain appears to partially rebound, which indicates that damage to the rock was irreversible; and (3) the post-peak stage (BC), in which D is almost equilibrated. This indicates that fracture failure of rock is a macroscopic presentation based on the accumulation of early damage.
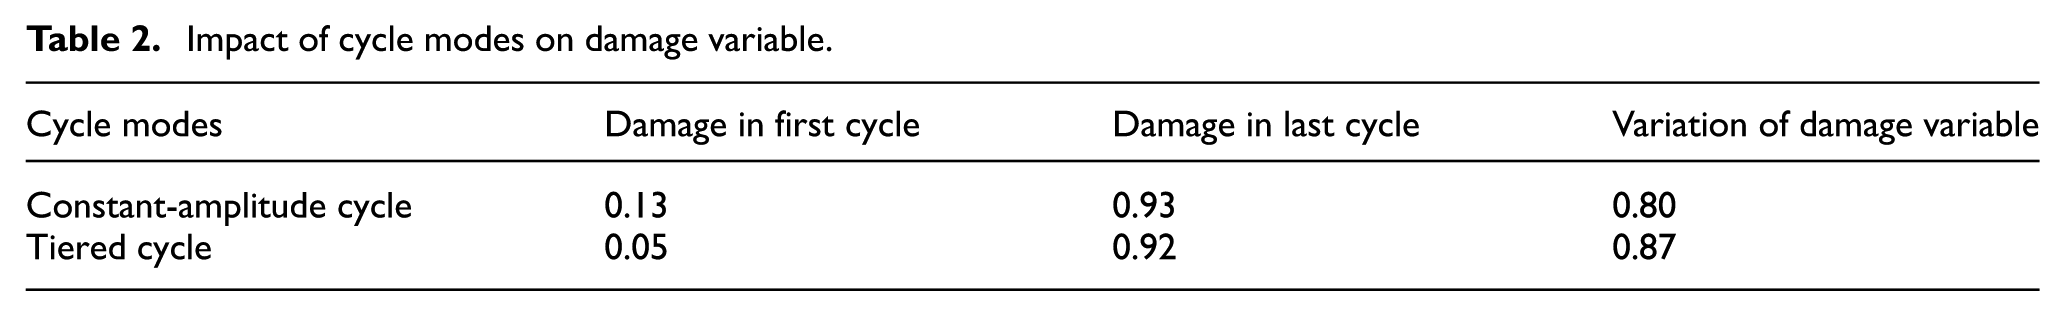
The effects of the two cycle modes on the rock damage variable are presented in Table 2. The damage mainly occurred in the cycle stage and was 7% higher under the tiered cycle than the constant-amplitude cycle. The reason was that the rock cannot recover from loading damage during unloading, which aggravates damage, and tiered cyclic loading causes greater damage to the rock.
Impact of cycle modes on damage variable.
The variation of D can be expressed by the variation in strain. A regression-fitting method was used to establish an empirical equation for the damage evolution of sandstone under constant-amplitude and tiered cyclic loading and unloading. The three damage stages described above present linear, analogous parabolic, and linear relations for constant-amplitude cycles, respectively. Polynomial fitting was used for the cycle stages such that

where
The development trend of D for the tiered cycle stages differs and the fitting function is presented as a typical lognormal distribution curve. The damage variable can then be expressed as

where
Comparisons between the experimental values and fitting by equations (4) and (5) are shown in Figure 10 for constant-amplitude and tiered cyclic loading and unloading, respectively. The correlation coefficients exceed 0.95, indicating that these two equations are able to well depict the evolution of the respective damage variables. The relationship between strain and damage variable can be fitted by this analytical method for rocks at different engineering sites and under different loading conditions.
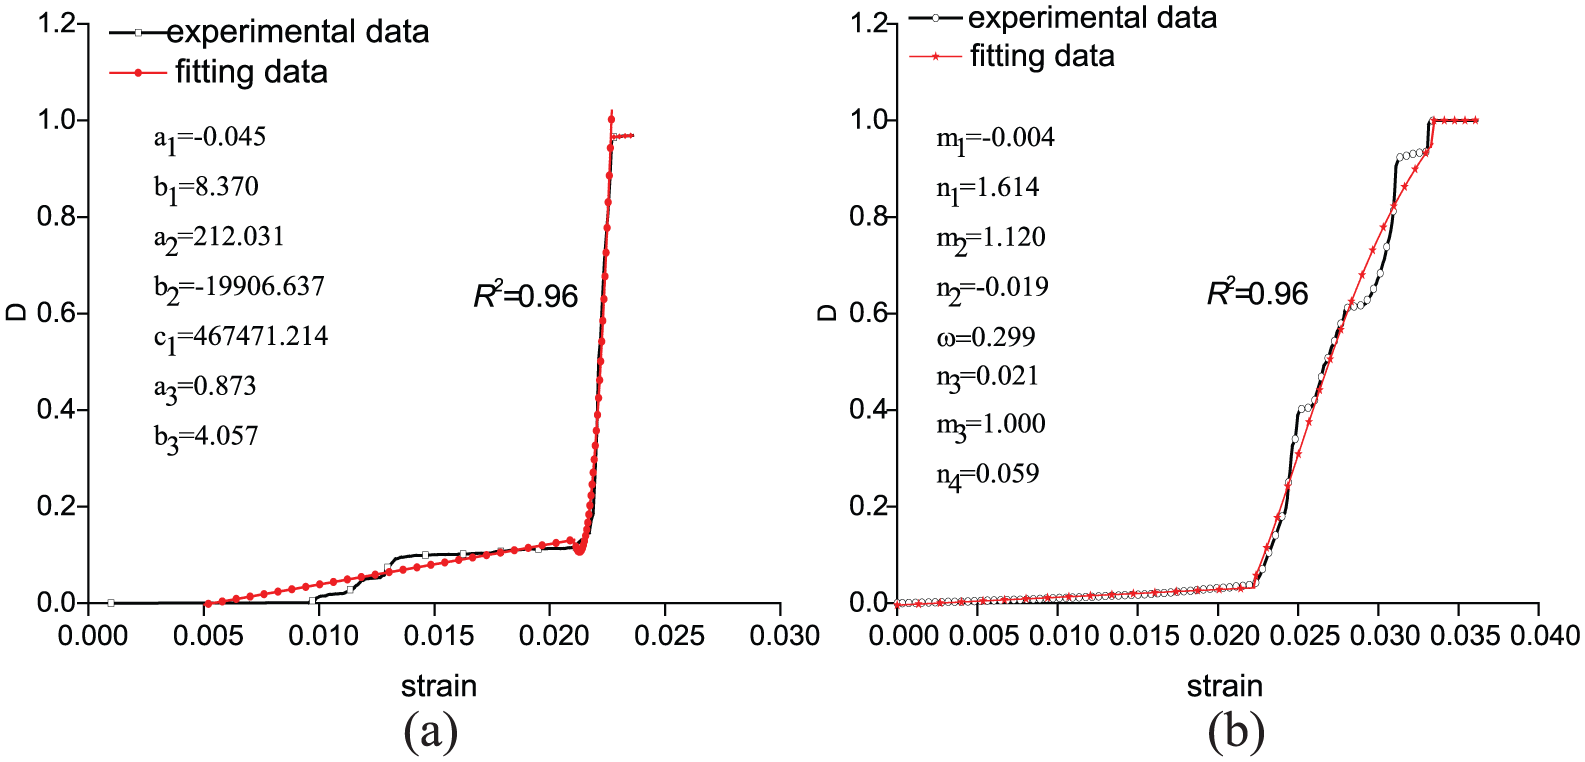
Comparison of test and fitted data under (a) constant-amplitude and (b) tiered cyclic loading and unloading.
Fractal dimensions
Rock damage and degradation processes progress from small-scale micro-damage to large-scale cracking and fracturing conforms to fractal characteristics. 35 The location of AE events constitutes the spatial distribution of a point set, and each of these points represents a new crack on the surface or within. In this way, the fractal dimension of a rock damage process under loading can be measured from the point set distribution.
Taking the centroid of standard rock samples as the central point (X) of the above distribution and drawing a cylinder with the same height as the sample and radius of


Statistical method graph.
The fractal dimension of the distribution is determined by the correlation index. If there is a set of distribution points

where

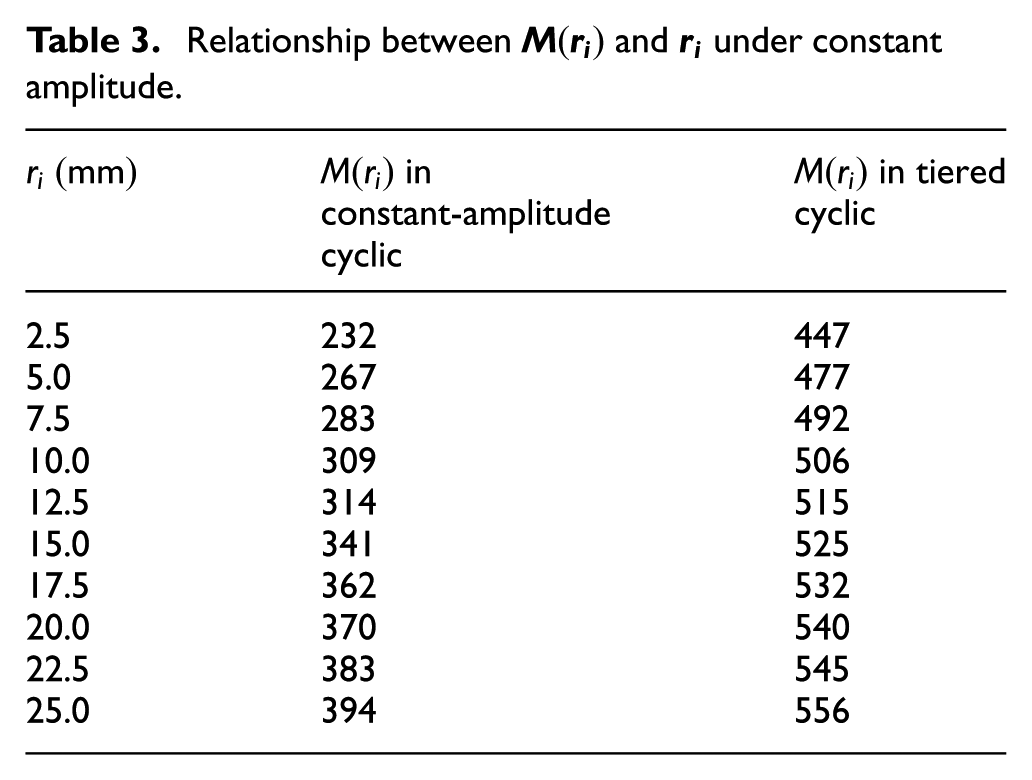
By summing the AE points contained in the cylinder base for different radii, a set of data about
The curves of
Relationship between
The
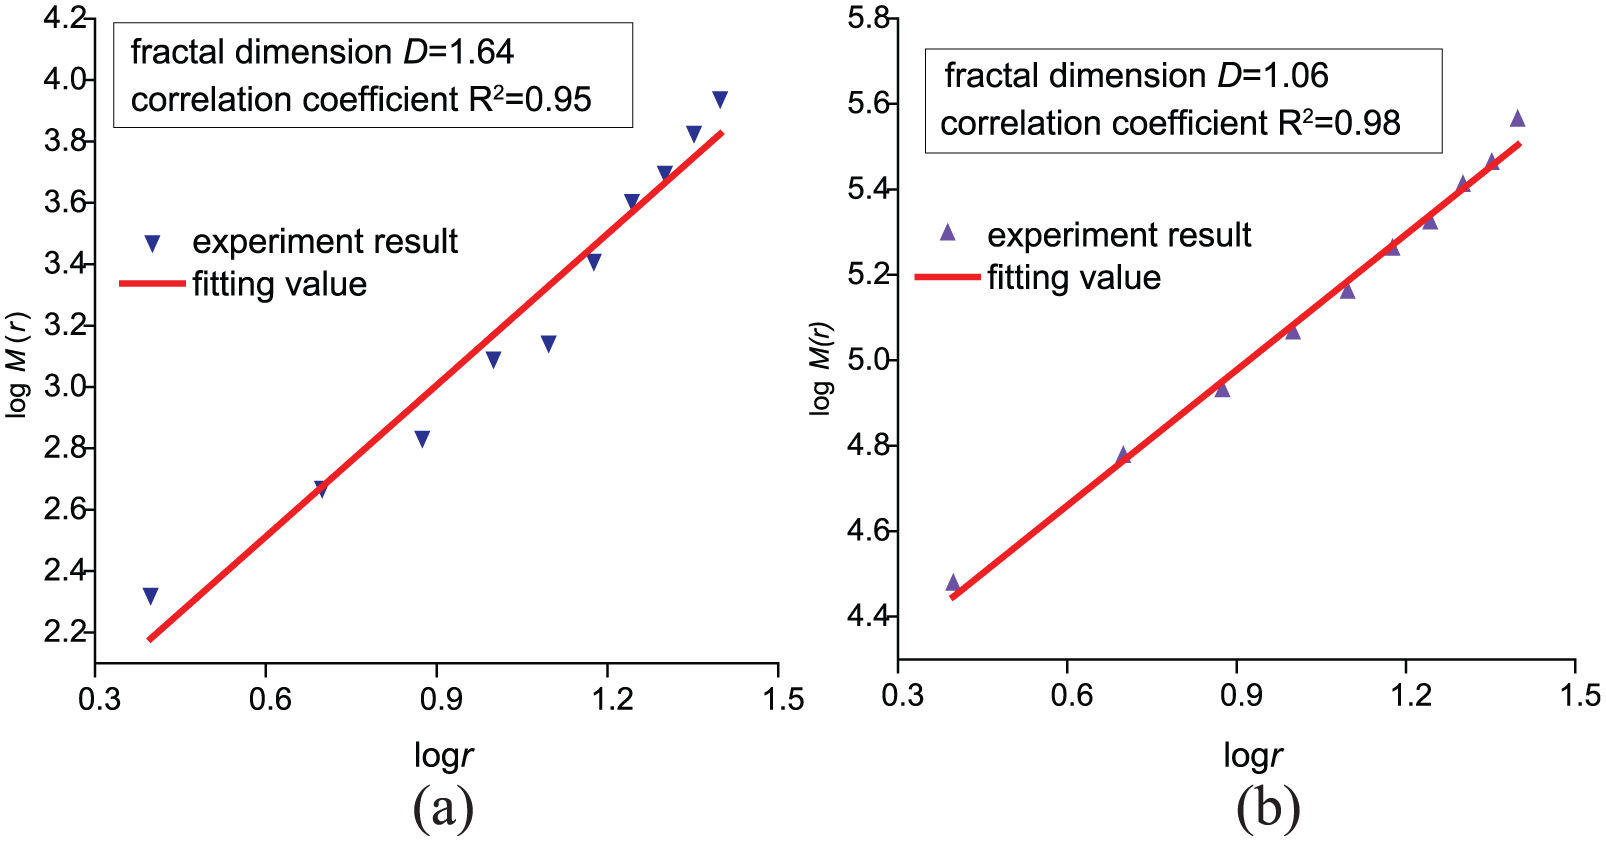
Plots of
The statistical evolution trends of these microcracks are well reflected using the AE fractal dimension and can measure disordered microcracks in rock. To more clearly demonstrate the damage and crack development of sandstone under cyclic loading and unloading, the fractal dimensions for the different cycles were calculated in the same way. The
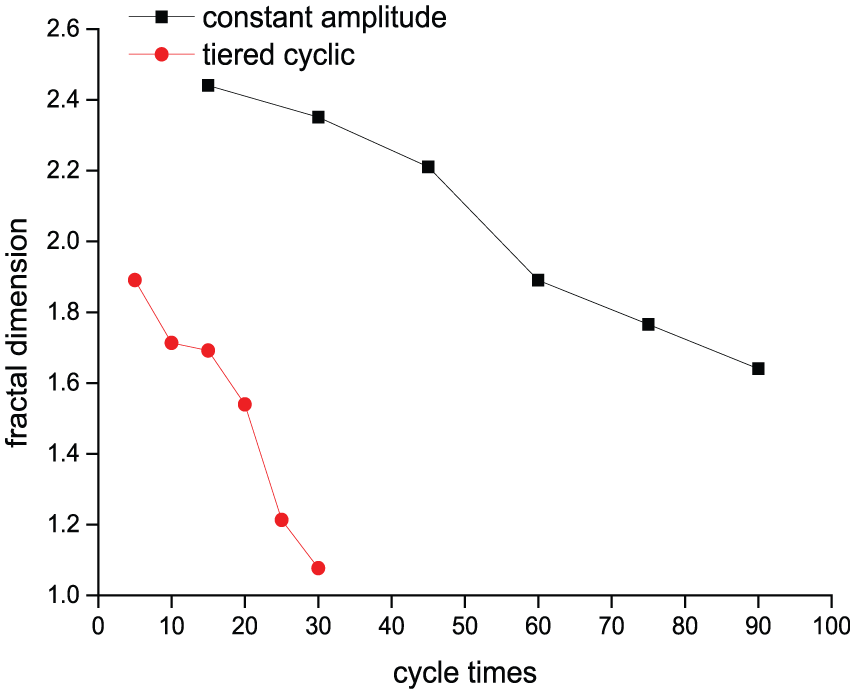
Variation of fractal dimension D over different cycles.
Figure 12 shows that the fractal dimensions of the sandstone under the two cyclic modes have downward trends. In the initial stages of loading, the AE fractal dimensions under constant-amplitude and tiered cyclic loading and unloading are larger and the initial decline speeds are slow. This is because small-scale microcracks are dominant when the stress is small and the rock is relatively stable. The rates of decline of the fractal dimensions notably increase with increasing number of loading cycles. This rise in the proportion of large AE events meant that large-scale fracture within the specimen is dominant. With increasing number of loading cycles, the fractal dimensions decrease rapidly under both cyclic modes to minimum values before rock failure. This indicates that small previously formed cracks expanded and formed penetrating cracks, which caused macroscopic fracture failure. The change of fractal dimension reflected the variety of rock damage. With the increase in cyclic loading cycles, the damage accumulation of rocks increased. The rock damage had a greater growth when crossing the level of loading, and the rate of damage increased. Therefore, the decrease rate of fractal dimension was obviously higher than that in the same loading level. The rock failure process under cyclic loading presents a trend of descending fractal dimension as an ordered trend in dimensionality reduction. This can be used as a precursor indicator to the failure of a rock mass and to monitor the stability of rock mass in underground engineering structures.
Spatial evolution
The spatial distribution evolution of AE points in sandstone under constant-amplitude and tiered cyclic loading and unloading is shown in Figure 14. The number of AE points increases significantly with increasing number of cycles, indicating that the internal damage to the rock was enlarged and new cracks were produced. When crossing the cycle grade, the increase in AE points under tiered cycling is much greater than that of constant-amplitude cycling, which verifies that tiered cyclic loading and unloading aggravates sandstone damage.

Acoustic-emission locations of sandstone at different stages of (a) constant-amplitude and (b) tiered cyclic loading and unloading.
To more clearly see the AE points of the main rupture positions in the two modes, the AE location data were processed using axial and radial projections and by obtaining the foci of the AE points, as shown in Figure 15.

Locations of acoustic emissions in sandstone under (a) constant-amplitude and (b) tiered cyclic loading and unloading.
Figure 14 shows that the number of sandstone AE points under tiered cycling clearly exceeds those of constant-amplitude cyclic loading and unloading. The radial projection in Figure 15 shows that the main loud AE events in the two modes are concentrated on the axis of the cylinder. The axial projection shows that the main loud AE events present a V distribution in the bottom circle, which leads to a greater number of loud AE events in a tangential plane through the axis of a rock compared with other directions. The main fracture mode was therefore by splitting along the loading direction. A photograph of a rock failure after loading is shown in Figure 16. The sandstone shows near splitting failure under constant-amplitude cyclic loading and unloading, as shown in Figure 16(a). The fracture line of the AE orientation point is essentially the same as the splitting interface of the specimen. However, the sandstone shows a V-shaped shear failure under tiered cyclic loading and unloading, as shown in Figure 16(b). From the upper surface of the rock, it can be seen that the line of fracture and the line of AE orientation point are also similar. AE location points can well reflect crack propagation and be applied to non-destructive testing of crack development in geotechnical engineering.
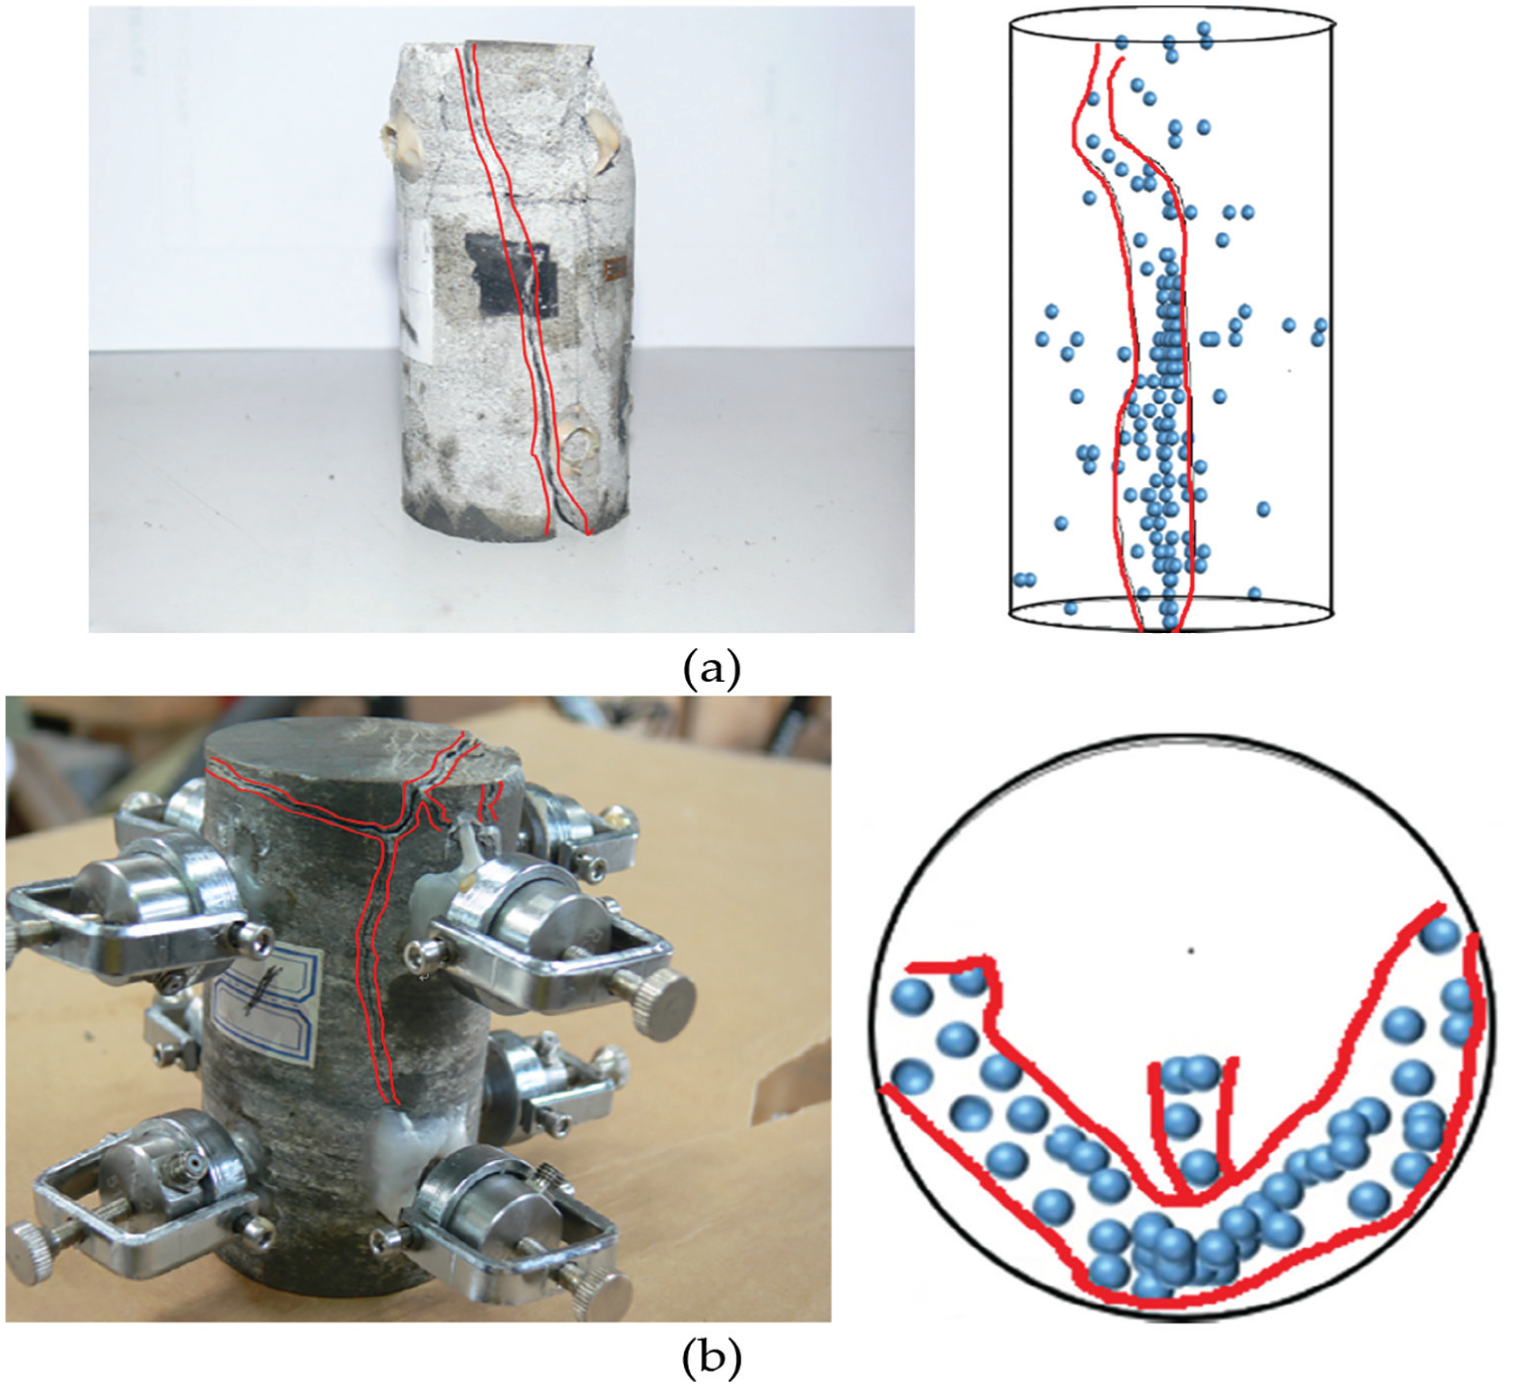
Photograph of broken rock with acoustic-emission locations: (a) constant-amplitude and (b) tiered cyclic loading and unloading.
Conclusion
We studied the damage evolution of sandstone by uniaxial compression under constant-amplitude and tiered cyclic loading and unloading. The following conclusions were drawn:
The AE event curves under constant-amplitude and tiered cycling at high pressure are similar to the loading and unloading curves. The observed Kaiser effect is more significant in tiered cyclic loading and unloading.
The cycling stages account for 89% of all AE events, and relatively quiet periods occurred immediately prior to destruction. This phenomenon can be used as a precursor criterion for rock failure.
The damage variable was calculated from the number of AE events. The damage evolution equation, expressed by strain under cyclic loading and unloading, was obtained by fitting the experimental data.
The damage variable of sandstone increased to 0.8 in constant-amplitude cycling and to 0.87 in tiered cycling. Damage mainly occurred during the cycling stages and was greater for tiered cycling.
The damage and failure process of rock conforms to fractal laws. This process presents a trend of decreasing fractal dimension. The fractal dimensions in constant-amplitude cycling were larger than those of tiered cycling and the rate of reduction of the fractal dimension was greater for tiered cycling. The cumulative velocity of rock damage under tiered cycling was greater than that of constant-amplitude cycling.
These results can provide early warning for monitoring of rock damage and fracture caused by periodic roof pressure changes in collieries.
Distributed sensor technology plays an important role in rock mechanics experiments. It also provides the methodological basis for field monitoring and prediction. The application of sensor technology in engineering will ultimately become more extensive to address the demand for sensor precision, size, and field conditions.
Footnotes
Handling Editor: Ying Zhang
Declaration of conflicting interests
The author(s) declared no potential conflicts of interest with respect to the research, authorship, and/or publication of this article.
Funding
The author(s) disclosed receipt of the following financial support for the research, authorship, and/or publication of this article: This work was financially supported by the Fundamental Research Funds for the Central Universities (2017CXNL01).