
Abstract
Realistic failure process analysis, a thermal software simulation, was used to explore the scale effect of thermal cracking of rock under the thermal–mechanical coupling loading. The patterns and characteristics of thermal destruction were analyzed by simulating the thermal cracking of rocks with the same diameter different lengths, the same length but different diameters, and the same size ratio but different sizes (same length/diameter ratio but with different diameters). The acoustic emission and energy changes were also studied during thermal destruction. The results represented that the main forms of thermal cracking are tensile failure and shear failure. The smaller the scale is (length, diameter, and size), the more complex the pattern of thermal damage exhibited as failure patterns of inverted “S” or “V.” With the increasing scale, thermal damage models were simpler. The elastic modulus was determined by the diameter of specimens, and the peak stress was determined by the length of specimens. Overall, as the scale increased, the stress intensity decreased, but the number of acoustic emissions and acoustic emission energy and the corresponding accumulation increased.
Keywords
Introduction
Rock is a heterogeneous geometrical loading made of various minerals, voids, fractures, and moisture. When a rock is decided by thermal load, thermal cracking may occur for different thermal expansion coefficients of various minerals, uneven temperature distribution and external mechanics forming thermal–mechanical coupling effect that makes stress concentration. 1 Then, thermal damage or thermal cracking might occur in rock or coal. Thermal cracking of rock determines the engineering of developing depth mining, 2 coalbed methane, 3 geothermal energy, 4 and radioactive waste deeply 5 as well as CO2 storage underground. 6 Meanwhile, substantial related disasters such as coalfield fires, rock bursts, and failures occur. Therefore, the properties of rock material and its failure characteristics under thermal–mechanical coupling are the linchpin to solving and controlling the problems.
A series of experiments were performed to determine the mechanical parameters of rock at various temperatures. The effects of rock styles (granite,7,8 sandstone, and mudstone), minerals,9,10 heating rate, and thermal expansion coefficient 11 on the thermal cracking have been studied widely. The thermal cracking of coal12,13 also has been researched. The results indicate that the expansion of different minerals at the grain boundary induced strain and then inter-granular cracking. 7 However, physical experiments cannot reveal thermal stress and temperature moving inside rock, and many physical experiments are expensive and time-consuming. Thus, numerical methods have been widely used to simulate thermal cracking of rock and cement, which can perfectly reflect the propagation of fracture, displacement, and elastic modulus. 14 The results provide data and theory for thermal cracking research. Giannopoulos and Anifantis 15 used an iterative-incremental procedure to probe frictional crack surface interference caused by stationary and transient thermal loading. The results revealed that the friction conditions existing among crack faces determine the peak values of thermal stress intensity. Walsh and Lomov 16 conducted explicit simulations of thermal spallation at the grain-scale using a numerical modeling tool. In addition, the Eulerian–Godunov model was used to study properties, including mineral volume fractions under thermal loading.
The failure process of rocks is affected by the scale that is believed by many researchers.17–19 In this study, size effect and shape effect are two aspects of the so-called scale effects. The shape effect includes the specimens with the conditions of same diameter but different lengths and same length but different diameters. The elastic modulus, unconfined compressive strength, and other mechanic parameters are studied of rock failure with different scales under mechanics.20,21 The propagation of thermal cracking is also affected by the grain size in the rock materials. 22 As well as, the failure pattern and the unconfined strength are impacted on the same diameter and different lengths of marble specimens conducted the uniaxial compression tests. 23
Current studies have focused on the temperature threshold, thermal stress, and crack propagation of rocks under thermal–mechanical coupling.16,24,25 However, there is little available data about thermal cracking when rocks with different scales are subjected to the action of thermal–mechanical coupling. Our aim was to study the destruction modes, characteristics of acoustic emission (AE) of rocks with different scales under thermal–mechanical coupling. Realistic failure process analysis (RFPA)14,24 software was used to simulate thermal cracking. Parameters and characteristics of thermal cracking were received from the simulation in laboratory to provide basic data for the thermal destruction of rock samples. Moreover, the properties and failure characteristics of rocks could be available in numerous different fields, such as controlling coalfield fires, rock and cement burst, and geothermal energy.
Numerical method and parameters
Simulation model
A numerical model was established based on the combination of thermal stress and RFPA-thermal 2D. Rock failure process has been widely studied using RFPA code, and its fundamental principles have thoroughly been represented in the literature.26–28 The applied equations represent the model of thermal cracking: First, the temperature field in the model was calculated according to the temperature condition and then the stress field was solved according to the mechanical conditions and the corresponding damage treatment was performed. Each unit satisfies the following heat transfer equation, the mechanical deformation and damage equation.25,29 Also, the principle failure of element code is according to the mesostructure damage mechanics-based constitutive law (elastic–brittle–plastic). 25 Weibull distribution function is used to depict the heterogeneity (m) of the rock

where
Each unit satisfies the heat conduction equation and the stress field equations. In general, thermal coupling equations can be described as follows:25,30
Heat transfer equation


where kx, ky, and kz are the thermal conductivity in the directions of X, Y, and Z, respectively; Q is the source term; T is the temperature; c is the specific heat;

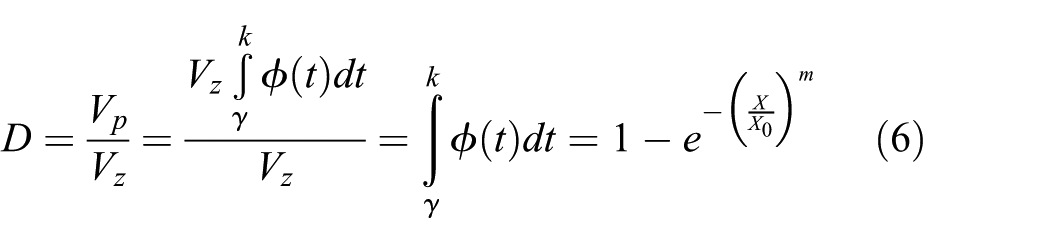
The damage variable D can be defined as
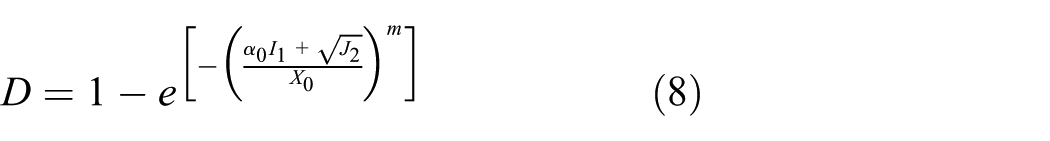
The Drucker–Prager strength criterion is introduced so that the rock micro-element strength satisfies the damage basis

where
Weibull parameters of rock under different temperatures are expressed as follows


where

Here is a threshold point for the damage evolution of the rock material. When the stress does not reach the threshold point, the damage inside the rock can be approximated, and the damage value of the material is equal to zero. When the stress is greater than the threshold, the rock damage value can be calculated by equation (8). Thus, the damage evolution equation of the rock material is obtained

The elastic modulus of the rock material changes markedly with the temperature, so the elastic modulus can be defined as the rock thermal damage variable. The room temperature is set at 25°C. When the damage is 0, the thermal damage variable is shown as below

where

Experimental program and parameters
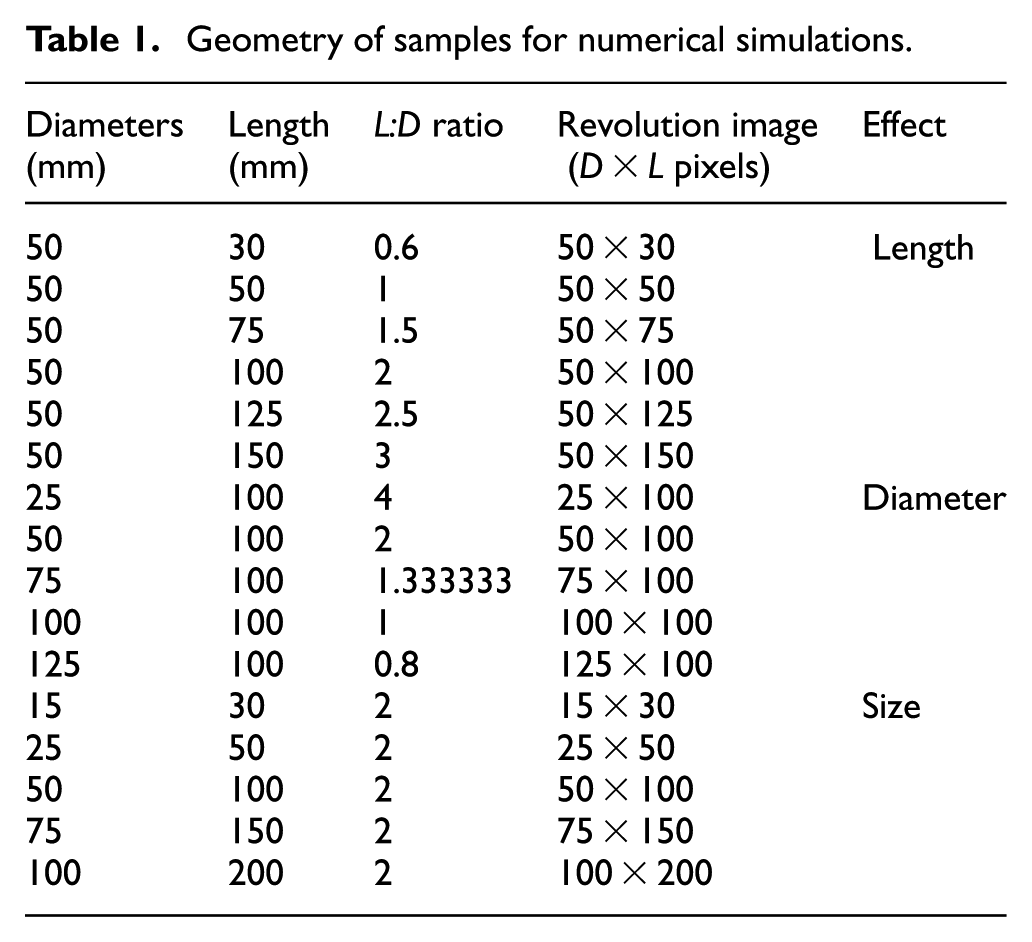
The experimental program was designed to study the scale effects on thermal cracking as shown in Table 1 and Figure 1, and the physical parameters conducted in the simulation are represented in Table 2. The values of parameters and homogeneity were chosen according to the literature.31,32 The heterogeneity of the rocks was taken into account in the study by varying the homogeneity index; m = 3, 100, and 1000 was chosen to simulate relatively homogeneous and relatively heterogeneous rocks, respectively. Although the physical tests of rock materials can provide important reference for the design and determination of mechanical parameters in numerical analysis, numerical tests of rock materials can reproduce and deepen the understanding of physical test phenomena, especially the microscopic fracture process of rocks. In view of this, the RFPA-thermal 2D system was used to conduct numerical experiments on rock samples of different sizes to profoundly reveal and understand the law of thermal crack propagation and evolution. In addition, the scale changes in accordance with the length, diameter, and size of rocks. The samples were set by being limited against vertical displacements at the bottom end and prescribed uniform vertical displacements at the top. Furthermore, to prevent from rigid body motion, the middle node was fixed against horizontal displacement. The loading rate of external displacement was retained at 0.002 mm/step in the axial direction, which is the same as the displacement control in the experimental test. Initial temperature of specimen and left and right boundaries are 20°C. Moreover, the increment of the sample’s temperature was equal to 5°C/step, which was heated with free thermal boundary conditions. When the special temperature reached 200°C, at which the thermal cracking was obvious, 14 the external displacement loading started.
Geometry of samples for numerical simulations.

Flow diagram of numerical experiment.
Parameters of model.

Results and discussion
Effects of specimen length on thermal cracking
Failure modes of specimen with different lengths
The simulated failure process of a sample is presented to illustrate the effect of length under the thermal–mechanical coupling. The final failure patterns of the samples with the same diameter but different lengths are presented in Figure 2, which also presents the distribution of elastic modulus and AE. For the elastic energy released from the failed element, AE can be used to represent the damage to the elements. The diameter of the circle indicates the massive release of AE energy, and the color represents the style of element failure. Moreover, the damages of tensile and shear are represented by the red and white color, respectively. 26
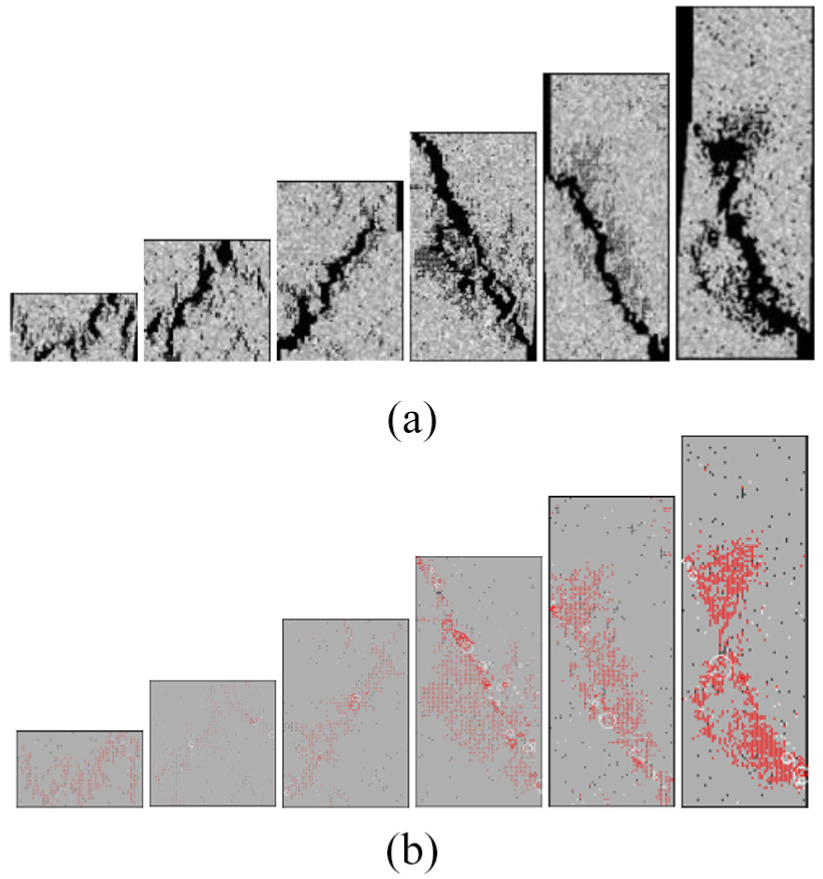
Failure elastic and AE of sample with the same diameter 50 mm, different lengths under thermal–mechanical coupling loading: (a) failure elastic and (b) AE counts.
The experimental results revealed that the failure modes of thermal cracking were mainly shear failures and tensile failures. With the same diameter, 50 mm, the smaller the length was, the more complex the damage pattern was. In addition, the pattern is an inverted “S” shape (length equals 30 and 50 mm). As length increased, thermal damages were (length equals 75, 100, 125, and 150 mm, respectively) mainly single cross-section shear failures.
Thermal cracking characteristics of specimen with different lengths
With increasing temperature, there was approximately 10% element damage of the specimen before the temperature threshold (damage threshold). 33 The damaged elements were due to thermal stress and stress of thermal–mechanical coupling. 14 The stress in this study was introduced by the action of thermal–mechanical coupling, caused by the expansion of specimen under temperature and displacement conditions. The stress also represents the tensile and compressive strength of the specimen when it subjected to thermal–mechanical coupling. The variations of stress can be divided into the stages: linear damage, nonlinear destruction, and stable crack stage. AE count and AE energy are shown in Figure 3.

Stress (a), AE (b), and AE energy (c) of sample with the same diameter but different lengths under thermal–mechanical coupling loading.
First, stress is linear to strain (Figure 3(a)). After that, the stress will be decreased sharply; it is not absolutely lost for, there still is some strength with elements. As the L increased, the value of peak stress and residual stress decreased. There was the same elastic modulus for the specimens with the same diameter and different lengths.
The thermal cracking could be divided to two sections before and after the peak stress. Before the peak stress, there were a few elements damaged that were mainly caused by stress. After the peak stress, there were a large number of elements damaged under the thermal stress and the existing damage elements. AE and AE energy reflected the elastic energy releasing of element during thermal cracking. As the specimen showed at the peak strain, AE and AE energy reached the maximum value. Furthermore, the peak stress decreased as the length increased which the counts and energy of AE were increasing as well as the accumulated AE and AE energy as shown in Figure 3(b) and (c) and Table 3.
Maximum value of AE counts, energy, and peak stress with the same diameter 50 mm and different lengths for specimens.

AE: acoustic emission.
Effects of specimen diameter on thermal cracking
Failure mode of specimen with different diameters
When constant length was 100 mm, the smaller the diameter was, the more simple the damage pattern was in Figure 4. The pattern is mainly shear failure of single section form of diagonal line. With the increase in the diameter, damage pattern will be more complex. The pattern shapes were mainly inverted “V” (diameter equals 75 and 100 mm) and inverted “S” (diameter equals to 125 mm).

Failure elastic and AE of sample with the same length 100 mm but different diameters under thermal–mechanical coupling loading: (a) failure elastic, (b) AE counts, and (c) stress.
Characteristics of thermal cracking in different diameters
Stress, AE counts, and AE energy are shown in Figure 5. The peak stress increased for the diameter increasing with the same length. From the stress–strain curves, specimens with larger diameter had smaller elasticity modulus.

Stress (a), AE (b), and AE energy (c) of sample with the same length but different diameters under thermal–mechanical coupling loading. The unit is mm for diameter and length.
At the peak strain, AE and AE energy reached the maximum value. In addition, the peak stress decreased as the diameter increased, which the counts and energy of AE were increasing as well as the accumulated AE and AE energy, as shown in Figure 5(b) and (c), and Table 4.
Maximum value of AE counts, energy, and peak stress with the same length 100 mm and different diameters for specimens.
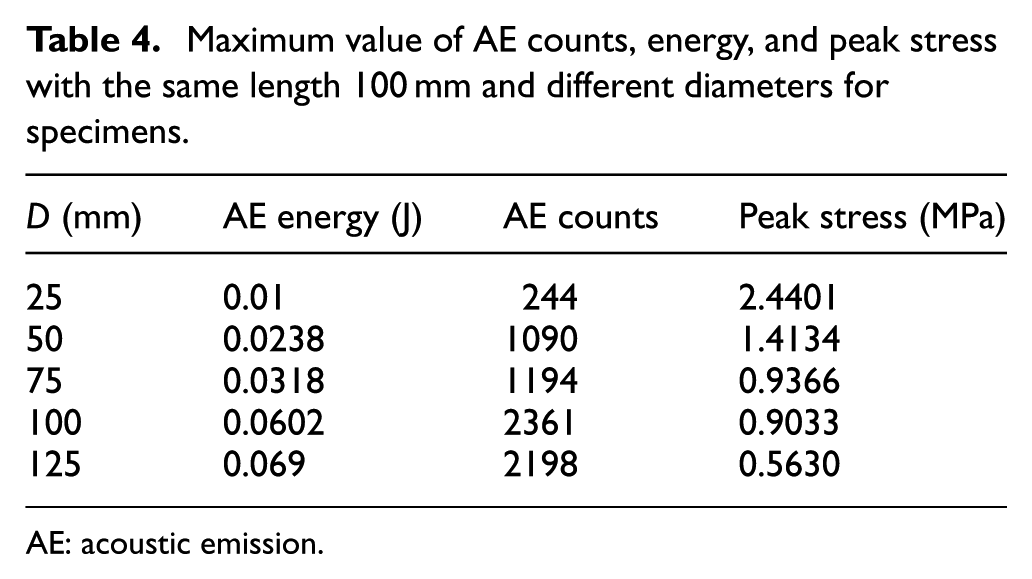
AE: acoustic emission.
Effects of size on thermal cracking
Thermal destruction mode varies sizes
The failure elastic, AE counts, and stress with different sizes under thermal–mechanical coupling loading are shown in Figure 6. The results show that the failure patterns of thermal damage were mainly tensile failure and shear failure. When the size was relatively smaller, the failure pattern was more complex. The fractures propagated along the diagonal line of the specimen as the size increased.
Failure elastic and AE of samples with the length/diameter ratio 1:2 and different sizes under thermal–mechanical coupling loading: (a) failure elastic, (b) AE counts, and (c) stress.
Thermal properties of different sizes
Stress increased at first and then decreased overall, and some of the curves show “M” shape in Figure 7(a). As the size increases, peak stress lessens and the elastic modulus of the specimen dwindles (Table 5).

Stress (a), AE counts (b), and AE energy (c) of sample with the same ratio (length/diameter is identically equals to 2) and different sizes under thermal–mechanical coupling loading. The unit is mm for diameter and length. (d) Peak thermal stress, AE, and AE energy of all samples change with the volume (1/3).
Fitting relationship of peak thermal stress, AE, and AE energy of all samples change with the volume (1/3).

AE: acoustic emission.
At the peak strain, AE and AE energy reach the maximum value. Furthermore, the peak stress is decreased as the size increased (Figure 7(b) and (c)), that the counts and energy of AE were increasing as well as the accumulated AE and AE energy, as illustrated in Figure 8(b)–(d). The peak stress decreases as the volume increases, reaching an approximate constant when the volume is large enough.

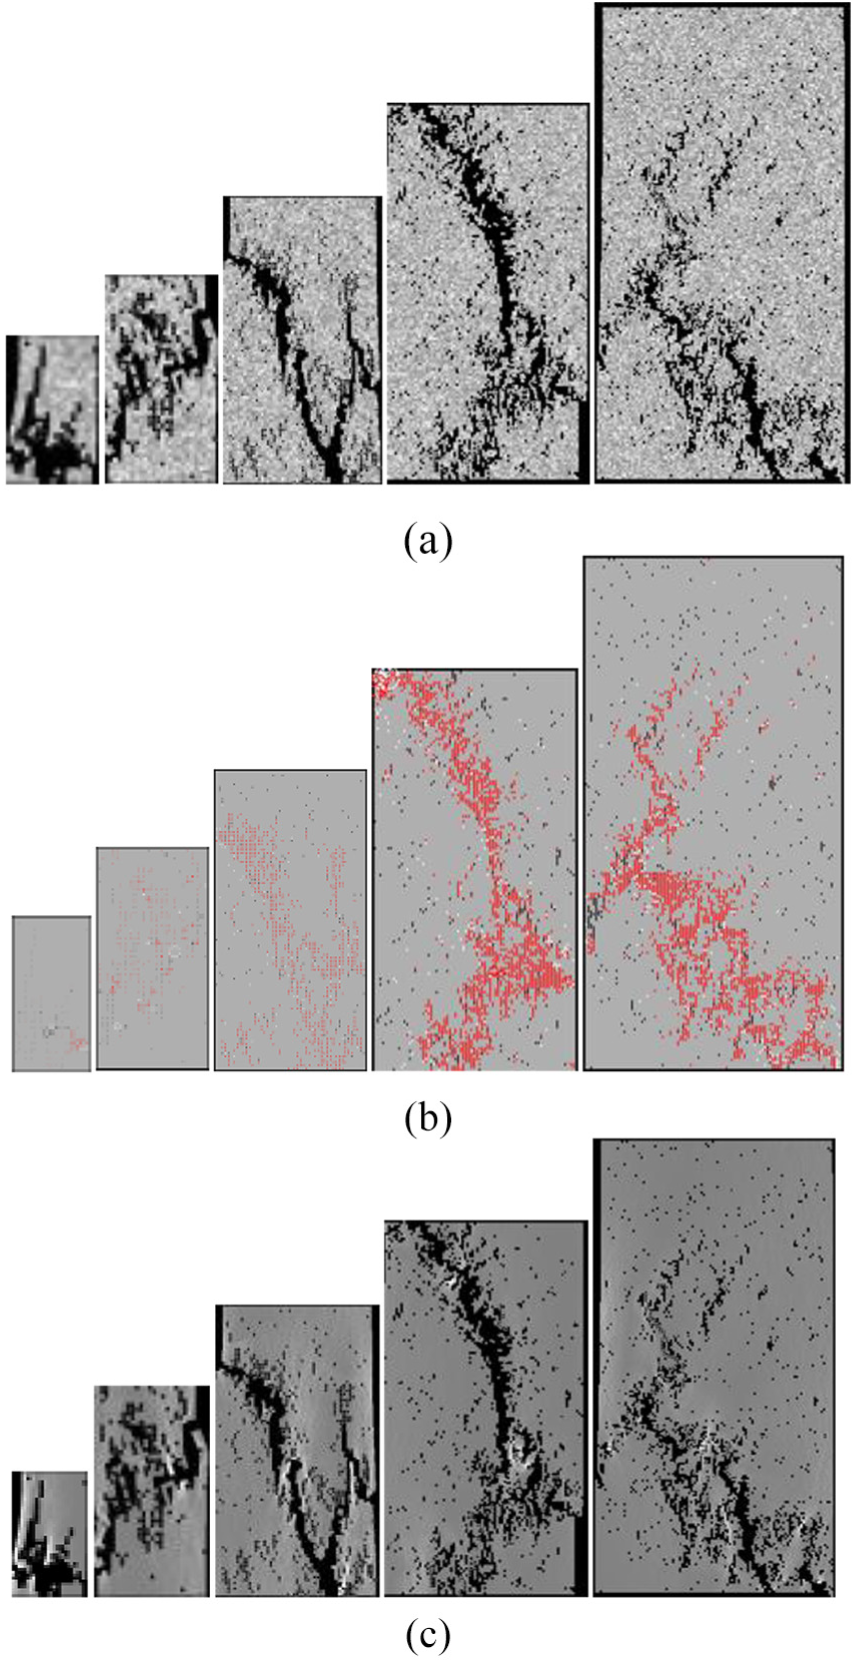
Failure mode comparison among (a) experimental result captured using micro-CT, 34 (b) experimental result conducted by Zhao et al., 35 and (c) simulated results. The samples from left to right are diameter is 7 mm and length is 10 mm; diameter is 200 mm and length is 400 mm; and diameter is 50 mm and length is 100 mm.
Effects of scale on thermal cracking
The results revealed that scale has a significant impact on the thermal cracking of the specimen in this article, comparing Figures 2, 4, 6, and 8. When diameter equals 50 mm, the specimens with smaller length have more complex failure patterns, but when length equals 100 mm, the specimens with bigger diameter represent more complex failure modes. What is more, the specimens with smaller size (length/diameter equal to 2) represent more complex patterns under thermal–mechanical coupling loading. However, the pattern of thermal cracking is simpler in Figures 2, 4, and 6. That is, the failure pattern is mainly determined by scale. In addition, the entire failure specimens are through a boundary of thermal–mechanical coupling because thermal cracking starts from grain boundaries, 36 which are the interfaces of thermal–mechanical coupling. Figure 8 shows the contrast of the failure modes obtained numerically and experimentally applied micro-computed tomography (CT) 34 and triaxial compression system. 35 The comparison indicates that the simulated thermal crack is consistent with the results of experimental tests, and the ability of simulating the model in thermal cracking is further verified. Meanwhile, the specimen seriously generates thermal cracking at the peak strain. Then, the stress is decreased sharply but is not absolutely lost for, there still is some strength with the elements. The reason is that the damage mechanics constitutive law is used in the simulation. Initially, the element is considered elastic, that is, linear until reaching the damage threshold, and then is modified by softening. That is, the elastic–brittle–plastic constitutive models make that occur.29,37 Peak stress, AE, and AE energy are essentially reciprocal relationships indicating that stress determines the development of thermal damage. Moreover, the stress of larger specimens is smaller than that of smaller specimens. In addition, with increasing size, AE counts and energy as well as the accumulated AE counts and energy are increasing. As the specimen scale increases, its thermal destruction units increase, 9 and it will cause released elastic energy to increase.
Conclusion
We used the RFPA-thermal that can simulate heterogeneous brittle materials to model the failure of specimens with different scales under thermal–mechanical coupling loading. From the simulation results, the elastic–brittle–plastic model for element can availably simulate the pivotal properties of rock failure under thermal–mechanical coupling loading. After the shape and size effects on rock failure had been studied, we reached the following conclusions:
When diameter was 50 mm, the specimens with smaller length had more complex failure patterns, but when length was 100 mm, the specimens with larger diameter represented more complex failure modes, exhibiting inverted “S” or “V” shape. As the size decreased, the mode of specimen represented simple failure, which mainly includes tensile and shear failures. The peak stress decreased as the scale increased overall. The elastic modulus is determined by diameter. The smaller the diameter was, the greater the changing rate of stress was.
When length was equivalent to 100 mm, as diameter increased, the peak stress and elastic modulus decreased. When constant diameter was tantamount to 50 mm, with length decreasing, the peak stress decreased. The peak stress was determined by the length of specimens.
As scale increased, the counts and energy of AE were increasing as well as the accumulated AE and AE energy for the specimens under thermal–mechanical coupling loading. Furthermore, the specimens with larger scale had larger peak stress.
Footnotes
Appendix 1
Acknowledgements
The authors acknowledge Dr Frank Oreovicz (Retired) at Purdue University (West Lafayette, IN, USA) for his marvelous modification.
Handling Editor: Shun-Peng Zhu
Declaration of conflicting interests
The author(s) declared no potential conflicts of interest with respect to the research, authorship, and/or publication of this article.
Funding
The author(s) disclosed receipt of the following financial support for the research, authorship, and/or publication of this article: This work was supported by the National Natural Science Foundation of China (No. 5170-4226), China Postdoctoral Science Foundation (No. 2016-M590963), and the Industrial Science and Technology Project of Shaanxi Province (No. 2016GY-192).