
Abstract
To ensure the human’s safety in the large pipeline testing laboratory, a dynamic evacuation guide system is designed. Based on the analysis of various indoor position methods, inertial navigation system–aided ultra-wideband system is realized for human positioning. Gas sensors are deployed to monitor the leaking of harmful gases, such as H2S and CO. The gas diffusion area is also estimated dynamically based on the data of sensors. The evacuation route can be updated according to the real-time situation. Based on the positioning and warning method, a system is developed to dynamically plan safe evacuation route for human in different positions. The method and system can improve the safety of chemical laboratory and other environments with potential dangerous.
Keywords
Introduction
Corrosion and erosion are two principal failure modes in industry, especially in petroleum and petrochemical industry. The pipeline failures caused by corrosion and erosion brought many accidents around the world. In November 2013, a pipeline of oil in Qingdao, a Chinese city, exploded and killed 62 people. An oil leak accident occurred in California, USA, in May 2015. It discharged more than 20,000 gallons of oil into the sea and influenced the local environment seriously. The eroded pipe’s cracking caused the accident. Besides the hurt for the public and environment, corrosion and the protection measures cost a lot. According to a survey, corrosion costs six cents for every dollar of gross domestic product in the United States. 1
To ensure the safety and save the cost, the mechanism of corrosion and erosion of pipeline should be found out to prevent related equipment from failure. Some organizations and companies have established experiment facilities called multiple phases loop to support the mechanism study, such as Ohio University and Shell Company. Multiple phases means the matter in the loop is in different phases, including solid, liquid, and gas. Solid indicates sand and soil, pump out with the oil. Liquid contains oil and other liquid organic matter. Gas consists of some kinds of gases accompanied with oil and produced by chemical plant. Some of the gases are harmful and dangerous to human, such as H2S, CO, SO2, and NOx.
Different from the chemical plant outside, experimental facilities are usually indoors to easily control the experimental parameters. At the same time, more people stay around the experimental loop for real-time observing and data collecting. Therefore, when there is any leak in the loop, the harmful gas is hard to dissipate in a short time. In heavy concentrations, harmful gases are hazardous to human health. To reduce the hurt by leaked gas, some detecting device has been developed. When a kind of harmful gas reaches a certain concentration in the air, the device will be activated and alert in different ways. The alert can be shining light and special sound for people or digital signal for computer system to activate an automatic alert treating action. With the help of alert warning, people can evacuate from the dangerous laboratory to avoid being hurt. Unfortunately, the evacuation itself is usually not safe. According to the past experiences, about 30% of hurts occurred during the evacuation. The reason for this is that the environment around the evacuation path is not harmless. The leaked gas may diffuse to the space around the path and reach a harmful concentration. Consequently, the importance of evacuation route planning appears.
In fact, evacuation route planning is one of the standards for laboratory building, such as ISO/IEC 17025(2017): general requirements for the competence of testing and calibration laboratories. It specifies the general requirements for the competence, impartiality, and consistent operation of laboratories, including the rules for evacuation route planning and marking. However, the standard seldom involves the real-time changing situation of the laboratory. Although the expert of laboratory design can give some advice of evacuation route planning, the surroundings of evacuation route cannot be absolute safe under the gas leaking situation. Three issues mainly influence the design result. One is that the leaked gas from different positions may produce totally different gas distribution in the space. The second is that the indoor environment of the laboratory, such as air flow, affects the gas diffusion. The third, the most important issue, is that the real-time position of people is not clear enough. Without the exact start point, it is hard to point out the best evacuation route.
To solve the problems, one reasonable strategy is to plan an absolute safe evacuation way according to the real-time situation in the laboratory. This article proposes a dynamic evacuation guide system based on gas sensors and inertial navigation system (INS)-aided ultra-wideband system (UWB) indoor positioning.
The rest of the article is organized as follows. Section “Related works” analyzes the related works of indoor positioning and wireless transmission. Section “Pipeline laboratory environment” describes the situation of the pipeline laboratory for the application. Section “INS-aided UWB positioning method” shows the INS-aided UWB positioning method, which can supply an accurate position. The strategy of map updating and evacuation route planning is presented in section “Initial grid-based map.” Section “Evacuation guide system” gives the details of the system applied in the laboratory. Section “Conclusion and discussion” summarizes the article and provides some prospects for future improvements.
Related works
Dynamic evacuation
Evacuation studies received comprehensive and consistent attention because there are many natural and man-made disasters in the world. The normal purpose of dynamic traffic assignment model is to estimate time-varying traffic network conditions and how the traffic dynamically flows over the network. They are often used to support decision-making for mass evacuation planning. 2 There are mainly two kinds of dynamic traffic assignment models: analytical models and simulation-based models. Analytical models are normally solved by known optimization techniques. This kind of models cannot handle large infrastructure network. Simulation-based models are designed specifically for transportation problems, in which traffic dynamics and link/path travel time are estimated by simulation. Pel et al. 3 review recent research on dynamic traffic simulation models.
Large building like high-rise building is the common object of most research about indoor evacuation. Spatial models of indoor environments are often required for indoor evacuation. 4 Recently, three-dimensional (3D) spatial map for evacuation in high-rise building and time–space map for dynamic evacuation indoor receives attention. In order to realize the 3D spatial query, analysis, and visualization of the 3D spatial structure within buildings, Lee and Kwan 5 used a 3D geometric network model (GNM) to represent the topological relationships among 3D geographical features. For emergency situation, such as fire event, the GNM is not enough because it does not take into account temporal variations, such as smoke moving and gas leaking. In order to supply real-time evacuation route planning, effective routing map for indoor environment becomes a hot topic. Wu and Chen 6 added a temporal variation, smoke movement during different times of a building fire, to GNM. Ant colony optimization is applied to find the shortest path that passes through each room of the area when firefighters have to search an area to find victims. The rescue route suggested does not pass through the heavy smoke areas in the building. A fading memory model was introduced to build dynamic routing map for indoor evacuation. 7 The dynamic mapping of indoor environment is described as a route path where the states of edges were updated according to the age of the knowledge of the edges’ states. The evacuation strategies based on the dynamic map were given as well. Wang et al. 8 put forward a method to convert sensor systems to sensor graphs so that the real-time sensor data can be employed as references for indoor evacuation route planning. Based on the sensor graph, risk aware evacuation routes are calculated dynamically for trapped people.
Indoor positioning technique
In recent years, with the development of the Internet of things, demand of location-aware service increases rapidly. Positioning is the process of determining the position of people, equipment, and other objects. According to the application environment, positioning can be classified into outdoor positioning and indoor positioning. Because signals from satellites become weak in building, the outdoor positioning technologies, like GPS (Global Positioning System), cannot satisfy the requirement for indoor scenarios. Many indoor positioning techniques are developed, such as ZigBee, Wi-Fi (Wireless Fidelity), Bluetooth, RFID (Radio Frequency Identification), and UWB.
ZigBee is developed based on IEEE 802.15.4 standard for medium access control and for wireless transmissions and receptions. It is a low-rate wireless network for short distance communication. ZigBee achieves positioning with the coordination of communications by thousands of tiny sensors. These tiny sensors require very little energy so the communication is very efficient. It provides self-organized, multi-hop, and reliable wireless network with long battery lifetime. 9
Wi-Fi is one of the IEEE standards for WLAN. It corresponds to IEEE 802.11 a/b/g standards. Wi-Fi positioning technology exploits received signal strength (RSS) for positioning. As Wi-Fi networks are widely used in public locations, Wi-Fi positioning is becoming to the hottest indoor localization method. 10 However, Wi-Fi positioning is very sensitive to noise signal and the positioning accuracy is low.
Now a large number of devices have Bluetooth communication functionality. Bluetooth has become a technology available for various applications such as positioning and navigation. Many papers have been published about using Bluetooth for positioning. The most important problem for Bluetooth positioning is the uncertainty of response time from Bluetooth devices. 11
RFID is a non-contact automatic identification technology. Like Bluetooth positioning, RFID positioning systems also utilize proximity detection algorithms to infer the presence of a mobile in a clearly defined area of a building. 12 One disadvantage of RFID positioning technology is that the RF signal is easily influenced by the antenna deployment. Another weakness of RDIF positioning is that it is hard to integrate RFID into other systems. 13
UWB technology makes use of impulse radio with very short pulses. Localization via UWB is a relatively new and promising method with indoor applications, such as industrial, 14 healthcare,15,16 and notion capture. 17 It is reported that the UWB positioning has an accuracy that is in the order of decimeters. 14 UWB can supply high positioning accuracy even in the presence of severe multipath. 18
The indoor positioning technologies are compared from positioning range, accuracy, cost, and networking in Table 1.
Comparison of indoor positioning techniques.

Gas leak detection method
There are several methods to realize the gas leakage detection and location. Since the leaking gas generates an acoustic signal when it escapes through a breach in the pipe, acoustic signal could be used to detect the gas leakage and estimate the size of the leak. 19 To get enough acoustic signals, piezoelectric acoustic emission (AE) sensor array is usually deployed on the surface of the pipe. Noise sensitivity is a weakness of acoustic method because high background or flow noise conditions may mask the actual leak signal. When the pipeline is long, the cost of numerous sensors’ deployment is high. So another disadvantage of acoustic methods is a financial downside. 20
Recent years, robots with sensors are used to find the location of a volatile chemical source. Biological inspiration is applied by this kind of methods. Robots move directly upwind according to the odor signal collected by sensors. Different odor tracking algorithms are put forward for the routing of mobile robots. 21 Mobile robot is relatively expensive. Source location method through odor robot always requires a team working of a group of robots. The cost is also high.
The method to detect and localize gas emitting source using sensor network was first formulated by Nehorai et al. 22 Usually, the wireless sensor networks (WSN) is combined with gas diffusion model to localize the gas source. Different diffusion models had been put forward. 23 The Gaussian plume model is the most popular model to describe the gas dispersion in air. 24 It is also widely adopted for robot odor localization. 21
Pipeline laboratory environment
The pipeline laboratory is located in a house with 80 m length, 24 m width, and average 15 m height. There is an additional higher arc roof to provide the space for the inclining of tested pipe. The inclined pipe can simulate more complex industrial situations. Figure 1 is a photo of the internal scene of the laboratory.
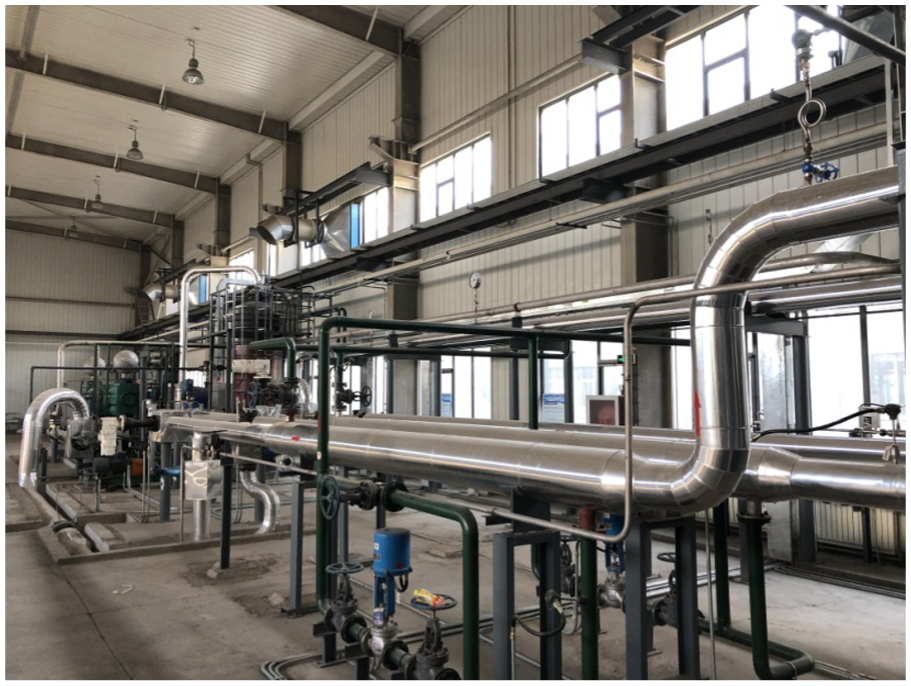
Internal scene of the pipeline laboratory.
A full-size petrochemical pipeline testing facility has been designed and built in the laboratory. Figure 1 shows a part of the facility. The facility is mainly composed of loop, media producer, sensors, and control system. The loop consists of pump, filter, pipe, valve, and flange. The facility contains four testing loops with different diameters, including two testing loops which can be inclinable (0°–90°). An experimental media producer can fill mixed media with multiple phases into the loop at the beginning of test. Detecting sensors are put into the loop and the pipe surface for data monitoring and collecting. A digital control system is developed to accomplish automatic control on the velocity and pressure inside the loop. The highest velocity of experiment section is 20 m/s of liquid and 50 m/s of gas. The maximum pressure can reach to 30 MPa. The testing facility is controlled by specific software. Figure 2 shows the main interface of the control software of the testing facility. The parameters during the experiment can be shown in the interface in real time.

The interface of control software of the testing facility.
Since the facility is composed by many pipes, the distribution of components is complex. There is no enough space for vision transmission without obstacle. The staff is hard to locate by computer vision method. The complexity increases the difficulty of sensor deployment and signal transmission.
INS-aided UWB positioning method
UWB positioning method
UWB positioning has recently attracted much attention as an indoor short-range high-speed positioning technology. UWB positioning provides a high accuracy in the centimeter order. It has many other advantages, such as license free, no interfering with most of the existing radio systems, low power consumption, large bandwidth, high data rate communication, and high level of multipath resolution. 25
The position estimation process involves two main steps: range measuring and positioning based on the measured ranges. Usually, the geometry relationship between the target node and reference nodes is used by positioning algorithm to calculate the target node’s position. The typical indoor positioning algorithms are received signal strength indication (RSSI), angle of arrival (AOA), time of arrival (TOA), or time difference of arrival (TDOA). TOA and TDOA are often applied by UWB positioning systems.
TOA of signals between a target node (mobile tag) and a number of reference nodes (base station) is measured. There must be at least three reference nodes to properly localize. Let Ri is the distance between the target node and the reference node BSi (i = 1, 2, 3). The intersection of circle Ci (i = 1, 2, 3) is the target, as shown in Figure 3(a). The reference node BSi is the center of circle Ci and Ri is the radius of Ci. To compute the TOA, the target and the reference nodes clocks need to be synchronous. It is a hard work to ensure all tags and reference nodes are precise synchronization.
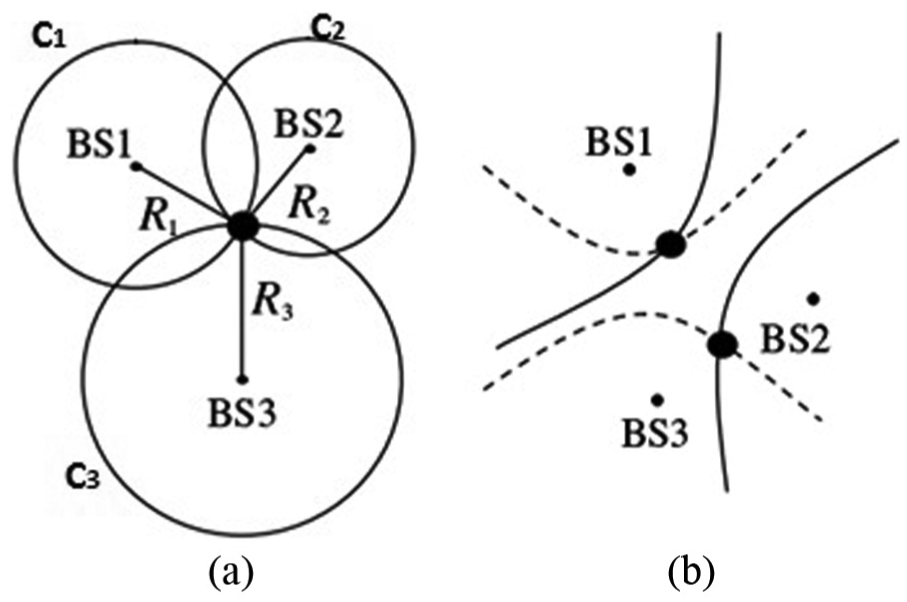
Positioning measurement algorithm. (a) TOA and (b) TDOA.
TDOA does not require the synchronization between the target node and reference nodes. Only the reference nodes are required to be synchronous. 26 TDOA positioning algorithm measures the difference in the arrival times of the signal between the target node and reference nodes first and then calculates the distance difference from the time difference by multiplying the speed of the signal. TDOA gives more accurate distance estimations than TOA. 27 Let R21 = R2 − R1 is the distance difference between the target to BS2 and BS1, as shown in Figure 3(b). The target locates in the hyperbola which focuses on BS1 and BS2. At the same time, the target also locates in the hyperbolas which focus on BS1 and BS3. So the target locates in one of the intersections of the two hyperbolas. The locations of the target and reference nodes meet equation (1)

Here, (x0, y0) is the location of the target node and (xi, yi) is the location of reference node BS i .
UWB positioning aided by INS
In addition to the high accuracy, UWB positioning has the advantages such as high-speed strong penetration, low power consumption, and no influence on the existing RF system if properly designed. 12 Since UWB signals have greater penetration of obstacles (such as walls) than conventional signals, UWB systems do not necessarily require line-of-sight (LOS) visibility. 28 UWB signal attenuates seriously in metal or liquid, UWB cannot be expected to achieve 100% coverage always. It is found that UWB location system deteriorates significantly when there are many objects whose material is metal or liquid.29,30 That is, the UWB measurements do suffer from multipath and non-line-of-sight (NLOS) conditions. 31 The measurement results in NLOS condition influence the accuracy of TOA or TDOA, which affect the final positioning result further. In the scenarios such as serious multipath interference and NLOS, the accuracy of UWB positioning tests can only reaches meter levels. 32 In the situation of our laboratory, pillars, human bodies, pipes and test facilities may bring difficulty for the positioning. On one hand, the pillars, test facilities, and human bodies may block the direct path between target node and reference nodes. It leads to the scenarios of multipath and NLOS for UWB positioning. On the other hand, the materials of pipes for test are always metal and the filler of these pipes is always liquid accompanied by toxic gases. The UWB signal attenuates seriously in metal, liquid, and human body. It may lead to signal deficient. So the UWB positioning system stand alone cannot provide stable position information with enough accuracy.
INS includes gyroscopes, accelerometers, magnetometers, barometers, and other elements. It calculates the position, velocity, and attitude of a moving target with the output of inertial sensors. 33 INS is a self-contained navigation method. It is free from signal masking problem due to communication channels. The current position of the target is estimated according to its previous position. Therefore, in order to obtain the target’s position and orientation, the inertial sensor measurements need to be integrated. Under the given conditions, the first integration of acceleration provides velocity and the second integration gives position. 34 The drift with time caused by the integrations accumulates with time, which makes INS suffering from drift accumulation over time. Although INS can supply accurate position and orientation on a short time, it is unsuitable for accurate positioning with a period of time.
Due to the integrative nature, INS cannot supply acceptable positioning accuracy if it is used alone. INS is often integrated with other positioning technology. The integration between INS and GPS has been investigated for several years. It has been applied in different applications, such as military and agriculture.35–37 The integration between INS and UWB is put forward recently as well, which can improve the availability and reliability. 38 A UWB positioning system aided by INS is adopted in this article. In the case that the feed of UWB reference nodes is less than 3, INS could still help to estimate the target node’s position. The positioning progress is illustrated in Figure 4.

Flow chart of INS-aided UWB positioning.
In order to exhibit the positioning performance of the UWB positioning aided by INS, an experiment is executed. A man acts as the target node and walks along the same path around a pillar in the laboratory twice. For the first time, only the UWB positioning works. For the second time, his location is estimated through the UWB aided by INS. The two moving traces drawn according to the position information are illustrated in Figure 5. The real walk path is given as well. The orange line is the actual route of the target node. The purplish red line is the route drawn according to the location information through UWB positioning alone. The green line is the route drawn according to the positioning information by INS-aided UWB positioning method. Due to the NLOS brought by pillar, the UWB alone cannot supply stable location information of the target. With the supplement from INS, the trace drawn by position information feedback from INS-aided UWB is close to the real path. The INS-aided UWB positioning system can get better results than UWB and INS. On one hand, when UWB has no signal, INS is used to locate the auxiliary device to ensure the continuity of location data. On the other hand, UWB can update the initial location to INS so that the location information of INS is more precise.

Comparison between UWB alone and INS-aided UWB.
Dynamic map based on gas sensor network
Initial grid-based map
The grid-based (metric) paradigm and the topological paradigm are two fundamental paradigms for modeling indoor environments. Grid-based map represents indoor environment by evenly spaced grids. It is considerably easy to build and maintain even in large-scale environment. Since a grid’s intrinsic geometry corresponds directly to the environment’s geometry, a pedestrian’s position in a grid-based map can be determined accurately enough. Topological map represents indoor environment by graphs. Nodes in the topological map denote distinct situations, places, or landmarks. Two nodes are connected by an arc if there is a direct path between them. The original grid-based map we constructed is two-dimensional (2D), discrete, and occupancy grids map, which was first proposed by Elfes 39 in 1987.
The original occupancy grids map divides the whole area as regular small grid cells. The state of each grid cell (x, y) is occupied or empty. Each cell in the map has an occupancy value to distinguish the two states. The cell whose state is occupied denotes obstacle in the area. The cell with empty state represents free space. Human cannot move to an occupied cell whose occupancy value is 1 and can move to an empty cell whose occupancy value is 0.
Since most of the test pipes and a part of facilities are hung in the air, the grid map cannot be built only according to the obstacles on the ground. For the cell that there is no obstacle on the ground, if the distance from the pipe or facilities hung in the air to the ground is no more than 2 m, the state of the cell is still set to occupied. The initial gird-based map of the laboratory is given in Figure 6. Where the black cell is occupied, the white cell is free, the green cell is the start point, and the red cell is the end. The evacuation path is also illustrated.
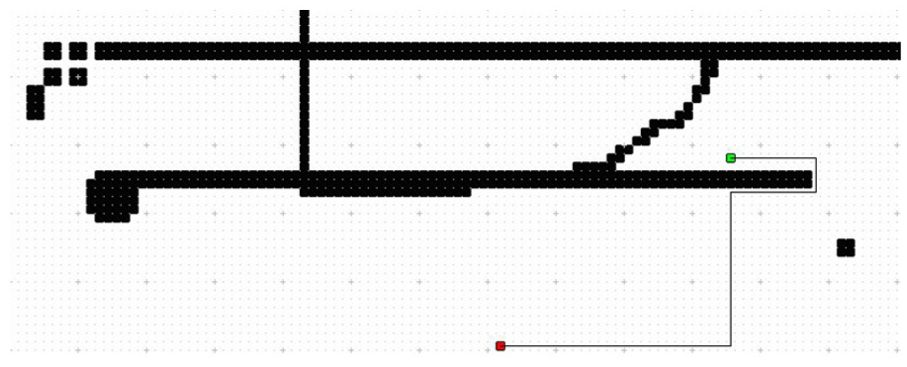
Initial grid-based map.
Dynamic adjustment method for grid-based map
In recent years, WSN has been widely used in different fields, such as electric power, industrial manufacturing, medicine, and other fields. WNS is mainly made up by the convergence of sensor, micro-electro-mechanism system, and networks technologies. It has become a popular method to monitor real-time environmental status. WSN has also been proved useful for gas leakage detection and gas/odor source localization indoor. In this article, a WSN consists of gas sensors is deployed to monitor the leakage accident and estimate the diffusion area of the hazardous gas. The gas monitoring sensor nodes were mounted in fixed positions to monitor gas concentration. According to scale of the laboratory, a gas sensor is installed every 3 m both in the longitudinal and transverse directions. Each sensor’s position is determined.
The gas diffusion is a continuous dynamic process. The diffusion area changes with time. In order to ensure the safety of evacuation route, the map should be dynamically adjusted according to the diffusion situation of the hazardous gas. The grid cells where gas concentration is higher than a safe value are regarded as obstacles. When the grid-based map is updated, these cells’ occupancy value is set to 1. The real-time map influences the path planning result for the personal evacuation further.
Table 2 lists out the lethal concentration of a part of toxic gases when the time of exposure is 5–10 and 30–60 min, respectively. To ensure the evacuation path being safe, the lethal concentration for 30–60 min is chosen as the threshold for poisonous gases.
Lethal concentration of toxic gases (ppm, one part per millions).

The position information supplied by the gas sensors is not enough to draw out the full boundary of the diffusion area because of the distance between sensors. Different mathematical models have been put forward to describe the gas diffusion. The Gaussian plume model is a widely used model, where the gas concentration can be calculated by the effective sources such as height, wind speed, and wind direction. According to the formula, the 2D shape of the dispersion area of Gaussian plume model can be regarded as an ellipse. In our method, the diffusion area is obtained by a popular ellipse fitting algorithm, least square method. An ellipse can be fitted out by least square method according to five reference nodes. Thus, five sensors whose gas concentration is equal to or very close to a threshold are selected as reference nodes. In order to enhance the fitting result, the distances between every two sensors should not be too short.
All the cells within the eclipse are set to the occupied state. Let us suppose there is a leakage point in the right of the test pipe in the map. Some cells have been changed into occupied and their colors in the map are changed to black. As shown in Figure 7, the new evacuation path will be planned again according to the real-time map. The updated map and the dynamic route planning can supply a real-time and safe evacuation guide for personnel.

Dynamic map changing and path planning.
Evacuation guide system
System architecture
Based on the method above, we developed an evacuation guide system. It mainly consists of gas sensors, reference nodes, INS, server, and clients, as shown in Figure 8. The gas sensors detect the concentration of harmful gas and send signal to the server in real time. The reference nodes support the location based on UWB. INS estimates target’s position when UWB signal is outage. It is integrated with the client. The server treats all the data and produces evacuation route dynamically. The client carried by person receives the alert and displays the evacuation route for people’s safe escaping.

The architecture of evacuation guide system.
Figure 9 illustrates how the system derives the evacuation plan. Current locations of trapped people are gotten by INS-aided UWB positioning method. It ensures that the position information is always available and accurate. The real-time map is updated in fixed time. The updating method is to integrate the sensor data from gas sensor network with the initial map. In the real-time map, not only the obstacles but also the areas where the concentration of harmful gas exceeding certain value are represented by occupied cells. Since the map is dynamically updated, the path planning algorithm D* designed for changing environments is adopted for evacuation route planning. 40
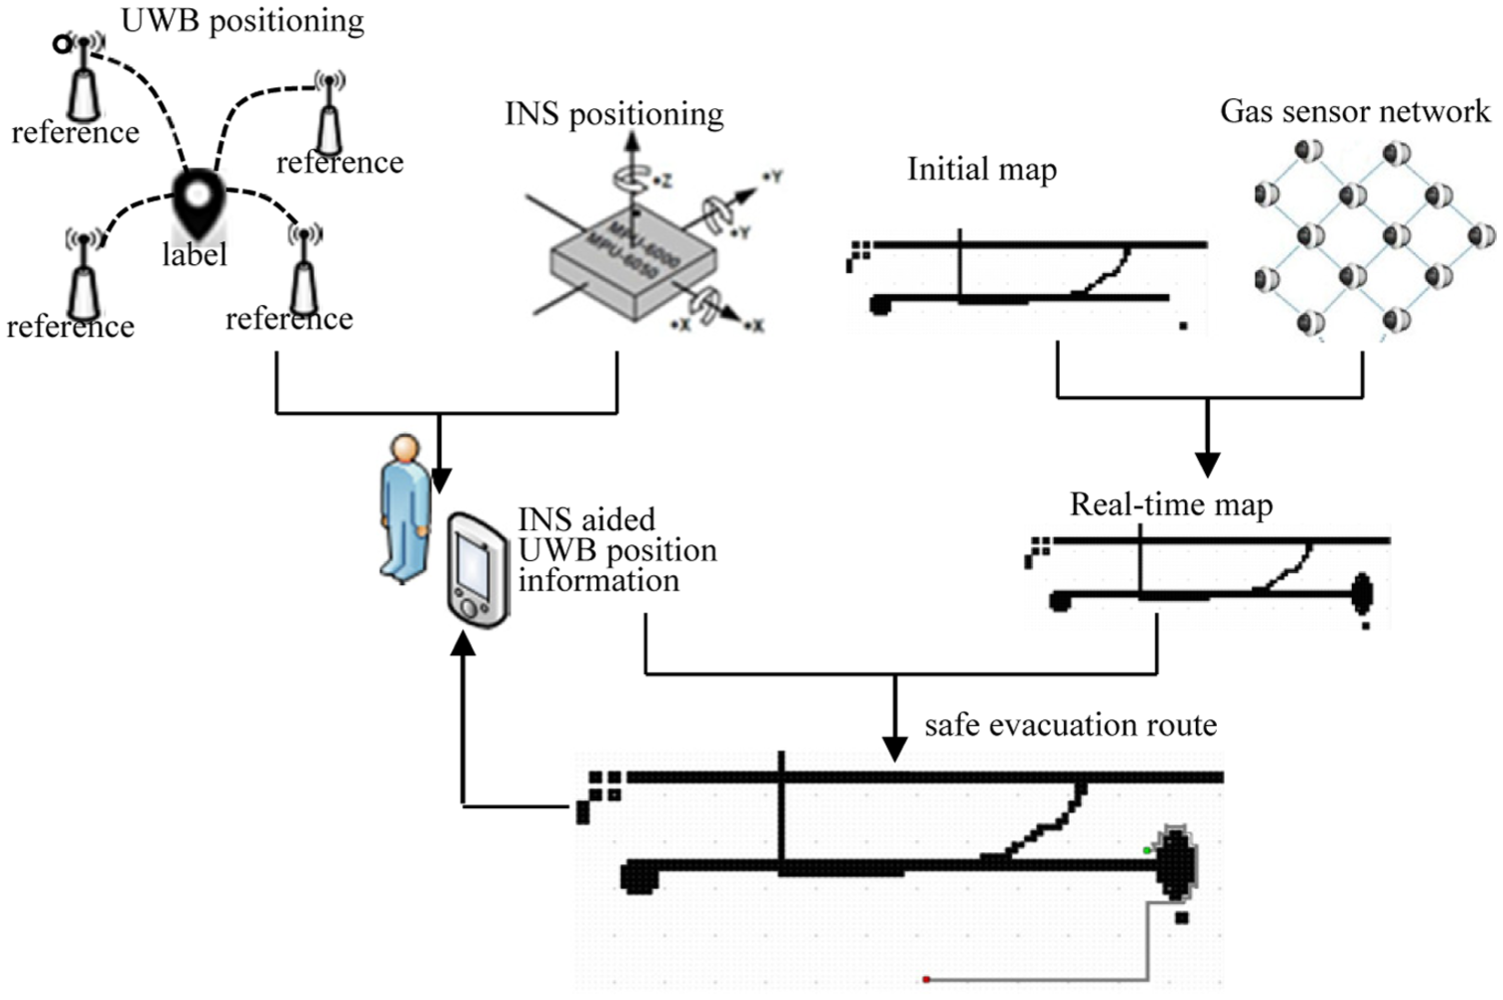
The process of evacuation planning.
Gas sensors
Due to the experiment design, H2S and CO are the main harmful gas in the laboratory. Then we adopt two types of gas sensors named ME3-H2S and ME3-CO for H2S and CO detection, respectively. The sensors are produced by Winsen Company, a Chinese sensor producer. The parameters of the sensors are shown in Table 3. The sensors can continuously detect the concentration of H2S and CO and send signal to a receiver. With an interface with transmission line, the signals from the sensors can be detected by the server in real time
The principal parameters of H2S and CO sensor.

Reference nodes and UWB deployment
UWB reference node and deployment
UWB reference node includes antenna and pulse module, as shown in Figure 10. After sending pulse signal to UWB tag, the real-time tag (target node) position can be calculated by the time interval, distance, and angle of feedback signal. Depending on high precision time synchronism, the accuracy of location can be ensured.
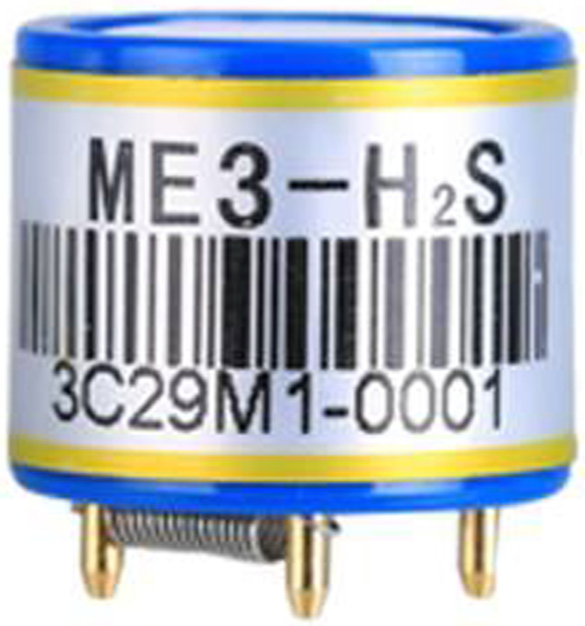
Gas sensor (ME3–H2S).
For the accurate real-time location, UWB guide method is used. Reference nodes must be installed around the laboratory. Since the coverage distance of UWB signal is usually no more than 35 m, the laboratory is segmented into four parts as shown in Figure 11. To enhance the availability of the UWB signal, 10 reference nodes are deployed in the laboratory. The main purpose of the INS-aided UWB positioning system is to supply the persons’ position. Reference nodes are mounted on the wall, 2 m high from the ground. All the UWB reference nodes accept synchronous clock from the server.

UWB location sensor.
The sensors and tags of Ubisense 7000 from Ubisense Company are adopted. Ubisense 7000 embeds TDOA/TOA algorithm. Its positioning range is 20–50 m and the positioning precise is 15 cm. The tag is small and can be attached on device or carried by person. It consists of CC2510, vibration sensor, CER050, and battery to supply 3 V power.
The open source positioning software supplied by Ubisense is adopted to accomplish the location function. The tag’s location data can be sent to a specified address by UDP broadcast.
The basic format is an ASCII string, which is given as follows:
Date Time, tag ID, X, Y, Z
Here, Date Time indicates the recording time of the location tag. The format is like YYYY-MM-DD HH:MM:SS. Tag ID is the unique identifier of a UWB tag. Each ID specifies an object in the system. X, Y, and Z are the coordinates in X axis, Y axis, and Z axis, respectively. The unit of the coordinate is meter. To be noticed, the value of X and Y can be negative according to the original point setting.
Navigation client
INS can be divided into a sensor part (the inertial measurement unit (IMU)) and a computational part. Micro-electro-mechanical systems (MEMS) are very popular in low-grade inertial systems. 41 MPU6050, a kind of MEMS, is chosen as IMU. It is a motion tracking device designed for the low power, low cost, and high-performance requirements of smartphones, tablets, and wearable sensors. MPU6050 combines a three-axis gyroscope and a three-axis accelerometer on the same silicon die. An onboard digital motion processor, which processes complex six-axis motion fusion, is included as well. MPU6050 can access external magnetometers or other sensors through an auxiliary master I2C bus.
The computational part of INS is implemented on a PC to which the IMU is connected. Here, Arduino UNO acts as the computational part. It is a microcontroller board based on the ATmega328P processing chip. It has 32 input/output pins to read and control. It provides a power supply for MPU6050. MPU6050 is connected with Arduino UNO with I2C.
Navigation client accomplishes the dynamic route plan receiving and display. The person with the client can evacuate according to the guide from the client. We integrate Raspberry Pi with MPU6050 and UWB tag as navigation client, as shown in Figure 12. MPU6050 and UWB tag can give the exact position clues for location. Raspberry Pi collects data from MPU6050 and UWB tag and sends it to the server. After receiving the evacuation route from the server, it displays the route for person’s evacuation. The components of navigation client are shown in Figure 13.
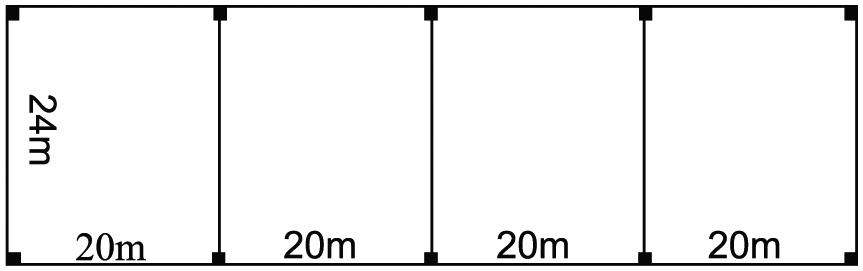
Four parts and 10 reference nodes for UWB position.

The components of navigation client.
Conclusion and discussion
This article proposes a method to dynamically plan evacuation route and guide human to escape from the harmful gas leaking laboratory. UWB and INS are integrated to realize the positioning. Gas sensors are deployed to monitor the leaking of harmful gas. The gas diffusion area is also calculated dynamically based on the data of sensors. The evacuation route can be updated according to the real-time situation. The system can improve the human’s safety in the laboratory.
For indoor evacuation, spatial models for indoor environments are often required.4–7 It is a difficult work to map one multilayered building with many subspaces such as rooms, hallways, and stairs. The pipeline lab is a single space like a big workshop. There are no subspaces and no complex relationships among subspaces. The grid-based map for 2D-floor is enough. It makes the updating of map easier.
Few indoor evacuation systems are risk aware. Sensors are applied by Wang et al. 8 to monitor the whole environment for indoor evacuation. In order to supply evacuation routes according to the context-aware situation, a sensor graph that gives timely feedback of environmental factors is defined. It is integrated with a route graph for sensor tracking and risk aware evacuation planning, where a region (a 2D bounded area) is represented by a polygon and an evacuation route is a polyline that consists of edges. An edge is a line linking a pair of access vertices. If an edge is blocked, it is not safe and cannot be included to any evacuation route. One drawback for this method is that an edge is regarded as blocked if any cells in it are not safe. It decreases the number of available evacuation routes. No more accurate indoor positioning method is introduced either.
In our system, the gas diffusion is only calculated by the data from the sensors. It cannot predict the future gas diffusion situation, which may cause some errors during the evacuation. The route optimization is also not considered because of the simple situation in the laboratory. In the complex environment, the issues above should be studied further for a better evacuation planning. In our evacuation guide system, Raspberry Pi is adopted as client for evacuation route displaying. For friendly application, other kind of clients such as smart mobile phone may be a better choice.
Footnotes
Handling Editor: Wenbing Zhao
Declaration of conflicting interests
The author(s) declared no potential conflicts of interest with respect to the research, authorship, and/or publication of this article.
Funding
The author(s) disclosed receipt of the following financial support for the research, authorship, and/or publication of this article: This work was supported by Beijing Intelligent Logistics System Collaborative Innovation Center, Beijing Key Laboratory (No. BZ0211), Beijing Social Science Foundation (No.17GLC066), and Breeding Project of BWU (No. GJB20162002).