
Abstract
The indoor magnetic field is omnipresent and independent from external equipment. Local magnetic field is also relatively stable compared with WiFi signals in the same environment and nonuniform in different locations. However, it has low discernibility, in that there are similar magnetic features in different areas. Pedestrian movement model is a continuous navigation method based on inertial sensors. However, inertial sensors provide only short-term accuracy and suffer from accumulation error. Hence, an indoor positioning tracking that uses the magnetic field and an improved particle filter is proposed in this article. First, adaptive four-threshold step-detection and mixed adaptive step length methods are used to obtain the travel distance in different walking states. Furthermore, an improved particle filter is adopted to calibrate the pedestrian movement model by fusing indoor magnetic field information. Besides, initial locations of particles are restricted in a determined area according to WiFi signals, and the diversity of the particles is increased by a classified heuristic resampling. The proposed system was implemented on an Android phone and extensive experiments were conducted in real indoor environments. The experiments show that the positioning accuracy and system robustness are greatly improved compared with other methods.
Introduction
In recent years, location-based services (LBS) have been widely used in many fields. The demand for real-time and accurate positioning is growing rapidly. The global positioning system (GPS) plays an important role in LBS. However, GPS is unavailable for indoor environments, as the direct line of sight is obstructed.
Various indoor positioning systems have been researched based on different signals such as ultrasonic, infrared, FM, magnetic field, and WiFi. Ultrasonic-based positioning and infrared-based positioning require high-precision instruments and are expensive, which are difficult to be promoted. WiFi-based positioning has attracted more attention because WiFi signals are available in most areas and need no extra hardware or other infrastructure. However, the positioning is based on the received signal strength (RSS) of the WiFi signals, which is easily affected by reflections, obstacles, and multipath effects. 1 Hence, WiFi signals are time-variant and the fingerprint database needs to be updated frequently.
Pedestrian dead reckoning (PDR) is an important approach based on movement sensing information obtained by inertial measurement units (IMU). 2 PDR obtains a high accuracy initially, but the accuracy decreases over time. Moreover, PDR also needs to know the initial position of the pedestrian, which limits the range of applications.
The indoor magnetic field is omnipresent and independent from external equipment. The local magnetic field is also relatively stable compared with WiFi signals in the same environment and nonuniform with respect to location. However, it provides limited discernibility. In a larger area, the magnetic field can be similar in different locations.
As described above, a single indoor positioning system cannot meet the general needs for positioning. Multi-information fusion technology has become the main approach for indoor positioning. Hence, an indoor positioning tracking that uses the magnetic field and an improved particle filter (MFIPF) is presented. The contributions of this article are summarized as follows.
In the pedestrian movement model, adaptive four-threshold step-detection and mixed adaptive step length methods are designed to obtain the movement distance in different walking states.
An improved particle filter is adapted to calibrate the pedestrian movement model by fusing indoor magnetic field information.
We implement MFIPF on Android smartphones and conduct extensive experiments in real indoor environments. The experimental results show high localization accuracy and robustness for MFIPF in real indoor environments.
Related work
For WiFi-based positioning, many researchers have extensively studied this approach. Bahl and Padmanabhan 3 proposed a Radar system based on the K-nearest neighbor (KNN) using a Euclidean distance to match the real-time signal with a fingerprint database. Youssef and Agrawala 4 proposed the Horus system using a clustering method to reduce computational complexity. Castro 5 adopted a Bayesian network approach by modeling the RSS distribution to estimate pedestrian position. However, fingerprint-based WiFi positioning must be calibrated frequently because of the RSS variation. Rai et al. 6 proposed a crowdsourcing-based algorithm to build a fingerprint database quickly and reduce labor costs, but device diversity affects the WiFi signals. In this article, MFIPF uses the magnetic field, which is relatively stable as a positioning feature compared with the WiFi signals. Furthermore, magnetic signals collected by different devices are similar in shapes after filtered.
PDR is also a popular indoor positioning approach. The major challenge is step-detection and step length estimation using IMU data. Some studies have aimed to improve step-detection and step length estimation. A peak detection (PD) method 7 was proposed that sets a constant acceleration threshold to detect steps. However, the method ignores the effects of height, weight, and gender on step detection. A zero-crossing method 8 has also been utilized. If the acceleration value is larger than zero, the step is counted. However, this method cannot exclude interference near the zero value, detecting pseudo steps. An adaptive threshold was studied 9 by setting the peak threshold adaptively using window-based statistics of acceleration to detect peaks. However, larger windows may cause steps to be counted incorrectly. In this article, an adaptive four-threshold step-detection method is proposed that uses acceleration thresholds and time intervals for different walking states. Besides, the valid peak and valley must be detected simultaneously in one step to eliminate pseudo peaks or valleys caused by pedestrian’s vibration. For step length estimation, a constant step length model 10 was used by treating the step length as a constant. However, different people have different step lengths, and even for the same people, step length is also diverse. A step frequency model 11 was proposed by fitting a linear relationship between step length and walking frequency. However, this simple model cannot adapt to random walking. An artificial intelligence model 12 was utilized that learns the relationship between walking state and step length using machine learning methods. However, learning the relationship needs a large amount of data and increases labor costs. Hence, a mixed adaptive step length algorithm is used by combining the acceleration with walking frequency to adapt to different walking speeds.
Multisensor integration positioning has attracted a large amount of interest. Tian et al. 13 proposed a Kalman filter (KF) to integrate WiFi and PDR. Chen et al. 14 also proposed a sensor fusion framework for combining WiFi, PDR, and landmarks using a KF. However, the motion model is rather complicated, and a KF that only fits the linear model cannot achieve satisfactory results. Zheng et al. 15 utilized a particle filter to fuse data from different sensors. However, in this system, the initial position is limited and power consumption is high, so it is not practical. Rai et al. 6 leveraged an augmented particle filter to fuse information. However, the system needs many particles for global initialization, which increases computational complexity compared with local initialization. A simple sequential importance sampling 16 has been used to sample particles. However, some particles have negligible weight after a few iterations, which affects computational efficiency. Residual sampling 17 and systematic resampling 18 have been adopted to remove those particles with small weights, but these methods cause sample impoverishment and reduce the diversity of the particles. In this article, MFIPF improves the particle filter, using particle initialization based on the WiFi signals and classified heuristic resampling to reduce the system complexity and increase the diversity of the particles.
The rest of this article is organized as follows. First, system framework of MFIPF is provided in section “System framework.” Second, the pedestrian movement model is introduced in section “Pedestrian movement model.” Then, the improved particle filter is explained in section “Improved particle filter.” Finally, a system evaluation is presented in section “System evaluation” and conclusions are given in section “Conclusion.”
System framework
The system framework for MFIPF is shown in Figure 1. MFIPF consists of two main modules for offline and online operation.

System architecture.
In the offline phase, the three-axes magnetic signals are collected by a magnetometer of smartphone in a site survey along the planned path. Each component of magnetic signals can change with the orientation of smartphone, but the magnitude of the magnetic signals is not sensitive to orientation variation. So, the magnitude is used as a positioning feature and stored into the magnetic fingerprint database, noted as <coordinates, magnitude of magnetic signals>.
In the online phase, the pedestrian position is constantly estimated and updated by improved particle filter fusing the pedestrian movement model and the magnetic signals. First, the pedestrian movement model consists of step-detection, step length estimation, and heading estimation. Data from an accelerometer are used to detect steps and estimate the step length. Meanwhile, the data from gyroscope and compass are used to estimate heading of the pedestrian. Second, the part of improved particle filter includes particle initialization, particle state transition, weight update, particle constraints with map information, and classified heuristic resampling. The state of pedestrian is represented by a set of particles in an initial area determined by WiFi signals. Particle states are transferred by pedestrian movement model. Then, the particle weights are calculated using the real-time magnetic signals and the magnetic fingerprint in database. For the particles which are unsatisfied with constrains of map, the location of them are calibrated. Then, particles are resampled by a classified heuristic resampling to keep the diversity of particles. Finally, the pedestrian position is estimated by particles with different weights.
Pedestrian movement model
In this section, we propose a novel and robust pedestrian movement model that consists of step-detection, step length estimation, and heading estimation.
Step detection
In this model, an adaptive four-threshold step-detection (ATD) algorithm is implemented using acceleration thresholds and time intervals. Note that the acceleration magnitude acc is used to detect steps rather than three-axis acceleration values, which are vulnerable to the smartphone orientation.
Figure 2 shows the dynamic threshold process. Here,
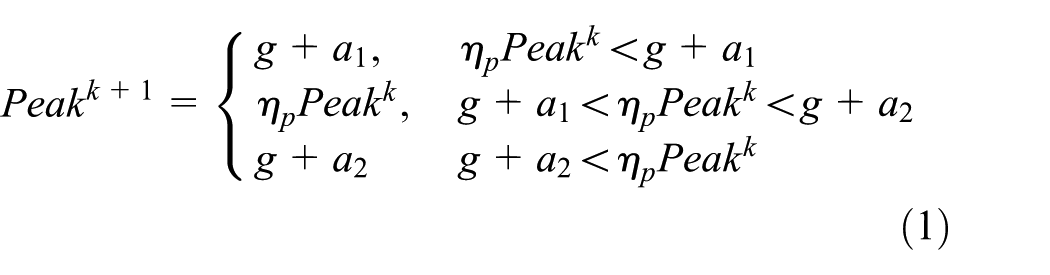

where

Dynamic threshold process.
Step length estimation
A person’s step length is closely related to his/her height, weight, mood, and walking frequency, and the step length also changes randomly during walking. In this article, a mixed adaptive step length estimation algorithm (M-StepLength) is proposed. M-StepLength combines a nonlinear acceleration step length model 19 with a linear frequency step length model 11 to estimate step length. The formula is

Here,

Heading estimation
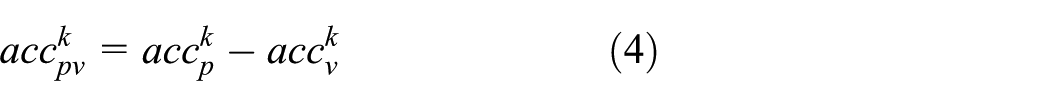
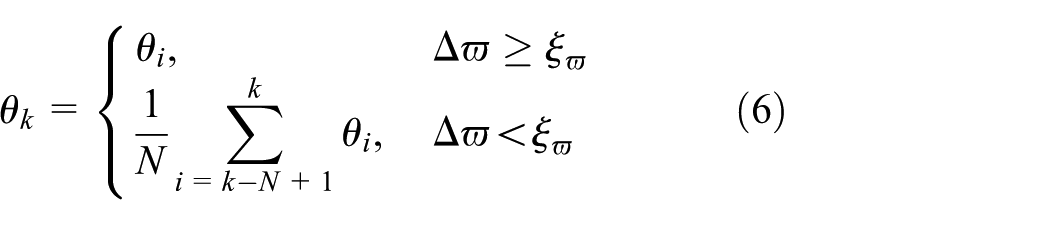
The heading of the pedestrian can be estimated using sensor data, that is, the gyroscope and compass. A gyroscope has a high accuracy for a short duration, but a large accumulation error is produced for longer durations. The compass has a stable accuracy for long durations, however, the heading of a pedestrian estimated by a compass is easily disturbed by the indoor magnetic field. Considering the complementary characteristics of the gyroscope and compass, a KF is used to fuse their information. 13
In fact, pedestrians usually walk in a straight line. We introduce a M-step moving time window and
Improved particle filter
Particle filter, also known as the Monte Carlo method, is commonly used in indoor positioning tracking systems. In this article, an improved particle filter is proposed to integrate a pedestrian movement model with indoor magnetic signals, as shown in Algorithm 1. First, the particles are initialized by WiFi signals and particle states are transferred by pedestrian movement model. Second, particle weights are updated and particles are constrained with map information. Then, particles are resampled by a classified heuristic resampling algorithm. Finally, the pedestrian position is estimated by particles with different weights. The detailed process of particle filter is presented in Algorithm 1.

Particle initialization based on WiFi
WiFi signals are available in an indoor environment, and we can build a simple WiFi fingerprint database when constructing the magnetic fingerprint database. Figure 3 shows the particle initialization area based on WiFi. The WiFi and magnetic signals are collected on predetermined sampling dots, such as the location of black dots marked in Figure 3, and then, these data are stored into the fingerprint database.
Step 1. Obtain the real-time WiFi signals.
Step 2. A KNN algorithm
3
is used to match the current WiFi signals with the WiFi fingerprint database to determine the rough location
Step 3. Region

Particle initialization area based on WiFi.
Particle state transition model
In the particle filter, the particle is a hypothesis about the state of the pedestrian, and the particle weight

where

where
Weight update
Particle weights follow a probability density distribution function, and a Gaussian distribution function is used to describe the posterior probability distribution of the magnetic field. Particle weights can be calculated by the following equation
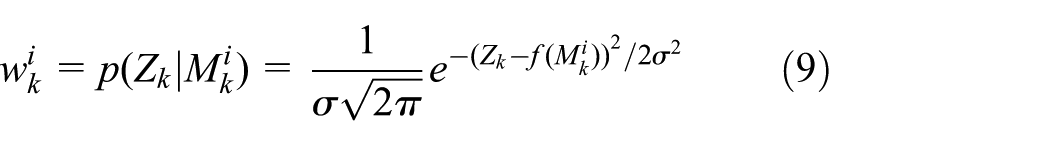
where
Particle constraints with map information
The particles are constrained according to the indoor map before resampling. As shown in Figure 4, the blue dots represent the particle, and larger dots indicate larger weights. In Figure 4, some particles are positioned outside the corridor. These kinds of particles are called escape particles. Given that the pedestrian cannot walk outside the wall in actual positioning, the escape particles should be processed as follows.
Step 1. Find the particle nearest to the escape particle.
Step 2. Update the escape particle’s coordinates

where

Diagram of particle constraints with map.
Classified heuristic resampling algorithm
A classified heuristic resampling algorithm is proposed to enhance the robustness and anti-interference ability. Here, after the particle weights have been updated, the particles are divided into two parts according to the weights in descending order. The first part consists of the particles whose weights are within the first 80%. A residual resampling algorithm
17
is applied to this part. The other part is the remaining 20% particles, and a proposed heuristic strategy is used to resample them. Suppose that

where
For heuristic sampling, the sampling time needs to be controlled. A blind heuristic generation of particles can bring noise into the system. In this article, effective sampling scale
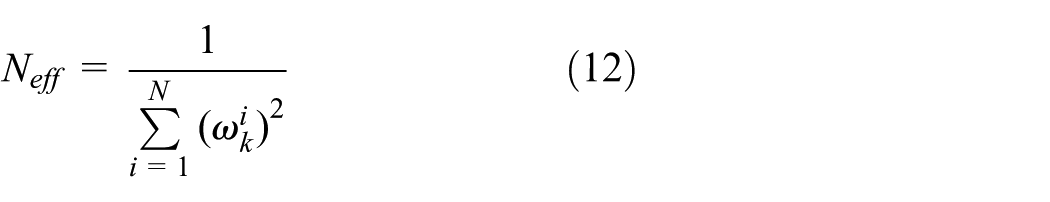
In addition, a diversity factor

where
A gyroscope variation
The classified heuristic resampling algorithm uses the following steps:
Step 1. If
Step 2. If
Step 3. Sort the weights in descending order. The first 80% particles are resampled by residual resampling. The remaining 20% particles are resampled using heuristic resampling in equation (11).
Here,
After particle resampling, the pedestrian position

System evaluation
This section presents the results of a large number of experiments conducted to evaluate the indoor positioning system. The experiments are described and the results are presented.
Implementation and experiment setting
We implemented the MFIPF client on a MEIZU MX5 smartphone with a 1.8 GHz processor and 3GB RAM. Background location service applications were running using Aliyun cloud services. The demonstration of the MFIPF client application is shown in Figure 5. Positioning, update data, setting, and exit buttons can be used. The positioning button can estimate the pedestrian location at the moment. The update button can update the WiFi and magnetic signals in the fingerprint database. The setting button can set the sampling frequency and the number of samples. Exit button can exit the MFIPF client application.

Demonstration of the MFIPF client application.
Figure 6 shows the floor plan of laboratory building, which is 87.6 m long and 41.8 m wide. In Figure 6, the purple part denotes planned route, and we select a corridor as the planned route. The six routers are installed on the walls in the corridor. In our experiments, the pedestrian only needs to walk slowly along the planned route, as the magnetic signals and WiFi signals are collected automatically. We mapped the data uniformly onto the indoor map, storing pairs of <coordinates, magnetic fingerprint information> into fingerprint database.

Floor plan of the site survey.
Pedestrian movement model
Step detection
To verify the accuracy of step detection, three pedestrians of different heights walked along the planned route. The actual number of steps and IMU data were recorded. Compared with the PD 7 and zero-crossing detection (ZD), 8 the result of ATD is much more accurate in Table 1 and Figure 7. The total error steps of PD, ZD, and ATD are 56, 35, and 12 steps, respectively. The ATD achieves 98.1% accuracy for step detection, while PD is 91.3% and ZD is 94.3%. The PD detects the number of steps by setting a constant acceleration threshold, so it is not suitable for variable acceleration. The ZD compares the acceleration value with zero, and if the acceleration value is larger than zero, a step is counted. However, the ZD cannot exclude interference near the zero value, detecting pseudo steps. But the ATD can obtain the higher accuracy on step detection by setting dynamical acceleration thresholds.
Step-detection results.


Histogram of error steps for different pedestrians.
Figure 8 shows the step-detection waveform of ATD. In Figure 8, when a step is detected by ATD, a red star symbol is marked in this figure. It is clear that the acceleration amplitude changes from the range of 7.6–12.5 m/s2 to the range of 9.0–11.1 m/s2. For this condition, using the acceleration thresholds and the time intervals, ATD still can accurately detect the steps when pedestrians walk at different accelerations which vary in a large range.

Step-detection waveform of ATD.
Step length estimation
To verify the accuracy of the proposed step length estimation algorithm, a pedestrian collected the real-time IMU data along the corridor with the smartphone. Figure 9 shows the step length is estimated by the step frequency (SF) model, 11 step-acceleration (SA) model, 19 and M-StepLength methods. In Figure 9, the black curve represents that the actual average step length is 0.6 m, which is calculated by walking distance divided by the number of steps. From Figure 9, we can find that the step length estimation of M-StepLength is closer to 0.6 m than SF and SA. Figure 10 shows that the walking distance is estimated by SF, SA, and M-StepLength. In Figure 10, the black curve represents the measured walking distance. The distance estimated by M-StepLength is closer to the actual walking distance than SF and SA. Because the SF only considers the walking frequency and SA only uses the walking acceleration, SF and SA cannot effectively calculate walking distance. However, the M-StepLength combines the SA and SF, taking into account both of the acceleration and the walking frequency of pedestrians, so the performance of M-StepLength is better than the other two methods.
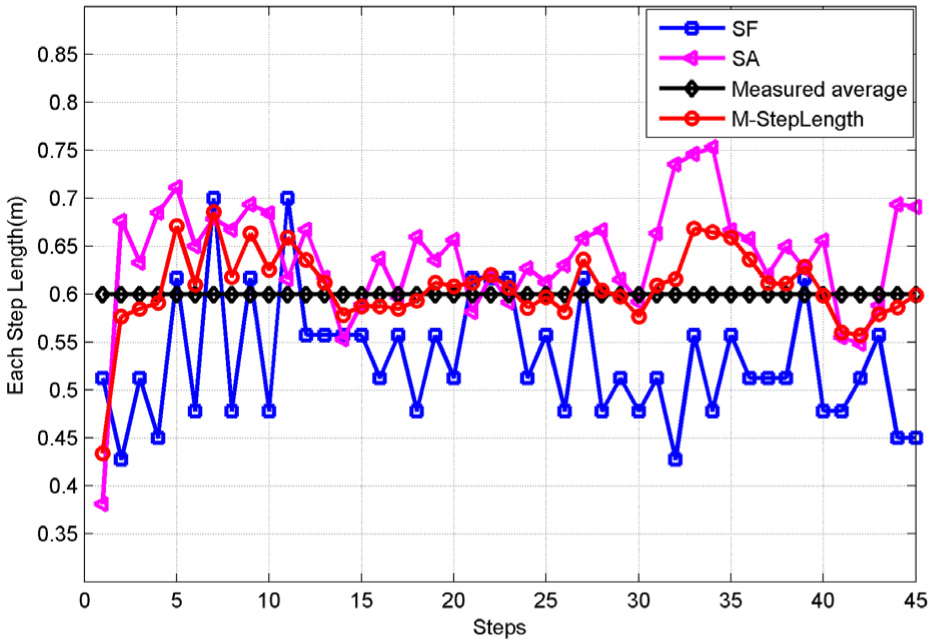
Comparison of step length methods.
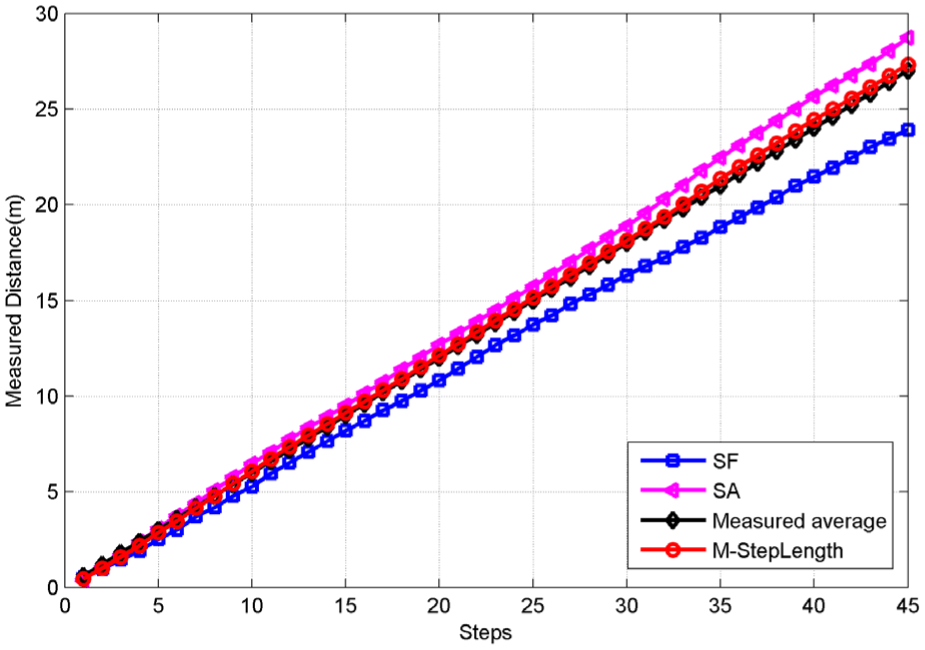
Distance calculated by different methods.
Heading estimation
To verify the validity of the heading estimation algorithm, a pedestrian collected real-time IMU data along the corridor with the smartphone. Figure 11 shows the trajectory of heading estimation by the separation strategy (SS), 21 and complementary filter (CF) 22 methods are compared with the KF methods. In the planned route of Figure 11, there are some inflection points at the spot of 13, 18, and 58 on abscissa, which represent that the pedestrian’s heading has changed. Obviously, the pedestrian’s heading estimated by SS and CF methods deviate from the planned route with the increasing distance, whereas the KF can keep higher coincident with the planned route.

Trajectory of heading estimation.
In Figure 12, the cumulative distribution function (CDF) of the SS, CF, and KF methods are 36%, 59%, and 83%, respectively, when the heading error is 5°. In addition, the maximum heading error for the three methods is 15°, 10°, and 9°, respectively. The heading estimation by the SS is clearly not as good as the other methods, since the SS method uses only the gyroscope producing a large accumulation error for longer durations, while the CF and KF methods combine the gyroscope and the compass. Compared to the linear combination of the gyroscope and compass used by the CF method, the proposed KF introduces a sliding time window. So, the KF method has better accuracy than other methods.

CDF curve of heading estimation.
Positioning performance evaluation
Analysis of the positioning accuracy
To verify the performance of the system, a pedestrian collected real-time IMU data along a multiple-corner corridor shown in the Figure 6 with the smartphone. From Figure 6, we can see that six routers are installed on the wall. In such an environment, the proposed MFIPF is compared with the PDR, 2 Radar, 3 and particle filter (PF) 23 methods in Figure 13. In the Radar, parameter k is set to 5. In PF and MFIPF, the number of particles is set to 500. All the experimental results are the average of several experiments. From Figure 13, MFIPF achieves a 90% accuracy at 1.8 m, while PF obtains a 90% accuracy at 2.4 m, and PDR and Radar have a 90% accuracy at 4.4 m. The Radar method, which is based on WiFi, is the worst of the four methods because the WiFi signals are poor in the office, and the fluctuations increase when the signal crosses the wall. The PDR method is relatively better at the beginning because the initial coordinates are known. However, the positioning accuracy gradually decreases without any outside assistance. PF is not as good as this proposed system, as the particles of PF cannot represent the state of pedestrian perfectly. Compared with 62% of PF, the CDF of MFIPF is 80% at 1 m. Even if the error exceeds 1 m, MFIPF CDF is greater than PF. This is because MFIPF uses the classified heuristic resampling, which increased the diversity of particles, and these particles well represent the state of pedestrian. In general, the MFIPF has higher positioning accuracy than the other methods.

CDF curve of different positioning systems trajectory.
Analysis of the positioning trajectory
To verify the actual localization trajectory of the pedestrian in a real environment, we chose a corridor with multiple corners. The planned route and the positioning trajectories estimated by the MFIPF, PDR, PF, and Radar methods are shown in Figure 14. In Figure 14, the initial coordinates are (0, 0), and there are two inflection points in this experiment. The first inflection point is located at coordinates (47.0, 0), and the second is (47.0, 5.5). The PDR has an obvious drift at coordinates (20.0, 0), and the error is accumulated with the walking process and without any correction. At the beginning of walking, the PF has a large positioning error and obvious fluctuation, but the error gradually decreases with the moving of pedestrian, which is caused by the convergence of particles. Though the performance of PF is better than the PDR shown in Figure 14, the positioning estimated by PF at the two inflection points is not good. The localization trajectory of Radar is worse than others in Figure 14, because the WiFi signals are easily affected by reflections, obstacles, and multipath effects. The positioning error of Radar is also larger than that of other methods in Figure 15. However, MFIPF has a better accuracy not only at the straight line but also at two inflections. This is because the particles are initialized in a local area based on WiFi signals, and then, the particles can converge quickly and represent the state of pedestrian. The positioning error by these different methods is shown in Figure 15. From Figure 15, it is further shown that MFIPF has a smaller error and the performance of MFIPF is superior to the other two methods.

Actual localization trajectory.

Positioning error for different methods.
Robustness analysis for different users
A positioning system needs to be used by different people, and different people have different walking habits in that their step length and walking frequency are usually different. To verify the robustness of the proposed system, three pedestrians walked along the planned route. We recorded the real walking positions and calculated the pedestrian coordinates using the sensor data.
In Figure 16, the CDF of three curves are nearly similar and stable after the error exceeds 4 m. This is because the MFIPF initializes the particles in the local area based on the WiFi signals. These particles are constantly transferred and updated with the walking process and finally converged. The MFIPF has good robustness for different users.

CDF of different users.
Analysis of power consumption
Smartphones have a serious drawback in that their power consumption can be too large, so the power consumption of an application is very important. To verify the power consumption of the positioning system, we turned off other applications and ran the positioning system alone. Because the positioning algorithm is generally run as a back-end service, we only consider the power consumption for collecting data. The PDR, PF, Radar, and proposed positioning system were run for 5 h with the same smartphone and we recorded the power consumption. As shown in Figure 17, PDR consumes 10% of smartphone power in 100 min, which is the smallest power consumption in all methods. Radar consumes 20% of smartphone power, twice as the PDR. The MFIPF and PF consume 15% of smartphone power. The power consumption of the Radar is the largest, because the Radar needs to scan the WiFi signals again and again and in result spend more consumption on scanning. The PDR consumes less power than MFIPF, because PDR only needs to collect the information of accelerometer, gyroscope, and compass sensors. However, MFIPF not only collects the information of accelerometer, gyroscope, and compass sensors but also needs to collect information of magnetometer sensor. Although the PDR consumes less power, the positioning error of PDR is larger than MFIPF in Figures 13–15. The MFIPF and PF are almost the same in power consumption because the MFIPF only collects the WiFi signals to get the rough location at the beginning. After that MFIPF collects information of sensors, which is the same as PF. From Figures 13–15, we can see that the positioning error of MFIPF is smaller than PF. In conclusion, MFIPF not only consumes less power but also the positioning error is smaller than other methods.

Power consumption of different systems.
Conclusion
In this article, MFIPF, which is an indoor positioning system fusing a pedestrian movement model with magnetic field, is presented. The system adopts an adaptive four-threshold method to detect steps, using acceleration thresholds and time intervals. The mixed adaptive step length algorithm is used to estimate the step length, combining the nonlinear acceleration step length model with linear frequency step length model. The KF is used to estimate the heading, introducing the sliding time window. In addition, the system restricts the initial area according to WiFi signals. Then, particle states are transferred by pedestrian movement model, and particle weights are updated using the real-time magnetic signals and the magnetic fingerprint in database. Finally, particles are constrained with map information, and the diversity of the particles is increased by the classified heuristic resampling. Furthermore, MFIPF was implemented on Android phones and extensive experiments were conducted in an indoor environment. For step detection, the proposed ATD achieves 98.1% accuracy, while PD is 91.3% and ZD is 94.3%. For step length estimation, the proposed M-StepLength algorithm is closer to the actual step length. Moreover, the improved KF algorithm has higher accuracy of heading estimation than the SS and CF methods. The performance evaluation of MFIPF shows that the MFIPF has better performance than the traditional methods, including PDR and PF. Meanwhile, it has robustness and needs less power consumption.
Footnotes
Handling Editor: Haosheng Huang
Declaration of conflicting interests
The author(s) declared no potential conflicts of interest with respect to the research, authorship, and/or publication of this article.
Funding
The author(s) disclosed receipt of the following financial support for the research, authorship, and/or publication of this article: This work was supported by Guangzhou Science and Technology Program (15180007), the Fundamental Research Funds for the Central Universities (2015zz100), and Guangdong Provincial Science and Technology program (2013B06180001).