
Abstract
Introduction:
Randomized Controlled Trials (RCTs) are essential to underpin the superiority of novel interventions affecting upper extremity capacity post-stroke. However, many RCTs are underpowered, due to heterogeneity in recovery. Prognostic targeting may help reduce sample sizes while maintaining sufficient power.
Objective:
This study investigates the effects of prognostic targeting on the required sample size to achieve 70% to 90% power in early post-stroke RCTs with upper extremity capacity measured with the Action Research Arm Test (ARAT) as the outcome.
Patients and methods:
Serial data from 4 prospective cohort studies (N = 372 stroke patients) were pooled, with assessments from week 1 to 6 months post-stroke. Using this dataset, we generated synthetic 6-month ARAT outcomes and analyzed data cross-sectionally and longitudinally, with and without prognostic targeting based on a pre-existing prognostic model predicting 6-month outcome. We then calculated power for different sample sizes and assessed trial efficiency, determined by the estimated sample size and inclusion rate.
Results:
Prognostic targeting within 3 weeks post-stroke theoretically reduced the required sample size by up to 56% and improved trial efficiency by 40 to 45% for detecting a 6-point ARAT difference at 6 months. The targeted trials needed 220, 270, and 360 patients vs. 470, 560, and 820 in non-targeted trials for 70% to 90% power. Benefits persisted in longitudinal analyses.
Conclusion:
This study demonstrates the benefits of prognostic targeting for improving power and efficiency in early post-stroke upper extremity trials using ARAT as outcome. We strongly recommend its use in future stroke rehabilitation and recovery studies.
Keywords
Introduction
As a considerable number of stroke patients initially experience upper extremity (UE) impairments, 1 improving UE function and capacity are primary goals in stroke rehabilitation. Despite extensive research into UE rehabilitation interventions, efficacy studies are still needed.2 -4 Randomized Controlled Trials (RCTs) provide a robust design for this purpose. However, conducting RCTs in stroke rehabilitation can involve challenges, such as the burden of trial participation that patients may experience, costs, logistic complexities (e.g., participant recruitment and data collection), and the considerable heterogeneity in the natural time course of recovery which makes it difficult to identify predictive markers of treatment response in an early phase post stroke.5,6 Consequently, most stroke rehabilitation trials are underpowered to detect clinically relevant effects on UE capacity.3,7,8
Literature suggests multiple strategies to improve RCT design and reduce the risk of underpowered trials. One such promising approach is the application of prognostic targeting. Prognostic targeting focuses on identifying subgroups most likely to benefit from an intervention, with the goal of optimizing treatment for those individuals. Prognostic stratification is a prerequisite for targeting, as it classifies populations into risk groups based on prognostic information, facilitating the identification of individuals at risk. While stratification is primarily exploratory, targeting applies this information in practice by directing interventions to individuals most likely to benefit, thereby optimizing clinical outcomes. Literature has demonstrated that using prognostic information to identify subgroups for specific treatments can optimize clinical trial design in stroke populations 9 as well as in other clinical populations.10,11 Specifically, early post-stroke voluntary finger extension has shown promise in showing treatment effects in stroke recovery and rehabilitation trials. 9 Although this strategy reduces the required sample size, it may also lower patient recruitment rates due to stricter inclusion criteria, potentially prolonging the study duration.6,10 Furthermore, the current literature remains inconclusive on the net effect of prognostic targeting. In addition, research indicates that the statistical outcome analysis method can significantly influence statistical power and sample size requirements without affecting recruitment efficiency10,12; for example, adjustment for differences in baseline value of the primary outcome variable is highly recommended to improve prognostic imbalances after randomization. 13 Besides, increasing the number of repeated outcome measures decreases the within patient variability, thereby augmenting statistical power. 14
In this study, we investigate whether prognostic targeting can decrease the required sample size and increase the efficiency, that is, the change in study duration, based on estimated sample size and inclusion rate in RCTs conducted early (within 21 days) post-stroke with Action Research Arm Test (ARAT) (representing UE capacity) as the primary outcome. 15 While studies suggest trials should target patients with specific neurobiological characteristics associated with mechanisms that the intervention being studied aims to target, 16 this information is often not available or feasible to collect in routine practice. Prognostic models based on clinical measures may offer a practical alternative, especially when such biomarkers are unknown, unavailable, or difficult to measure. To illustrate the effects of prognostic targeting, we apply a previously reported mixed-effects model predicting UE recovery trajectories (ARAT scores) up to 6 months post-stroke, using routinely collected clinical measures (finger extension, shoulder abduction, and ARAT). 17 Its ability to provide patient-specific predictions using flexible timing of routinely collected data makes this model useful for predicting the time course of stroke recovery at an individual level and allows stratifying subjects into homogeneous subgroups in stroke recovery and rehabilitation trials. Secondarily, we investigated the impact of prognostic targeting combined with repeated outcome measures and covariate adjustment in a longitudinal analysis.
Patients and Methods
Study Design
This study compares simulated targeted and non-targeted trials to evaluate the impact of prognostic targeting on the required sample size and trial efficiency. In the targeted trials, prognostic targeting was used to only include patients in RCTs who are likely to benefit from the intervention, while in non-targeted trials, all eligible patients are included. Simulated trials were based on pre-existing data of longitudinal ARAT scores as a measure of upper extremity (UE) capacity in stroke patients. UE capacity is defined as an individual’s ability to execute a task or an action, denoting the highest level of functioning of a person in a standardized environment. 18 We evaluated the effects of prognostic targeting on statistical power and sample size requirements, resulting in trial efficiency expressed in trial duration, in both cross-sectional and longitudinal analyses. The latter incorporates repeated outcome measures and adjustment for baseline covariates.
Study Population
We used pooled data from 3 prospective cohort studies and 1 clinical trial on UE recovery collected from 44 different centers in the Netherlands following first-ever ischemic anterior circulation strokes: EPOS, 19 4D-EEG (trial registration number (TRN): NL47079.029.14), 20 EXPLORE (TRN: NL39323.058.12), and EXPLICIT (TRN: NTR1424). 21 Each study involved repeated assessments of the Action Research Arm Test (ARAT) scores post-stroke. All patients were enrolled within 3 weeks of stroke onset and measured in the first week and at varying days thereafter, up to 26 weeks. All studies included first-ever ischemic stroke patients with upper and/or lower motor impairment at admission, without other disabling medical history or severe communication, memory, or understanding impairments. Participants received usual care following Dutch guidelines. 7 This treatment is inherently heterogeneous and includes various patient-tailored interventions. Participants in the EXPLICIT trial were stratified based on voluntary finger extension (VFE) within the first week post stroke and subsequently randomized into (1) early modified constraint-induced movement therapy (mCIMT) or (2) EMG-triggered neuromuscular stimulation (EMG-NMS). Usual care was used as a comparator in both stratified treatment arms. No interaction effects were found for those without VFE receiving EMG-NMS, whereas a 6-point ARAT difference (10%) was found favoring the mCIMT arm at 3 months post-stroke. However, these effects did not sustain at 6 months post-stroke, and no significant effects were observed at the level of motor impairment recovery (i.e., Fugel-Meyer Upper Extremity scores). 21 For the analysis conducted in the present cohort, we disregarded the temporary effects on ARAT found in 29 of the subjects in our analyses. Figures 1 and 2 provide an overview of the data processing and trial simulations, including patient inclusion and exclusion for each analysis.
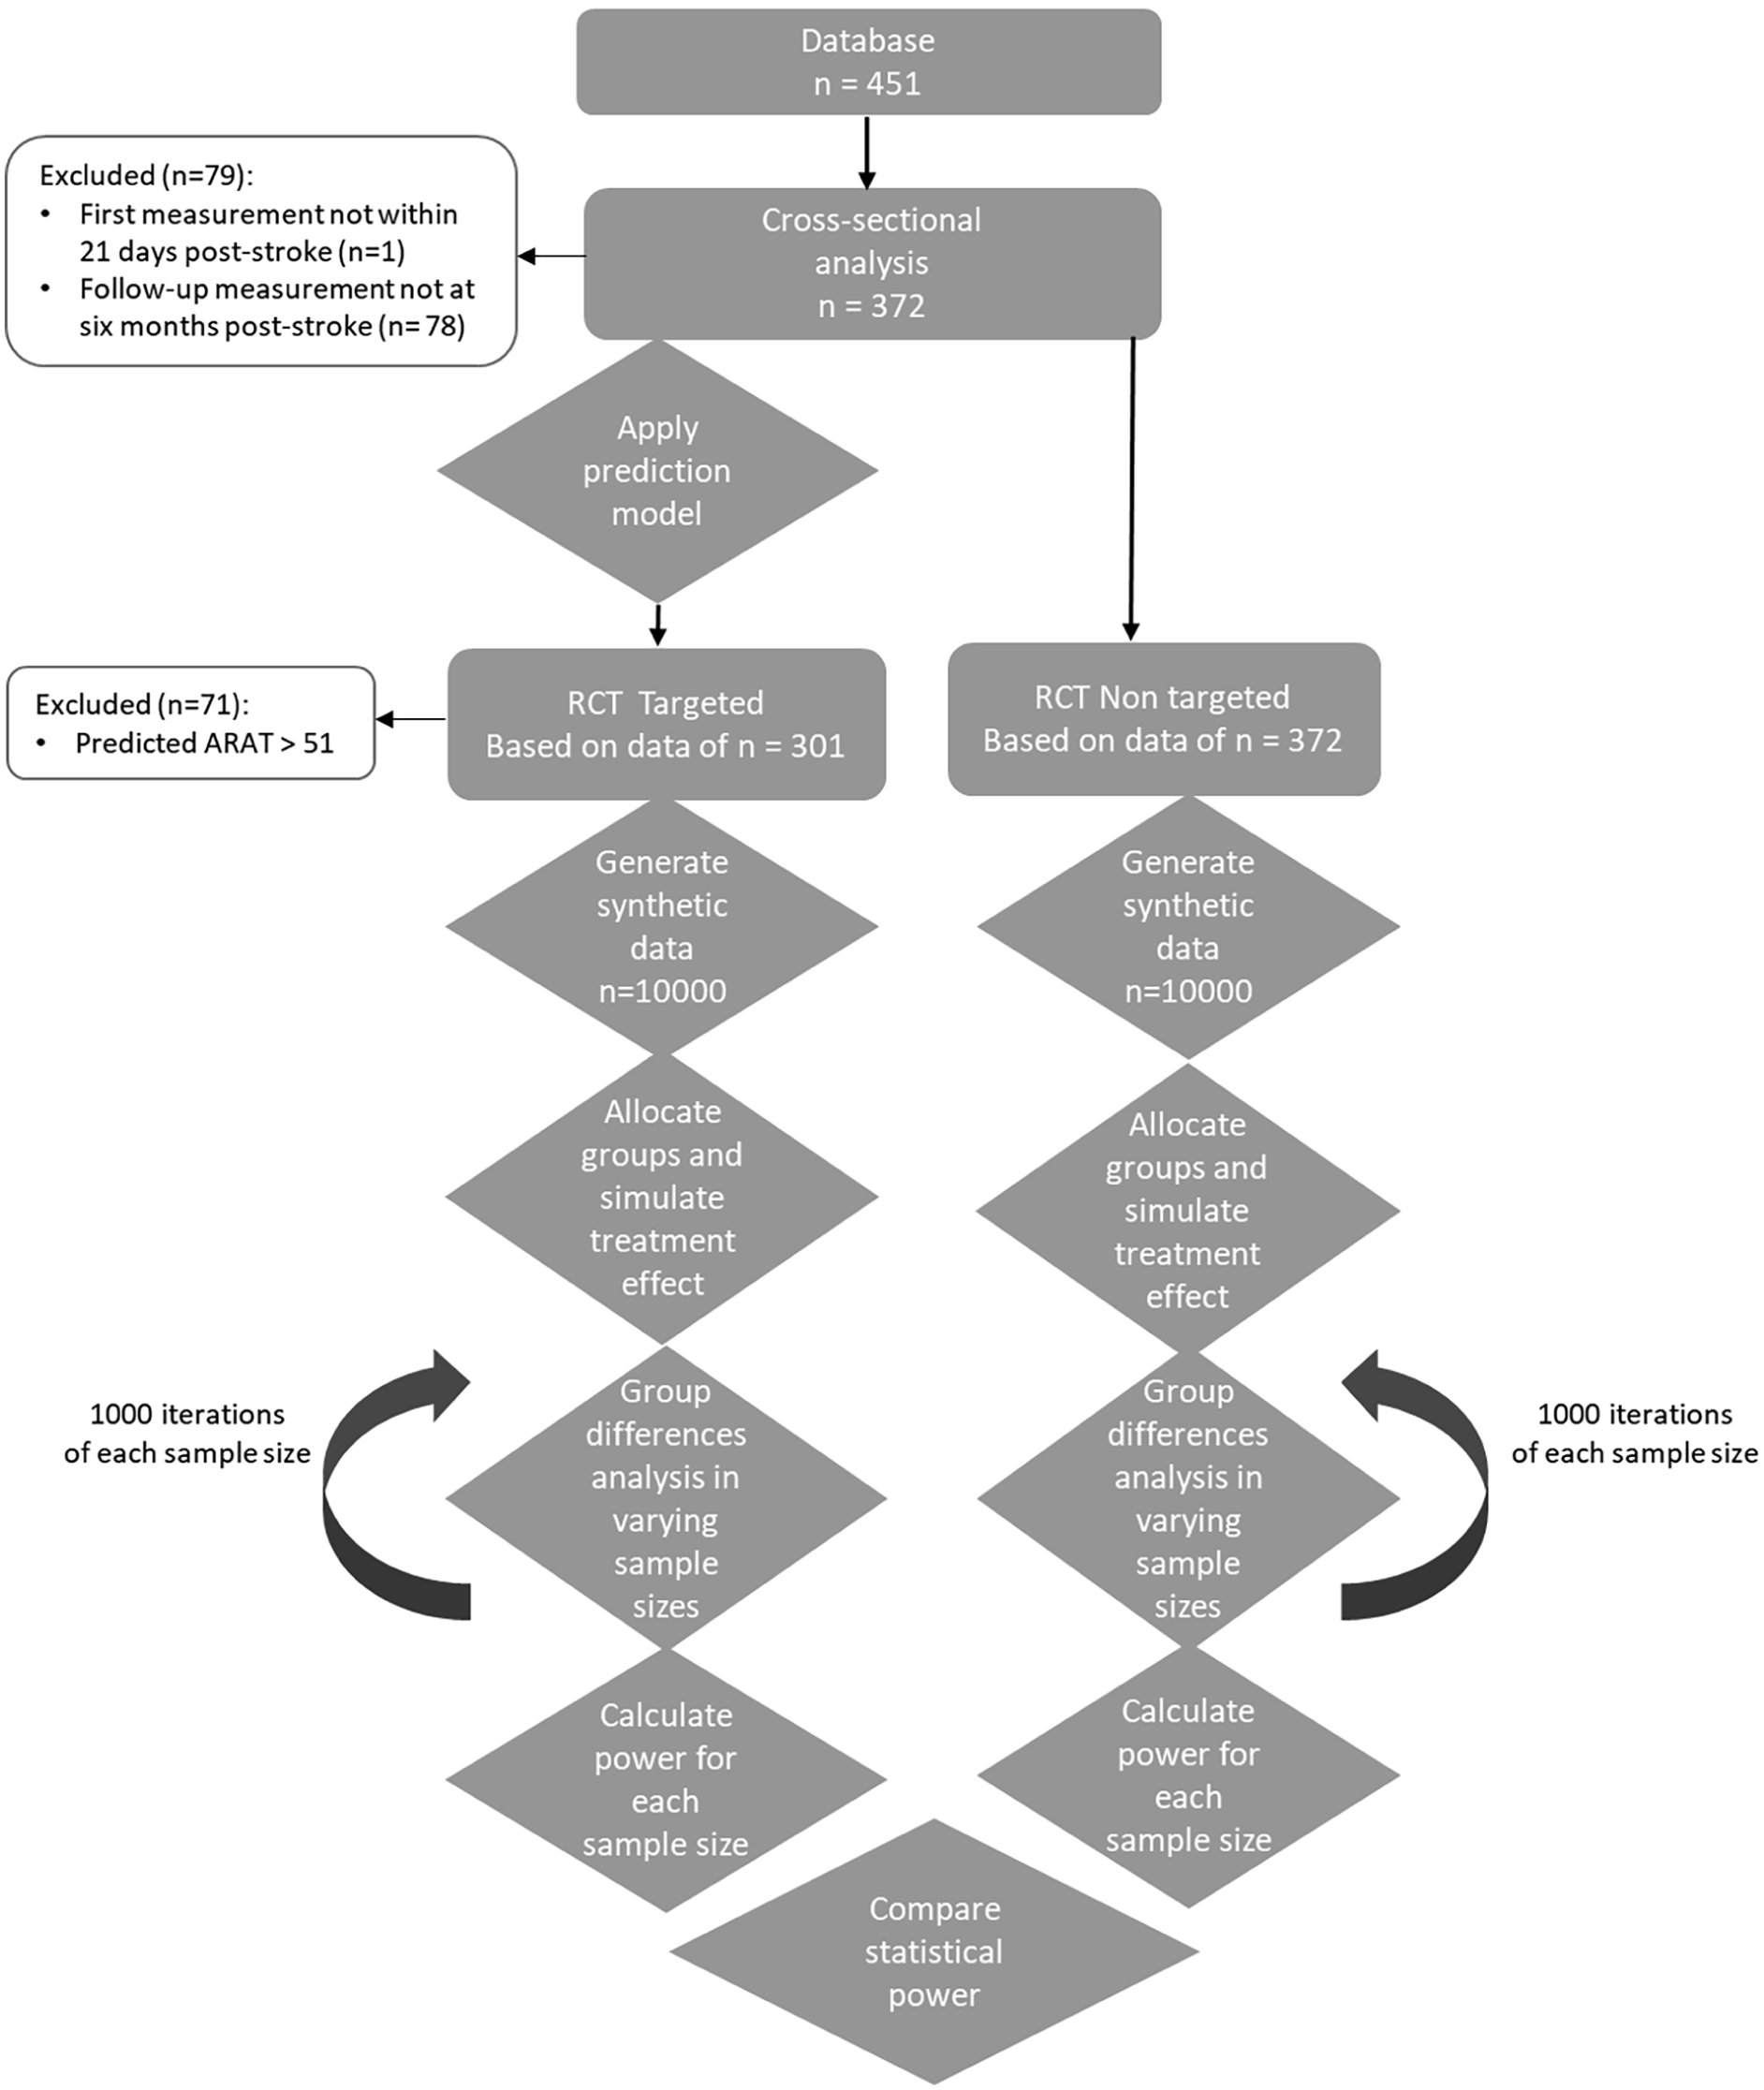
Flowchart of data processing and cross-sectional trial analysis.
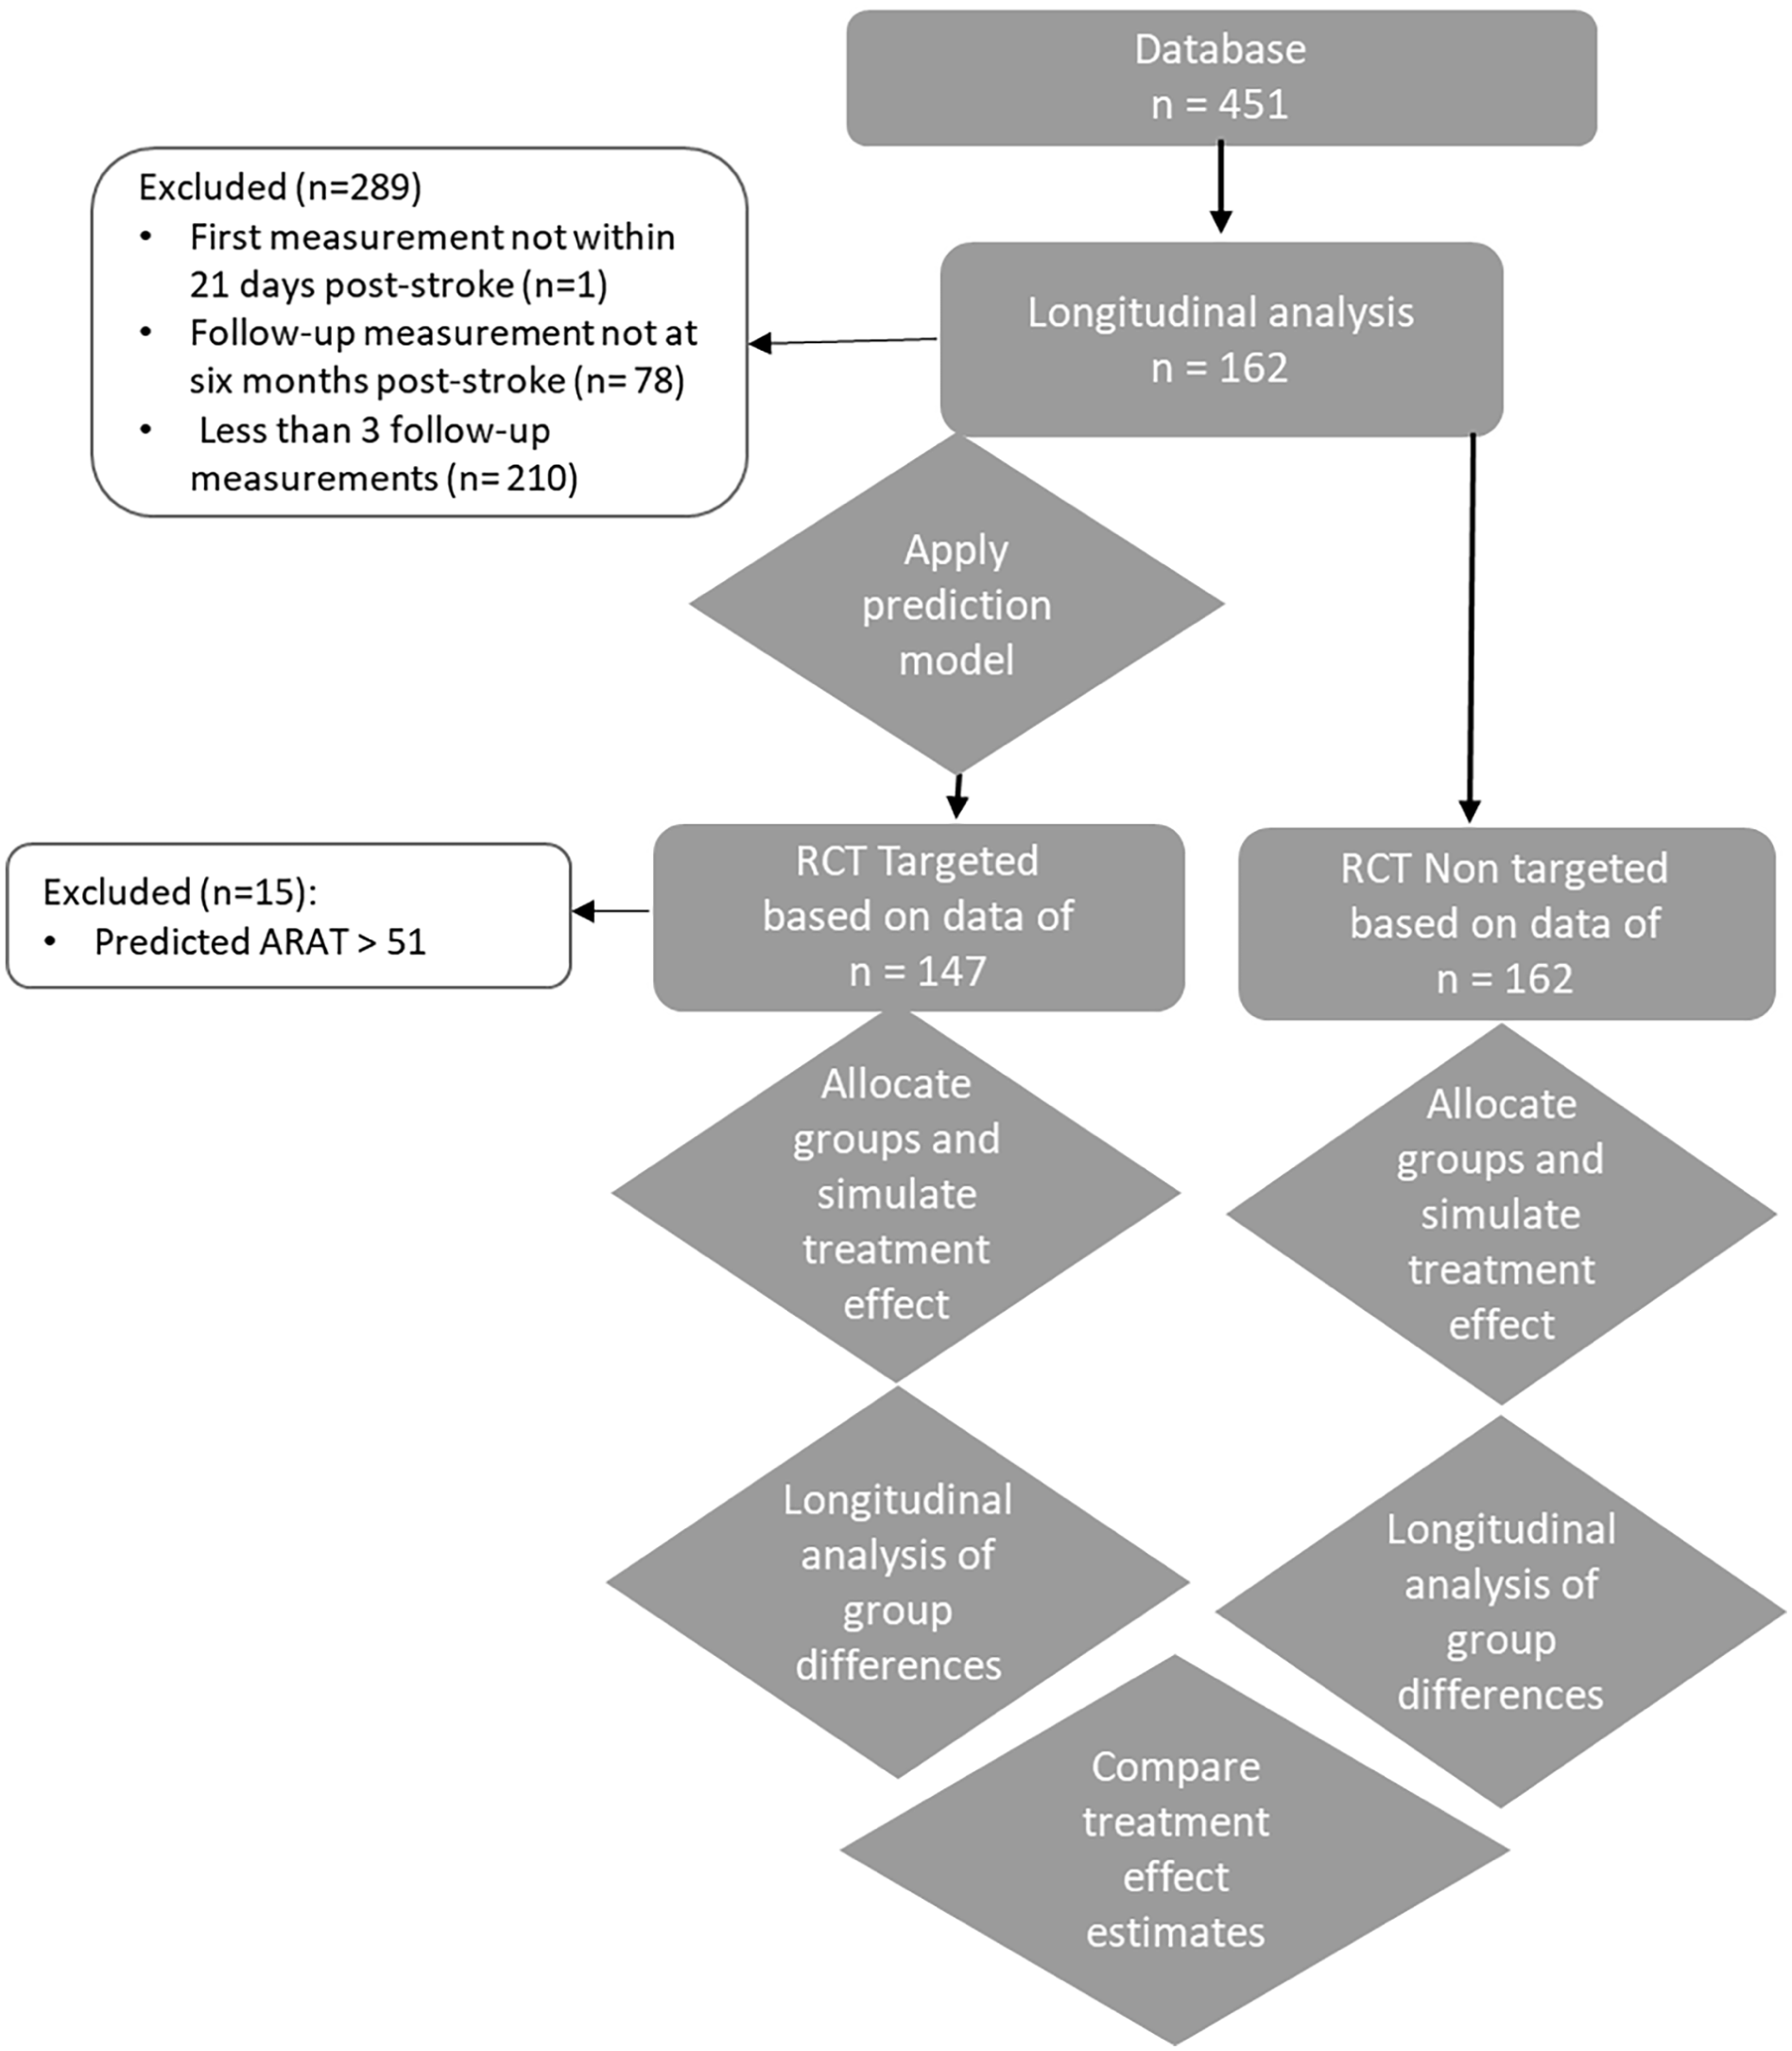
Flowchart of data processing and longitudinal trial analysis.
Prognostic Targeting
We applied a previously reported model predicting ARAT scores early post-stroke. 17 Patients were considered likely to benefit from capacity-enhancing treatment if their predicted ARAT score at 6 months post-stroke was 51 points or less. This strategy aimed to avoid a “ceiling” effect, ensuring that patients had the potential to achieve a treatment effect of at least the Minimal Clinically Important Difference (MCID) of 6 points. 22 We calculated the model’s sensitivity and specificity in predicting an ARAT score of 51 points or less by comparing the predicted outcomes to the actual outcomes. Additionally, we evaluated the effect of prognostic targeting with hypothetical prognostic models with various levels of sensitivity and specificity, ranging from 0.5 to 1, and repeated the procedures accordingly (Appendix 1).
Cross-Sectional Trial Simulation at 6 Months Post-Stroke
Generation of a Synthetic Dataset
By sampling with replacement from the distribution of the original ARAT scores at 6 months post-stroke, we generated a synthetic dataset with ARAT scores for 10 000 hypothetical patients with ARAT scores similar to those in the original datasets (n = 372 for the non-targeted trial and n = 301 for the targeted trial).
Group Allocation and Simulation of a Treatment Effect
The simulated cross-sectional dataset (n = 10 000) was randomly divided into a treatment or control group in a 1:1 ratio. After group allocation, we simulated a hypothetical treatment effect for the treatment group and applied it to the ARAT profiles under standard treatment conditions. This novel treatment effect was defined as an average of 6 points with a standard deviation of 11 points added to the ARAT at 6 months post-stroke (referred to as Δ ARAT). The 6-point average was used since this is reported as the MCID for ARAT within this population. 22 To allow for between-patient variability, we sampled the treatment effect from a normal distribution characterized by a mean of 6 points and a standard deviation of 11 points. 23
Statistical Power and Required Sample Size
To calculate the statistical power for detecting a difference in ARAT scores 6 months post-stroke between control and intervention groups, we performed a cross-sectional analysis of ARAT data in simulated trials with varying sample sizes of patients randomly drawn from the synthetic dataset. We started with a sample size of N = 100 (N = 50 per group) and increased the sample size in steps of 10 patients to a maximum of 5000 patients per trial.
For each sample size, we performed a Mann-Whitney U test to calculate the P-value for the difference between the intervention and control groups across all 1000 simulated trials. We used a significance level (α) of 0.05 to assess whether to reject the null hypothesis. Power was quantified as the proportion of these simulated trials that detected a statistically significant difference in ARAT scores 6 months post-stroke. We visualized the relationship between sample size and statistical power using power plots and reported the required sample size to achieve statistical power of 70%, 80%, and 90% for both targeted and non-targeted trials.
Efficiency
Since prognostic targeting both reduces the number of eligible patients and the number of patients required to detect a treatment effect, we calculated efficiency as a measure of both effects combined. Specifically, we calculated the study duration for the targeted trial relative to the non-targeted trial by dividing the required sample size of the targeted trial by that of the non-targeted trial and subsequently dividing this ratio by the recruitment rate: (required sample size targeted/required sample size non-targeted)/recruitment rate. 10 The recruitment rate reflects the proportion of patients included in the targeted trial based on its eligibility criteria, compared to those included in the non-targeted trial based on its eligibility criteria. For example, if a non-targeted trial requires 180 participants and we could design a targeted trial that requires 100 participants, but only 60% of the original patients meet the targeted eligibility criteria, then the relative study duration would be (100/180)/0.6 = 0.93. Thus, in this example, the targeted trial reduces the recruitment time by 7% compared to a non-targeted stroke recovery and rehabilitation trial.
Longitudinal Trial Simulation
The impact of prognostic targeting on the required sample size and efficiency was further evaluated using a longitudinal analysis, which included repeated outcome measures and covariate adjustment. We fitted a marginal regression model to analyze the effect of treatment on ARAT scores over time. This analysis considered 3 repeated outcome assessments, measured between 3 weeks and 6 months post-stroke. Consequently, individuals from the dataset with fewer than the specified number of outcome assessments within this time interval were excluded from the analysis.
Figure 2 provides an overview of the data processing and longitudinal analysis, including the inclusion and exclusion process. As shown, the longitudinal analysis was conducted using the sample available in the original dataset rather than varying sample sizes of synthesized data. Consequently, we could not calculate statistical power for varying sample sizes. Instead, we compared treatment effect size estimates between the targeted and non-targeted trials, since effect size is a key factor in determining statistical power.
Group Allocation and Simulation of a Treatment Effect
Participants were randomized to a treatment or control group in a 1:1 ratio. After group allocation, we modeled a hypothetical novel treatment effect in the same way as described in the cross-sectional trial simulation section. We assumed the treatment effect would follow a linear trend from 3 weeks post-stroke, persisting until the end of the 6-month follow-up period.
Prognostic Targeting
We applied a prediction model, 17 as described in the section Prognostic Targeting, on the data of 162 patients included for the longitudinal analysis and reported the models’ performance. Next, we followed the steps described below to analyze the data of the targeted trial.
Estimating Treatment Effect
To estimate the treatment effect, we fitted a marginal regression model using Generalized Least Squares (GLS), including linear time evolutions and accounting for within-subject correlation through a first-order continuous autoregressive correlation (CAR1) structure. 13 The outcome of the model is the ARAT score, measured longitudinally at multiple time points up to 6 months post stroke. The model includes the following covariates: group representing the baseline difference in ARAT scores between the intervention and control groups at the start of the follow-up; time, representing the change in ARAT scores per day in the control group; and the interaction between time and group, representing differential change in ARAT scores over time between groups (i.e., the treatment effect per day). The intercept represents the estimated baseline ARAT score for the control group. Together, these terms capture the longitudinal trajectory of motor recovery in each group and quantify the evolving treatment effect over time. This analysis was performed on the data from non-targeted and targeted trials, and treatment effect estimates were compared.

Yt = ARAT score measured at multiple follow-up time points; B0 = the intercept, which represents the estimated ARAT score at the first follow-up time after intervention onset for the control group; B1group = group term, representing the difference in ARAT between intervention and control groups at intervention onset; B2time = time term, representing the change in ARAT over time in the control group; B3group*time = the interaction term, reflecting the treatment effect per day. Covariate-adjusted estimate of treatment effect.
To address baseline differences in ARAT score (reflected in the group covariate), we adjusted for the baseline ARAT score (the first available ARAT score measured within 21 days post-stroke, before intervention onset) by adding this variable within the longitudinal regression analysis.21,24 This approach yielded adjusted estimates of treatment effects. We compared treatment effect estimates resulting from the adjusted analysis (equation (2)) to the effects resulting from the unadjusted analysis (equation (1)) and between the non-targeted and the targeted trials. No additional covariates were tested or included in the model, as our goal was to assess the effect of adjusting for the baseline variable.

Yt = ARAT score measured at multiple follow-up time points; B0 = the intercept, which represents the estimated ARAT score at the first follow-up time after intervention onset for the control group; B1group = group term, representing the difference in ARAT between intervention and control groups at intervention onset; B2time = time term, representing the change in ARAT over time in the control group; B3group*time = the interaction term, reflecting the treatment effect per day; B4arat0 = baseline ARAT term, representing the initial ARAT score measured prior to intervention onset and follow-up.
Software
All statistics were performed in RStudio (Version 4.4.1). We used the package “tidyverse” to extract baseline characteristics, filter the dataset, and perform simulations. The “plotly” package was used to create figures. Packages “nlme” and “lme4” were used to fit the marginal regression models and the prediction model for prognostic targeting and package “Caret” to evaluate the model’s performance.
Results
Study Population
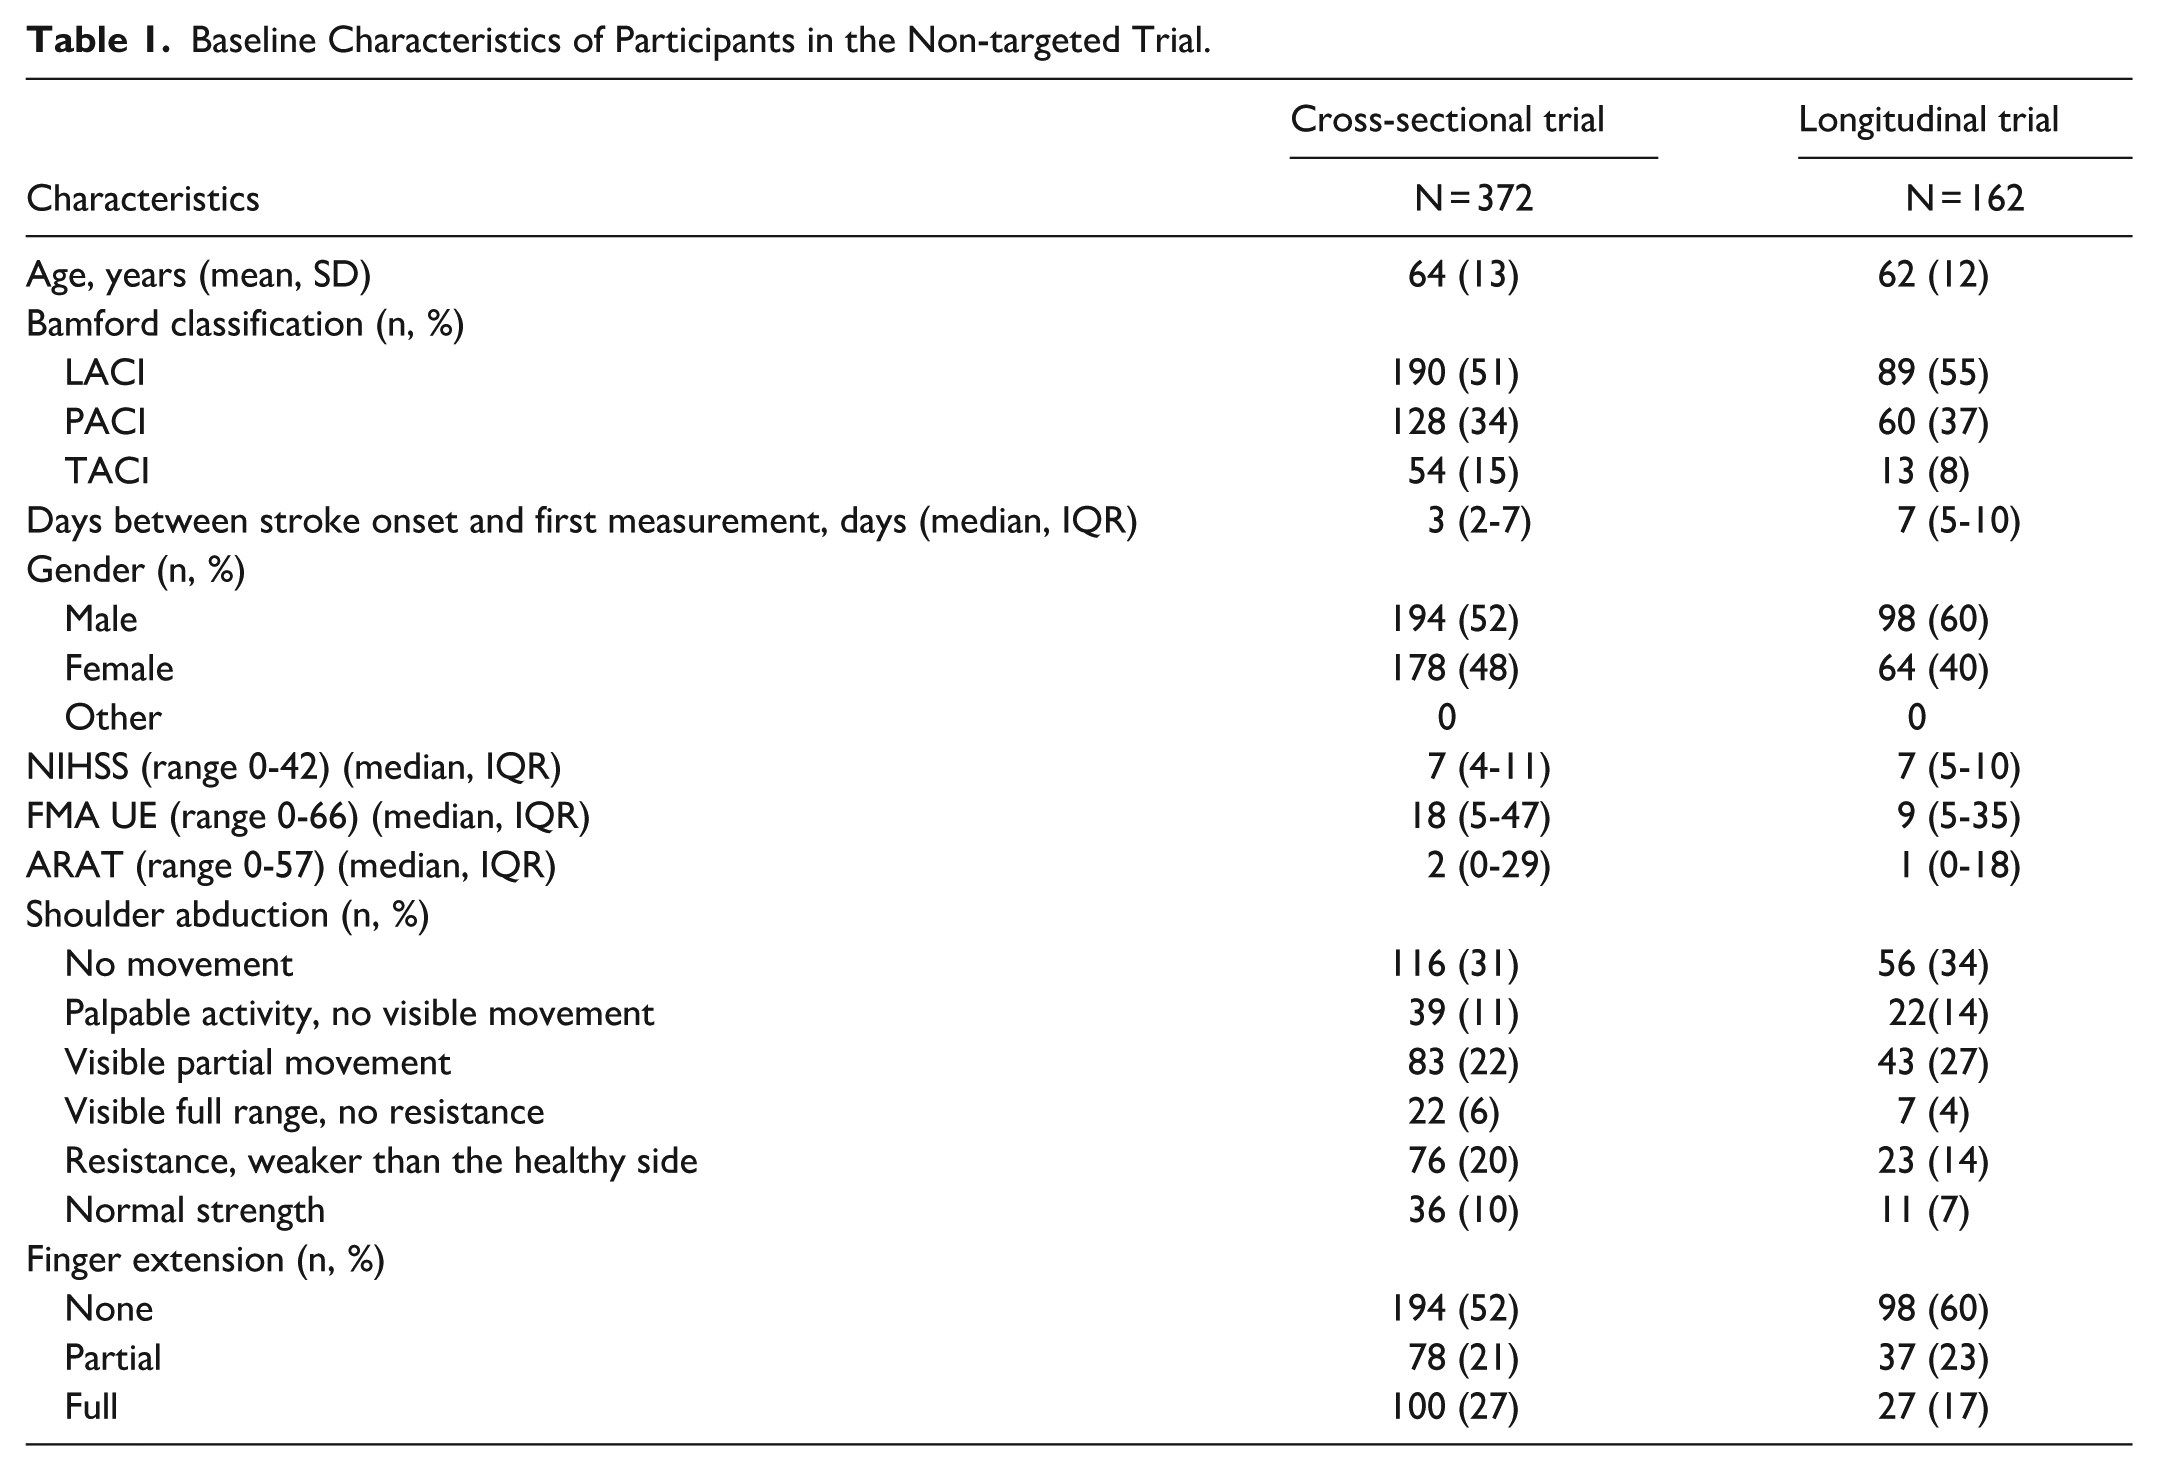
The initial dataset included 451 individuals who experienced their first-ever ischemic hemispheric stroke. In this study, participants were excluded from further analysis if they did not have at least 2 measurements with a final repeated measurement between 170 and 220 days post-stroke (N = 79). Among the 372 patients included in further analysis, 52% were male, with an average baseline age of 64 years (Table 1). Assessments were conducted multiple times for each patient, with a median of 6 assessments (IQR: 4-8) and an average follow-up period of 189 days. At intervention onset (day 21), the average Action Research Arm Test (ARAT) score was 14 (SD: 19). The distribution of baseline ARAT scores was strongly right-skewed due to a significant number of patients scoring 0 or 1 in the early post-stroke phase.
Baseline Characteristics of Participants in the Non-targeted Trial.
Required Sample Size and Power
Figure 3 presents the statistical power in the cross-sectional analysis for both targeted and non-targeted trials across different sample sizes and shows theoretically reduced sample sizes required for the targeted trials. More specifically, to achieve a power of 70%, the targeted trial required 220 patients compared to 470 patients in the non-targeted trial, representing a 53% reduction. For a power of 80%, the targeted trial required 270 patients compared to 560 patients in the non-targeted trial (51% reduction). For a power of 90%, the targeted trial required 360 patients compared to 820 patients in the non-targeted trial (56% reduction).
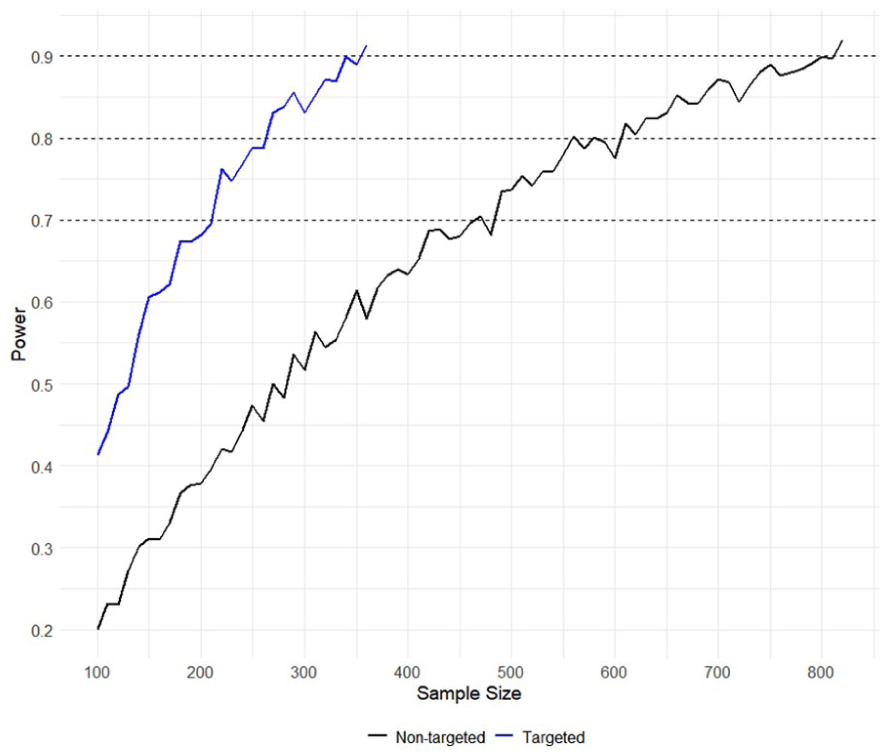
Power analysis comparing the targeted and non-targeted trials.
The performance of the model used for prognostic targeting showed good sensitivity and low specificity to predict ARAT ≤51 at 6 months post-stroke in the dataset (sensitivity 0.97; specificity 0.43).
Efficiency
The study duration of the targeted trials theoretically decreased by 40% to 45% relative to the non-targeted trial. The results for each level of power are presented in Table 2. For clarification, 270 participants were required to achieve 80% statistical power in the targeted trial, compared to 580 participants in the non-targeted trial. However, the recruitment rate decreased to 80% in the targeted trial, as only 301 out of 372 participants were eligible. Consequently, the study duration of the targeted trial is 0.60 (formula: (270/560)/0.8) compared to the non-targeted trial, signifying a theoretical 40% decrease in study duration.
Sample Size and Study Duration for Targeted Trials.
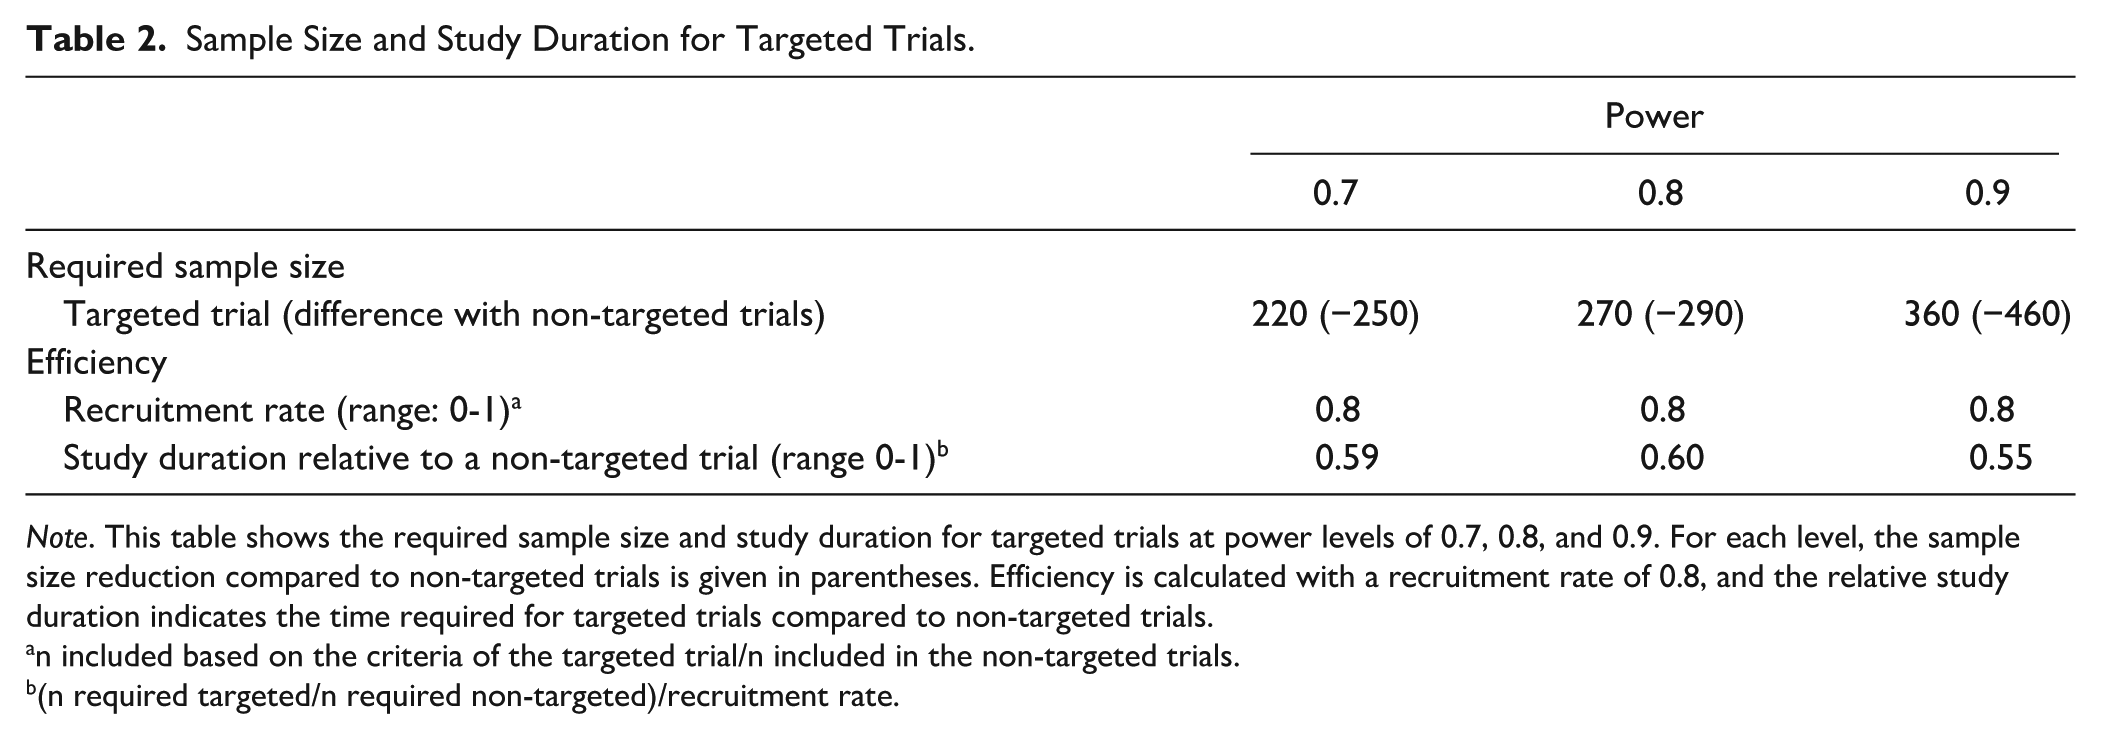
Note. This table shows the required sample size and study duration for targeted trials at power levels of 0.7, 0.8, and 0.9. For each level, the sample size reduction compared to non-targeted trials is given in parentheses. Efficiency is calculated with a recruitment rate of 0.8, and the relative study duration indicates the time required for targeted trials compared to non-targeted trials.
n included based on the criteria of the targeted trial/n included in the non-targeted trials.
(n required targeted/n required non-targeted)/recruitment rate.
Additionally, Appendix 1 shows the required sample sizes at 70%, 80%, and 90% statistical power based on hypothetical models predicting ARAT scores below or equal to 51 with different levels of sensitivity and specificity (ranging from 0.5 to 1). This analysis demonstrates that models with higher specificity and, to a lesser extent, sensitivity, are theoretically more efficient in including patients with the prognosis of interest. For example, a model with a specificity of 0.6 and a sensitivity of 0.6 requires a sample size of N = 390 for 80% power. However, a model with a specificity of 0.9 and a sensitivity of 0.7, requires a sample size of N = 130 for 80% power, signifying a theoretical 67% decrease in the required sample size. Better efficiency translates into a stronger reduction in the required sample size for detecting treatment effects and substantially enhances trial efficiency by shortening the recruitment period.
Longitudinal Trial Analysis
The longitudinal analyses (see Methods: equation (1)) of 162 participants in the non-targeted trial and 147 participants in the targeted trial revealed significant interaction effects between time and treatment in both trials, with a larger effect size and a smaller P-value in the targeted trial (Bgroup*time = 0.04, P = .02 in the non-targeted trials compared to Bgroup*time = 0.06, P = .00 in the targeted trial). This indicates that in a longitudinal analysis, the targeted approach still achieves higher statistical power, resulting in a lower required sample size.
Covariate Adjusted Analysis
The beneficial effects of the targeted approach on statistical power and sample size are unaffected by covariate adjustment. However, the longitudinal analysis adjusted for the baseline ARAT score (see Methods: equation (2)) revealed significant effects of baseline ARAT on the ARAT score at 6 months post-stroke in both the non-targeted and targeted trials (resp.: B = 1.08, P = .00; B = 0.872, P = .00) and reduced the initial differences in ARAT scores between the groups at treatment onset (resp.: Bgroup = −2.58, P = 0.33; Bgroup = −0.90, P = 0.69 in the adjusted analysis compared to Bgroup = −2.83, P = 0.33 and Bgroup = −5.58, P = 0.14 in the unadjusted analysis).
Discussion
We investigated the impact of prognostic targeting on sample size and efficiency in simulated early post-stroke RCTs, with upper extremity (UE) capacity at 6 months as the primary outcome. The results demonstrate that using a previously established prognostic model, used within patients enrolled within the first 3 weeks post-stroke to predict 6 months post-stroke ARAT scores, 17 can theoretically reduce required sample sizes by up to 56%, depending on the desired statistical power required to prevent type II error. This approach also increased trial efficiency, theoretically shortening study duration by 40% to 45%. The benefits of prognostic targeting were maintained in longitudinal analyses. Furthermore, the longitudinal analyses, which included only 162 patients in the non-targeted trial and 147 in the targeted trial, revealed statistically significant treatment effects. This indicates that the use of repeated outcome measures increases statistical power and reduces the sample size required to detect significant treatment effects. Based on these results, we recommend that researchers adopt prognostic targeting and consider longitudinal analysis with repeated outcome measures in RCTs evaluating treatment effects on UE capacity to optimize statistical power and efficiency, reduce required sample sizes, and thereby minimize unnecessary participation and the associated burden.
The beneficial effects of prognostic targeting on statistical power observed in this study align with findings in the existing literature, with our results suggesting an even greater impact. For instance, prognostic targeting has demonstrated improvements in both statistical power and efficiency in RCTs assessing functional outcomes in TBI patients. 10 In the aforementioned study, researchers compared using specific baseline information as enrollment criteria with prognostic targeting using a prediction model. They found that prognostic targeting was beneficial, reducing the required sample size by up to 24%, compared to a 5% reduction based on the use of specific enrollment criteria. 10 Additionally, while applying the specific enrollment criteria negatively affected trial efficiency (i.e., increasing the total study duration), prognostic targeting enhanced efficiency, reducing study duration by 22%. 10 These findings align with our results and further support the use of prognostic targeting over alternative methods such as strict selection criteria. Another study examining prognostic stratification based on voluntary finger extension in stroke rehabilitation RCTs with ARAT as the outcome reported a 16% reduction in sample size when voluntary finger extension was present and a substantial reduction of 93% when it was absent in patients enrolled within the first 3 weeks post-stroke. 9 These findings support that the selection of the targeted groups and the level of homogeneity within those groups are essential factors in determining sample size requirements.
The effects of prognostic targeting on sample size and efficiency also largely depend on the prediction performance of the selected prognostic model. The model used to illustrate prognostic targeting in this study was developed using the same dataset. 17 It has been externally validated, yielding similar prediction errors to those in the original dataset. 25 However, it was specifically developed to predict ARAT curves up to 6 months post-stroke and demonstrated relatively low specificity when applied beyond its intended purpose for predicting dichotomized ARAT (ARAT ≤ 51 or >51). This low specificity led to including a relatively large sample of patients who were predicted to achieve good recovery regardless of the experimental intervention. To provide a broader perspective on the effects of prognostic targeting beyond this specific model, we also analyzed the impact of potential future improvements of sensitivity and specificity of the prediction models and their effect on statistical power. This analysis showed that improving model performance reduces the required sample size and theoretically increases trial efficiency. Even in cases where improvements in trial efficiency are modest, there can still be significant ethical benefits, as fewer patients who are unlikely to benefit from the treatment are included, thereby reducing unnecessary exposure to ineffective interventions. Based on these results, we recommend that researchers carefully select a prognostic model for prognostic targeting, considering the model’s performance within the specific study population. Ultimately, the availability of an appropriate prognostic model is a prerequisite for successfully applying targeting.
Further attention should be given to the development of prognostic models. Given the recent technical advancements described regarding the development and refinement of prognostic models, prognostic targeting is expected to become increasingly effective. 26 Next to clinical markers, neurophysiological and neuroimaging biomarkers, reflecting corticospinal tract integrity, should be considered in model development.27,28 Although these biomarkers are not routinely available in clinical practice, their inclusion in prognostic models could enhance predictive accuracy,28,29 particularly for patients without voluntary motor control in the first days post stroke. Recently, neuroimaging variables such as collateral grading and (re)perfusion state of non-infarcted penumbral tissue have been shown to have significant added value for predicting global disability at 3 months post stroke. 30 This finding is the main reason for funding the Dutch CONTRAST consortium, 31 where acute intervention radiologists, neurologists, and rehabilitation and movement scientists work together to improve phenotyping individual time courses early post stroke and with that improving triage of subjects within stroke services in the Netherlands. Moreover, when designing a trial, it is important to consider the underlying mechanisms targeted by the intervention being studied. 32 If characteristics related to these neurobiological mechanisms are known and quantified, selecting patients based on their potential to show interaction effects with the intervention of interest may have an added value in targeting outcome.
This study demonstrates favorable effects of prognostic targeting in both cross-sectional and longitudinal analyses. However, due to the relatively limited size of the dataset, we could not directly compare statistical power gains and sample size reductions in simulations of longitudinal trials with varying sample sizes. Furthermore, we did not evaluate the incremental benefit of increasing the number of repeated measures in the longitudinal analysis, an important consideration given that the literature suggests the advantage of repeated measurements on the required sample size may plateau as the number of measures increases. 14 Generating a synthetic dataset that allows such analysis involves complex statistical modeling, including synthesizing both predictor and outcome data while accounting for the interdependency of variables and repeated measures for each participant. To our knowledge, these approaches are not yet widely validated or implemented, 33 and addressing this complexity was beyond the scope of our study.
This study also has some limitations that could affect the generalizability of its findings, particularly related to the dataset and the assumptions underlying the simulated treatment effect. By assuming a uniform treatment effect that evolves linearly between 3 weeks and 6 months post-stroke, we did not account for inter-individual variability in treatment responses. While we introduced some variability among participants by incorporating the standard deviation of the treatment effect reported in a comparable population, this approach still simplifies the real-world complexity of treatment responses and disregards the potential influence of the timing of randomization and treatment initiation. 9 Furthermore, we did not account for dropouts in our sample size calculations, even though they can reduce the statistical power of a trial by lowering the final sample size. To maintain power, researchers should adjust the initial sample size based on the expected dropout rate.
Conclusion
This study demonstrates significant benefits of prognostic targeting on statistical power and efficiency in upper extremity stroke rehabilitation trials using ARAT as an outcome measure. We strongly recommend incorporating prognostic targeting in stroke rehabilitation research, particularly given the frequent challenges of underpowered trials and recruitment difficulties. Moreover, ethical considerations, such as minimizing patient exposure to potentially ineffective interventions, and practical advantages, such as reducing trial duration and associated costs, further support its implementation.
Footnotes
Appendix
Author Contributions
Data Availability Statement
Data are available on reasonable request.
Declaration of Conflicting Interests
The authors declared no potential conflicts of interest with respect to the research, authorship, and/or publication of this article.
Funding
The authors disclosed receipt of the following financial support for the research, authorship, and/or publication of this article: This research was conducted as part of the ArmCoach4Stroke project, funded by ZonMW, Grant N-10-10400-98-18055.
Ethical Approval and Informed Consent
The studies were approved by the medical ethics committees of VU University Medical Center (NL47079.029.14) and Leiden University Medical Center (NL39323.058.12), in accordance with the Declaration of Helsinki. All participants provided written informed consent before enrollment in the respective studies.