
Abstract
Background
How gait changes during the early stages of stoke rehabilitation, and which patient characteristics are associated with these changes is still largely unknown.
Objective
he first objective was to describe the changes in gait during stroke rehabilitation. Secondly, we determined how various patient characteristics were associated with the rate of change of gait over time.
Methods
Participants were measured every 3 weeks during stroke rehabilitation. The assessment consisted of an inertial measurement unit (IMU) based 2-minute walk test (2MWT), 3 IMU-based balance tests, and standard clinical tests. In the 2MWT, participants were equipped with 3 IMUs, from which speed, variability, asymmetry, and smoothness were calculated. The changes in gait were examined from admission to discharge at an individual level. The effect of patient characteristics on the rate of change of the gait features over time was assessed with growth models.
Results
A total of 81 Trajectories from 72 participants were analyzed. On an individual basis, speed increased in 32 trajectories. Only a few trajectories exhibited significant changes in variability, asymmetry, and smoothness over the clinical rehabilitation period. The growth models revealed a significant increase in speed and decrease in variability and smoothness. Only the Berg Balance Scale and gait speed at onset were (negatively) associated with the rates of change of speed and smoothness, respectively.
Conclusion
We found a substantial variability in the gait-feature outcomes and their progression in individuals after stroke during clinical rehabilitation. The patient characteristics studied had limited associations with the rate of change of gait features over time.
Keywords
Introduction
Stroke is a leading cause of long-term disability worldwide, often resulting in sensorimotor impairments including reduced motor control, spasticity, muscle weakness, and proprioceptive deficits. 1 These impairments can significantly impact people after stroke, hamper their gait, and subsequently reduce walking performance, mobility, independence, and overall quality of life.2 -4 Stroke rehabilitation aims to improve functional walking, that is, one’s ability to walk in daily life, by applying the most effective strategy to facilitate recovery and training individuals to cope with their impairments.5 -11 Currently, in clinical rehabilitation, gait function is predominantly assessed via a measurement of gait speed. 12 Gait speed is a valid, reliable, accessible, and sensitive measure of functional status and overall health in the stroke population.13 -15 Other gait features, for example, stability, variability, symmetry, are not yet routinely measured during clinical rehabilitation, as this is typically expensive and time-consuming, requires specific expertise, and the applicability of the results is still largely unknown.16,17 Nevertheless, evidence suggests that these other gait features provide clinically relevant information, as they are associated with the degree of recovery and the fall risk after stroke.18 -20 Moreover, it is conceivable that these other gait features yield information regarding the potential to improve functional walking.
Gait can be measured with multiple tools, such as motion capture systems, force plates, and inertial measurement units (IMUs).20 -28 Among these, IMUs might be the most feasible in clinical practice, given their small size, low cost, and ease of operation. Various studies assessed the relationship between gait features and functional walking in people after stroke.21 -23 Two recent studies indicated that the quality of joint movements, measured with the gait profile score (deviation of kinematic gait data relative to normative data) and the knee joint flexion during pre-swing and swing phase were associated with walking performance.21,22 Contrary, Kim and Eng 23 found that gait features closely resembling those of healthy individuals do not necessarily coincide with better functional walking. The findings of Kim and Eng (2004) might be explained by the fact that people after stroke often use behavioral compensation strategies to improve their functional walking.6 -9 Behavioral compensation strategies help individuals to cope with their impairments during walking, which varies between individuals depending on their specific impairments. Consequently, gait features might change in opposing directions for individuals during clinical stroke rehabilitation, both resulting in an improvement of functional walking. To get insight into the changes in gait features over time, and how these changes are related to functional walking, studies with a longitudinal design are required.
Several studies have investigated changes in gait features over time after stroke.27 -29 For instance, Chow and Stokic, 27 assessed the changes in spatio-temporal gait characteristics during the first-year after stroke, including gait speed and symmetry. They found an improvement in the majority of the spatio-temporal gait characteristics in the first 6 months. However, only a few individuals showed significant improvement in these gait characteristics in the following 6 months. Kollen et al 29 determined changes in functional walking, measured with the Functional Ambulation Categories (FAC), over time, and assessed the relationship between functional walking and time and time-dependent patient characteristics during the first-year post stroke. They concluded that the more pronounced improvements in functional walking occurred in the earlier stages after stroke. Furthermore, they found that improvements in standing balance were associated with improvements in functional walking. In addition to standing balance, evidence suggests that there are other time-dependent and time-independent characteristics that are associated with or have predictive value for the level of functional walking after stroke.30 -32 For example, age and functional level at admission seem to be linked to the level of motor function after stroke. 30 Accordingly, these characteristics may be associated with the rate of change of gait features as well.
To gain a more comprehensive insight into the dynamics of gait recovery in the early phase after stroke, this study had 2 objectives. The first objective was to describe the alterations in gait, measured with IMUs, during clinical stroke rehabilitation. Secondly, we investigated how various characteristics at baseline affect the rate of change of gait over time, aiming to identify and understand potential facilitators, and barriers of gait recovery in stroke rehabilitation. This research contributes to the refinement of our understanding of gait recovery after stroke and therefore potentially provides directions to further personalize stroke rehabilitation by tailoring interventions, providing better prognosis, and managing patient expectations.
Methods
Participants
Longitudinal data were collected from individuals after stroke between January 1, 2021, and July 1, 2023, in 5 clinical rehabilitation centers in the Netherlands. The inclusion criteria for the study were as follows: (1) participants aged 18 years or older; (2) capable of understanding and signing the informed consent document; (3) able to perform simple tasks; and (4) first-ever or recurrent stroke. Participants were excluded from the study if only a single assessment was obtained, ensuring that analyses were based on individuals with multiple data points. Participants provided written informed consent before participating. The Medical Ethical Review Committee of Utrecht approved the protocol (20-462/C).
Assessment
Before the assessment, demographic and stroke-specific characteristics were collected, including sex, age, stroke type and side, and pre-morbid walking aid use. The assessment consisted of 3 parts and was administered by an experienced physiotherapist or trained research assistant every 3 weeks. Data were collected from participants as soon as they were able to walk a minimum of 8 meters within 2 minutes without physical assistance, extending up to the point of discharge. 24
In the first part, participants walked for 2 minutes at a self-selected speed on a 14-m walking path. Three IMUs consisting of a triaxial accelerometer and gyroscope, were used (created by Aemics b.v. Oldenzaal, The Netherlands). Two IMUs were attached on top of the left and right foot at the height of the cuneiform bones, and 1 IMU was attached to the lower back at the height of L5 using elastic bands. The IMUs measured with a sampling frequency of 104 Hertz. Participants were allowed to walk with a walking aid during the walking test. 24 If participants with a walking aid were also able to safely walk without walking aid, the walking test was administered under both conditions.
In the second part, the 3 balance conditions were used to measure postural sway. The balance conditions were arranged based on difficulty and executed in the following order (1) Sitting unsupported on a balance cushion with feet touching the ground and knees in a 90° angle for 60 seconds. (2) Standing with feet in a self-selected position for 60 seconds. (3) Standing with eyes closed and feet in a self-selected position for 30 seconds. 33 The sensor was placed at the back, at the level of T7 during sitting and L5 during standing, to represent the center of mass during the test.
In the third part, several standard clinical tests were administered. These included the Berg Balance Scale (BBS) 34 and Barthel Index (BI) 35 at admission, and the FAC, both with and without a walking aid. 36
Data Processing
The collected IMU-based gait and balance data underwent digital processing on a custom-made online platform, where data were processed and stored. The IMU data were processed by, first, resampling the data to 100 Hz and correcting the gyroscope offset. Next, gait and balance features in various domains were calculated.24,33
Gait Data
Gait was described using 4 gait features, namely: speed (m/s), asymmetry, smoothness, and variability (s). These 4 gait features were selected because they are reliable and represent different aspects of gait.24,37 A description of the gait features is given below. The equations for the 4 variables are described in Supplemental Table 1 in the appendix.
Speed is often used as a measure for the functional capacity and in stroke rehabilitation an indication of someone’s ability to walk in daily life, that is, functional walking. 13 First, a sensor-fusion algorithm was used to transform acceleration from a local to a global reference frame by combining the accelerometer and gyroscope data. 38 Second, the linear acceleration in the anterior-posterior direct was integrated once to determine the gait speed. Third, a Zero-Velocity Update was applied to set velocity to zero during stationary phases of walking, thereby reducing estimation errors. 39 Fourth, the corrected gait speed was integrated to determine position. This calculation enabled us to measure the total distance covered in the 2-minute assessment, and thus, the gait speed.
Asymmetry is an expression of the asymmetry between the left and right side of an individual’s body during walking. The asymmetry ratio was calculated by dividing the stance-swing phase ratio of the paretic leg by the stance-swing phase ratio of the non-paretic leg. The stance-phase duration was calculated using the acceleration signal of the left and right foot sensor. In normal gait, there is typically a high degree of asymmetry, resulting in an asymmetry ratio close to 1. Evidence suggests that temporal asymmetry is negatively associated with preferred speed and motor recovery of the leg and foot. 40
Variability was expressed as the variability in stride time. The variability was calculated as the standard deviation of the time per stride. A lower gait variability score is related to a more stereotypical gait. Variability appears to be an indicator for decline in locomotor function. 41
Smoothness characterizes the regularity of the movement patterns during walking. Smoothness was expressed as the index of harmonicity of the pelvis acceleration in the medio-lateral direction during walking. The index of harmonicity indicates the harmonics in the data by comparing the amplitude of the dominant frequency to the sum of the amplitude of the 5 subsequent dominant frequencies. A lower index of harmonicity in the medio-lateral is related to a lower smoothness. Previous work suggests that smoothness is associated with lower limb spasticity and falls.20,42 The minimal-detectable-change values for these features were determined in a previous study and are as follows: 0.137 m/s for the speed, 1.217 for the asymmetry, 0.144 s for the variability, and 0.160 for the smoothness. 24
Postural Sway Data
The postural sway data of the 3 balance conditions was described using 1 feature per measurement, namely: path. The path was computed as the length of the postural sway trajectory determined from the pelvis IMU (m/s 2 ). 33 A higher path score indicates more movement during the balance assessment, which is associated with a worse performance.
Statistical Analysis
Outliers were identified and removed based on z-scores. For each gait feature, z-scores were calculated to standardize the values. Observations exceeding an absolute value of 4.0 were considered outliers and removed from further analysis. The statistical analysis consisted of 2 parts. In the first part, we compared gait features between admission and discharge on an individual level. In the second part, we evaluated the change of gait features relative to time on a group level.
Individual Changes in Gait Features
The changes in gait features were examined from admission to discharge at an individual level across trajectories with and without walking aid. A difference was made between with and without a walking aid, since a walking aid can significantly affect spatio-temporal gait features. 43 Individual trajectories were categorized as showing a significant increase, remaining stable, or decreasing over time, by comparing change scores between admission and discharge to the minimal detectable change (MDC).
Growth Curve Modeling
To identify if patient characteristics influenced the rate of change of gait over time, growth curve models were used. Growth curve models are a statistical technique to analyze how an outcome variable changes over time within individuals. The growth curve models were created using linear mixed models, which incorporate both fixed effects, representing average changes across all individuals, and random effects, allowing individual variations in change patterns. Linear mixed models can handle issues like missing data and time-varying covariates.44 -46 Initially, we developed a univariate mixed model per gait feature to estimate the average rate of change per unit of time measurement (every 3 weeks). To accommodate the within-participant correlation of repeated measurements, we included a random intercept on the participant level to the model. We evaluated if random slopes improved the model via the likelihood ratio test. Subsequently, we determined which patient characteristics at baseline acted as confounders or effect modifiers in this relationship, thus significantly influencing the rate of change. A variable was identified as a confounder if it altered the time coefficient by more than 10%. An effect modifier was deemed significant if its interaction term in the model was statistically significant. 46 Finally, we constructed a multivariate mixed model incorporating time, along with all identified confounders and effect modifiers. This model provides insight into the unique contribution of each included variable.
Results
Demographics and Characteristics
Data of 99 people after stroke were collected in this study. Twenty-eight participants were excluded as only 1 gait measurement was collected. Of the remaining 71 participants (Table 1), 9 participants walked with and without walking aid, which were both included as individual trajectories. Three measurements showed z-scores exceeding 4 and were therefore deemed as outliers. In total, 219 walk tests were included in the analysis, of which 110 with walking aid and 109 without walking aid, resulting in an average 6.6 weeks (±3.7, range [3-18]) per trajectory. On average, participants were admitted to rehabilitation at 3.2 weeks after stroke. The speed without a walking aid significantly surpassed the observed speed with a walking aid, measuring 0.85 and 0.50 m/s, respectively.
Demographic and Characteristics.

Abbreviations: USIT, sitting unsupported on a balance cushion with feet touching the ground and knees in a 90° angle, EO: standing with feet in a self-selected position, EC: standing with closed eyes and feet in a self-selected position.
Note. Not all participants were able to complete the full assessment at every time point, therefore, there is some missing data for the clinical tests and balance measurements.
Variables that were significantly different between admission and discharge were marked with a a.
Gait Recovery on an Individual Level From Admission to Discharge
The change scores of the individual recovery trajectories were compared to the MDC to indicate the number of trajectories that increased, decreased, or remained stable over time per gait feature (Figure 1). Out of the 80 analyzed trajectories, 31 displayed a significant change in speed, surpassing the MDC. Thirty-two of these trajectories exhibited an increase, as depicted in Figure 1. No changes over time were found for asymmetry. Regarding variability, 3 trajectories demonstrated an increase, while 5 trajectories showed a decrease larger than the MDC. Finally, in terms of smoothness, 5 trajectories exhibited an increase, whereas 9 trajectories showed a decrease over time.
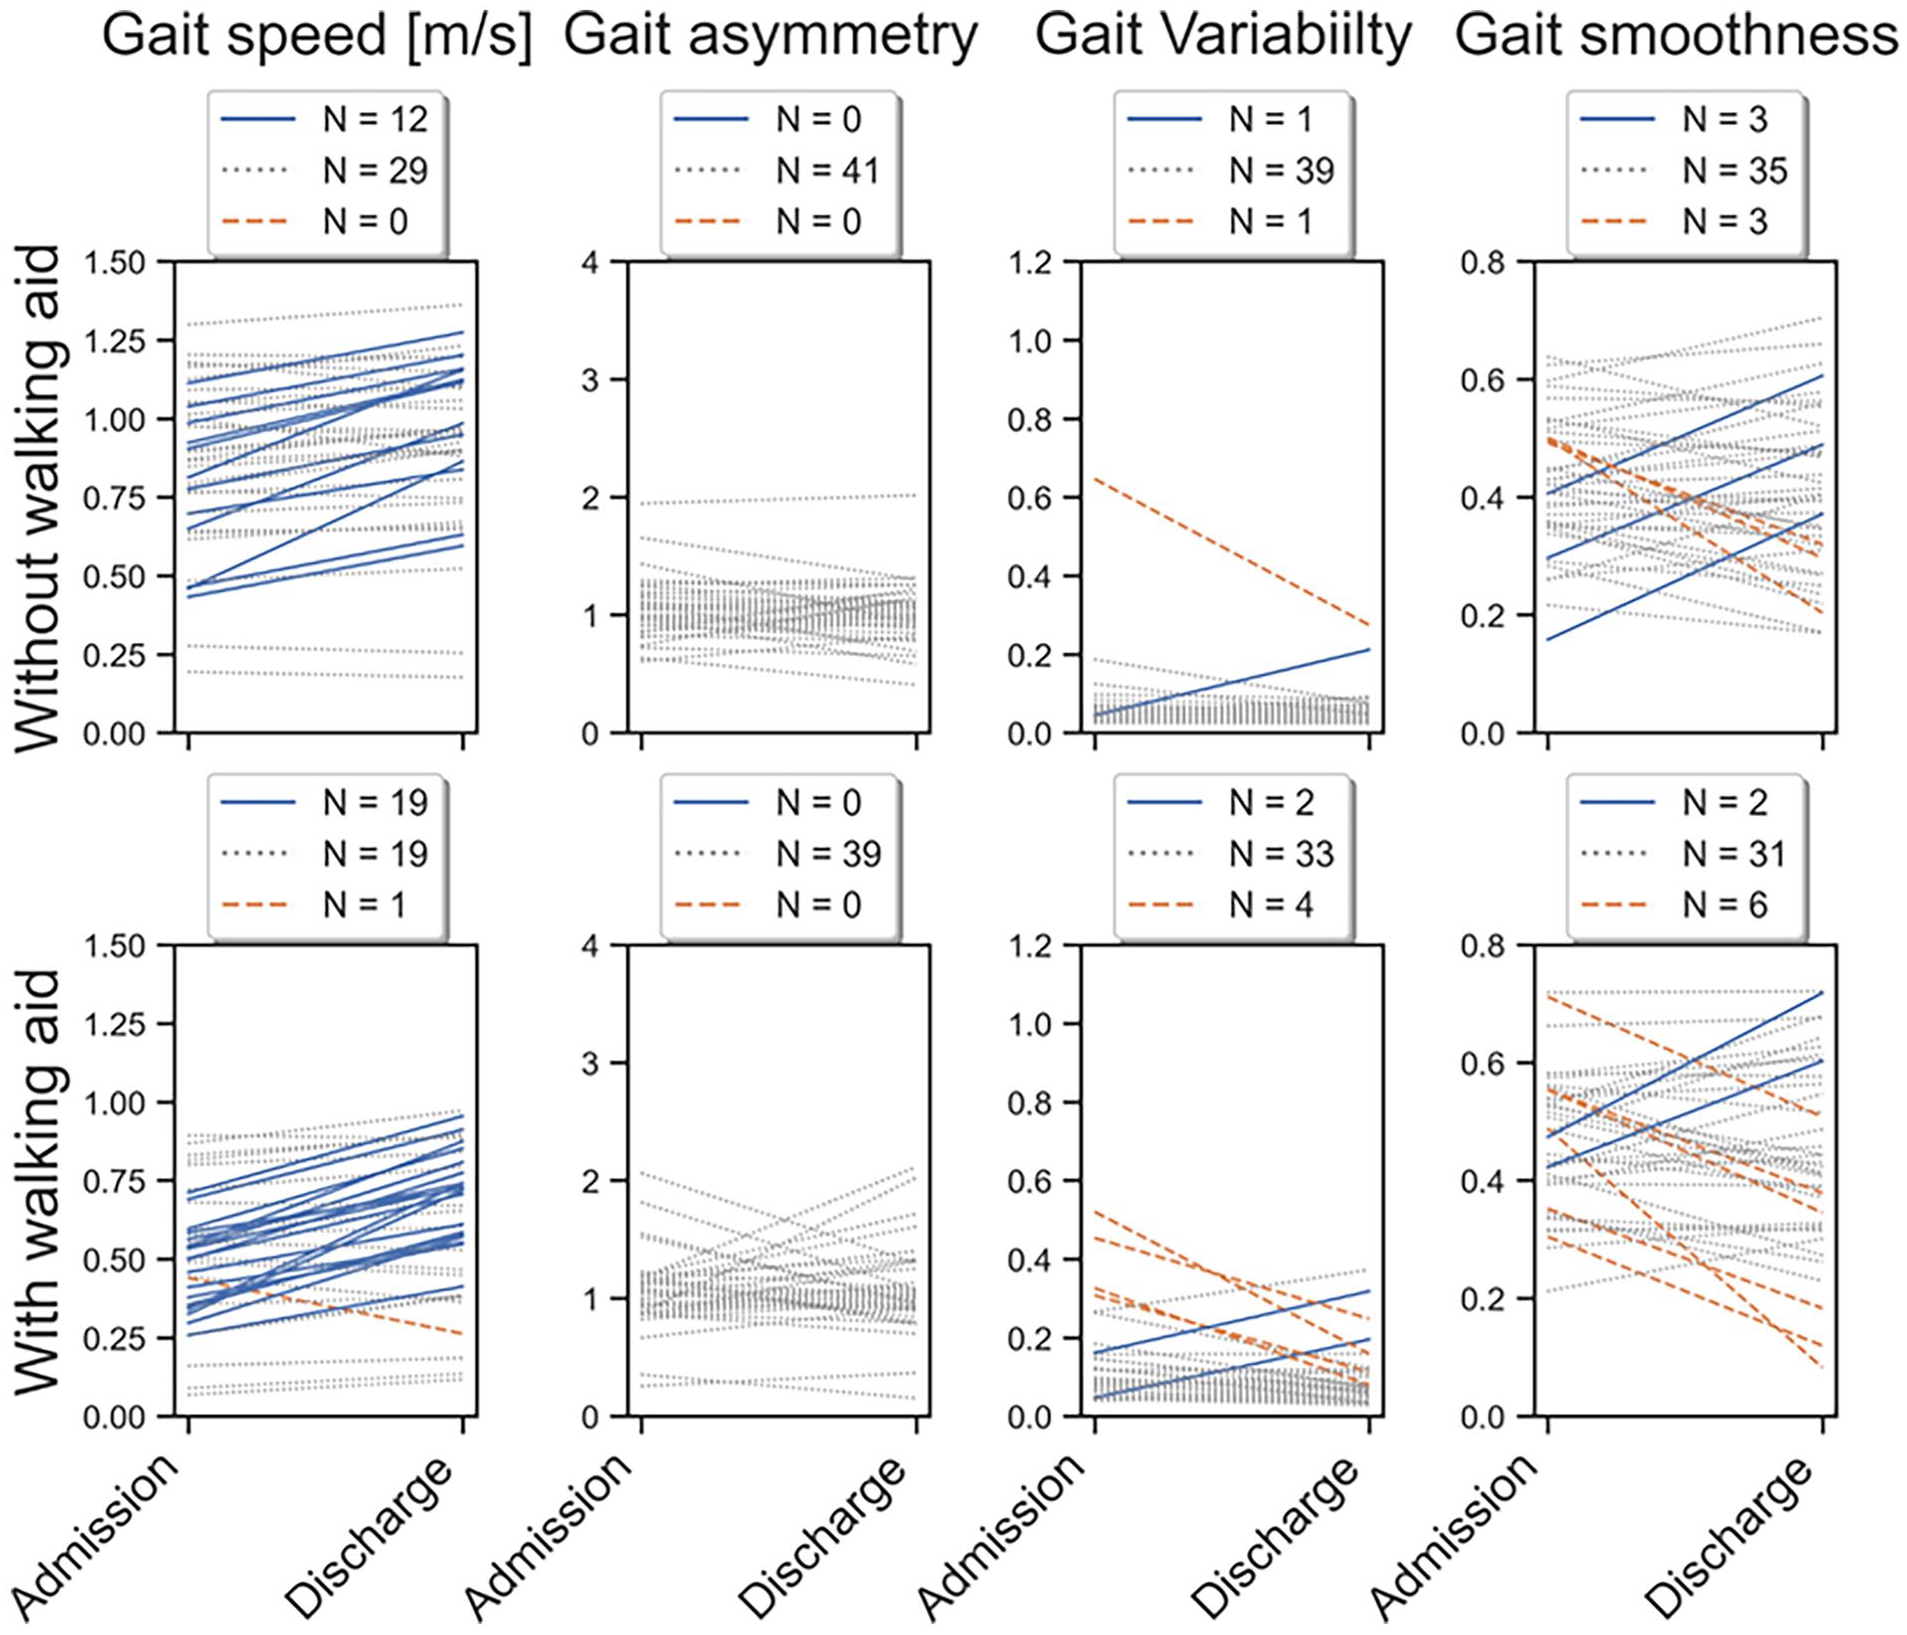
Changes in gait features from admission to discharge per individual trajectory with walking aid (bottom panels) and without walking aid (top panels for people after stroke during rehabilitation. The figure offers insight into the individual recovery trajectories that significantly increased, remained stable, and decreased over time. The admission point indicates the initial instance at which participants were able to walk. The trajectories that increased were denoted in green, the stable trajectories in gray, and the trajectories with a decrease in red.
Gait Recovery Over Time
In addition to analyzing the changes in gait from admission to discharge, the gait recovery trajectories can be visualized over time, including all measurements per trajectory (Figure 2). Figure 2 reveals a high individual variability in both the value at admission, and the subsequent changes over the course of rehabilitation. The data from the left panels was used to model the changes over time in the growth curve analysis. A comparison between gait features and clinical tests was made in Supplemental Figure 1.
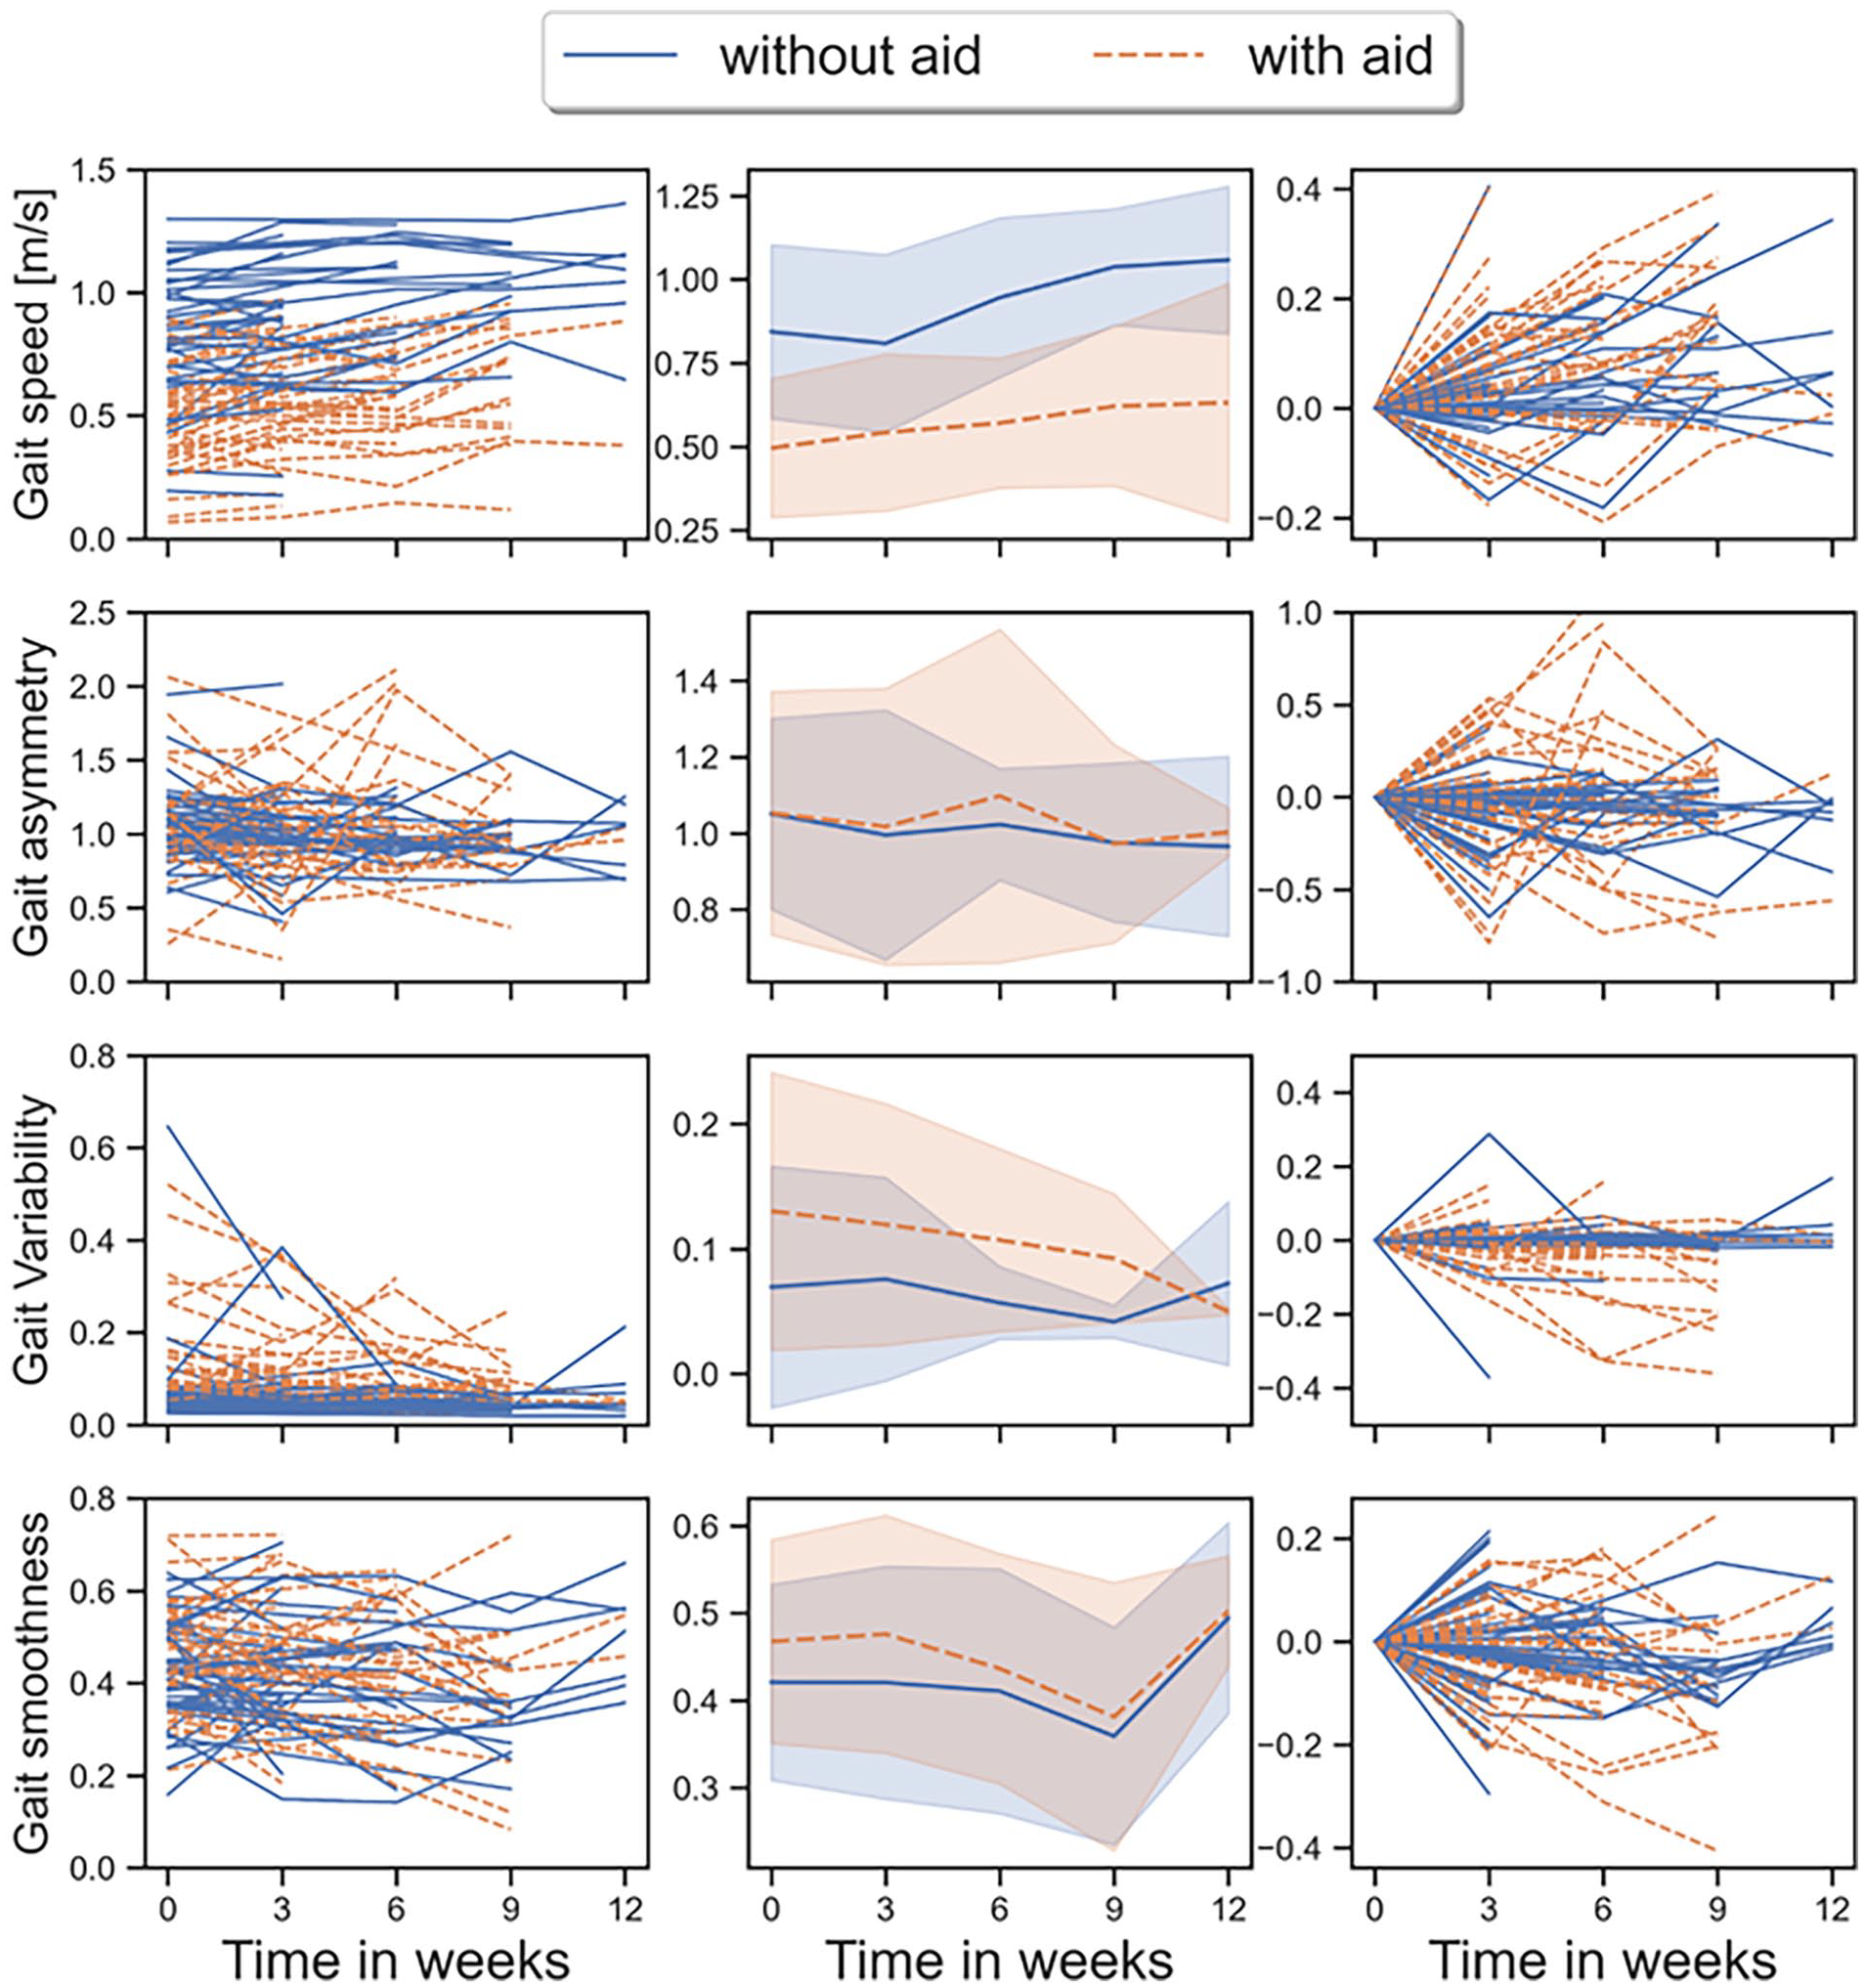
Changes in gait features over time per individual trajectory (left panels), on average (middle panels), and corrected for the initial score (right) for people after stroke during rehabilitation. The figure offers insight into both individual and aggregated gait recovery trends during rehabilitation. The reference point of weeks 0 indicates the initial instance at which participants were able to walk. The trajectories with walking aid are denoted in blue, while those without walking aid are in orange. Only a few trajectories extend beyond 12 weeks, therefore the data was visualized up to 5 measurements.
Associations Between Gait Features and Patient Characteristics
The association between patient characteristics (independent variables) and gait features (dependent variables) were examined with growth curve analysis using linear mixed models. In these models, repeated measurements per individual were included. The outcomes of the linear mixed models regarding gait speed are reported in Table 2. The linear mixed models regarding the variability, asymmetry, and smoothness are reported in Supplemental Tables 2, 3, and 4 in the supplementary materials. The FAC at baseline was not included in this analysis due to missing data. Four Measurements were excluded due to an insufficient number of observations at the measured time points, resulting in a total of 215 included measurements in 80 trajectories. First, the relationship between time and gait speed was estimated and resulted in a regression coefficient of 0.041 (SE = 0.005, P < .01) indicating that on average participants increased their gait speed with 0.041 m/s every 3 weeks. Random slopes at the participant level did not improve the model. Next, a bivariate mixed model with time and the other patient characteristics was created. Only gait speed at the first measurement (T0) was a significant confounder (β = .927, SE = 0.027, P < .01) and an effect modifier (β = −.052, SE = 0.015, P < .01) in the association between gait speed and time. The multivariate mixed model indicated that (1) gait speed increased over time; (2) gait speed at T0 was related to gait speed at later time points; and (3) a greater gait speed at T0 was associated with a smaller increase over time. Although gait speed at T0 was the only confounder and effect modifier in the change of gait speed over time, the bivariate mixed-model analysis showed that most patient characteristics were significantly associated with gait speed. For example, each point increase in the BBS score at T0 corresponded, on average, to a 0.011 m/s increase in gait speed. There was no significant association between time and asymmetry, indicating that asymmetry did not change over time. Variability did decrease over time with a regression coefficient of −.01 (SE = 0.004, P = .01). There were no characteristics that affected this association. The gait smoothness also decreased significantly over time (β = −.01, SE = 0.005, P = .04). Only the BBS-score at T0 influenced the association between gait smoothness and time.
Associations Between Patient Characteristics and Gait Speed.

Abbreviations: USIT, sitting unsupported on a balance cushion with feet touching the ground and knees in a 90° angle, EO: standing with feet in a self-selected position, EC: standing with closed eyes and feet in a self-selected position.
Note. Variables marked in bold are confounders or effect modifiers in the rate of change of speed over time.
Discussion
In this study, we described the alterations in IMU-based gait features measured during a 2-minute walk test in clinical stroke rehabilitation. We found a high variance between subjects and within-subjects over time in gait during rehabilitation. On an individual level we found an increase in gait speed in approximately 40% of the participants. Additionally, we assessed the rate of change of speed, asymmetry, variability, and smoothness over time, and evaluated which characteristics affected this rate of change. We found significant changes over time in speed, variability, and smoothness. Of all included patient characteristics, only gait speed and the BBS-score at baseline influenced the rate of change of speed and smoothness, respectively.
We expected more individuals to improve during rehabilitation since previous research indicated that both spatio-temporal and asymmetry features significantly improved during rehabilitation.27,47 Given that the data comprised predominantly short trajectories, with an average of 6.6 weeks per trajectory, the duration from admission to discharge may have been insufficient for many individuals to improve more than the MDC. This hypothesis is further supported the growth curve models, which included all time points in the analysis and indicated a significant change over time for speed, variability, and smoothness. However, the observed changes every 3 weeks were below the MDC. For example, estimated change in gait speed was 0.41 m/s, whereas previous research identified the MDC for gait speed as 0.137 m/s. 24 Consequently, the trajectory durations may have been too short to capture improve larger than the MDC.
The individual-level analysis from admission to discharge yielded different results from those observed in the growth curve models. Specifically, only a few individuals exhibited changes in variability and smoothness that exceeded the minimal detectable change (MDC) during rehabilitation. In contrast, the growth curve models demonstrated a significant overall change over time. This discrepancy can be attributed to 2 primary factors. First, the growth curve models provided insights into changes over a fixed time period, whereas the individual-level analysis reflected changes during rehabilitation, which varied in duration among participants. It is likely that individuals with longer rehabilitation periods exhibited greater improvements on average, a trend captured by the growth curve models. Second, the growth curve models utilized data from all available time points and accounted for within-individual variations, thereby increasing statistical power and sensitivity. As a result, the growth curve models were able to detect significant changes that were not evident in the individual-level analysis.
We found large between-subject differences in gait-feature scores at admission, throughout the rehabilitation and discharge. These changes were visualized in Figure 2, which illustrated that some individuals show changes in a positive direction, others in a negative direction, and some do not show changes over time. These differences are unexpected if we assume that (1) all individuals optimize functional walking during rehabilitation and (2) a walking pattern that more closely resembles that of healthy individuals results in improved functional walking. If both assumptions were correct, we would expect most individuals to change in the same direction. However, the data suggests that a linear time coefficient, as estimated in the linear mixed models, might not be applicable to all individual trajectories. This is understandable, considering that people after stroke employ diverse mechanisms to enhance their functional gait. For instance, some individuals primarily improve through neural recovery, while others use compensation strategies to overcome their impairments.6 -9 These compensation strategies might motivate some individuals to adopt a gait pattern strongly resembling that of healthy individuals, whereas other individuals might achieve better functional walking with more abnormal gait to cope with their impairments. Future studies could take this into account by splitting the study population into subgroups, based on impairments or gait features, before analyzing the data. Secondly, future studies might add impairments as covariates to a multivariate model to identify which impairments affect the gait-features outcomes and their changes over time.
There are several studies that assessed the effect of patient characteristics on functional outcomes in people after stroke.29 -33,47 -50 Age appears to have a significant negative relationship with the amount of recovery.48,49 Our results also indicated that age was negatively associated with gait speed, however, age did not influence the rate of change over time. Kollen et al 29 investigated the longitudinal change in walking ability, measured with the FAC. They found that standing balance was highly associated with walking ability. We were unable to replicate these results, as the BI and the IMU-based postural sway measurements did not significantly affect the rate of change. Only the BBS-score at baseline influenced the rate of change of the smoothness over time. However, this might also be due to a measurement error considering the large number of assessed variables. Nevertheless, the BBS, BI, and IMU-based postural sway measurements were significantly associated with the gait-features, indicating that balance is associated with walking performance. This finding agrees with literature that postural control is crucial for functional walking. 51 In the studies by Shin et al,28,47 the authors reported a significant longitudinal association between gait parameters and functional gait, defined by gait speed, during the early stages of stroke rehabilitation. Similarly, our study observed significant associations between post-stroke gait patterns and walking capacity, as indicated by the p-values in Table 2. Furthermore, Shin et al 47 found an increase in gait speed of 0.413 m/s over 3 months, which translates to approximately 0.064 m/s every 2 weeks, assuming a linear rate of improvement. In contrast, our study found a smaller increase of 0.041 m/s per 2 weeks. This discrepancy could be attributed to differences in the populations studied, since Shin et al’s 47 participants had a significantly lower baseline gait speed compared to ours. Since baseline gait speed influences the rate of improvement over time, as found in this study and Shin et al 47 this may explain the difference in results. Individuals with higher baseline walking speeds tend to have less room for improvement and may not prioritize further increases in speed during rehabilitation, whereas those with lower baseline speeds are more likely to focus on increasing their walking speed as a primary rehabilitation goal.
We used linear mixed models to conduct the growth curve analysis regarding the relationship between the 4 gait features and various patient characteristics in addition to time. Linear mixed models are often used to analyze longitudinal data, since they can account for multiple observations per subject; handle missing measurements and different numbers of measurements per subject; and the coefficients are interpretable in relation to the outcome.44,45 However, the downside of linear mixed models is that they can only estimate linear relationships between the dependent and independent variables. Considering the course of gait features in individual trajectories as depicted in this study and previous research, and the fact that participants demonstrate the largest recovery early after stroke, it is likely that the gait features do not abide to a linear relationship over a long period. However, we were unable to accurately estimate higher-order polynomials due to limited measurements per individual and a relatively short time frame in which most of the participants were measured.
This study has several strengths and limitations. The first strength was that many different types of data were collected in this study, including patient characteristics, standard clinical tests, and IMU-based balance and gait measurements. This resulted in a large variation of information, which could provide new insight into the factors that are associated with the rate of change of gait features over time in people after stroke. Secondly, participants were measured on a regular basis during rehabilitation in the early stages after stroke. This allowed us to accurately map changes in gait in the first few weeks after stroke. A limitation of this study is that not all participants were able to complete the whole assessment at every measurement, which resulted in some missing data. Linear mixed models can deal with missing data using maximum likelihood estimations if the data were missing at random. 45 However, it is difficult to determine if the data was really missing at random, or a factor caused the data to be missing. The amount of missing data in this study was limited, except for the FAC, which was excluded from further analysis. Therefore, we expect the effect of the missing values to be limited. A second limitation is that it is unclear if the 4 selected gait features fully capture the gait pattern. As indicated by previous research, there are countless gait features that can be calculated from an IMU-based gait measurement. 24 However, to obtain interpretable results, we selected 4 gait features with a good reliability. 37 As an alternative to a theoretical approach of extracting gait features from IMU-data, deep learning algorithms, such as the variational autoencoder, might be capable of obtaining relevant information from raw sensor data instead of using the conventional methods. 52 The third limitation is that many participants were measured over a relatively short period (on average 6.6 weeks) which might be insufficient to demonstrate changes on a group level. Furthermore, because of the short trajectories, we could not fit higher-order time coefficients to estimate non-linear changes over time. The fourth limitation is that we included both trajectories from 9 individuals with and without walking aid. It is possible that there is an association between the values and their development over time within subjects both with and without walking aid, which might enhance model outcomes.
We did not measure or quantify the impairments underlying the walking disabilities. Nevertheless, these specific impairments might affect the rate of recovery since some impairments might be more persistent and difficult to recover from or compensate for than others. Future studies might take this into account by also assessing specific impairments and evaluating their association with the rate of recovery over time.
Conclusion
In this study, we described the temporal changes of gait features in clinical stroke rehabilitation, focusing on speed, asymmetry, variability, and smoothness. Our analysis revealed considerable variations in IMU-based gait features at admission, during rehabilitation, and at discharge. Growth curve analysis demonstrated that speed, variability, and smoothness exhibited significant changes over time. The effect of patient characteristics, such as age and balance, on the rate of change of gait features was minimal.
Supplemental Material
sj-docx-1-nnr-10.1177_15459683241304350 – Supplemental material for Mapping Trajectories of Gait Recovery in Clinical Stroke Rehabilitation
Supplemental material, sj-docx-1-nnr-10.1177_15459683241304350 for Mapping Trajectories of Gait Recovery in Clinical Stroke Rehabilitation by Richard A. W. Felius, Michiel Punt, Natasja C. Wouda, Marieke Geerars, Sjoerd M. Bruijn, Harriet Wittink and Jaap H. van Dieën in Neurorehabilitation and Neural Repair
Supplemental Material
sj-docx-2-nnr-10.1177_15459683241304350 – Supplemental material for Mapping Trajectories of Gait Recovery in Clinical Stroke Rehabilitation
Supplemental material, sj-docx-2-nnr-10.1177_15459683241304350 for Mapping Trajectories of Gait Recovery in Clinical Stroke Rehabilitation by Richard A. W. Felius, Michiel Punt, Natasja C. Wouda, Marieke Geerars, Sjoerd M. Bruijn, Harriet Wittink and Jaap H. van Dieën in Neurorehabilitation and Neural Repair
Footnotes
Author Contributions
Richard Felius: Conceptualization; Data curation; Formal analysis; Investigation; Methodology; Software; Validation; Visualization; Writing—original draft. Michiel Punt: Conceptualization; Data curation; Formal analysis; Funding acquisition; Methodology; Project administration; Resources; Supervision; Writing—review & editing. Natasja Wouda: Data curation; Investigation; Methodology; Writing—review & editing. Marieke Geerars: Data curation; Investigation; Methodology; Writing—review & editing. Sjoerd Bruijn: Conceptualization; Formal analysis; Investigation; Methodology; Supervision; Writing—review & editing. Harriet Wittink: Funding acquisition; Project administration; Writing—review & editing. Jaap van Dieën: Conceptualization; Investigation; Methodology; Supervision; Writing—review & editing.
Declaration of Conflicting Interests
The author(s) declared no potential conflicts of interest with respect to the research, authorship, and/or publication of this article.
Funding
The author(s) disclosed receipt of the following financial support for the research, authorship, and/or publication of this article: This study is independent research and was funded by: SIA-RAAK (RAAK.PRO.03.006). SMB was funded by a VIDI grant (016.Vidi.178.014) from the Dutch Organization for Scientific Research (NWO).
Ethics Approval and Consent to Participate
All methods were performed in accordance with the declaration of Helsinki. The medical ethical review committee of Utrecht (METC number: 20-462/C) approved this study. Informed consent was obtained from all participants involved in the study.
Consent for Publication
Not Applicable.
Availability of Data and Materials
Data will be made available on request in 2024, after the research project ‘making sense of sensor data for personalized healthcare’ is finished.
Supplementary material for this article is available on the Neurorehabilitation & Neural Repair website along with the online version of this article.
References
Supplementary Material
Please find the following supplemental material available below.
For Open Access articles published under a Creative Commons License, all supplemental material carries the same license as the article it is associated with.
For non-Open Access articles published, all supplemental material carries a non-exclusive license, and permission requests for re-use of supplemental material or any part of supplemental material shall be sent directly to the copyright owner as specified in the copyright notice associated with the article.