
Abstract
Background
Intracortical inhibitory/faciliatory measures are affected after stroke; however, the evidence is conflicting.
Objective
This meta-analysis aimed to investigate the changes in motor threshold (MT), motor evoked potential (MEP), short-interval intracortical inhibition (SICI), and intracortical facilitation (ICF), and identify sources of study variability using a machine learning approach.
Methods
We identified studies that objectively evaluated corticospinal excitability and intracortical inhibition/facilitation after stroke using transcranial magnetic stimulation. Pooled within- (ie, affected hemisphere [AH] vs unaffected hemisphere [UH]) and between-subjects (ie, AH and UH vs Control) standardized mean differences were computed. Decision trees determined which factors accurately predicted studies that showed alterations in corticospinal excitability and intracortical inhibition/facilitation.
Results
A total of 35 studies (625 stroke patients and 328 healthy controls) were included. MT was significantly increased and MEP was significantly decreased (ie, reduced excitability) in the AH when compared with the UH and Control (P < .01). SICI was increased (ie, reduced inhibition) for the AH when compared with the UH, and for the AH and UH when compared with Control (P < .001). ICF was significantly increased (ie, increased facilitation) in the AH when compared with UH (P = .016) and decreased in UH when compared with Control (P < 0.001). Decision trees indicated that demographic and methodological factors accurately predicted (73%-86%) studies that showed alterations in corticospinal and intracortical excitability measures.
Conclusions
The findings indicate that stroke alters corticospinal and intracortical excitability measures. Alterations in SICI and ICF may reflect disinhibition of the motor cortex after stroke, which is contrary to the notion that stroke increases inhibition of the affected side.
Introduction
More than 795, 000 people suffer a stroke each year in the United States. 1 A stroke can lead to significant impairments that affect cognition, 2 speech, 3 and sensorimotor systems.4,5 Consequently, stroke is the leading cause of long-term disability in the United States. 1 Alterations in corticospinal excitability have been attributed as one of the underlying mechanisms for motor impairment after stroke.6-9 Therefore, understanding how stroke affects corticospinal excitability could assist in the development of targeted interventions to improve motor function and aid stroke recovery.
The measurement of motor cortical and corticospinal excitability can be achieved using noninvasive brain stimulation techniques such as transcranial magnetic stimulation (TMS).10,11 TMS uses an electromagnet (a coil) to deliver a brief magnetic pulse that stimulates the neurons in a specific area of the brain. 10 The TMS intensity and the amplitude of the resulting motor-evoked responses are then commonly used to quantify the excitability of the motor cortex. Specifically, 4 prominent measures of corticospinal and intracortical excitability measured with TMS include the motor threshold (MT), motor evoked potential (MEP) amplitude, short-interval intracortical inhibition (SICI), and intracortical facilitation (ICF). 12 The MT and MEP amplitude are measures of corticospinal excitability. MT indicates the minimum amount of magnetic stimulation required to activate the motor cortex and elicit a motor response, while MEP measures the elicited motor response at a given stimulation intensity. In contrast, SICI and ICF are measures of intracortical excitability, where SICI measures the amount of intracortical inhibition and ICF measures the amount of ICF in the brain.13,14 MT and MEP are straightforward metrics to quantify, and these procedures are largely standardized between studies.15,16 Studies have repeatedly shown that MT increases and MEP amplitude decreases after stroke.8,17-19 On the other hand, quantifying SICI and ICF requires more involved procedures: a stimulus of a weaker intensity than the MT (ie, a conditioning stimulus) is followed by a suprathreshold stimulus (ie, the test stimulus) delivered a short time later (ie, an interstimulus interval [ISI]).12,20 The conditioning stimulus activates inhibitory or facilitatory interneurons in the cortex, which suppress or facilitate the response to the test stimulus. The evidence related to how stroke affects these measures in the motor cortex is somewhat conflicting, with some studies showing reduced intracortical excitability21-25 and others showing increased intracortical excitability or no significant change after a stroke.26-31 Developing a more concrete understanding of how stroke alters SICI and ICF will enable us to better understand how these measures contribute to motor function and recovery after stroke.
Therefore, the primary purpose of this study was to systematically review the current research related to alterations in corticospinal and intracortical excitability following a stroke and perform a meta-analysis to gain a better understanding of the magnitude (ie, effect size) and direction of changes (ie, increased or decreased) in corticospinal (MT: primary; MEP: secondary), and intracortical (SICI: primary; ICF: secondary) excitability after a unilateral stroke. We chose MT and SICI as our primary measures as these were more consistently reported. It is important to note that the measurements of MT, MEP, SICI, and ICF after stroke could be affected by the (1) use of different parameters for measuring MT (active vs resting) and SICI/ICF (e.g., conditioning stimulus intensity [CSI], ISI, and test stimulus intensity [TSI]) 32 ; (2) small sample sizes, which could lead to sampling bias and type-II error; and (3) differences in the characteristics of the sample population (eg, timing, location, and type of stroke). Hence, a secondary purpose of this study was to identify potential sources of variability in these outcome measures using decision tree analyses. We hypothesized that stroke survivors would exhibit increased MT and SICI and reduced MEP and ICF in their affected hemisphere when compared with the unaffected hemisphere and uninjured controls and that the parameters used in testing and timing of stroke would predict differences in corticospinal and intracortical excitability outcomes.
Methods
Identification and Selection of Studies
Using guidelines of the Preferred Reporting Items for Systematic Reviews and Meta-Analyses (PRISMA) statement, 33 a comprehensive search of published literature was done on the following electronic databases: (1) PubMed, (2) EBSCO Host, (3) Web of Science Core Collection, (4) Embase, (5) the Cochrane Library, and (6) Scopus. Keyword combinations for the search included: “transcranial magnetic stimulation,” “TMS,” “short interval intracortical inhibition,” “SICI,” “intracortical inhibition,” “stroke,” “cerebrovascular accident,” “CVA,” “hemiparesis,” and “hemiplegia.” References from included articles were manually inspected for other potential studies that could be included. All databases were searched for relevant publications up until March 1st, 2022.
Inclusion and Exclusion Criteria
Two independent reviewers used Rayyan to determine the eligibility of studies. For the studies to be included in the meta-analysis, they had to be (1) written in English, (2) original investigations related to individuals who have suffered a stroke, and (3) cross-sectional and prospective case-controlled studies that measured MT and SICI using TMS. Case studies, conference abstracts, studies that focused on other diseases or conditions and variables, or studies that did not meet the inclusion criteria were excluded. Intervention studies were included only if the study contained pre-intervention data. Initial screening was done using the title and abstract and if that was insufficient, then the reviewers read through entire articles to determine eligibility. To check for publication bias in outcome variables, funnel plots and Egger’s tests were used. 34
Data Extraction and Analysis
A data extraction sheet was used to summarize the following variables for stroke survivors and control participants: (1) sample size, (2) age, (3) upper or lower extremity muscles, (4) time since stroke, (5) type of measurement, and (6) neuromuscular parameters (MT, SICI, active or resting TMS, CSI, TSI, and ISI). The type of measurement referred to whether SICI was quantified by the change in the motor-evoked potential when the TSI was held constant (ie, conventional), or by the change in TSI required to elicit a similar motor-evoked potential (ie, unconventional). When there was insufficient data for these variables, efforts were taken to obtain these data by contacting the study authors. When numerical values for the outcome variables were not available, we used an online data extraction tool to estimate the means and standard deviations.35,36
An additional secondary analysis was performed using this dataset by identifying the articles that evaluated MEP and ICF. The following variables for stroke survivors and control participants were collected from each study: (1) sample size, (2) age, (3) upper or lower extremity muscles, (4) time since stroke, (5) type of measurement, and (6) neuromuscular parameters (MEP, ICF, active or resting TMS, CSI, TSI, and ISI). When numerical values for the outcome variables were not available, we used an online data extraction tool to estimate the means and standard deviations.35,36
Statistical Analysis
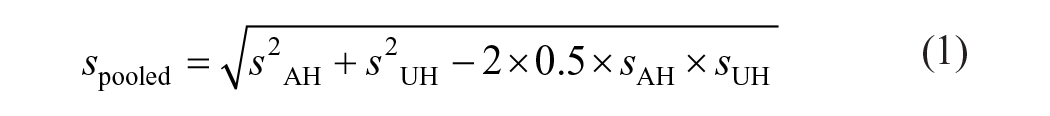
Descriptive statistics for all demographic and neuromuscular variables were calculated and tabulated for both the stroke and uninjured control groups (ie, the affected hemisphere [AH], unaffected hemisphere [UH], and uninjured participants [Control]). The following equations were used to calculate the pooled standard deviation (equation (1)) and effect size (equation (2)) between the AH and UH of the stroke survivors (ie, within-subjects analysis), assuming a modest correlation of .537-40:

The standard error of the effect size for the within-subjects analysis. (equation (3)) was calculated using the following equation39,40:

For the standard error, since there were occasions where the affected hemisphere was unable to output an MEP response, the smallest population was used for n.
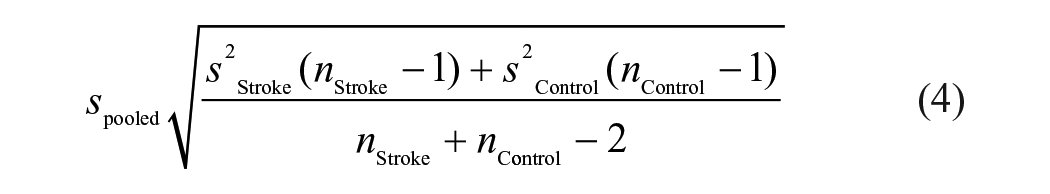
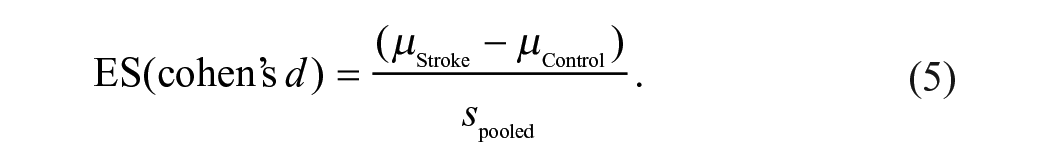
The following equations were used to calculate the pooled standard deviation (equation (4)) and effect size (equation (5)) for between group comparisons (AH vs Control and UH vs Control)37-40:
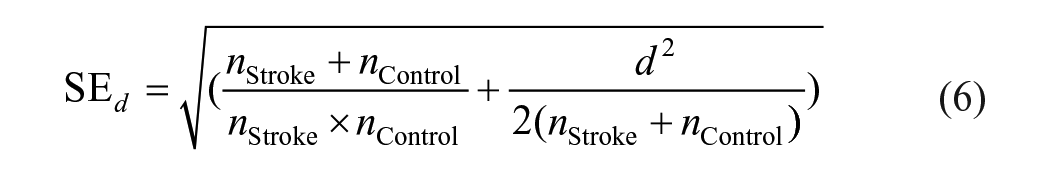
The standard error of the effect size for the stroke and uninjured control comparison (equation (6)) was calculated using the following equation39,40:
Standardized mean difference (SMD) meta-analyses were performed for MT, SICI, MEP, and ICF using the JASP software program (Version 0.16.4; JASP-Stats, Amsterdam, The Netherlands). SMD meta-analyses were done to quantify (1) AH and UH differences, (2) AH and Control differences, and (3) UH and Control differences.38,39 As eligible studies differed in their participant demographics and variables collected, a random-effects model was chosen to increase generalizability.
37
A Wald’s Test was used to determine within- (AH vs UH) and between-group differences (AH vs Control and UH vs Control) in MT, SICI, MEP, and ICF. Forest plots were used to determine the SMDs and 95% confidence intervals (95% CIs) for within- and between-group differences in MT, SICI, MEP, and ICF.
Decision Tree Analysis
SICI and MT (Primary Analysis)
When there was a significant SMD, decision tree analyses were conducted to determine the factors that predicted alterations in MT and SICI. For this analysis, we computed a binary variable that indicated if the MT or SICI effect size for a study was lower than the 95% confidence interval (CI) of the pooled estimate, which served as the dependent variable. For MT, if the study effect size was less than the 95% CI of the pooled estimate, this indicated that there was no reduced excitability found in the study. For SICI, if the study effect size was less than the 95% CI of the pooled estimate, this indicated that there was no reduced inhibition. The binary variable was predicted using several independent variables including sample size, time after stroke, age, extremity (upper or lower), type of contraction (active or resting), the CSI, the TSI, ISI, and the type of measurement (ie, conventional or unconventional). Nodes identified by the decision tree that represented a relative gain of over 10% were considered to be meaningful.42,43 Decision trees were validated using cross-validation with 5 sample folds to determine accuracy when applying these models to new data. Analyses were performed using Statistical Package for the Social Sciences (SPSS; Version 29, IBM Corporation).
MEP and ICF (Secondary Analysis)
A similar decision tree analysis was performed for MEP and ICF when there was a significant SMD. For this analysis, we computed a binary variable that indicated if the MEP or ICF effect size for a study was lower than the 95% confidence interval (CI) of the pooled estimate, which served as the dependent variable. For MEP, if the study effect size was greater than the 95% CI of the pooled estimate, this indicated there was no reduced excitability. For ICF, when comparing the AH and UH, if the study effect size was less than the 95% CI of the pooled estimate, this indicated there was no increase in facilitation; when comparing the UH and C, if the study effect size was greater than 95% CI of the pooled estimate, this indicated there was no reduction in facilitation. The binary variable was predicted using several independent variables including sample size, time after stroke, age, extremity (upper or lower), type of contraction (active or resting), the CSI, the TSI, ISI, and the type of measurement (ie, conventional or unconventional). Nodes identified by the decision tree that represented a relative gain of over 10% were considered to be meaningful.42,43 Decision trees were validated using cross-validation with 5 sample folds to determine the accuracy when applying these trees to new data. Analyses were performed using Statistical Package for the Social Sciences (SPSS; Version 29, IBM Corporation).
Results
Literature Search, Study Selection, and Study Characteristics
Our comprehensive search identified 1395 articles. There were 592 articles after the removal of duplicate studies. During the initial screening process, a total of 515 articles were removed and 77 articles were then further evaluated. A total of 35 studies met our eligibility criteria.7,21-31,44-66 29 studies reported MT, 35 reported SICI, 25 studies reported MEP, and 20 reported ICF. Subject characteristics and descriptive data for each study is outlined in Supplemental Table 1. A PRISMA flowchart for the literature search and screening process is shown in Figure 1. We note that some studies included multiple subgroups of stroke patients or performed analyses with multiple stimulation parameters, which were all included in our analyses. Hence, Forest plots may include multiple effect sizes for a single study.
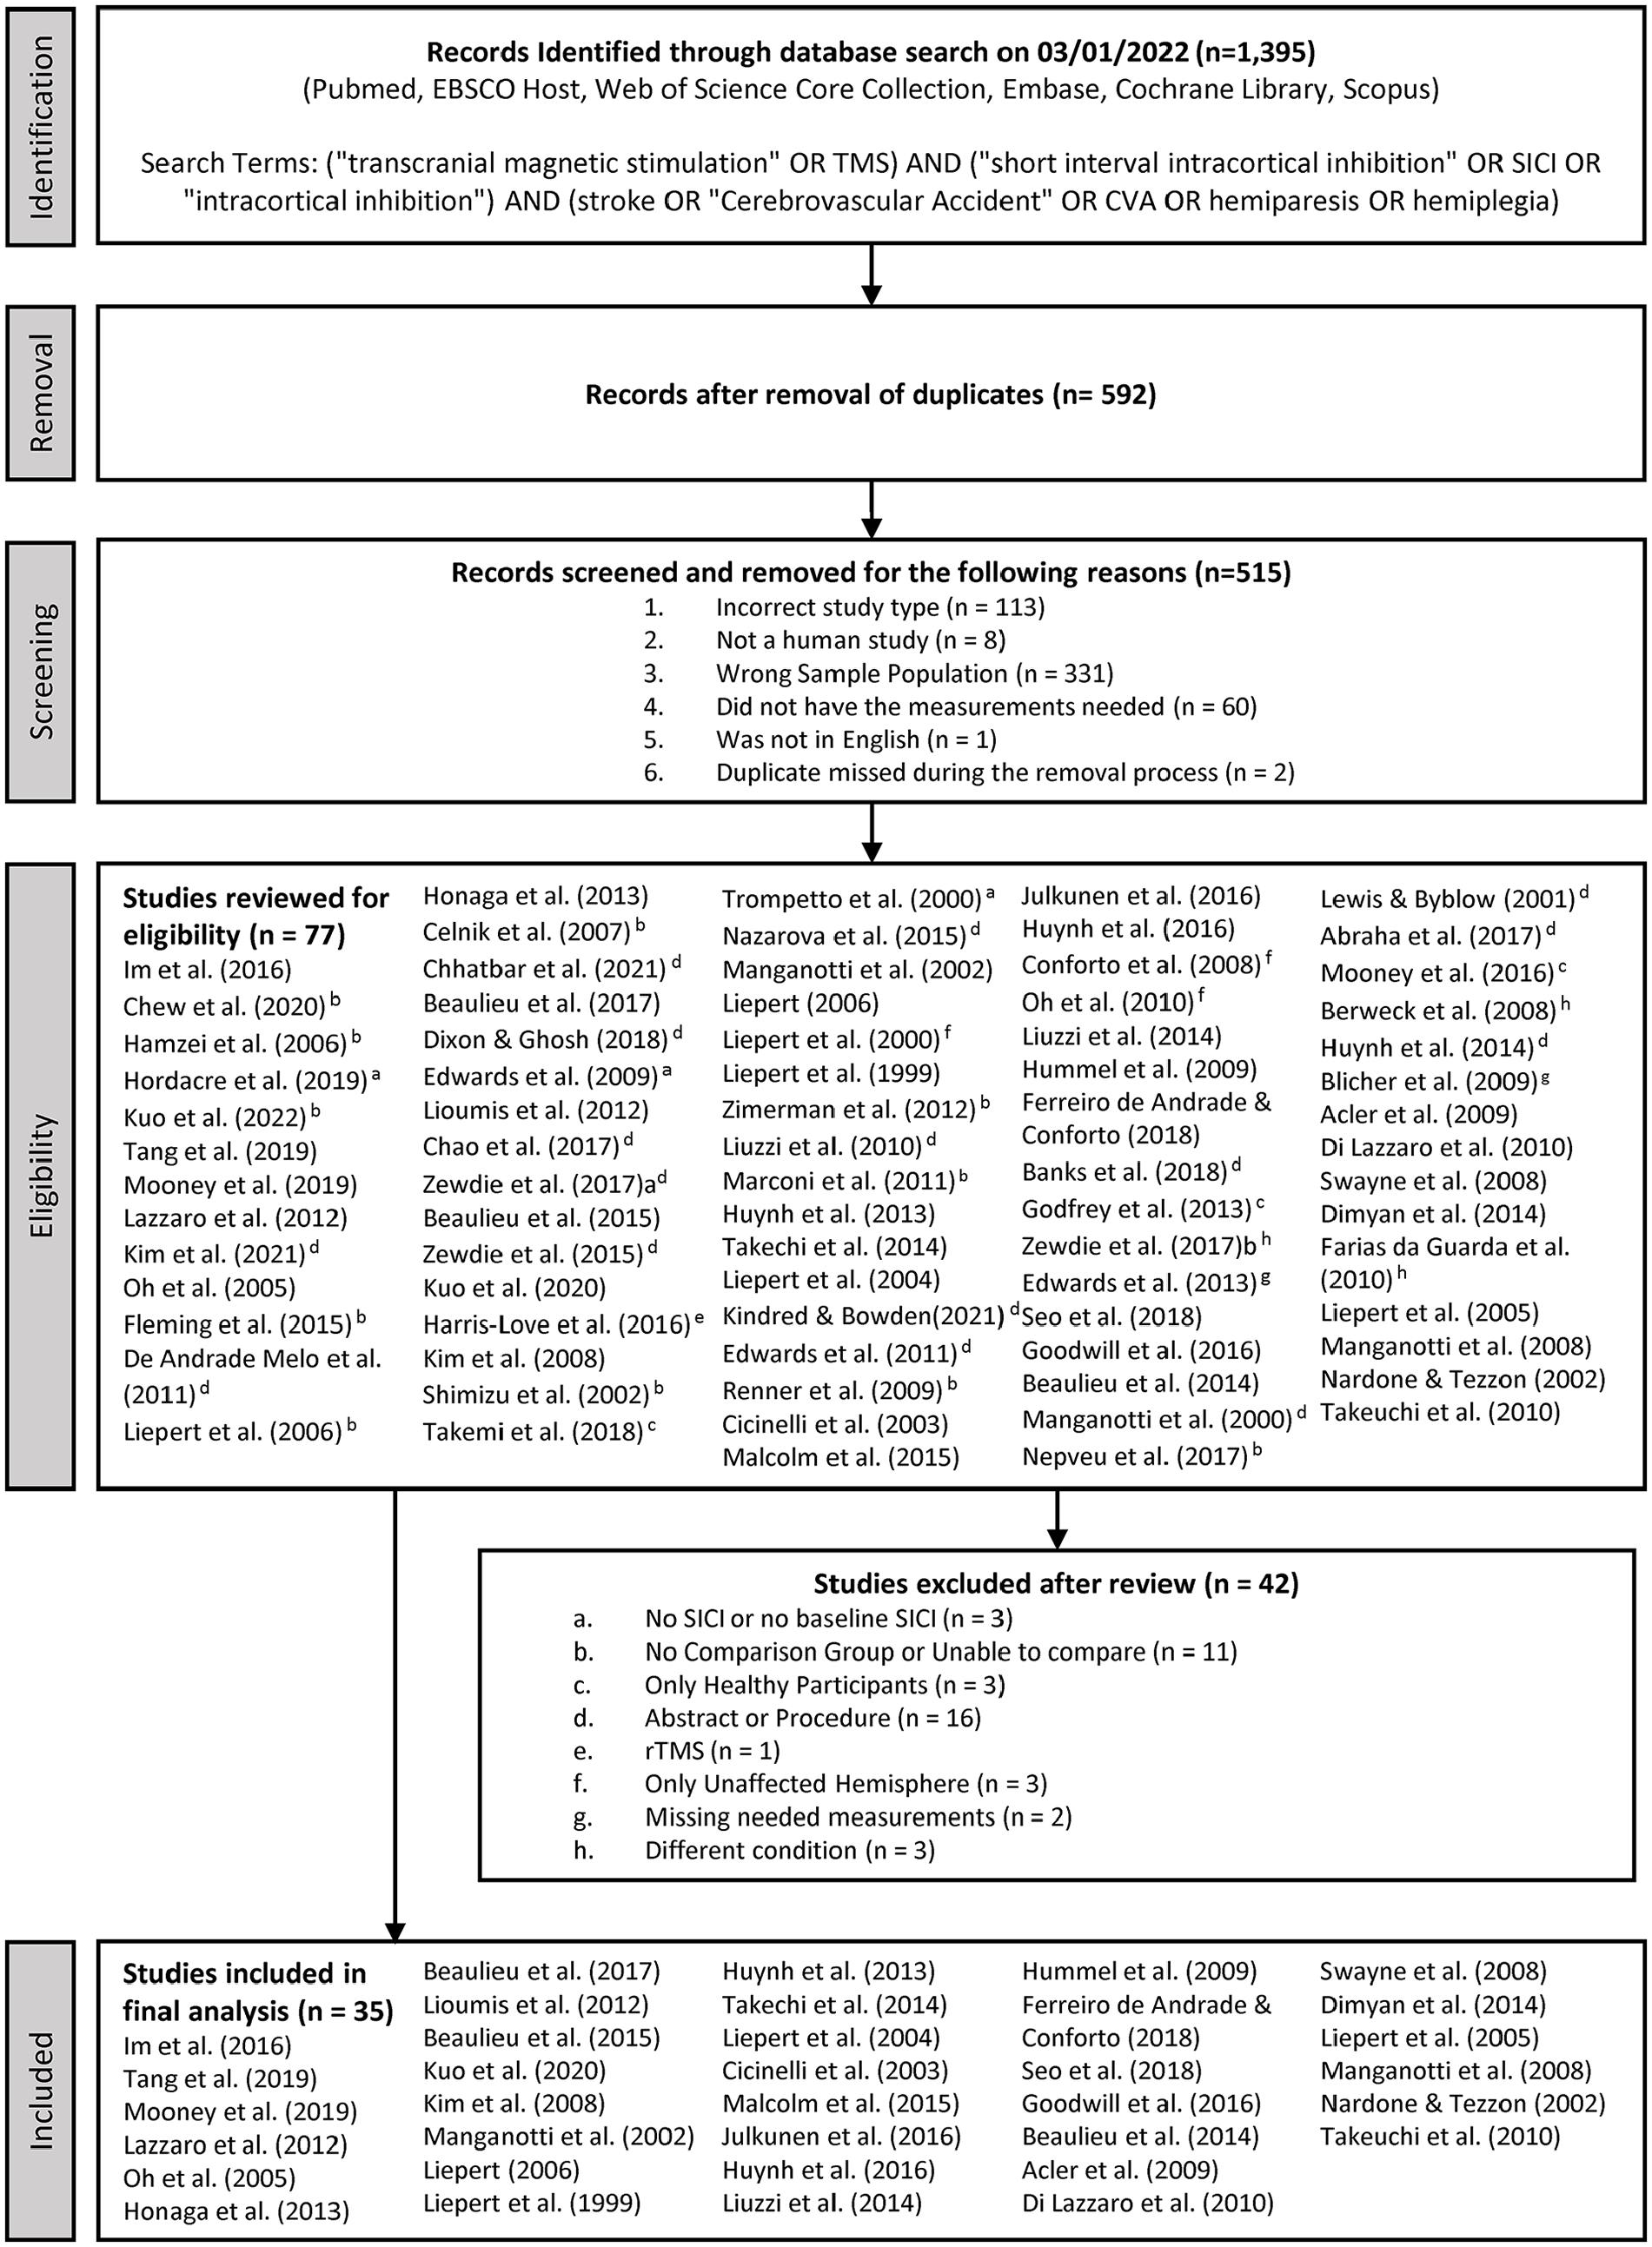
A schematic of the PRISMA flow diagram of the identification and selection of the studies included in this meta-analysis.
Motor Threshold
A total of 22 studies were included that compared AH versus UH with sample sizes of 344 and 397, respectively (
Forest plot depicting the pooled standard mean difference (95% confidence intervals (lower limit to upper limit) of the motor threshold (MT) between the affected hemisphere versus unaffected hemisphere.
Forest plot depicting the pooled standard mean difference (95% confidence intervals (lower limit to upper limit) of the motor threshold (MT) between the affected hemisphere versus uninjured controls.
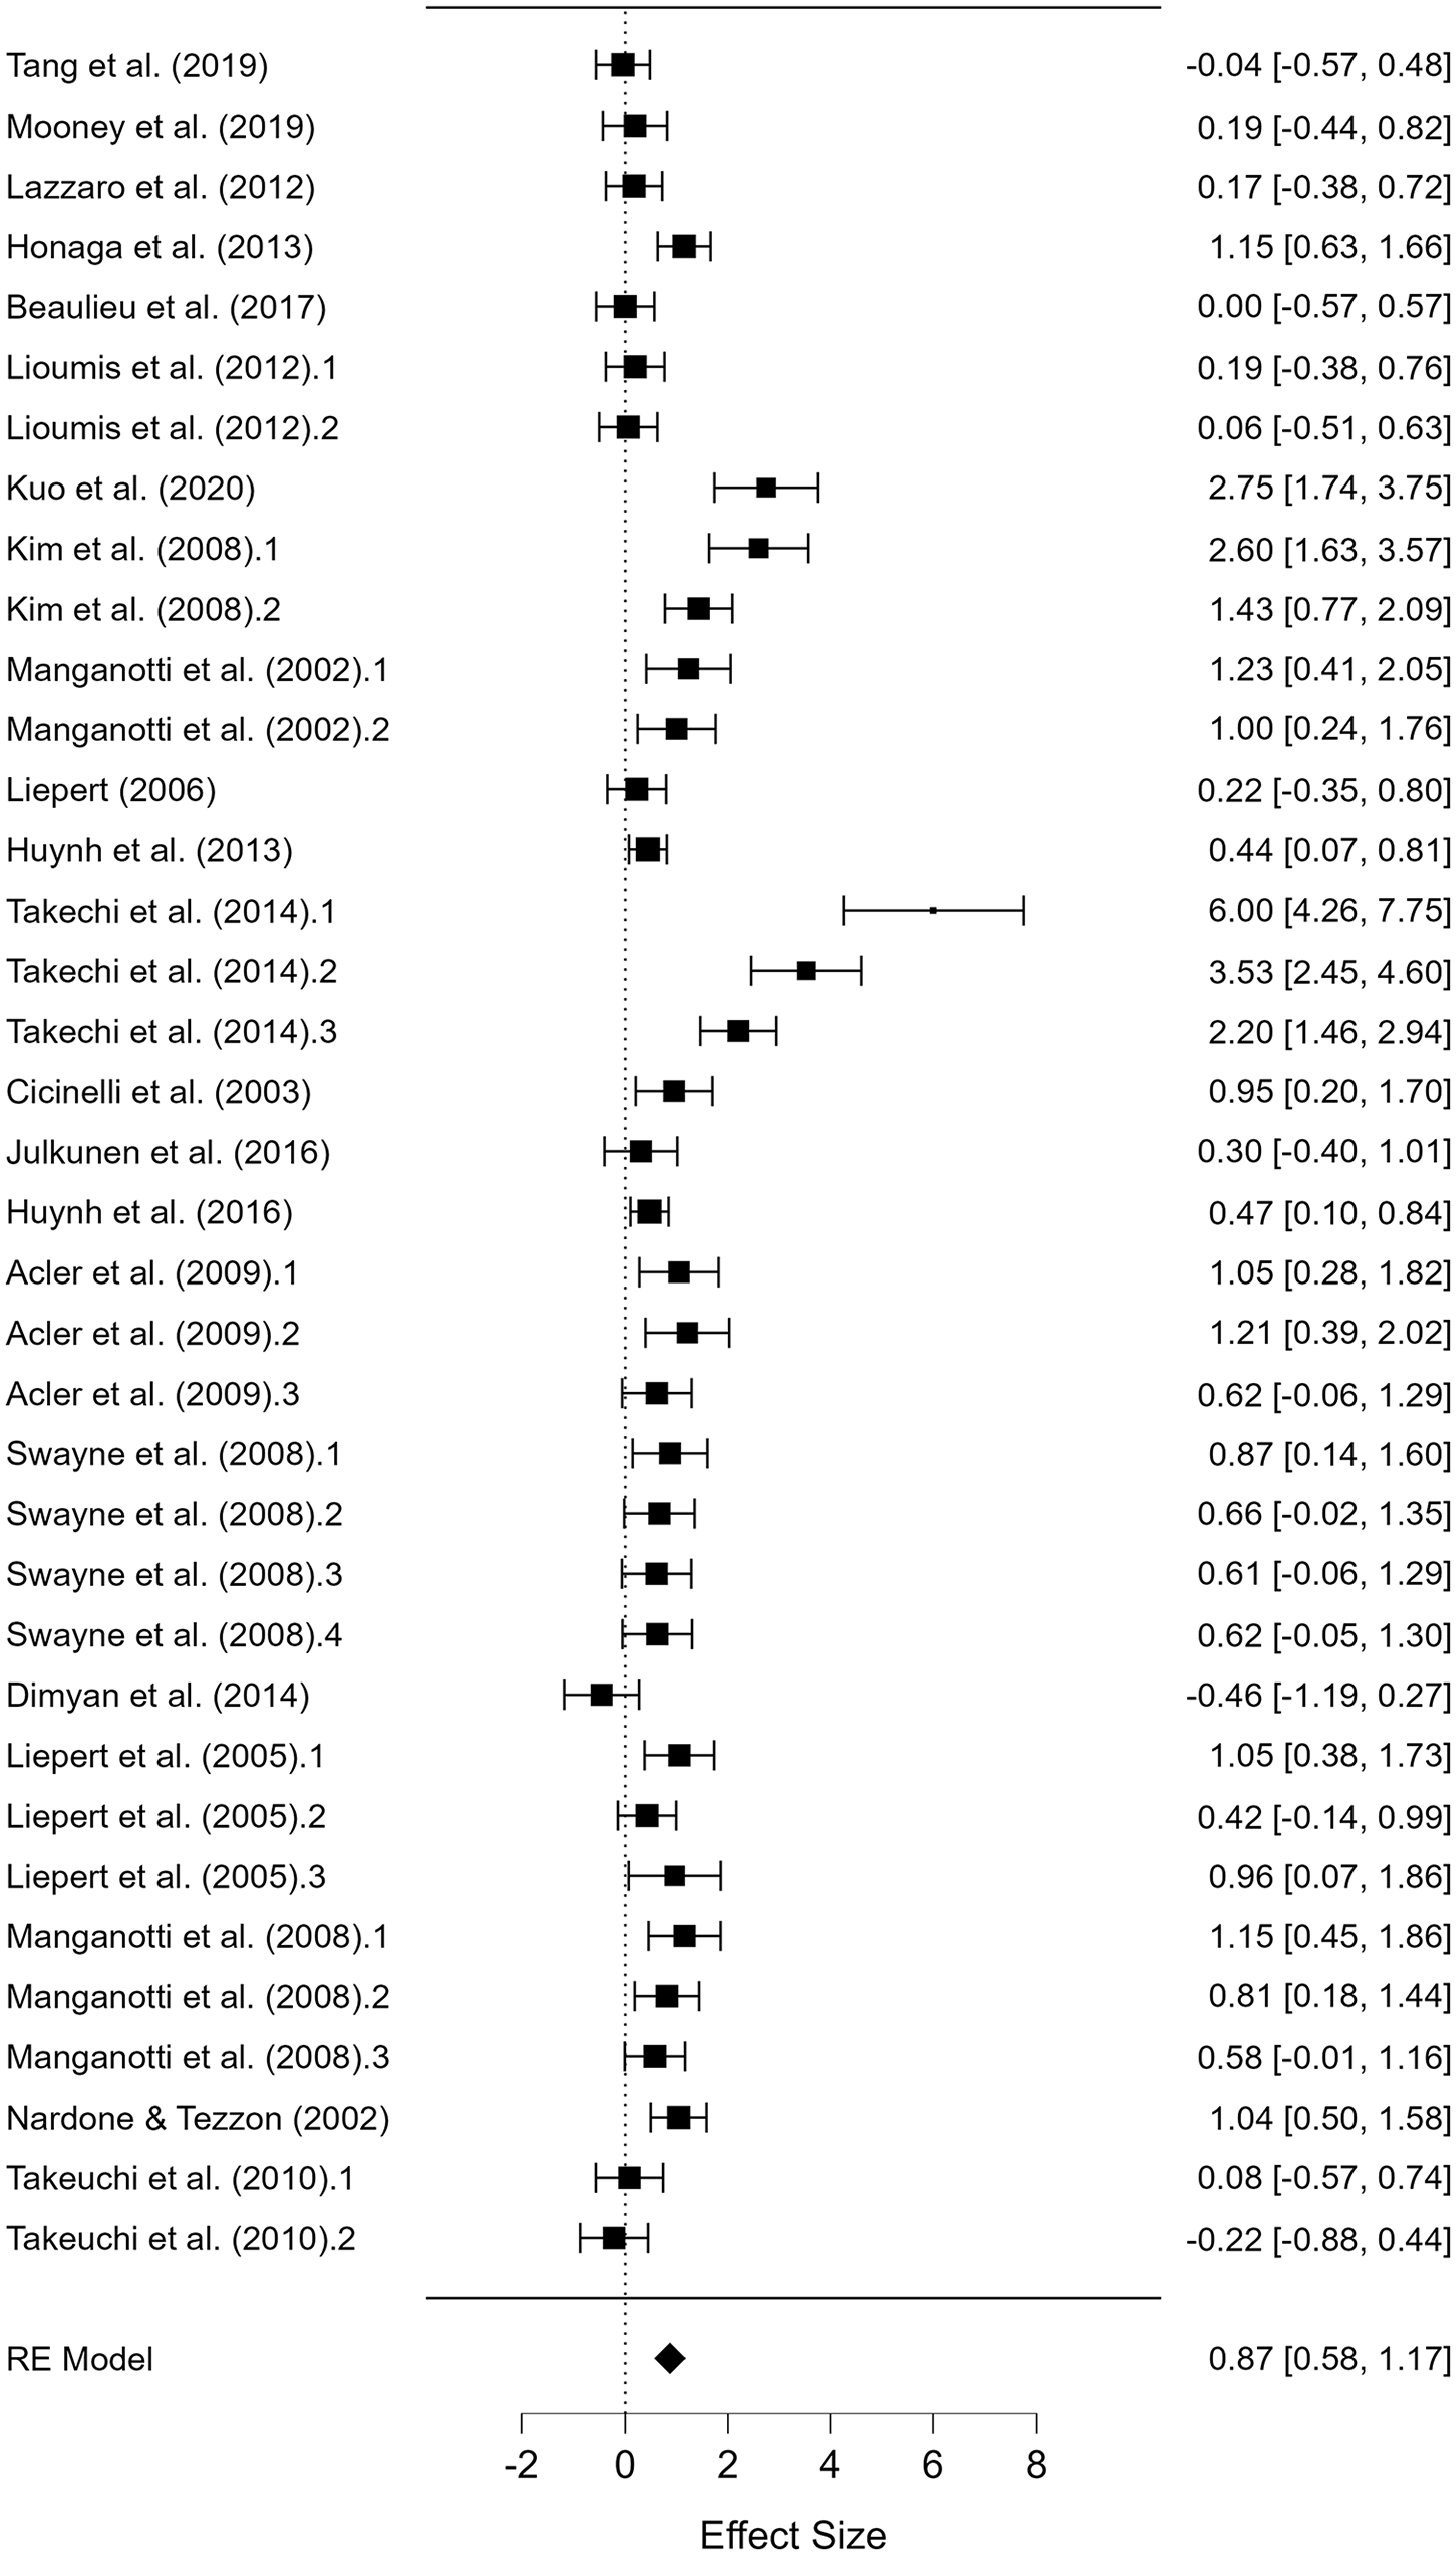
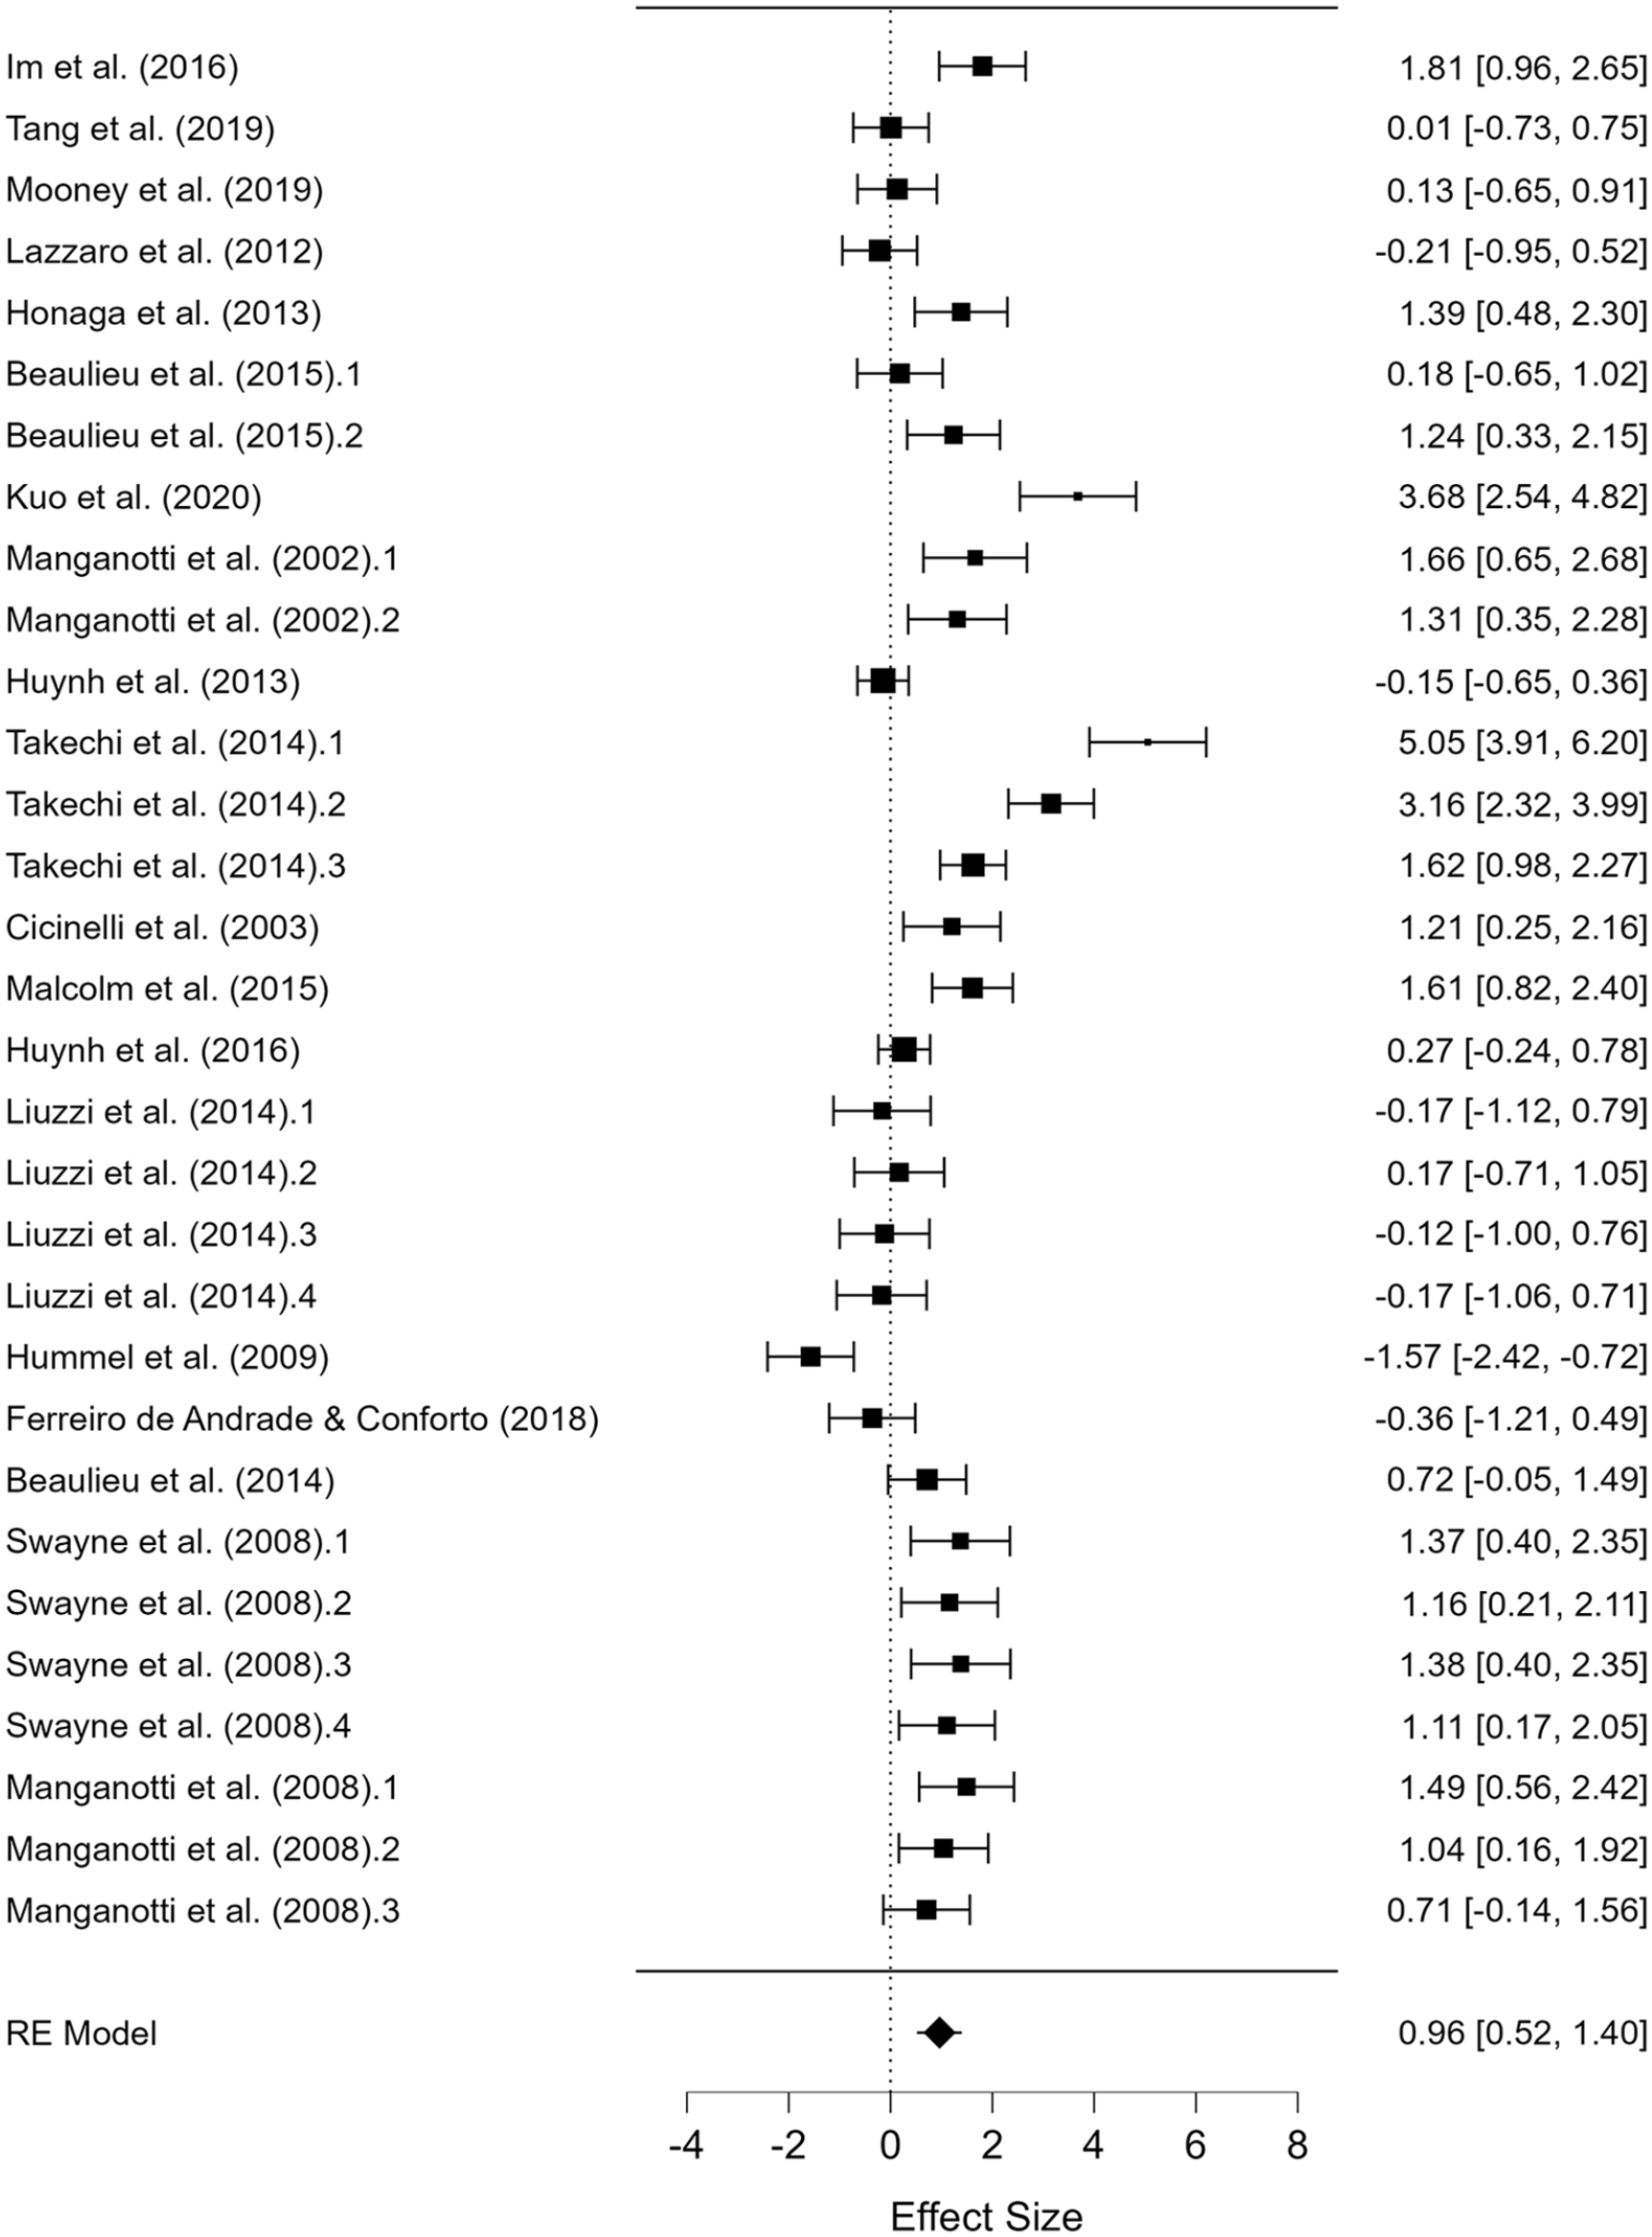
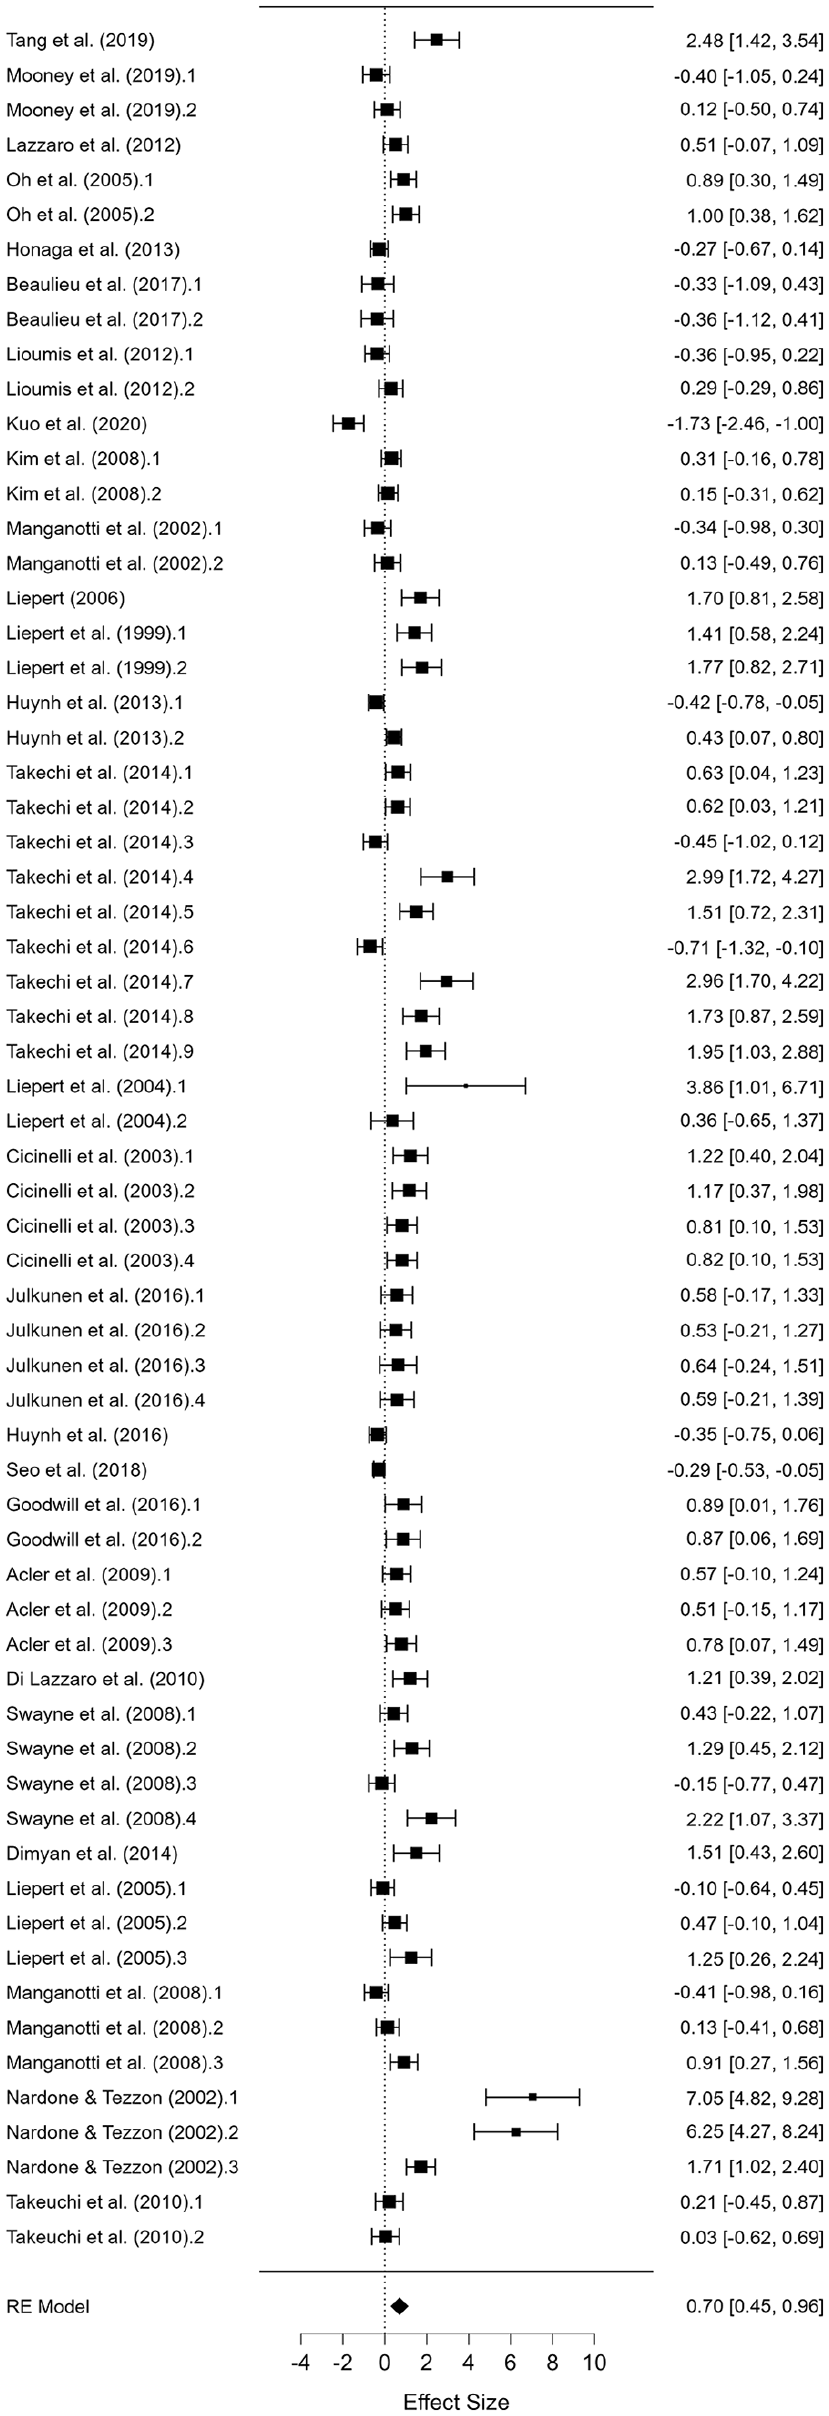
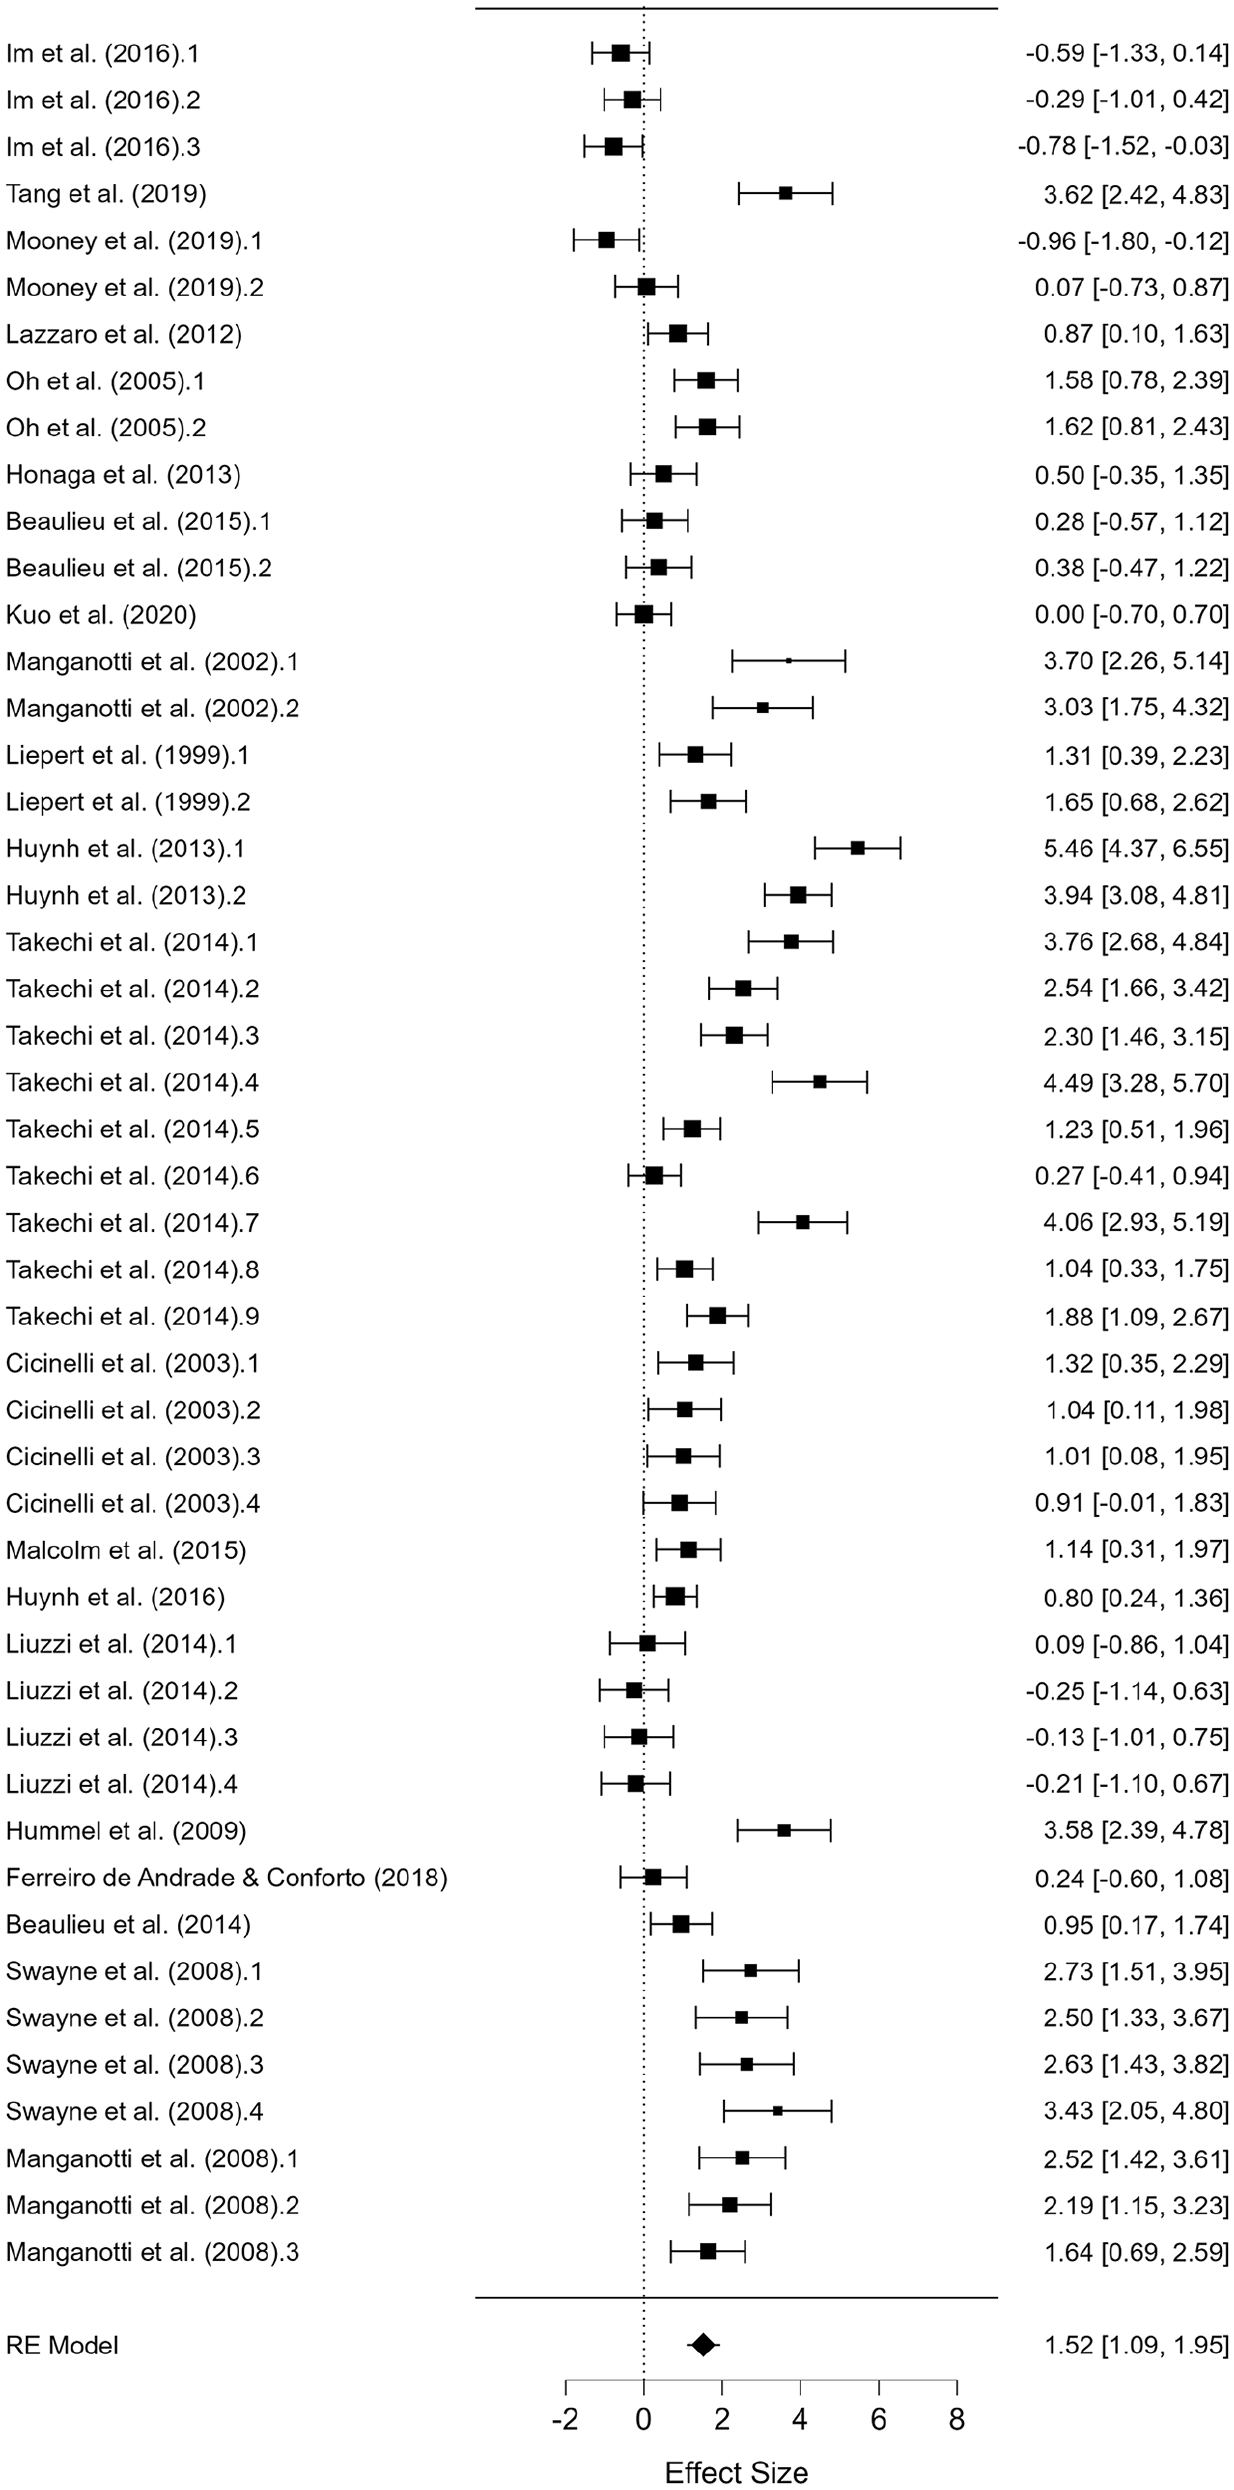
Short-Interval Intracortical Inhibition
A total of 28 studies were included that compared AH versus UH with sample sizes of 435 and 519, respectively (
Forest plot depicting the pooled standard mean difference (95% confidence intervals (lower limit to upper limit) of the short-interval intracortical inhibition (SICI) between the affected hemisphere versus unaffected hemisphere.
Forest plot depicting the pooled standard mean difference (95% confidence intervals (lower limit to upper limit) of the short-interval intracortical inhibition (SICI) between the affected hemisphere versus uninjured controls.
MEP Amplitude
A total of 17 studies were included that compared AH versus UH with sample sizes of 237 and 267, respectively (
Intracortical Facilitation
A total of 18 studies were included that compared AH versus UH with sample sizes of 343 and 377, respectively (
Risk of Publication Bias
Visual inspection of funnel plots indicated some possibilities of bias for the variables included in the analysis. The Egger’s test indicated significant bias for both MT (P < .05), SICI (P < .01), and ICF (P < .05). For MEP, Egger’s test was only significant when comparing AH and UH (P < .01).
Decision Trees
Decision tree analyses were performed to visualize how demographic and methodological variability within studies contributed to alterations in corticospinal and intracortical excitability. Overall, these models were able to categorize these studies with high accuracy (73%-86%). Specific factors and their relative contributions in constructing these models (ie, relative gain) are described below, and the results of the five-fold cross-validation are provided in the supplemental materials (Supplemental Figure 9).
Motor Threshold
The decision tree comparing MT of AH with UH (Figure 6) highlighted the time after stroke as the most important factor for predicting if patients had reduced corticospinal excitability, where studies with reduced time after stroke (ie, ≤1327.5 days) were more likely to have reduced corticospinal excitability (Gain = 100%). This factor was able to predict studies that found reduced corticospinal excitability with 73.0% accuracy. Cross-validation affected this accuracy by 18.9%. When comparing MT of AH with Control, no factors explained whether or not the patients would have reduced corticospinal excitability.
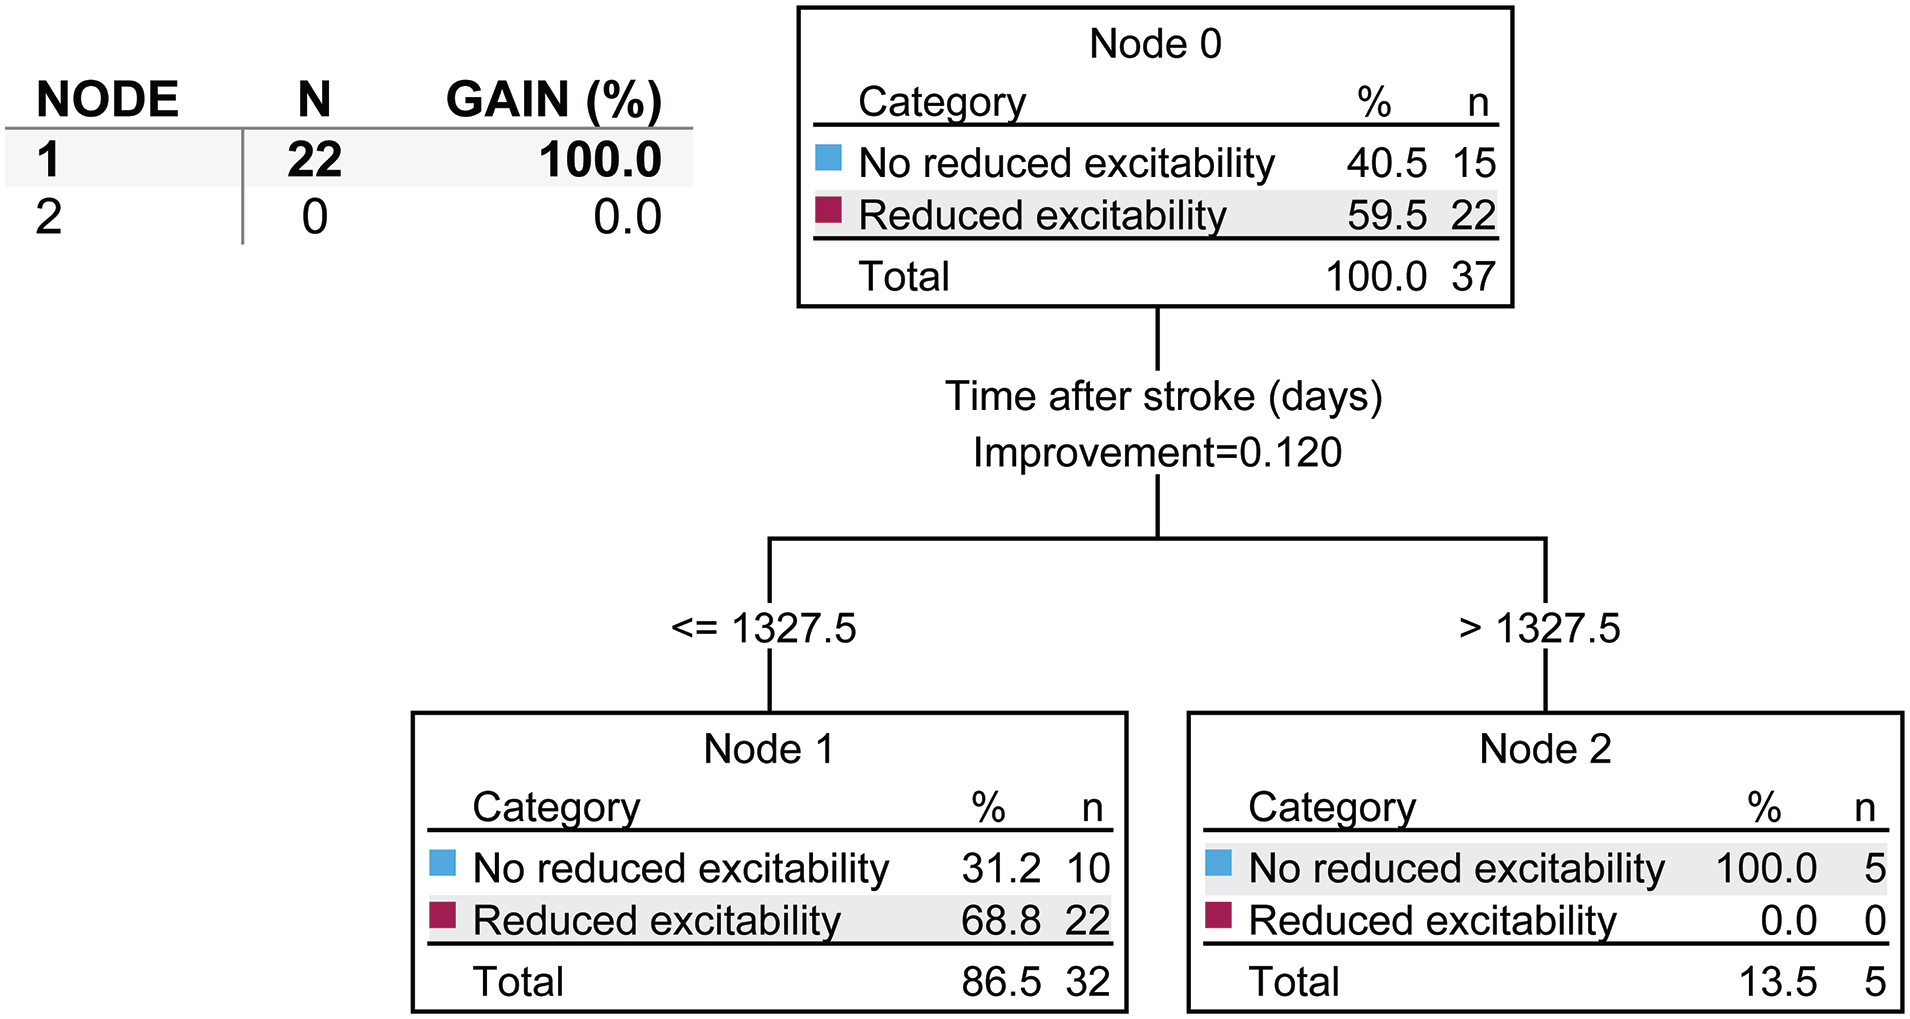
Decision tree for motor threshold (MT) between the affected hemisphere and unaffected hemisphere. In each node, n refers to the number of studies and not the number of subjects. Decision tree conditions: maximum depth of tree of 3; minimum value of parent node of 8; and a minimum value of child node of 4. Nodes are considered to significantly contribute to predictions of altered intracortical inhibition if they represent a gain >10%.
Short-Interval Intracortical Inhibition
The decision tree comparing SICI of AH with UH (Figure 7) indicated that the sample size was the most important factor in predicting intracortical inhibition, where studies with lower sample sizes (ie, ≤12.5 subjects) often found reduced intracortical inhibition. Further, in studies that had lower sample sizes, the type of measurement that was performed was the next most important predictor of inhibition, where studies using the conventional method often showed reduced intracortical inhibition (Gain = 52.6%). In studies with larger sample sizes (ie, >12.5 subjects), the time after stroke was the next most important factor for predicting inhibition, where studies of more chronic patients (ie, >628.5 days after stroke) often showed no reduction in intracortical inhibition. Finally, in studies with large sample sizes (ie, >12.5 subjects) and reduced time after stroke (ie, ≤628.5 days), the average age of the subjects was the next most important factor for predicting reduced intracortical inhibition (≤63.8 years). Typically, younger patients in these studies exhibited reductions in intracortical inhibition after stroke (Gain = 28.9%). These factors were able to predict studies that found reduced intracortical inhibition with 82.8% accuracy. Cross-validation affected this accuracy by 17.2%.
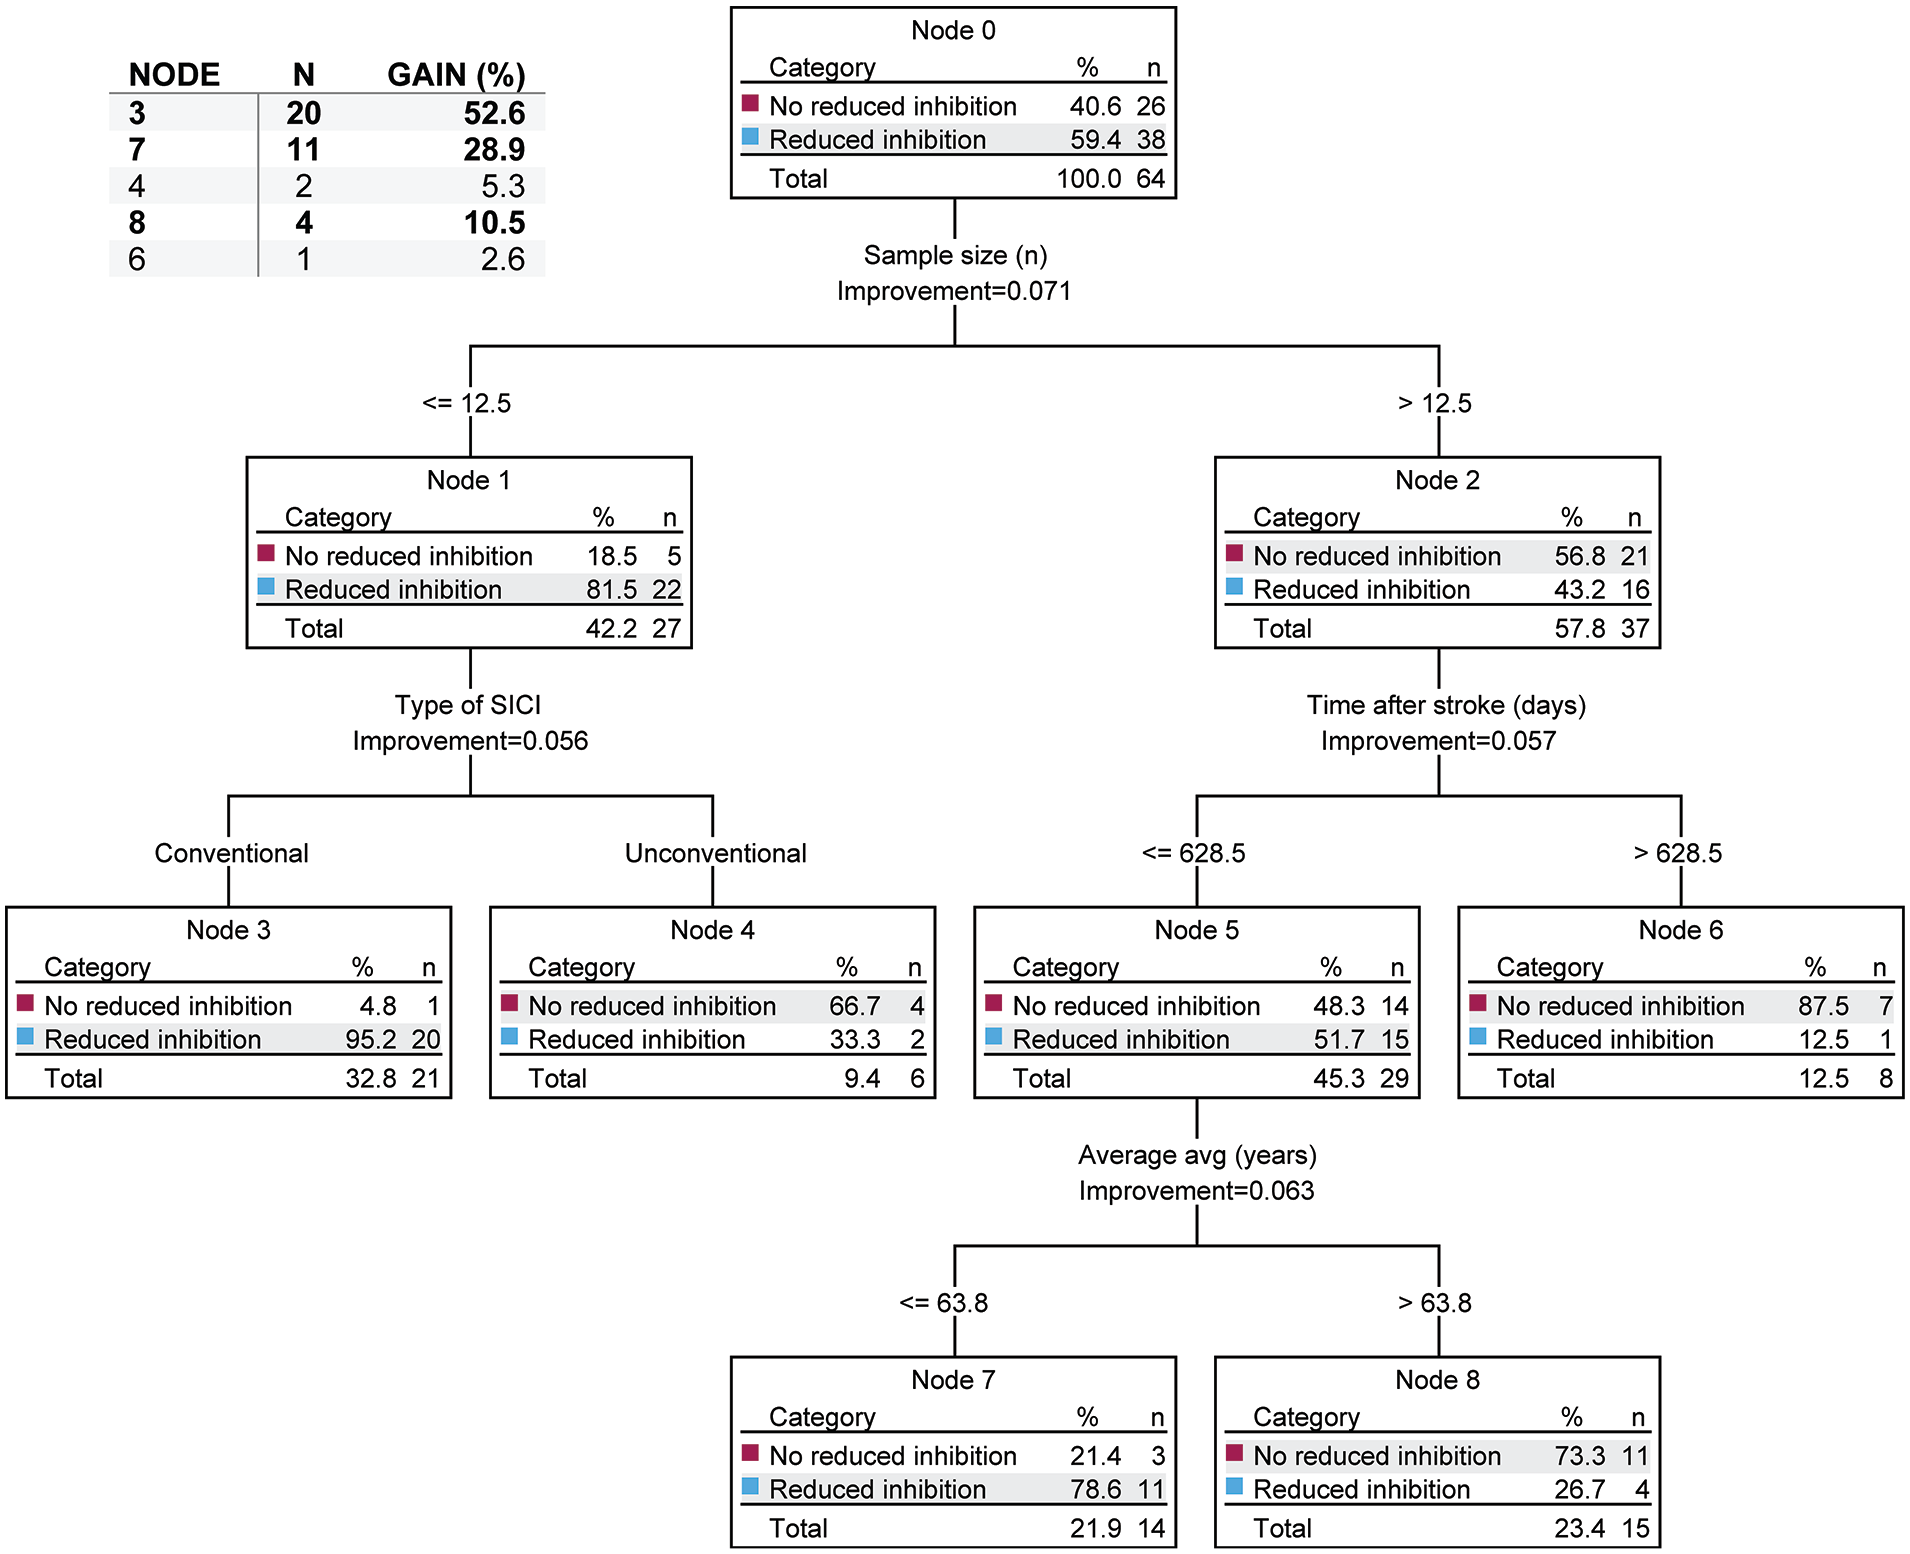
Decision tree for short-interval intracortical inhibition (SICI) between the affected hemisphere and unaffected hemisphere. In each node, n refers to the number of studies and not the number of subjects. Decision tree conditions: maximum depth of tree of 3; minimum value of parent node of 8; and a minimum value of child node of 4. Nodes are considered to significantly contribute to predictions of altered intracortical inhibition if they represent a gain >10%.
When comparing SICI of AH with Control (Figure 8), the time after stroke was the most important factor for predicting reduced intracortical inhibition, where studies with reduced time after stroke (ie, ≤863.4 days) were more likely to have reduced intracortical inhibition. In studies with reduced times after stroke, the next most important factor for predicting inhibition was the TSI, where studies using lower TSIs (ie, ≤127.98% MT) showed reduced intracortical inhibition. Finally, in studies with lower test stimulus intensities, the CSI was the next most important factor for predicting reduced intracortical inhibition, where studies that used higher CSIs (ie, >60% MT) were more likely to show reduced intracortical inhibition (Gain = 96.2%). These factors were able to predict studies that found reduced intracortical inhibition with 79.2% accuracy. Cross-validation affected this accuracy by 20.9%.
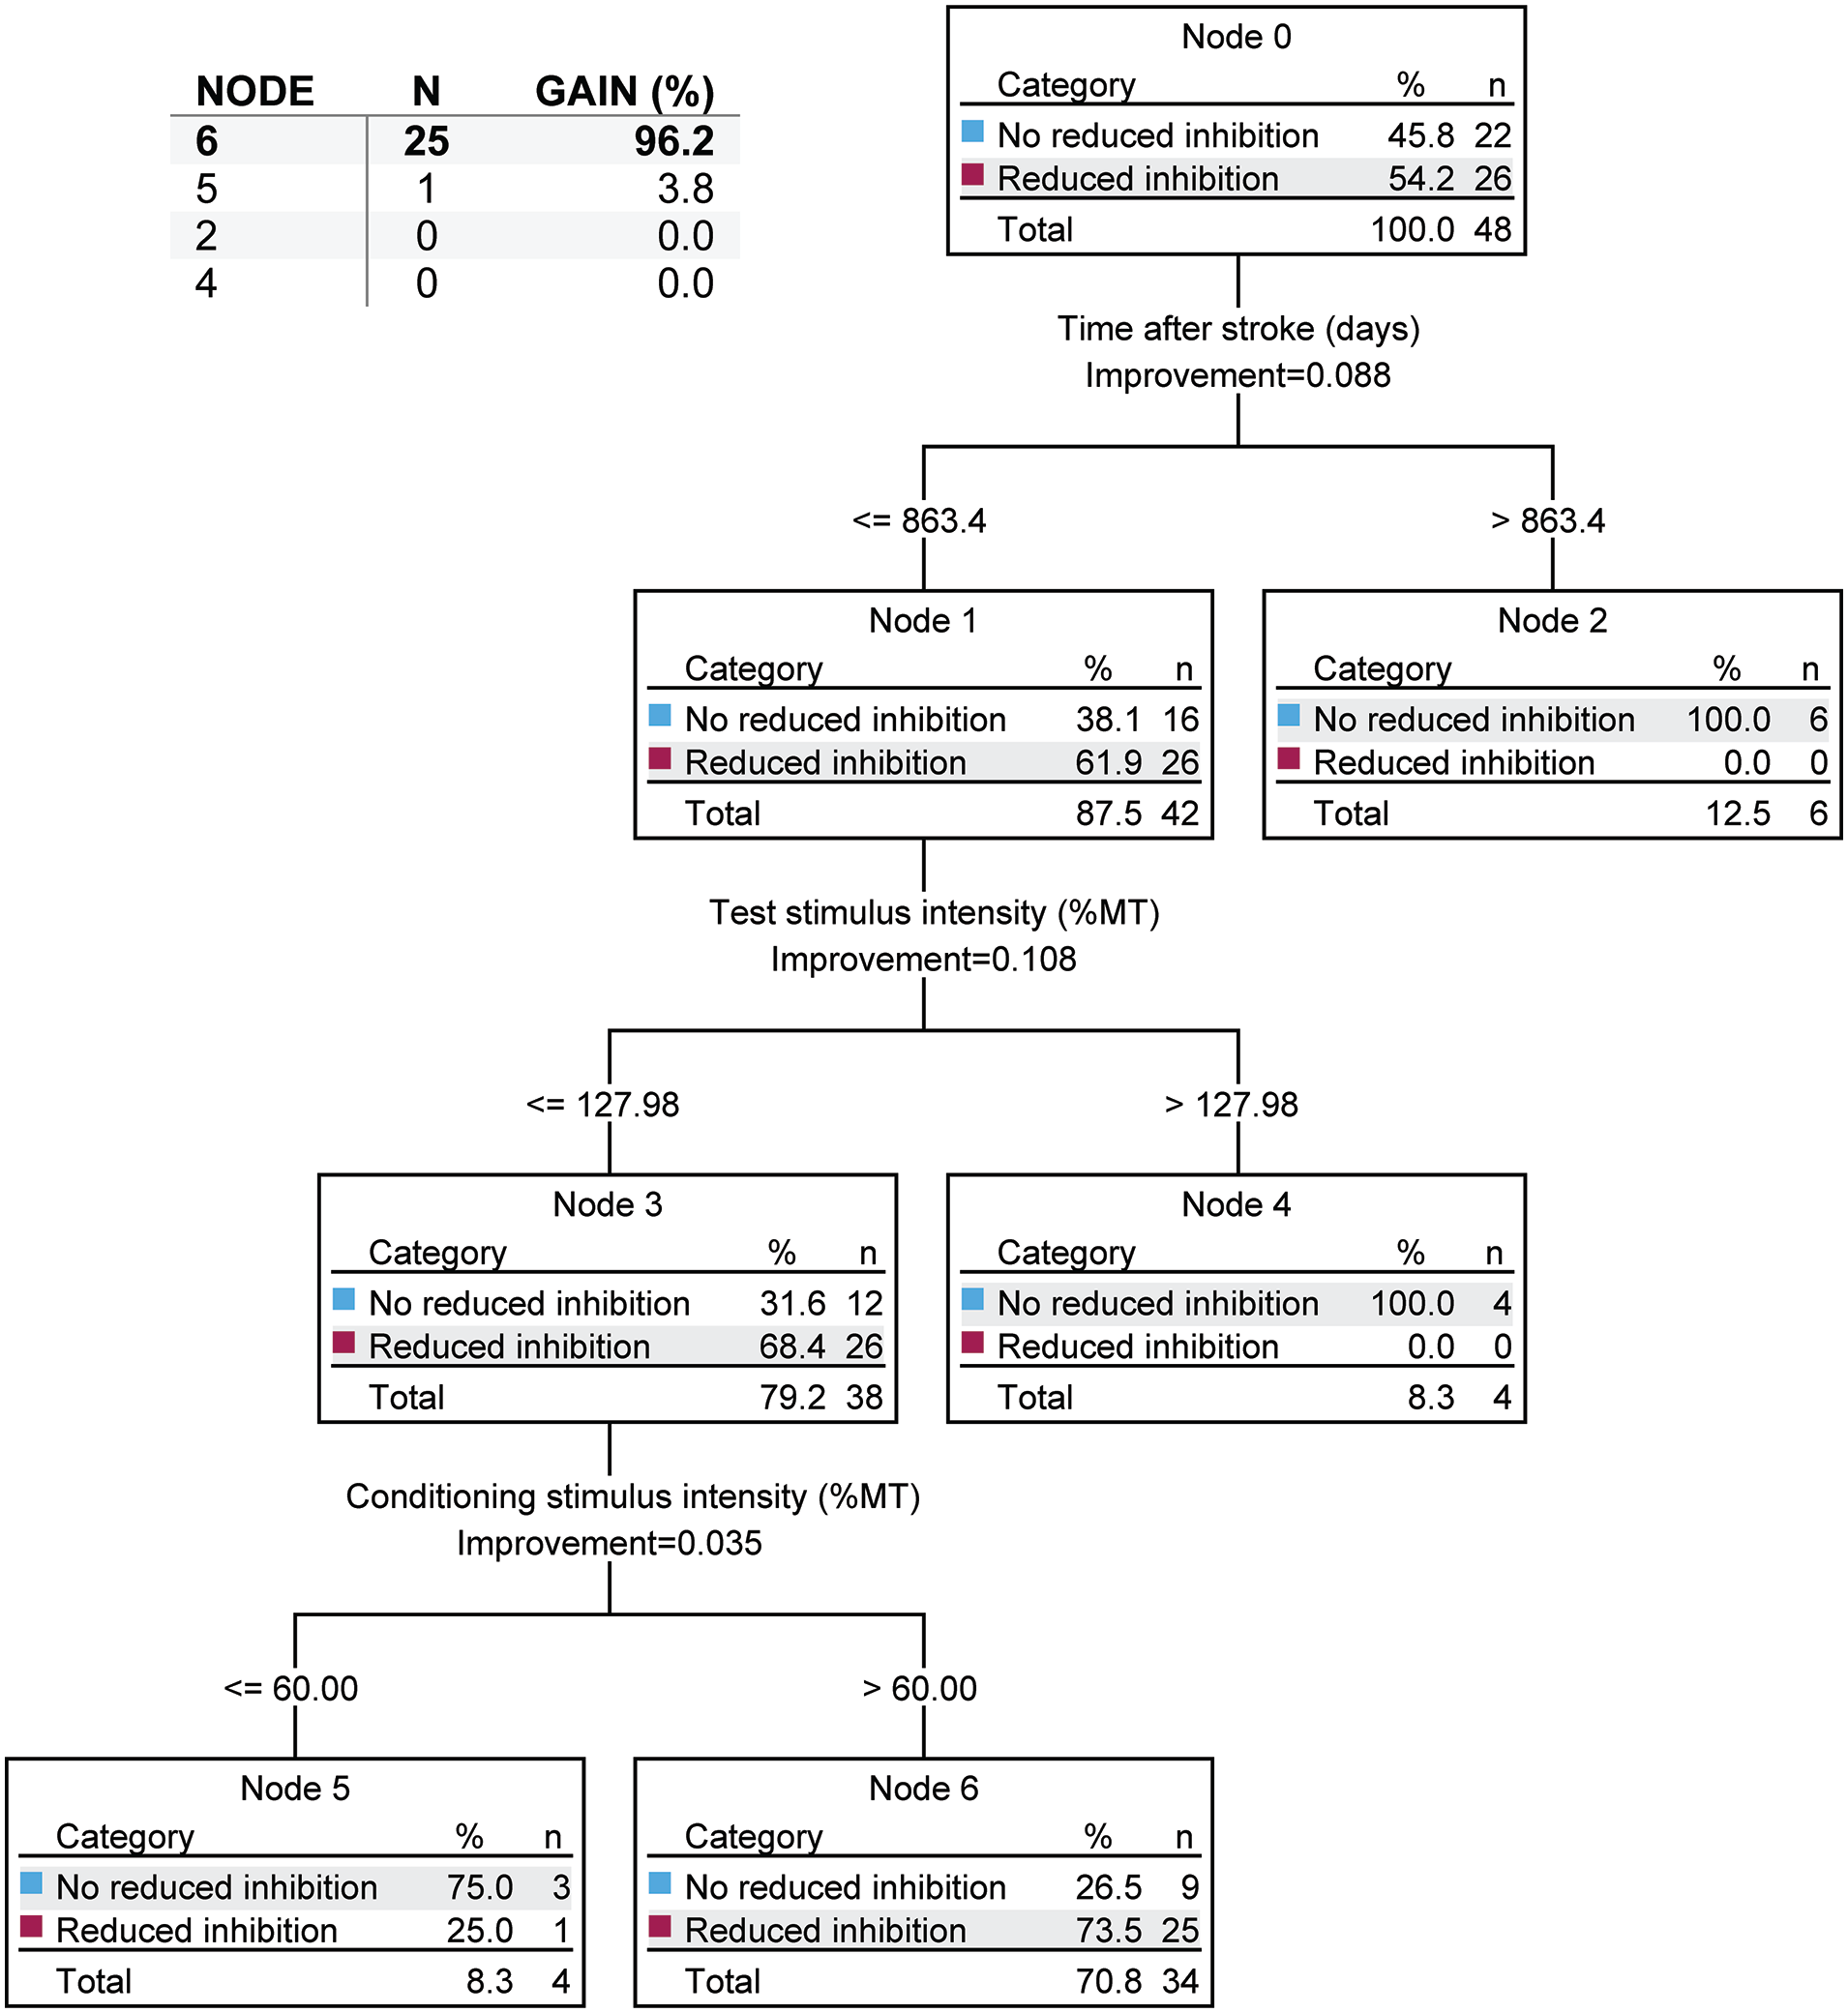
Decision tree for short-interval intracortical inhibition (SICI) between the affected hemisphere and uninjured controls. In each node, n refers to the number of studies and not the number of subjects. Decision tree conditions: maximum depth of tree of 3; minimum value of parent node of 8; and a minimum value of child node of 4. Nodes are considered to significantly contribute to predictions of altered intracortical inhibition if they represent a gain >10%.
When comparing SICI of UH with Control (Supplemental Figure 10), the average age of the participants was the most important factor for predicting inhibition, where studies with younger participants (ie, ≤64.95 years) were more likely to show reduced intracortical inhibition. In studies with younger participants, the time after stroke was the next most important factor for predicting reduced intracortical inhibition, where studies that examined lower time after stroke (ie, ≤279.3 days) were more likely to show reduced intracortical inhibition. Further, in the studies that examined lower time after stroke, most of the studies that showed reduced inhibition examined participants that were even more acute (ie, ≤101.8 days; Gain = 55.0%). Finally, in studies with older participants (ie, >64.95 years), the study sample size was the next most important factor for predicting reduced intracortical inhibition, where studies with larger sample sizes (ie, >12 subjects) were more likely to see reductions in intracortical inhibition (Gain = 25.0). These factors were able to predict studies that found reduced intracortical inhibition with 85.7% accuracy. Cross-validation affected this accuracy by 28.6%.
MEP Amplitude
When using decision trees to compare MEP amplitude of AH with UH and AH with Control, no factors explained whether or not the patients would have reduced corticospinal excitability.
Intracortical Facilitation
The decision tree comparing ICF of AH with UH (Supplemental Figure 11) highlighted the TSI as the most important factor for predicting if patients had increased facilitation (ie, reduced inhibition), where studies with higher TSIs (ie, >122.5%MT) were more likely to have increased facilitation (Gain = 27.6%). Further, in studies that used lower TSIs, the CSI was the next most important factor for predicting if participants had increased facilitation, with studies that used higher CSIs (ie, >77.50%MT) were more likely to have increased facilitation (Gain = 37.9%). Finally, in studies that used lower CSIs, the sample size was the next most important factor for predicting if there was an increase in facilitation, where studies with smaller sample sizes (ie, ≤9 subjects) were more likely to see increased facilitation (Gain = 13.8%). These factors were able to predict studies that found increased facilitation with 76.5% accuracy. Cross-validation affected this accuracy by 23.6%.
The decision tree comparing ICF of UH with Control (Supplemental Figure 12) highlighted the average age of the subjects as the most important factor for predicting if patients had reduced facilitation (ie, increased inhibition), where studies with younger participants (ie, ≤66.35 years) were more likely see reduced facilitation. Further, in studies that tested on younger participants, the study's sample size was the next most important factor for predicting if participants had reduced facilitation, with studies that tested on fewer subjects (ie, ≤14.5 subjects) being more likely to see reduced facilitation (Gain = 61.9%). Finally, in the studies that tested on larger samples, the average age of the participants was again the next most important factor for predicting if there was reduced facilitation, where studies that tested on younger subjects (ie, ≤63.8 years) were more likely to see reduced facilitation (Gain = 19.0%). These factors were able to predict studies that found reduced inhibition with 83.8% accuracy. Cross-validation affected this accuracy by 21.6%.
Discussion
The purposes of this meta-analysis were to (1) systematically evaluate the current literature on alterations in corticospinal (MT and MEP) and intracortical excitability (SICI and ICF)following stroke and (2) use a novel decision tree analysis to identify the methodological and demographic factors that contribute to variability in study outcomes for corticospinal and intracortical excitability. The key findings of this meta-analysis were (1) corticospinal excitability of the AH was significantly reduced when compared with the UH and Control; (2) SICI of the AH was increased (ie, intracortical inhibition was reduced) when compared with the UH and Control; (3) intracortical inhibition was bilaterally reduced when compared with Control after stroke; (4) ICF was increased in the AH when compared with the UH (ie, increased facilitation) and decreased in the UH when compared with Control; (5) corticospinal excitability in the AH was found to recover in comparison with the UH with time after stroke; and (6) demographic and methodological factors accurately predicted (73%-86%) studies that showed alterations in corticospinal and intracortical excitability measures. These findings collectively improve our understanding of neurophysiological alterations in corticospinal and intracortical excitability after stroke and emphasize the importance of restoring functional connectivity and normal intracortical excitability after stroke.
A key finding of this meta-analysis was that corticospinal excitability of the AH was significantly reduced when compared with the UH and Control; however, there were no differences when comparing the UH with Control. This indicates that stroke-induced changes in corticospinal excitability are hemisphere-specific, and largely confined to the affected area of the brain. The reduced corticospinal excitability in the AH is most likely indicative of a reduction of functional connectivity and is of cortical origin, as previous studies have demonstrated that spinal excitability increases after stroke. 67 Interestingly, the results of the decision tree analysis on MT indicated that studies that included participants that were greater than 3.5 years after stroke did not show reduced corticospinal excitability, indicating that some measures of excitability were generally restored with time after stroke. We note that, although the decision tree analysis did not predict the chronicity of stroke improves MEP amplitude, our Forest plot indicated that many studies evaluating chronic stroke survivors generally showed recovery of MEP (Supplemental Figure 3). While MEP amplitudes can be confounded by the MT used for the stimulation, as MEP amplitudes are typically reported at a pre-defined %MT, the observation that MT recovered with time indicates that this was not the case.
We also found that the SICI was reduced (ie, increased excitability) in the AH when compared with both the UH and Control, and that ICF was increased in the AH when compared with the UH. These observations are interesting, as they are contrary to the general notion that stroke results in inhibition of the affected side. The reorganization of the brain after a stroke, such as the reinforcement of the ipsilateral projections of the non-lesioned hemisphere, 68 naturally results in the facilitation of inhibitory circuits (eg, transcallosal inhibitory pathway) of the lesioned hemisphere. Following this logic, many interventions, such as transcranial direct current stimulation (tDCS) and repetitive TMS (rTMS), have been applied in an attempt to increase cortical excitability and reduce inhibition of the lesioned hemisphere.69-71 While we found that corticospinal excitability of the AH was reduced in stroke patients, our results also dispel the idea that there is increased intracortical inhibition of the AH. Instead, intracortical inhibition is reduced (ie, disinhibition) and ICF is increased (increased facilitation) in the AH following the injury.
It is possible that the observed disinhibition and facilitation could be a compensatory mechanism to account for the reduced corticospinal excitability after stroke. 72 Hence, increasing the intracortical excitability may work to facilitate the recovery of MT and MEP. Our decision tree analysis partially supports this reasoning, as we found that MT tends to recover with time, while SICI also begins to normalize with time, especially in younger patients. However, we note that SICI was reduced in the UH while the MT was unaffected. This finding suggests that the reduction in SICI after stroke is mediated by a more generalized central mechanism (eg, molecular and pharmacological factors),73-75 rather than lesion-specific reorganization. It is important to note that, unlike SICI, we observed a significant reduction in ICF of the UH when compared with the Control, which does not support a more generalized central mechanism. However, upon examining the Forest plot, this finding appeared to be primarily driven by studies that involved individuals with central post-stroke pain. 27
It is to be recognized that our findings do not completely dispel the notion other types of inhibition may be occurring following an injury. Notably, SICI is a measure of intracortical inhibition; hence it measures the activity of inhibitory circuits that act within the hemisphere. However, other inhibitory circuits may exist that act to mediate impairment. Specifically, interhemispheric inhibition—inhibition that occurs through circuits connecting the 2 hemispheres (eg, transcallosal pathways) 76 —could still be working to reduce the activity of the affected hemisphere. While testing on this line of research is ongoing, current evidence on the presence of interhemispheric inhibition after stroke is also conflicting. 77 The limited research available suggests that, like with intracortical inhibition, inter-hemispheric inhibition after stroke is also dependent on the methods used to measure inhibition and the stage of recovery. 77 It is generally found that corticospinal excitability appears to be less suppressed by interhemispheric inhibition during the sub-acute phase of stroke when compared with controls, but this pattern reverses in chronic stroke.7,78,79 However, our findings are somewhat contrary to the interhemispheric inhibition model during the chronic phase of stroke, as our decision tree analysis indicated that excitability of the affected hemisphere, as determined by a reduction in MT, also increases in this chronic group. This observation suggests that interhemispheric inhibition gradually decreases, rather than increases, with time. Indeed, a longitudinal study by Takechi et al 7 found transcallosal inhibition reduces gradually with chronicity after stroke. Unfortunately, there are not many longitudinal studies that have evaluated both intracortical and interhemispheric inhibition after stroke, which are critically needed to improve our understanding of post-stroke neuronal reorganization.
Our decision tree analysis uncovered several important factors influencing SICI and ICF. We found that both demographical (ie, age and sample size) and methodological factors (ie, TSI, CSI, and the type of measurement) contributed to the observed variability in study outcomes for intracortical excitability. Particularly, higher CSIs and conventional methods of measuring SICI were generally found to be significant predictors of increased intracortical excitability. Hence, we feel that applying standardized methods should be considered when designing future studies that use SICI to measure neural excitability. Similarly, studies with lower sample sizes (<10-15) were generally showing reduced inhibition or increased intracortical excitability. Thus, future studies should consider using a reasonable sample size to ensure robustness and minimize spurious findings.
TMS-based measures, such as MT, MEP amplitude, SICI, and ICF, are commonly used to assess changes in cortical and corticospinal excitability after neurological injury10,12,72,80; however, they only offer an indirect measurement of cortical excitability and can be affected by spinal and peripheral changes in excitability. For example, MT values will be increased if a subject has greater skull thickness (although this is typically not a problem when performing within-subjects analysis or comparing across an entire sample with similar demographics), and MEP values can be altered due to inhibition or potentiation at the spinal, peripheral, or muscular levels. 81 Although SICI and ICF measures are normalized to remove non-cortical factors, these measures are still collected from the muscle; hence, they are not completely independent of the descending pathways. These potential confounding factors were reduced by performing a cross-sectional analysis, where many of the analyses were within subjects (ie, comparing AH to UH). Regardless, this meta-analysis reveals important information about how these commonly used measures are affected after stroke and also about potential factors that could contribute to the variability in study results.
While this study contributes significantly to our understanding of stroke-induced changes in intracortical and corticospinal excitability, several limitations must be considered. First, the presence of publication bias would typically raise concerns about the validity of our findings, as studies with non-significant results may have been unpublished, skewing the overall analysis. However, we note that we performed a cross-sectional analysis and were not looking to determine the effects of an intervention. As such we scrutinized the results from other cross-sectional studies as well as the baseline measures from studies that performed interventions. Hence, while there may be studies that examined interventions that have gone unpublished and may have contributed data to our analyses, we do not feel that the exclusion of these studies would have altered our findings. Second, our analyses were performed on individual studies using their average findings; hence, it is difficult to ascertain the heterogeneity of the stroke populations (ie, variability in stroke type, location, severity, and the time elapsed since the stroke) included in these studies and analysis. Controlling for these factors would require intimate knowledge of the datasets used in each study, which adds a level of complexity to the analysis and reduces the feasibility of performing this research. However, the ideal method for answering these research questions would contain the individual patient data from all of the included studies, which may be possible in the future given the drive for data sharing policies established by several journals and funding agencies. Third, the sample size (ie, the number of studies) in some of the nodes in the decision tree analyses contained a small number of observations (ie, n < 5). Therefore, these results need to be interpreted with caution as the accuracy of the model can become unreliable. However, we note that cross-validation on untrained datasets reduced this accuracy only by 17% to 25%, indicating that the model was generally robust in prediction. Although we used the commonly recommended node sizes based on our overall sample size, there is no clear consensus on the choice of these parameters, which makes it difficult for the reader to interpret the meaningfulness of the decision tree model. While we addressed this issue by adding criteria for determining which nodes are meaningful based on the gain of individual nodes (ie, >10% is considered to be meaningful), it is to be noted that these gains can only be used to predict the target variable (eg, increased intracortical inhibition in the AH when compared with the UH) and cannot be used to interpret the non-target variable (eg, no change in intracortical inhibition in the AH when compared with UH). Last, the quality of systematic reviews and meta-analyses is highly dependent on the quality of the studies included in the analysis. While we had strict inclusion criteria to exclude studies that involved case studies and case series, most studies were of small sample size (<30 participants) and were cross-sectional in nature (~75%). Further, most studies used TSIs ≤120%MT, whereas there is some evidence to suggest that SICI is best captured at TSIs >120%MT. 40 Hence, the limitations of these individual studies that were included in this meta-analysis need to be considered while interpreting the study results.
Conclusions
In conclusion, this meta-analysis indicates the presence of altered neural excitability in individuals post-stroke. Specifically, the results indicate that intracortical inhibition is reduced after stroke (ie, increased excitability), which is contrary to the notion of generalized inhibition of the lesioned hemisphere after stroke. The results also indicate that some of these alterations in neural excitability tend to recover with time, albeit not to a complete extent. Our novel decision tree analysis also indicates that demographic and methodological factors can accurately predict studies that show alterations in corticospinal excitability and intracortical excitability. This finding underlines the need for methodological consistency when measuring SICI/ICF and emphasizes the dynamic nature of these changes during the recovery timeline. Future studies should aim for larger, more representative sample sizes and longitudinal designs to map the trajectory of excitability changes following a stroke. To advance the development of targeted interventions, further research is needed to better understand the functional implications of these alterations in corticospinal and intracortical excitability.
Supplemental Material
sj-docx-1-nnr-10.1177_15459683241281299 – Supplemental material for Altered Corticospinal and Intracortical Excitability After Stroke: A Systematic Review With Meta-Analysis
Supplemental material, sj-docx-1-nnr-10.1177_15459683241281299 for Altered Corticospinal and Intracortical Excitability After Stroke: A Systematic Review With Meta-Analysis by Edward P. Washabaugh, Sierra A. Foley, Emily G. Czopek and Chandramouli Krishnan in Neurorehabilitation and Neural Repair
Footnotes
Acknowledgements
None.
Author Contributions
Edward P. Washabaugh: Conceptualization; Data curation; Formal analysis; Methodology; Project administration; Supervision; Visualization; Writing—original draft; Writing—review & editing. Sierra A. Foley: Data curation; Formal analysis; Visualization; Writing—review & editing. Emily G. Czopek: Data curation; Formal analysis; Visualization; Writing—original draft. Chandramouli Krishnan: Conceptualization; Formal analysis; Investigation; Supervision; Writing—original draft; Writing—review & editing.
Declaration of Conflicting Interests
The author(s) declared no potential conflicts of interest with respect to the research, authorship, and/or publication of this article.
Funding
The author(s) received no financial support for the research, authorship, and/or publication of this article.
Supplementary material for this article is available on the Neurorehabilitation & Neural Repair website along with the online version of this article.
References
Supplementary Material
Please find the following supplemental material available below.
For Open Access articles published under a Creative Commons License, all supplemental material carries the same license as the article it is associated with.
For non-Open Access articles published, all supplemental material carries a non-exclusive license, and permission requests for re-use of supplemental material or any part of supplemental material shall be sent directly to the copyright owner as specified in the copyright notice associated with the article.