
Abstract
Background. Training-related improvements in motor function are associated with changes in movement representation of the primary motor cortex (M1). In healthy individuals, transcranial magnetic stimulation (TMS) of M1 delivered in a strict temporal relationship (Hebbian-type stimulation) during execution of movements enhances these effects and is superior to random stimulation. Objective. The authors tested whether training combined with Hebbian-type M1 stimulation enhances M1 reorganization in patients with stroke. Methods. Six patients with chronic stroke participated in the study. Patients executed robot-assisted wrist extension movements at 0.2 Hz frequency while subthreshold repetitive TMS was applied over M1 in a strict temporal relationship to the training movements. TMS was applied to either the affected hemisphere (contralateral M1) or the nonaffected hemisphere (ipsilateral M1) at 0.1 Hz. Intervention-related changes in motor maps and intracortical excitability were measured using TMS. Results. Training alone or combined Hebbian-type stimulation of either M1 resulted in differential effects on motor maps and intracortical inhibition. Shifts in motor maps were associated with increases in intracortical excitability. In contrast to previous results for healthy participants, the inhibitory effect of ipsilateral M1 Hebbian-type stimulation was not present, and the facilitatory effect of contralateral M1 stimulation was more subtle. Conclusions. Hebbian-type stimulation is feasible in patients poststroke and induces map reorganization and associated decreases in GABAergic inhibition. However, because TMS protocols have a different effect on motor reorganization in the injured brain and may depend on location of the lesion, protocols need to be tailored to the patient’s pathology.
Introduction
Behavioral experience clearly affects the organization of hand, arm, and leg representations within the primary motor cortex, M1. 1 In the adult monkey stroke model, postinfarct behavioral training of the affected limb produces reorganization of M1 regions spared after a small lesion to the hand area. 2 Promoting practice with the affected limb in patients can improve motor function and may alter the cortical representation of trained movements. 3-7 The mechanisms involved in these reorganizational changes are not known but may share similarities to use-dependent plasticity in intact M1 8,9 and involve regulation of GABAergic inhibition. For example, in chronic stroke patients, the reduction of GABAergic inhibition enhanced training-related increases in M1 excitability and motor function. 10
Transcranial magnetic stimulation (TMS) is a technique that allows noninvasive focal stimulation of the human brain 11 and can, in particular settings, enhance cortical reorganization. 12 We have previously demonstrated in healthy participants that motor training combined with Hebbian-type TMS of M1 enhanced use-dependent plasticity. 12 In this paradigm, TMS is delivered to M1 contralateral to the training hand during the execution of the training movements in a strict temporal relationship. Because TMS preferentially stimulates intracortical connections targeting pyramidal tract neurons 13 and because stimulation occurs at a time when M1 is engaged in performing a training movement and depolarization of pyramidal neurons is ongoing, this paradigm fulfills the requirements of Hebbian-type stimulation. 14,15 Here, we hypothesize that Hebbian-type M1 stimulation in patients with chronic stroke is effective in increasing use-dependent plasticity as measured in changes of motor representation and intracortical GABA-ergic inhibition.
Materials and Methods
Participants
All patients with stroke referred over 3 years to the hospital of the Heinrich Heine University, Düsseldorf, were assessed for inclusion in the study. Six patients (2 women, age 62.8 ± 9.4 years [mean ± standard deviation], time since stroke 22.0 ± 7.5 months; Table 1, Figure 1) fulfilled the following inclusion criteria and participated in the study: single lesion as defined by MRI of the brain affecting the primary motor output system of the hand either at a cortical (M1) or subcortical level, stroke >6 months prior to entering the study, ability to execute the training task (see the following), completion of a course of rehabilitation therapy poststroke, no active involvement in physical therapy for 8 weeks prior to the study, no other neurological disorder, no contraindication for TMS, no intake of CNS-active drugs, motor-evoked potential (MEP) in response to TMS of M1 of the lesioned hemisphere, and ability to give informed consent.
Patient Characteristics
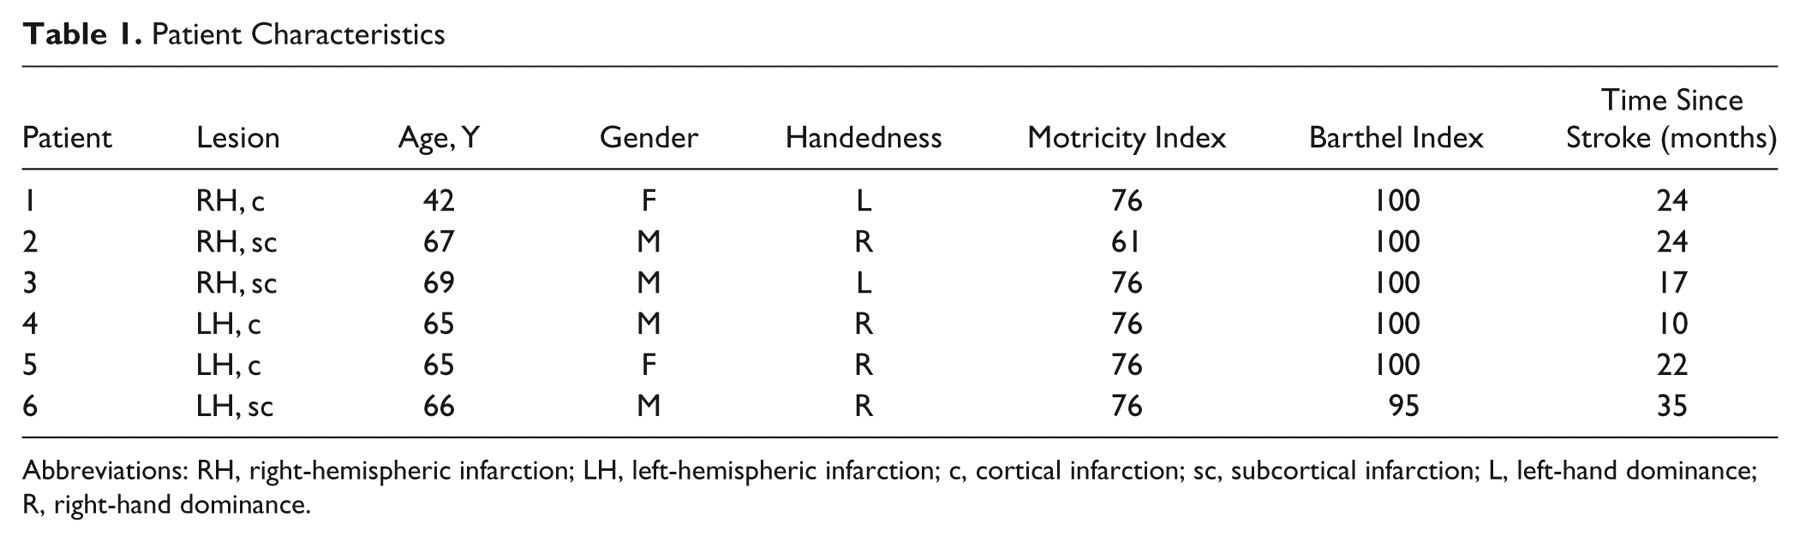
Abbreviations: RH, right-hemispheric infarction; LH, left-hemispheric infarction; c, cortical infarction; sc, subcortical infarction; L, left-hand dominance; R, right-hand dominance.
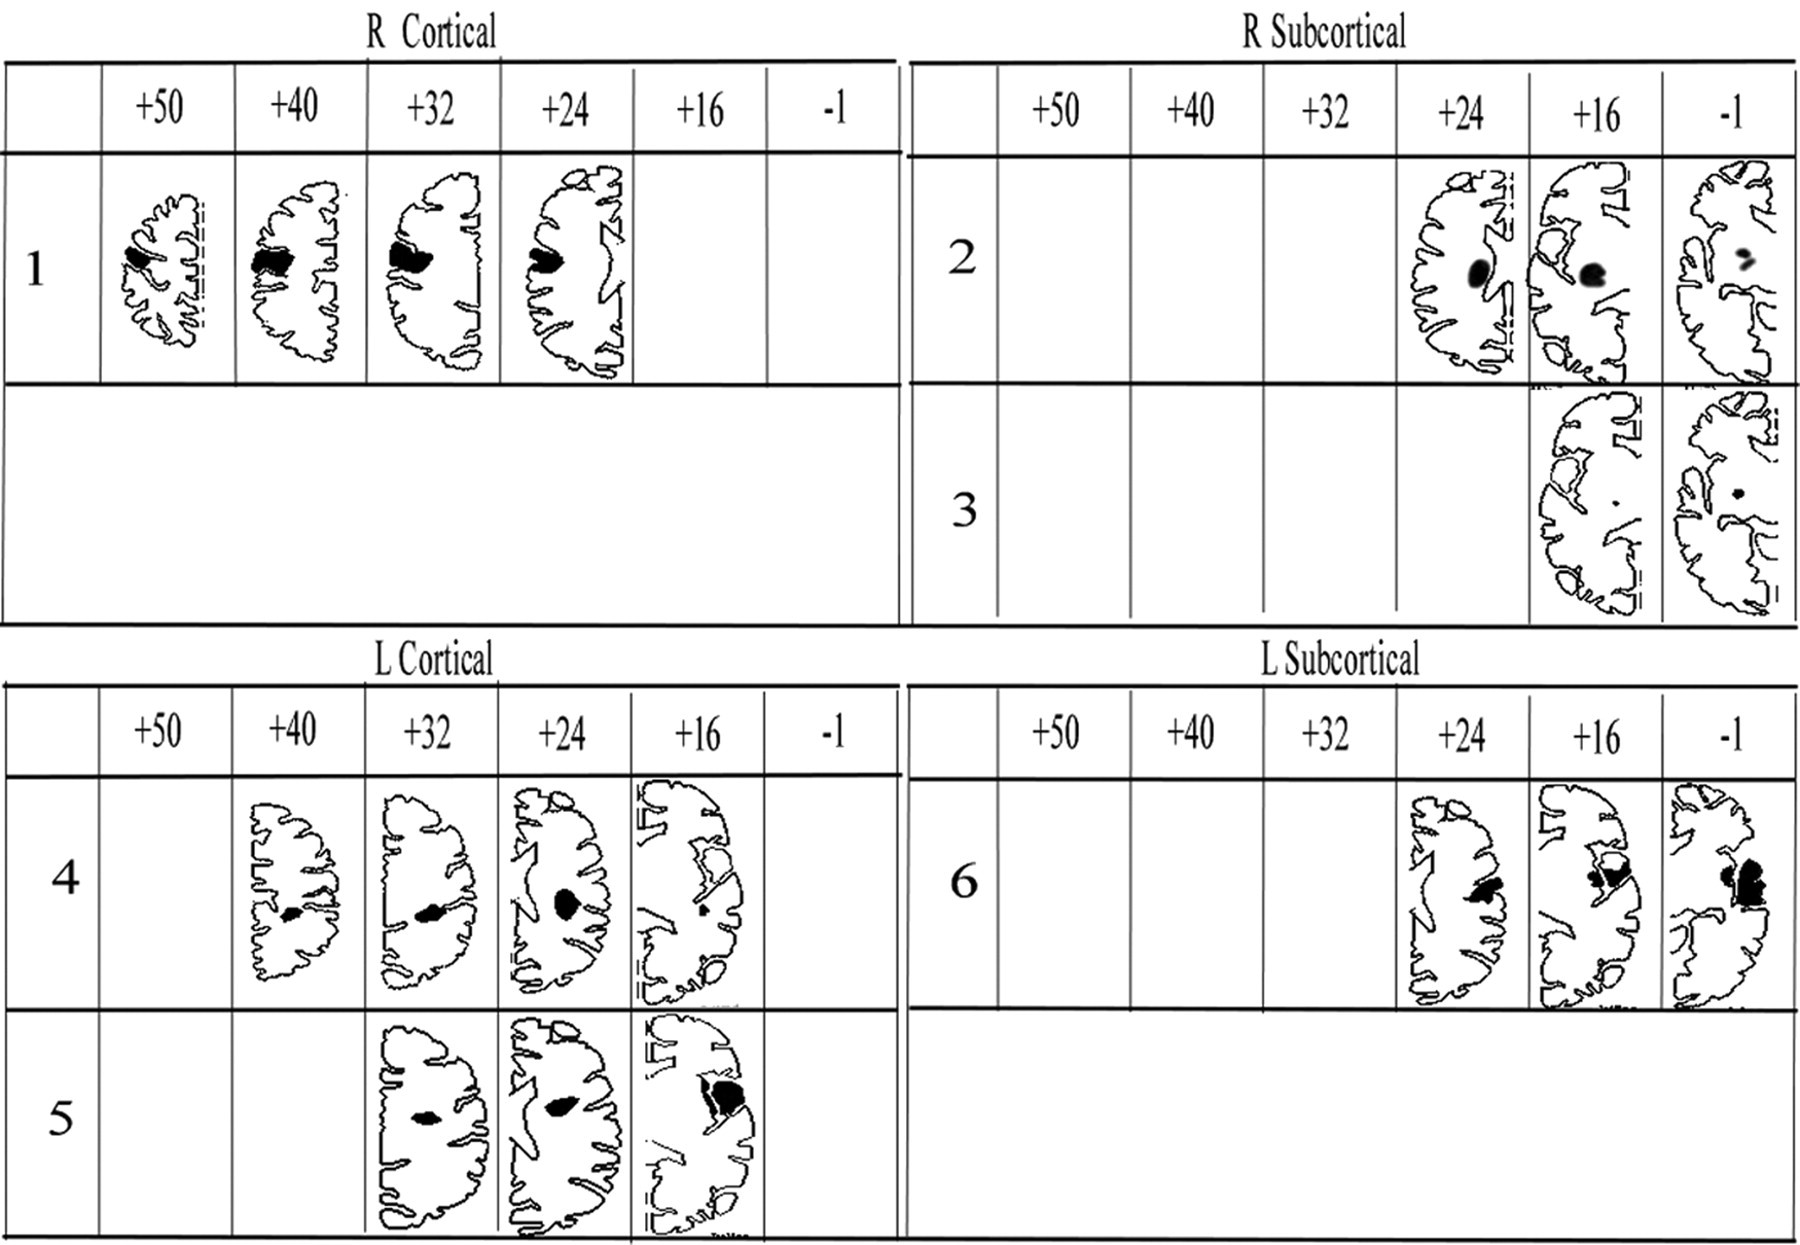
Location and extent of each patient’s infarction. For data display, the MRI of the patient’s brain was transformed into Talairach space (Brain Voyager, BrainInnovation BV, The Netherlands, and Max Planck Society eV, Germany) and the lesion plotted into the corresponding axial slice schematic of the brain. For each patient, the lesion-containing schematics are displayed. Cortical location of the stroke was defined as infarction involving the sensorimotor cortex, and subcortical location was defined as infarction below the level of the corpus callosum, sparing the sensorimotor cortex.
Patients were assessed for handedness using the Edinburgh inventory, 16 for their function in activities of daily living using the Barthel Index, 17 and for hand function using the Motricity Index 18 (Table 1) and Jebsen Taylor Test 19 (Table 2). Data collection was preceded by approval of the Heinrich Heine University ethics committee and provision of informed consent from all participants according to the Declaration of Helsinki.
Patients’ Performance in the Jebsen Test at Baseline
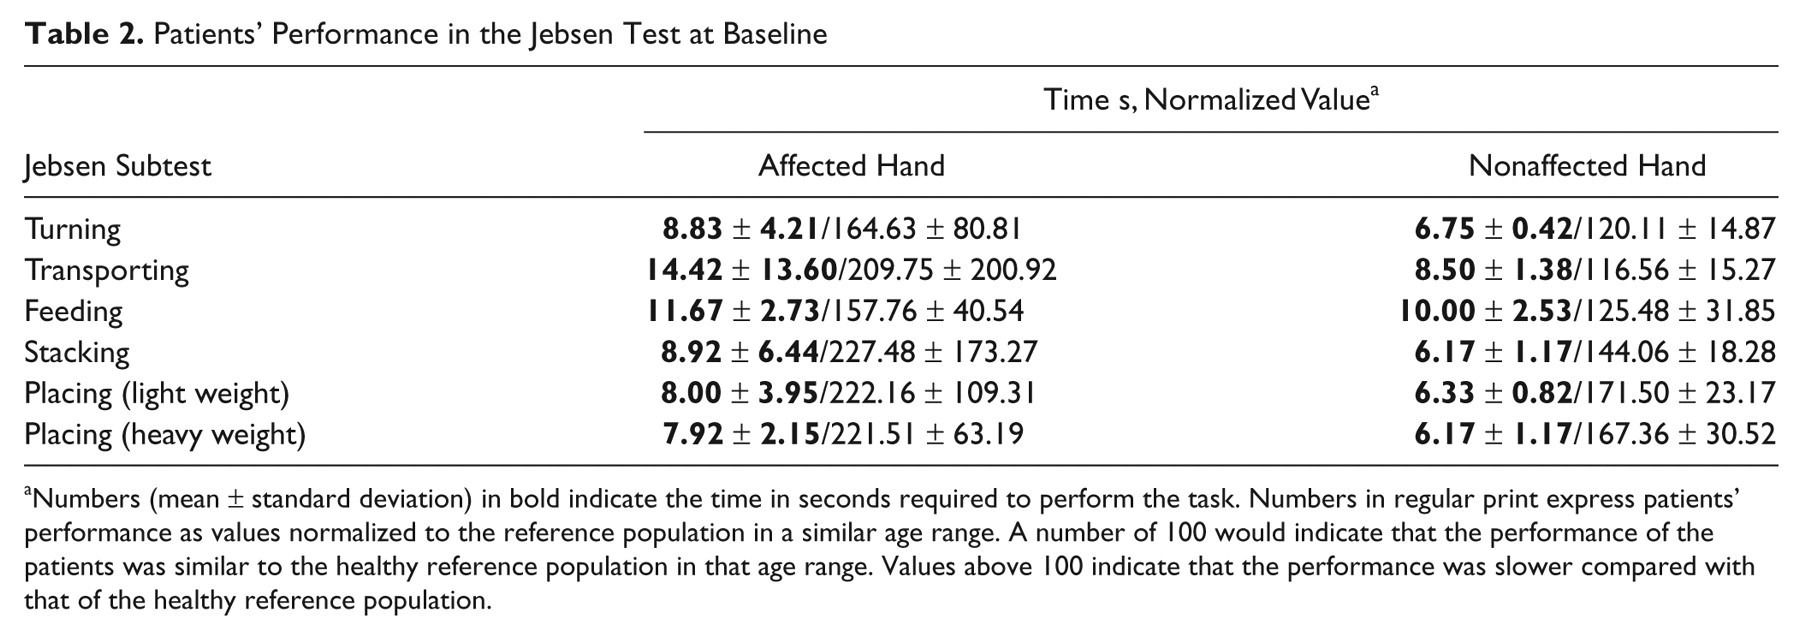
Numbers (mean ± standard deviation) in bold indicate the time in seconds required to perform the task. Numbers in regular print express patients’ performance as values normalized to the reference population in a similar age range. A number of 100 would indicate that the performance of the patients was similar to the healthy reference population in that age range. Values above 100 indicate that the performance was slower compared with that of the healthy reference population.
Overview of Experiments
Participants took part in 3 different experiments separated by >48 hours in a randomized, counterbalanced order: training alone (Train Alone), training with TMS at 0.1 Hz applied synchronously with the training movements in a strict temporal relationship to either contralateral M1 (Train+TMScontra), or ipsilateral M1 (Train+TMSipsi). 12 Patients were blinded to the purpose of the interventions. To describe the effects of the different interventions on M1 reorganization, we defined intervention-related changes in measures of intracortical inhibition (short-interval cortical excitability, SICE), corticospinal excitability (motor threshold, MT), and M1 motor representation (center of gravity [COG] and maximum MEP) as primary endpoint measures (see the following for details). In each experiment, these measures were obtained prior to and after completion of the intervention. Because recent evidence from the rodent stroke model indicates that stroke location affects the results of cortical stimulation, the effect of cortical versus subcortical location of stroke on these outcome measures was explored. 20
TMS and Recordings
Patients were seated in a dental chair with the head resting against a support. The participant’s paretic arm was positioned in a molded armrest with the participant’s forearm immobilized and the wrist freely movable. EMG activity (bandpass 1 Hz-1 kHz) was recorded from the extensor carpi ulnaris (ECU) and biceps muscles of the paretic arm, using surface electrodes (11 mm diameter) in a belly-tendon montage and a data acquisition system (LabVIEW, National Instruments, California). The raw EMG data were sampled and digitized at a rate of 5 kHz and stored on a PC for offline analysis.
Mapping
Verification of stable reference using a 3D navigation system
To ensure TMS coil position stability during the experiment, a 3D navigation system was used (Zebris Medical GmbH, Germany). It consists of small, ultrasound transmitters attached to the patient’s head and the TMS coil. A probe tip is used for localizing landmarks of the patient’s head. Based on the travel time of the ultrasound pulses, the location of the marker in 3D space is determined. For our mapping experiments, we developed a stable reference frame for each participant by using a triplet of markers attached to the patient’s bite bar. In a second step, 3 markers attached to the patient’s forehead were coregistered to this stable reference frame. Once participants were coregistered, the bite bar was removed, and they were able to freely move their head. The accuracy of this method was established by reproducing the maps of the first dorsal interosseous muscle (FDI) in 3 consecutive mapping sessions of healthy participants (data unpublished). Briefly, the FDI muscle of 10 right-handed healthy participants was mapped using a fixed grid of 9 points with an interpoint distance of 2.5° on the scalp (corresponding to 1.0 cm in 2D space). The origin of the x and y coordinates was in CZ of the international (10- 20) EEG electrode placement system. The points of the grid were selected in such a way that the hot spot of the FDI muscle was located in its center. If the hot spot did not coregister with one of the grid points, the grid point closest to the hot spot was selected as its center. In each participant, the FDI muscle was mapped twice within 1 day, with the markers attached to the participant’s forehead. A third mapping was done after the participant’s grid points were reestablished by coregistering the markers of the forehead with the stable reference frame. The results of these mapping experiments revealed a very high degree of accuracy for the COG of the FDI muscle obtained at the 3 different time points (coefficient of variation for the coordinates at the 3 time points were as follows: x: 55.21%, 57.60%, 57.74%; y: −25.00%, −26.28%, −25.39%). These results indicate excellent reproducibility of the coordinates using this navigation system.
Mapping of ECU and biceps muscle in patients with stroke
For the present study, this abbreviated version of the mapping as detailed above was used to capture the time-sensitive training-related changes in MT, maximum MEP, and COG of 2 muscles (1 target and 1 control muscle). Because using the fixed grid of only 9 points raises the possibility that some active sites are not being stimulated, leading to underestimation of the map area and number of active positions, these map characteristics were not calculated. However, the data will provide the most important information on M1 plasticity such as changes in location of COG 21 and maximum MEP amplitudes.
TMS was applied through a figure-of-eight–shaped coil (7 cm wing diameter) using 2 Magstim 200 stimulators connected via a Bistim module (Magstim Company, UK). The coil was positioned on the scalp over M1 of the lesioned hemisphere at the optimal site for stimulating the contralateral ECU or biceps (hot spot). The coil was held tangentially to the skull with the handle pointing posteriorly 45° away from the midline. The position was marked on a 1 × 1 cm2 grid displayed online on a computer screen and served as the center of a 3 × 3 grid. At the hot spot, the resting MT to the nearest 1% of the maximum stimulator output (MSO) was determined (5 MEPs > 0.05 mV in 10 stimulations). 22 A total of 10 stimuli were given to each point of the 3 × 3 grid at an intensity of 120% MT. The order of stimulation was randomized.
Paired-pulse TMS
Paired-pulse TMS at short interstimulus intervals can be used to study excitability of M1 in patients poststroke. 23,24 In this paradigm, a suprathreshold test pulse (TS) is preceded by a subthreshold conditioning pulse (CS) at an interstimulus interval of 2 ms. In intact M1, CS inhibits the MEP produced by the subsequent TS. This effect is mediated by GABAA receptors 25 and arises in close proximity to the stimulated area. 26 Because in patients with stroke facilitation may be seen in this paradigm, we recently introduced the term short interval cortical excitability to describe this experimental phenomenon. 24 We used increasing CS intensities of 25%, 30%, 35%, and 40% of MSO as it allows us to study the effects mediated by inhibitory and excitatory interneurons in more detail and to capture the maximum inhibitory effect. 24 The intensity of TS was kept constant at 120% of the MT. 23 Paired pulses (5 pairs) were intermixed with single test pulses and CSs (5 of each) and administered randomly to the hot spot.
Following the different interventions, the location of the hot spot and the MT at the hot spot were again determined (same as previously) and the intensity of the TMS adjusted accordingly. Care was taken to include the new hot spot in the fixed grid.
Interventions
Train Alone
Participants performed ballistic wrist extension movements in 3 blocks of 10 minutes for a total of 30 minutes, at 0.2 Hz. 10 The effect of repetitive movements of the elbow, wrist, or finger/thumb on movement kinematics and motor cortex excitability have been studied previously in patients poststroke 10,27 and in healthy participants. 8,28-32 It led to improvement of kinematics 10,27 and increases in MEP amplitudes 10 and SICE. 29 An LTP-like mechanism is thought to be involved in these changes. 8,32 Training of wrist extension is functionally important as it is essential for wrist stabilization. It has been shown to generalize into overall improved function of the upper extremity. 27 Because timing and selection of targeted elements of movements is a crucial prerequisite for Hebbian-type stimulation, an upper-extremity robot (Bi-Manu-Track, Reha-Stim, Berlin, Germany; Figure 2) was used as an aid in training. 33 The robot provides a means of accurately controlling the previously mentioned variables.
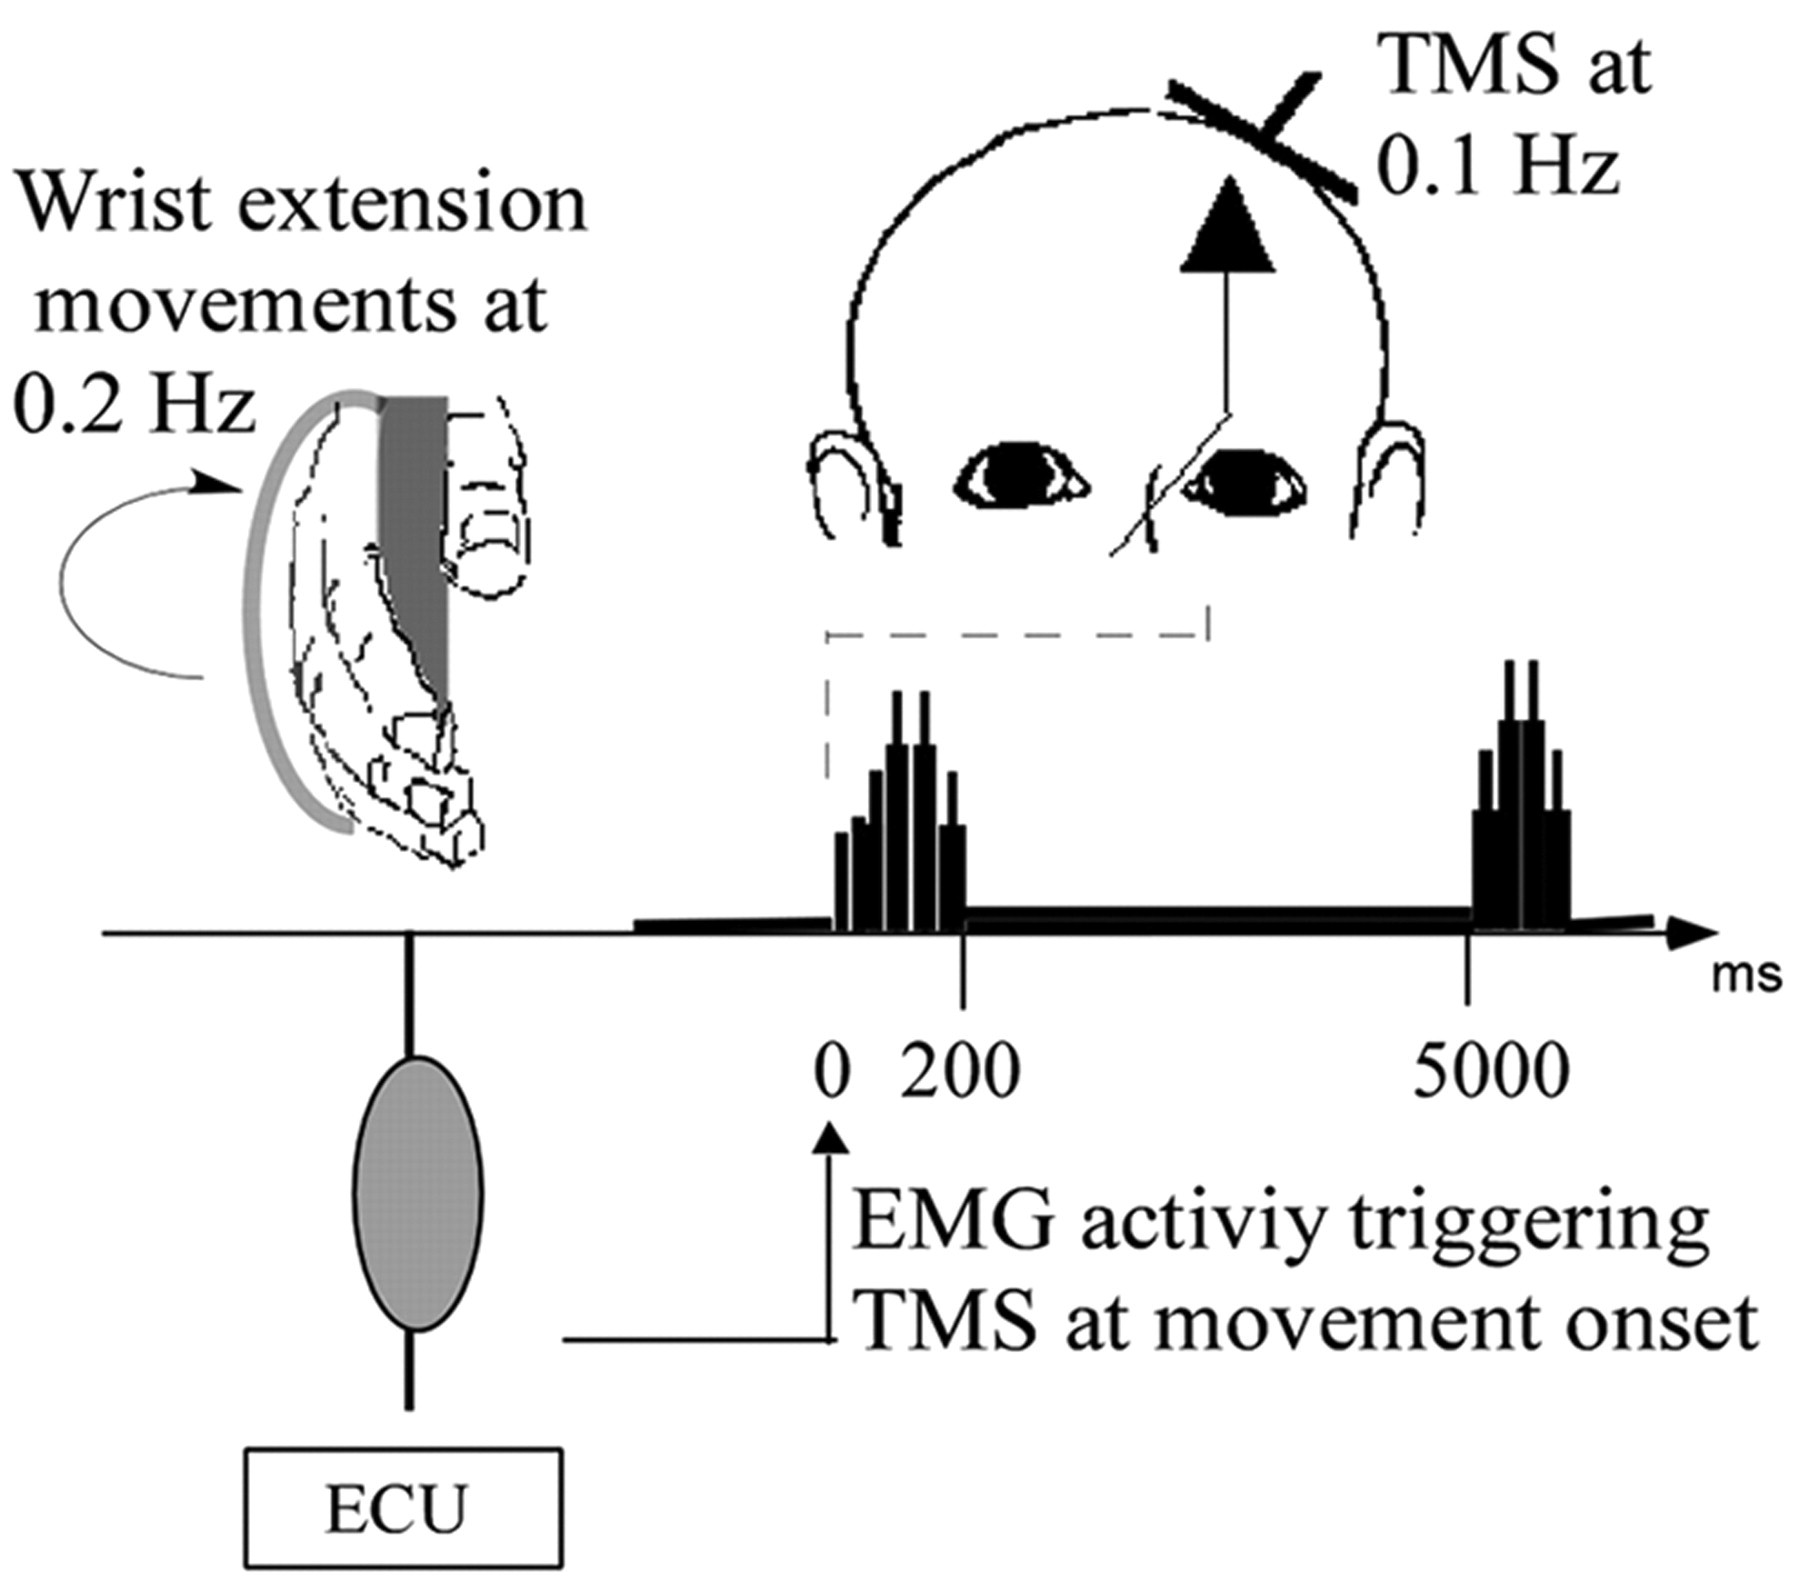
Schematic of the experimental setup for training combined with TMS to the contralateral M1 (Train+TMScontra). Patients were instructed to perform brisk wrist extension movements with the paretic hand, at 0.2 Hz frequency. A strap secured the hand, and foam cushions supported the forearm. EMG activity was recorded from a muscle supporting the training movements (training agonist, ECU). In the schematic, EMG activity related to 2 ballistic wrist extension movements are shown. The x-axis indicates time between bursts. The EMG signal was fed into a custom-built trigger device. Depending on the voltage of the EMG amplitude, the signal exceeded a preset threshold that gave rise to a TTL signal to trigger the TMS machine. The threshold was set to 10% to 20% of the maximal EMG amplitude during a ballistic training movement. As a result, TMS to M1 occurred within 50 ms of the EMG burst generated by the ECU (see Table 3). The rate of TMS was set to 0.1 Hz frequency. Note, because TMS intensity was subthreshold, there was no MEP evoked by the pulse Abbreviations: TMS, transcranial magnetic stimulation; contra, contralateral; ipsi, ipsilateral; ECU, extensor carpi ulnaris; MEP, motor-evoked potential.
Specifically, the patient’s arm was immobilized, but the hand was allowed to move freely (Figure 2). With the hand in a semisupine position, the participant’s fingers enclosed a handle attached to a torque motor. A strap secured the position of the fingers. After an acoustic “go” signal, participants extended their hand against minimal resistance as quickly as possible and then relaxed. Following every single training movement, the patient’s hand was moved back to the original position by the robot-operated handle, as confirmed by the absence of EMG activity during the repositioning of the wrist. Training movements were recorded by the Bi-Manu-Track device (Reha-Stim, Berlin, Germany) and stored for offline analysis. To ensure a consistent quality of the motor training across conditions (defined as the accuracy and consistency of the wrist extension movements), movements were monitored. If necessary, participants were encouraged to perform better.
Train+TMScontra
Participants performed wrist movements at 0.2 Hz, as in Train Alone. A TMS pulse was applied at about 0.1 Hz to the contralateral M1 at 80% resting MT of ECU, synchronous with 1 out of every 2 voluntary wrist movements. The TMS device was triggered by a Transistor-Transitor Logic (TTL) pulse that was generated in response to the EMG burst of the ECU muscle reaching a predetermined threshold amplitude level. The threshold was set at approximately 10% to 20% of the maximal amplitude of the EMG of the ECU muscle, resulting in application of TMS within the first third of the EMG burst. 12 Because in nonhuman primates, M1 activity associated with performance of ballistic movements lasts for about 250 ms after EMG onset, 34 TMS pulses should arrive synchronously with cortical activity in M1, generating the training movements.
Train+TMSipsi
Participants performed voluntary wrist extension movements at 0.2 Hz, as in Train Alone. A single TMS pulse was applied at about 0.1 Hz to the ipsilateral M1 at 80% MT, synchronous with 1 out of every 2 voluntary wrist movements. As in Train+TMScontra,the TMS device was triggered by a custom-made device that generated a TTL pulse in response to the EMG of the ECU muscle of the paretic hand.
Data Analysis and Statistical Methods
MEP amplitudes were measured offline. Recordings with EMG background activity were excluded from further analysis. For mapping, the average of the MEP amplitudes at each grid location was calculated. For paired-pulse TMS, MEP amplitudes elicited at different CSs were calculated as a percentage of the mean test MEP amplitude evoked by TS alone. CS intensities were expressed as percentages of MSO.
Time of TMS in reference to the training movement
The time interval between the application of the TMS pulse (indicated by a TTL signal in the recording) and onset of EMG burst of the ECU muscle was determined in a representative sample of 60 training trials.
Quality of training movements
For each type of intervention, the mean angle of the wrist extension movements was calculated. For comparison of the mean angle of wrist extension movement across different conditions, a factorial ANOVA with type of training as the independent variable and training angle as the dependent variable was carried out.
Motor threshold
Repeated-measures ANOVAs with muscles (ECU and biceps, Muscle), time of measurement (pretraining and posttraining, Time), and training conditions (Train Alone, Train+TMScontra, and Train+TMSipsi, Intervention) as within-group variables was calculated. In a second repeated-measures ANOVA, the effect of lesion location (subcortical vs cortical) as a between-group variable was explored with the same within-group variables of Muscle, Time, and Intervention. According to our hypothesis, a 1-sided paired t test was carried out for the MT of the ECU, and a 2-sided paired t test was carried out for the MT of the biceps.
Short-interval cortical excitability
Repeated-measures ANOVA with different CS intensities (CS), intervention (Train Alone, Train+TMScontra, and Train+TMSipsi, Intervention), time of measurement (baseline and posttraining, Time), and type of muscle (ECU or biceps muscle, Muscle) as within-group variables was calculated. In a second repeated-measures ANOVA, the effect of lesion location (subcortical vs cortical) as a between-group variable was explored keeping the same within-group variables (CS, Intervention, Time, and Muscle). Posthoc testing using a paired test was done.
Mapping
The COG and the maximum MEP amplitude of the map were calculated. Changes in the COG were calculated as the difference between x and y coordinates and are expressed in centimeters. The x and y coordinates were entered in the 2 separate repeated-measures ANOVAs as dependent variables (x and y Coordinate). Data of the 3 participants with right-hemispheric strokes were transformed into the left-hemispheric space for group comparisons. Repeated-measures ANOVAs with muscles (ECU and biceps, Muscle), time of measurement (pretraining and posttraining, Time), and training conditions (Train Alone, Train+TMScontra and Train+TMSipsi, Intervention) as within-group variables were carried out. To explore the effect of lesion location on the training-related COG and MEP amplitude changes, a second repeated-measures ANOVA with the same within-group variables (CS, Intervention, Time, Muscle) and location of stroke (cortical vs subcortical) was calculated.
Results
Training
All patients were able to complete all 3 experiments. There was no evidence for a carryover effect as indicated by the lack of order effect on MT and the location of COG and the hotspot. The angle of wrist extension movements was comparable across conditions (factorial ANOVA, NS; Table 3). The TMS pulse occurred within the first third of the EMG burst generated by the training agonist (Table 3).
Training Characteristics a
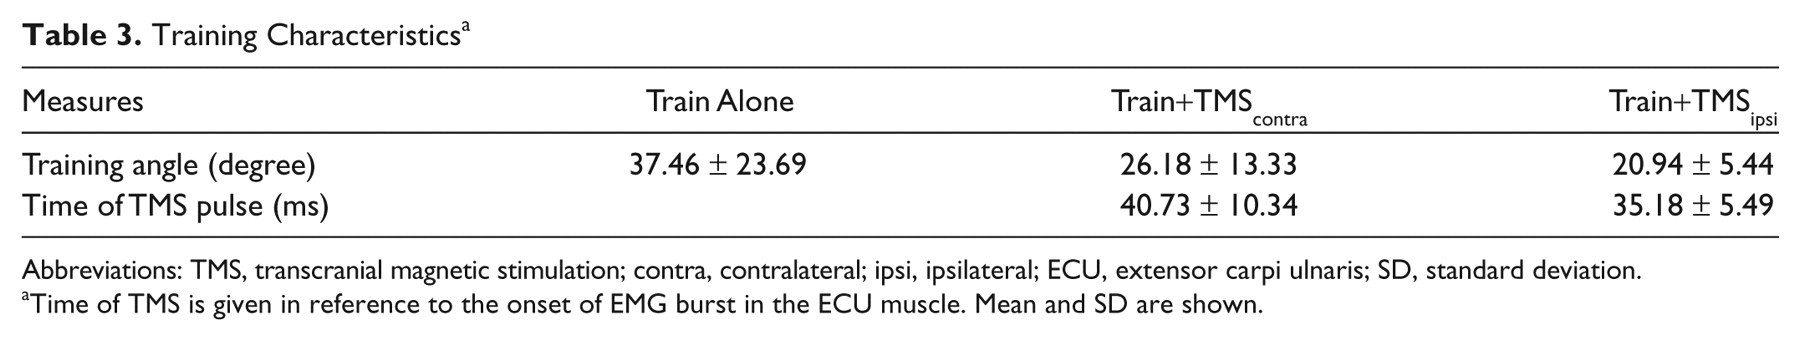
Abbreviations: TMS, transcranial magnetic stimulation; contra, contralateral; ipsi, ipsilateral; ECU, extensor carpi ulnaris; SD, standard deviation.
Time of TMS is given in reference to the onset of EMG burst in the ECU muscle. Mean and SD are shown.
TMS Measures
Intervention-related changes of MT of the ECU and biceps muscles
TMS of M1 elicited measurable MEP responses in all participants. The MT of the biceps muscle was higher compared with that of the ECU muscle. For both muscles, the MT was similar across conditions (Table 4).
MT and Stimulus Intensity Used for Mapping of ECU and Biceps Muscles a
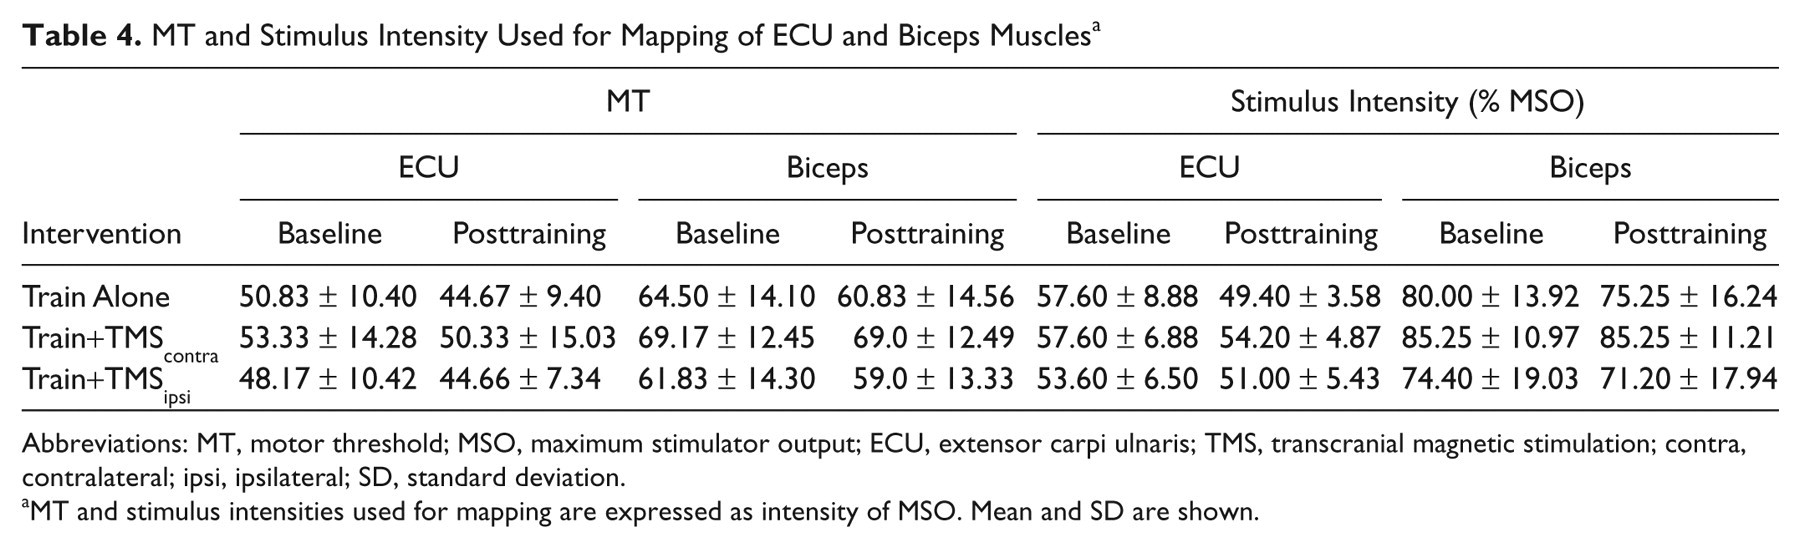
Abbreviations: MT, motor threshold; MSO, maximum stimulator output; ECU, extensor carpi ulnaris; TMS, transcranial magnetic stimulation; contra, contralateral; ipsi, ipsilateral; SD, standard deviation.
MT and stimulus intensities used for mapping are expressed as intensity of MSO. Mean and SD are shown.
Repeated-measures ANOVA revealed significant main effects for Muscle (F = 7.29; P = .043), Time (F = 25.88; P = .004), and Intervention (F = 4.07; P = .050). The interaction between Muscle and Time was significant (F = 7.11; P = .045), indicating that the MT of the 2 different muscles was affected differently by the training. There was a trend for an interaction between Time and Intervention (F = 2.94; P = .099), but this did not reach statistical significance. Other interactions were also not significant. The inclusion of lesion location as a between-group variable into the repeated measures ANOVA did not reveal any significant main effects or interactions. Posthoc testing with a paired t test revealed that all interventions resulted in a significant decrease of the MT of the ECU muscle (Figure 3A). For the biceps muscle, only Train Alone and Train+TMSipsi resulted in a significant decrease of MT, whereas Train+TMScontra had no effect (Figure 3B).
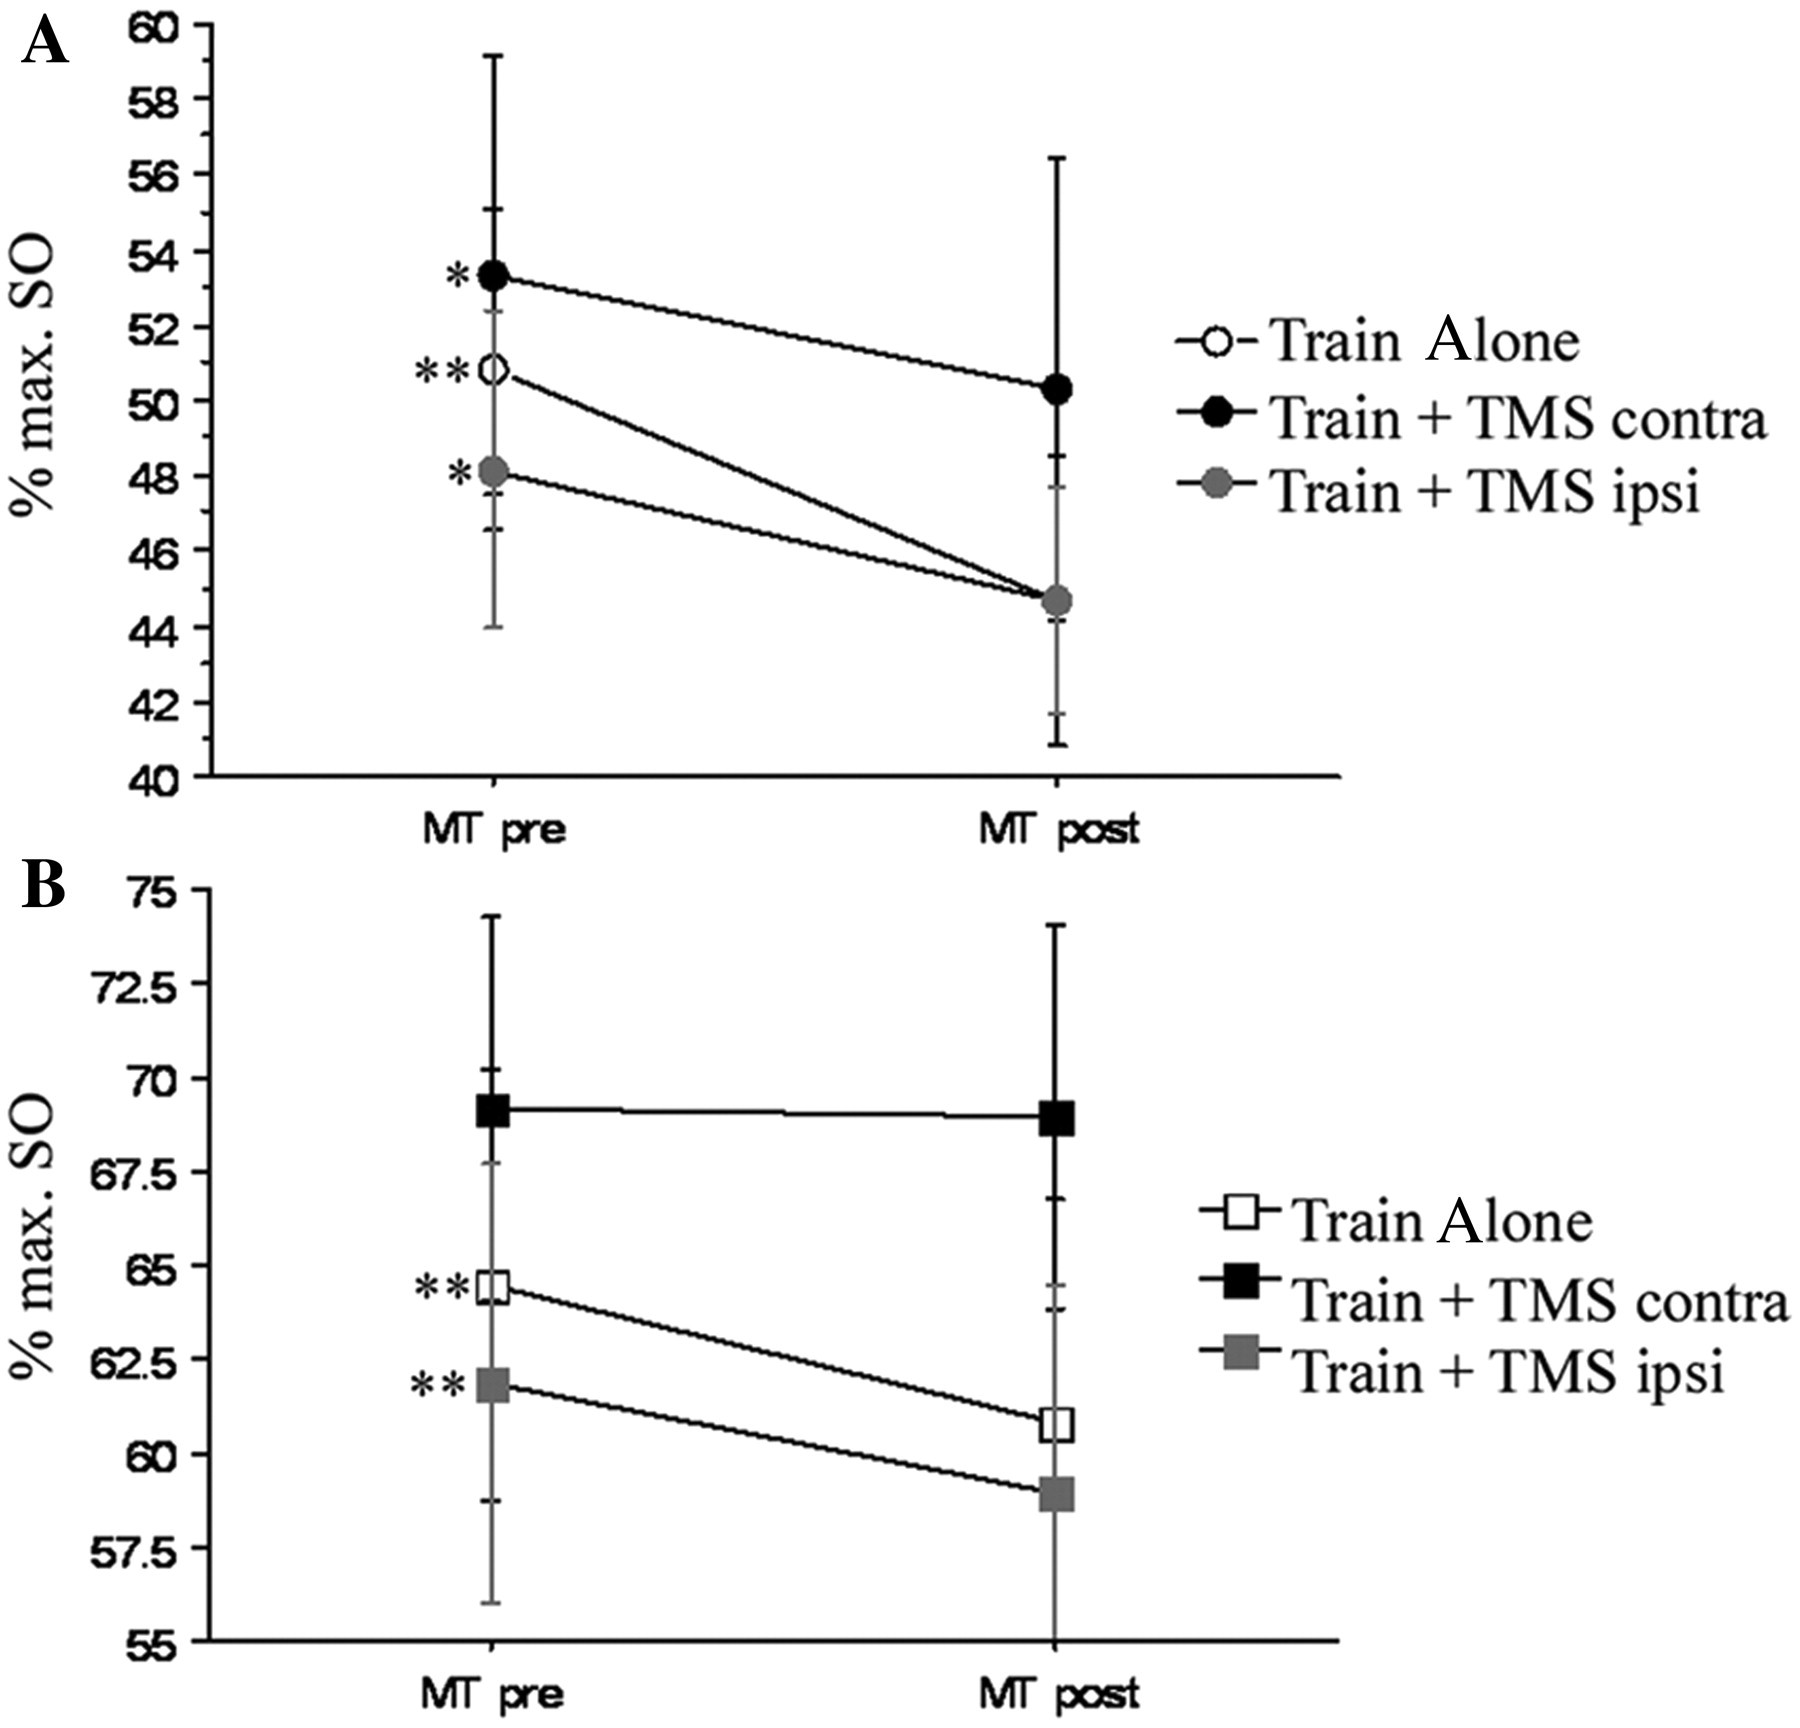
Effect of the different interventions on the MT of ECU and biceps muscles. MT of ECU (A) decreased in all training conditions, whereas MT of the biceps muscle (B) decreased with Train Alone and Train+TMSipsi but remained stable with Train+TMScontra. MT is expressed as percentage of maximum stimulator output (max SO). Mean ± standard errors are given.a Abbreviations: TMS, transcranial magnetic stimulation; contra, contralateral; ipsi, ipsilateral; ECU, extensor carpi ulnaris; MT, motor threshold; MT pre, MT before intervention; MT post, MT after the interventions.
Training-related changes in the COG of the ECU and biceps muscles
Interventions had a different effect on the COG in the x-axis (Intervention, F = 3.74, P = .05). As indicated by Figure 4C, training combined with TMS to either ipsilateral or contralateral M1 resulted in a medial shift of COG of ECU, whereas Train Alone resulted in a lateral shift. For the biceps, Train+TMSipsi resulted in a lateral shift, whereas changes for Train Alone and Train+TMScontra had only minimal effects. Shifts in the y-axis were minimal overall and did not reach statistical significance (Figure 4D).
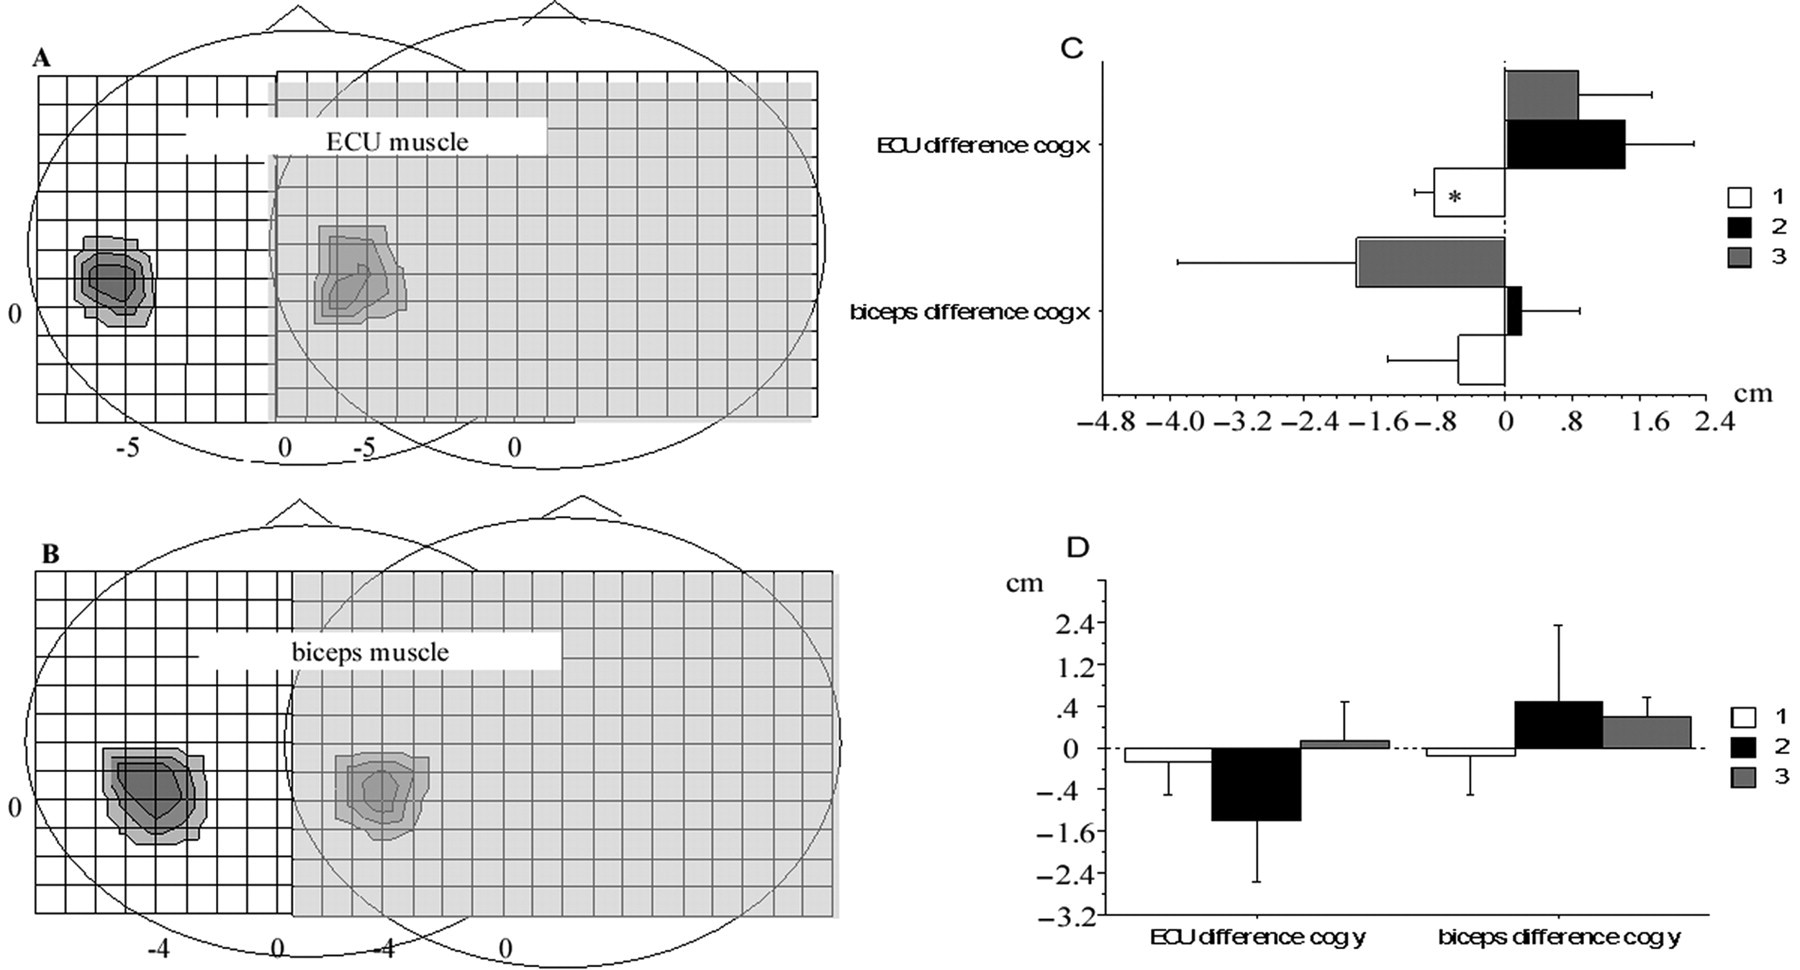
Motor map of ECU and biceps muscles. Representative motor map of the ECU (A) and biceps (B) muscles prior to (left map in each graph) and after the training (right map in each graph) of wrist extension movements (see Methods section for details). The anterior aspect of the head is indicated by the nose. Intersections in the grid are 1 cm apart. Training-related shifts in the location of the COG of ECU and biceps muscles are indicated by the differences in the x (C) and y (D) coordinates (differences were calculated as follows: x COG coordinate pretraining - x COG coordinate posttraining and y COG coordinate pretraining - y COG coordinate posttraining). Accordingly, negative values in (C) indicate a lateral shift, whereas positive values indicate a medial shift. Negative values in (D) indicate a posterior shift, whereas positive values indicate an anterior shift. Zero indicates no change in COG. Asterisk indicates a significant difference between preintervention and postintervention measurements (paired t test, P = .027). Abbreviations: ECU, extensor carpi ulnaris; COG, center of gravity.
Maximum MEP amplitude
Repeated-measures ANOVA revealed a significant main effect for Muscle (F = 11.71, P = .02), but the remaining main effects were not statistically significant. MEP amplitudes of the ECU and biceps muscle were affected differently by the interventions as indicated by the significant interaction Intervention × Muscle (F = 5.77; P = .03). Other interactions were not significant. The inclusion of lesion location as a between-group variable into the repeated-measures ANOVA revealed an additional significant main effect for Intervention (Muscle, F = 16.21, P = .03; Intervention, F = 5.10, P = .05; Intervention × Muscle, F = 6.96, P = .03). Training-related differences in maximum MEP amplitudes of ECU and biceps muscles did not reach statistical significance (posthoc testing using a paired t test).
Short-interval cortical excitability
Repeated-measures ANOVA revealed a significant main effect for CS intensity (F = 9.50; P = .0002). The interaction between Muscle × Time (F = 9.67; P = .025) and Time × CS (F = 3.16; P = .036) were significant, indicating that interventions had a different effect on SICE depending on the muscles and CS. No other main effects or interactions reached statistical significance. A second repeated-measures ANOVA with location of stroke (cortical vs subcortical, Lesion) as an additional between-group variable revealed an additional effect of the interactions Muscle × Time × Lesion (F = 35.12; P = .004) and Muscle × Time × CS × Lesion (F = 4.00; P = .02). Other effects were similar: CS, F = 10.50, P = .0002; Muscle × Time, F = 77.97, P = .0009; and Time × CS, F = 3.17, P = .043. These results indicate that interventions had a differential effect on SICE depending on muscle, CS intensity, and the location of the lesion. As illustrated in Figure 5 for ECU muscle, training resulted in increases in SICE at higher CS intensity. This effect was not seen in the biceps muscle (Figure 6). Further analysis revealed that the magnitude of increases in SICE of the ECU muscle were greater and occurred at a lower CS intensity in patients with a subcortical location of stroke (Figure 5B) when compared with patients with a cortical location of stroke (Figure 5C). Furthermore, as indicated in Figure 5B, for patients with a cortical stroke, only Train+TMSipsi and Train+TMScontra resulted in an increase of SICE at the tested CS intensity.
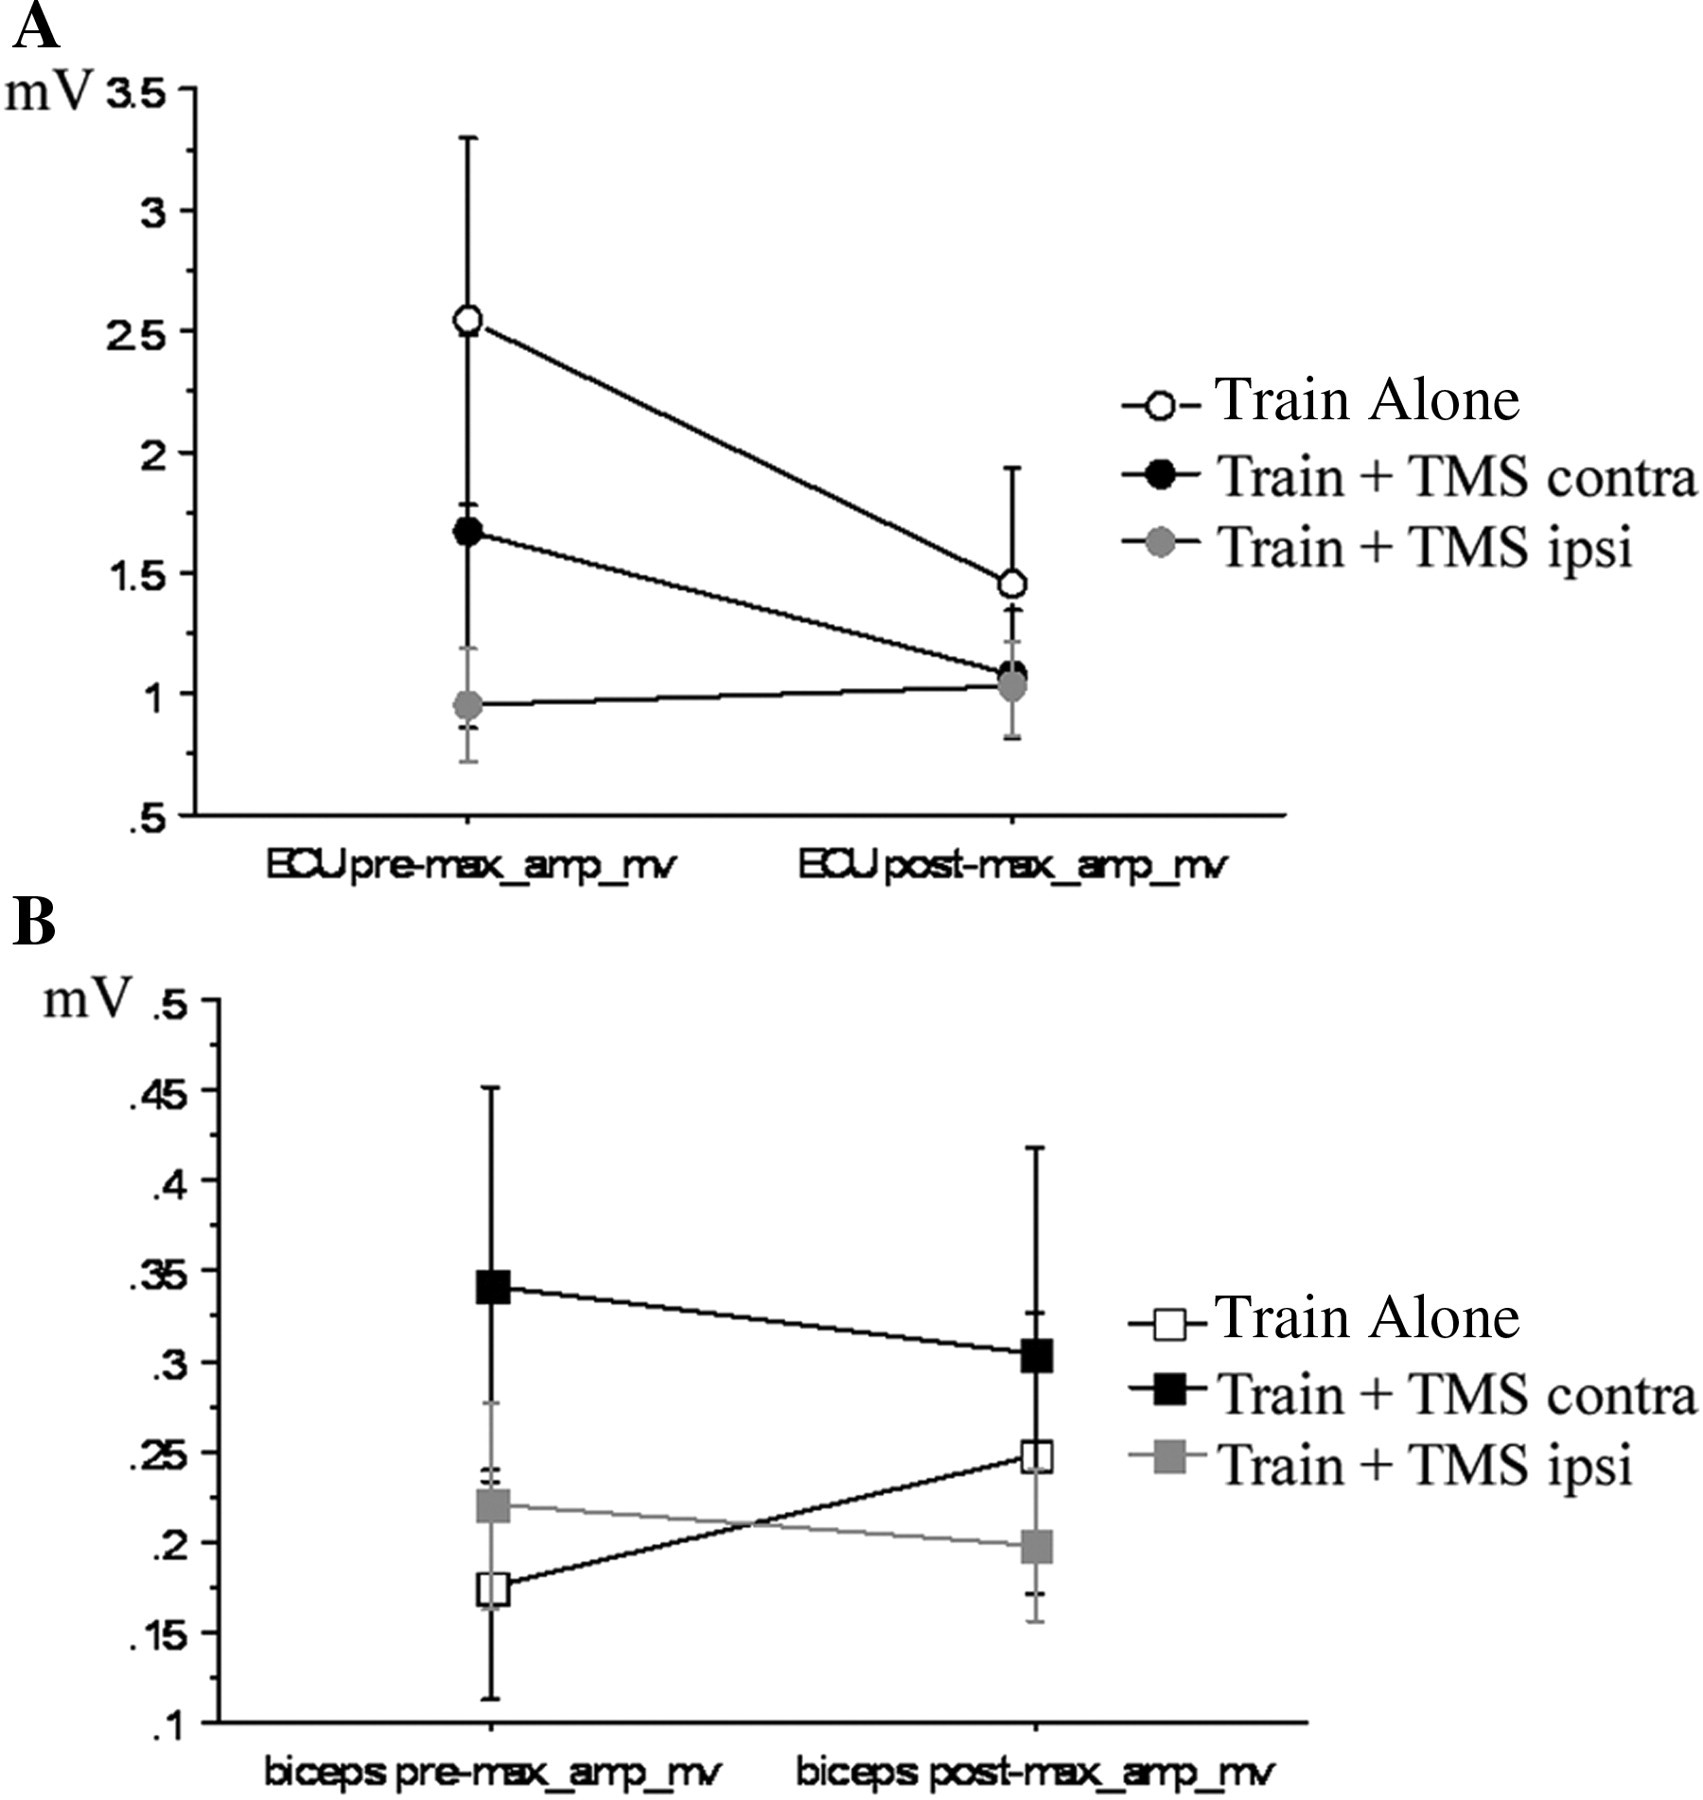
Effect of the different interventions on max. MEP amplitudes evoked at 120% MT of ECU and biceps muscles. There was a tendency for training related decreases in the max MEP amplitude of ECU (A) with Train alone and Train + TMS contra but not with Train + TMSipsi). For the biceps muscle (B) the max MEP amplitude remained relatively similar following Train + TMScontra with similar stimulation intensities pre and post training (see Table 2). In contrast max MEP amplitude increased (Train + TMSipsi) or remained stable (Train alone) despite a decreased stimulus intensity adjusted to the decreased MT post training (Table 2). Note the different scale for ECU and biceps muscles.
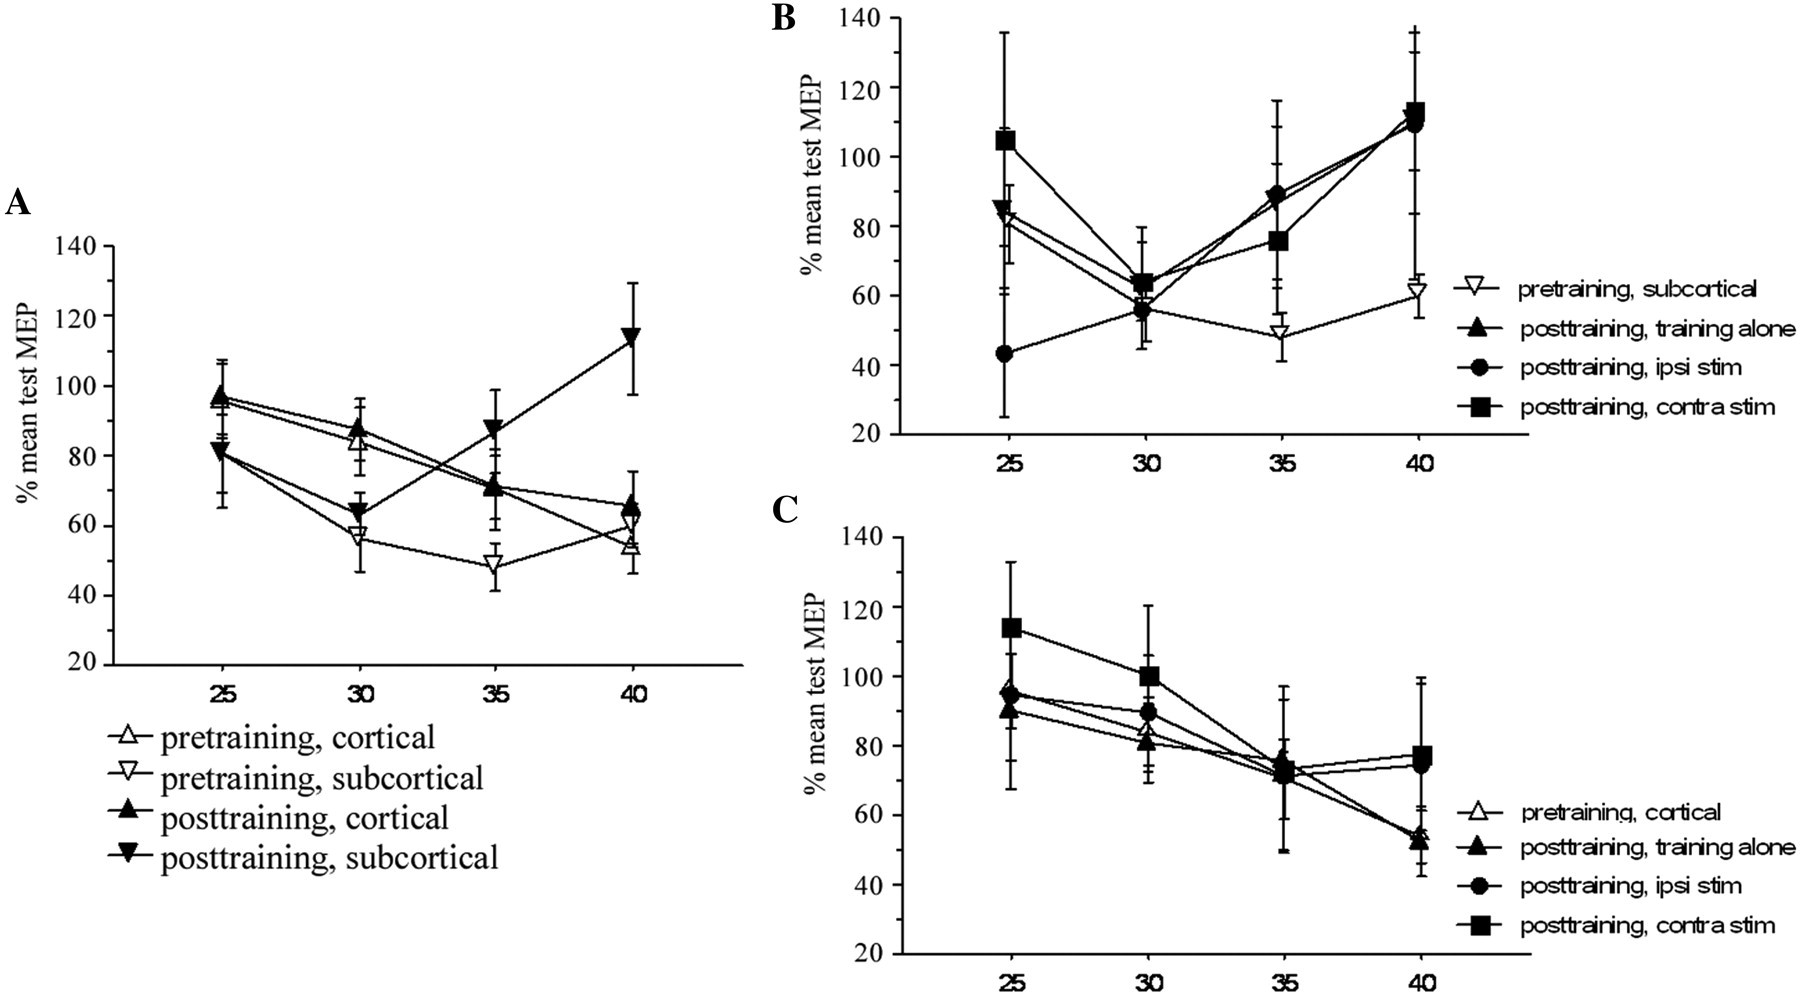
Effect of stroke location on training induced M1 excitability changes in ECU. (A). Data from all interventions were averaged for pretraining (open symbols) and posttraining (filled symbols). Interventions related increases in SICE were seen in patients with subcortical stroke (filled inverted triangles). SICE remained relatively stable in patients with cortical stroke (filled triangles).There was no significant difference between interventions in the effect on SICE for patients with subcortical stroke (B) and cortical stroke (C). CS intensity is expressed as percentage of MSO.
Discussion
The main findings of this study are that Hebbian-type stimulation of M1 during robot-assisted motor training in patients poststroke is feasible and produces use-dependent plasticity as indicated by its differential effects on GABA-A mediated inhibition and map reorganization of a muscle supporting the training movements. However, its effect on M1 of the lesioned brain, such as after stroke, differs from the effects observed in the intact brain of healthy participants. 12 TMS applied to the ipsilateral M1 during motor training with the affected hand increased corticomotoneuronal excitability and SICE. This is in contrast to the previously reported inhibitory effect in the intact brain. 12 Furthermore, when compared with our previous findings of Hebbian-type-related enhancement of motor memory formation with contralateral M1 stimulation, the effect observed for this type of stimulation (Train+TMScontra) was more subtle.
Motor training leads to motor memories being encoded in the CNS. 8,30,35 Under our experimental conditions, training of wrist extension movements lead to increases in MEP amplitude SICE and map reorganization of a muscle supporting the training movement. Whereas this wrist paradigm could be perceived as a form of exercise rather than as a version of plasticity, the effect of repetitive movements of the elbow, wrist, or finger/thumb on movement kinematics and motor cortex excitability have been studied previously in patients poststroke 10,27 and in healthy individuals, 8,28-32 and the findings have been used to define motor learning and cortical plasticity.
These different results for Hebbian-type stimulation obtained in this study of stroke patients cannot be explained by differences in the TMS protocol because the timing of TMS in relation to the onset of EMG burst, frequency, intensity, and duration of TMS were similar to those in our previous study of healthy participants. 12 Specifically, because in nonhuman primates M1 activity associated with performance of a ballistic movement lasts for about 250 ms after EMG onset 34 and TMS occurred within 50 ms of the onset of the EMG burst (Table 3), TMS arrived at M1 at a time when the cortex was still engaged in generating the training motions. Therefore, the experimental setup fulfilled the Hebbian principle. 14
Monitoring of motor training kinematics revealed that the direction and the dispersion of training movement did not differ significantly across conditions (Table 3). Furthermore, baseline measures of corticomotoneuronal excitability, including MT and SICE in the muscle supporting the wrist extension movements, were comparable across conditions. MEP amplitudes were higher in the Train Alone group (Figure 7). This likely represents the higher variability of these measures in patients with stroke. 36,37 Differences in MT did not reach statistical significance and should therefore not affect other measures. The similarity of these measures and training kinematics would support the robustness of the data. It also indicates that a potential carryover effect of interventions must be small compared with the effect of the intervention under testing.
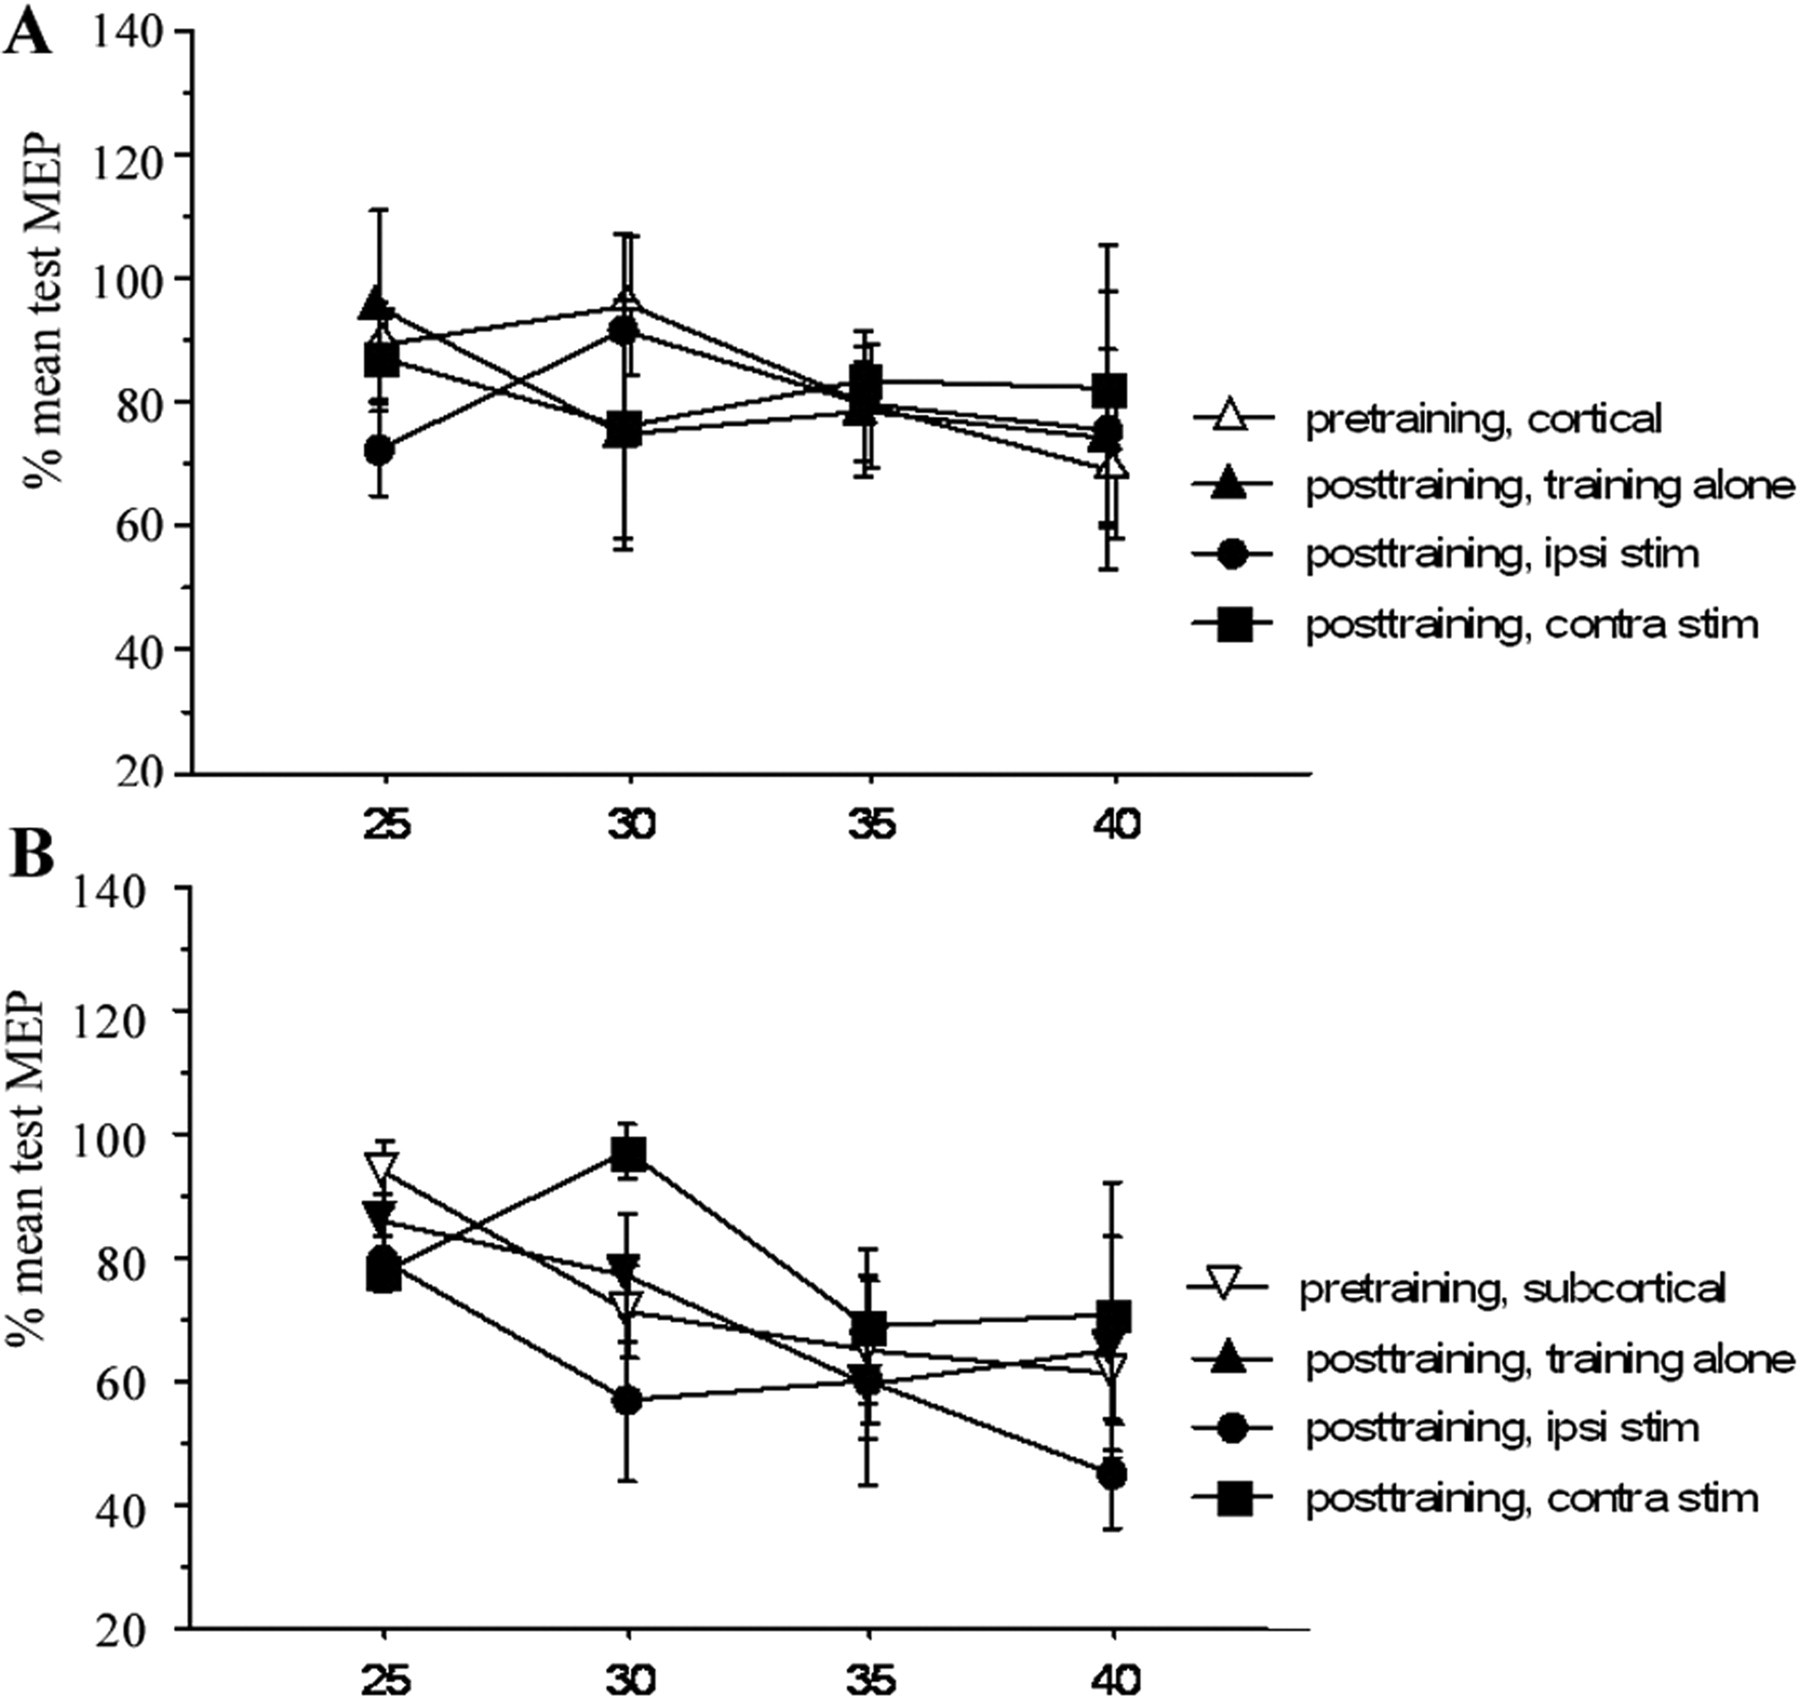
Effect of stroke location on training induced M1 excitability changes in biceps muscle. The pre-training data from all interventions are averaged (open symbols). Interventions had no significant effect on SICE of biceps muscle in patients with cortical stroke (A) and subcortical stroke (B).
Although the effect of Hebbian-type stimulation of contralateral M1 (Train+TMScontra)–related enhancement of motor memory formation observed in this study was more subtle, the significant interaction in the repeated-measures ANOVA between Intervention and Muscle for MT and maximum MEP amplitude indicates that the effects of the interventions differed from each other and were specific for the 2 muscles.
Because corticomotor excitability and intracortical inhibitory circuits in 1 hemisphere are modulated by stimulation of homologous motor areas of the opposite hemisphere 38 and because abnormalities in interhemispheric inhibition in patients poststroke were reported, 24,39 the lack of an inhibitory effect with ipsilateral M1 stimulation (Train+TMSipsi) is more likely a result of abnormalities in the interhemispheric inhibition.
As indicated above, Train Alone and Train+TMSipsi resulted in a decrease of MT of the ECU and biceps muscle, whereas Train+TMScontra resulted in a decrease in MT of the ECU but had no effect on the biceps muscle. This may indicate that TMS applied to the M1 supporting the training movement results in a more focused increase in excitability. This could be partly explained by the fact that the ECU muscle was active during TMS. Activity of muscle lowers the MT in the corresponding M1, resulting in a relatively higher intensity of TMS of the targeted muscle.
This supports the specificity of Hebbian-type stimulation, where motor cortex areas commanding training movements are more excitable and therefore more susceptible to low-intensity TMS, whereas other motor cortex areas not commanding the training movement remain less excitable with little effect of TMS. This notion is supported by a more specific effect of Train+TMScontra condition on COG. Although COG of ECU was more displaced in all conditions when compared with the biceps muscle, this was greatest in the Train+TMScontra condition, a condition with very little effect on the biceps muscle.
Intervention-Related Changes of Motor Maps
Motor training–related increases in motor maps and associated behavioral gains have been reported previously. 5,36 In the present study, interventions resulted in displacements of COGs in a medial/lateral direction, whereas displacements were minimal in the anterior/posterior direction (Figures 4C and 4D). Changes were more distinct in the ECU muscle when compared with that in the biceps muscle. These training-related changes in the distribution of excitability indicate functional changes in the synaptic efficacy (plasticity) as opposed to changes in excitability alone. 21 Comparison with the results of other studies are limited because of the more complex training tasks involving multiple muscles and limitation in the accuracy as a result of the lack of a neuronavigation system. 5,36,40
Mechanisms of Intervention- Induced Plasticity
All interventions resulted in training-related increases in SICE in the ECU (Figure 5) but not in the biceps muscle (Figure 6). Because these increases in SICE reflect changes in the synaptic excitability of inhibitory and excitatory neural circuits in close proximity to the stimulated site at the level of M1, 26,41 the cortical site of training-induced reorganization, it may indicate a shift in the balance of the synaptic efficacy of the horizontal motor cortical connection, showing less inhibitory and/or more excitatory activity. Because training-related increases in SICE and changes in COG were related and largely limited to the ECU muscle, it would support the concept of reduction of GABAergic inhibition playing an important role in the reorganization of motor representation. 10,29,42
In conclusion, robot-assisted training, either alone or combined Hebbian-type stimulation of ipsilateral or contralateral M1, is feasible in stroke patients and results in differential effects on the reorganization of motor maps and intracortical inhibition. Because training-related increases in SICE and changes in COG were related and largely limited to the ECU muscle, the concept of reduction of GABAergic inhibition playing an important role in reorganization of motor representation 10,29,42 is supported. However, the effects of Hebbian-type stimulation in the lesioned brain and intact brain may differ and may depend on the location of the lesion, a finding that has important clinical and scientific implications for the design of treatment strategies for patients with stroke because they suggest that stimulation protocols should be tailored according to the characteristics of patients with stroke, including the location of the stroke lesion. 43
Footnotes
Acknowledgements
We thank our subjects for participation in the study, M. Linge, S. Huschenbeck and J. Lauterbach for their technical support, M. Pettit for editorial support and the company Reha-Stim, Berlin, Germany for allowing us to use the Bi- Manu- Track for the training of patients. R. Heger conducted the experiments as part of his thesis work at Heine-Heine University, Duesseldorf and is currently employed at the Department of Emergency Medicine, Queen Elizabeth Hospital, South London Healthcare NHS Trust, London, United Kingdom.
The author(s) declared no potential conflicts of interest with respect to the authorship and/or publication of this article.
The author(s) disclosed receipt of the following financial support for the research and/or authorship of this article: CB was supported by the Lise-Meitner Grant provided by the State North-Rhine Westphalia, Germany.