
Abstract
Objective
To explore the efficacy and tolerability of high-frequency repetitive transcranial magnetic stimulation (rTMS) in the treatment of post-stroke working memory (WM) impairment and its changes in brain function.
Methods
In the present randomized, double-blinded, sham-controlled design, 10 Hz rTMS was administered to the left dorsolateral prefrontal cortex (DLPFC) of patients with post-stroke WM impairment for 14 days. Measures included WM (primary outcome), comprehensive neuropsychological tests, and the functional near-infrared spectroscopy test. Patients were assessed at baseline, after the intervention (week 2), and 4 weeks after treatment cessation (week 6).
Results
Of 123 stroke patients, 82 finished the trial. The rTMS group showed more WM improvement at week 2 (t = 5.55, P < .001) and week 6 (t = 2.11, P = .045) than the sham group. Most of the neuropsychological test scores were markedly improved in the rTMS group. In particular, the rTMS group exhibited significantly higher oxygenated hemoglobin content and significantly stronger functional connectivity in the left DLPFC, right pre-motor cortex (PMC), and right superior parietal lobule (SPL) at weeks 2 and 6. Dropout rates were equal (18% [9/50 cases] in each group), and headaches were the most common side effect (rTMS: 36% [18/50 cases]; sham: 30% [15/50 cases]).
Conclusions
High-frequency rTMS was effective in improving post-stroke WM impairment, with good tolerability, and the efficacy lasted up to 4 weeks, which may be due to the activation of the left DLPFC, right PMC, and right SPL brain regions and their synergistic enhancement of neural remodeling.
Introduction
Stroke is a leading cause of death and disability in China, with 30% to 45% of stroke patients experiencing cognitive impairment.1,2 Executive dysfunction, a hallmark of cognitive dysfunction, disrupts our ability to hold information in mind (working memory [WM]), control our reactions (response inhibition), adjust our strategies (set shifting), and find words readily (word fluency). 3 As a major clinical symptom of executive dysfunction, WM disorder is mainly manifested as information processing and storage disorders, inability to maintain short-term information operations, and difficulties in planning, calculation, judgment, reasoning, language understanding, and other advanced cognitive activities. 4 WM impairment not only affects the full recovery of other functions of stroke patients, but also seriously affects their work, learning, and social participation. 5
Currently, there are no specific drugs for treating WM disorders, and the clinical rehabilitation effect is not satisfactory, with traditional cognitive training as the main strategy for rehabilitation. 6 However, cognitive training has a slow onset of action and a long duration of treatment and its efficacy is affected by the degree of cooperation of the patient and the level of professionalism of the therapist. Additionally, it is only suitable for patients with mild to moderate WM disorders. 7 Therefore, identifying more effective interventions to address the problem of WM impairment after a stroke is imperative.
Repetitive transcranial magnetic stimulation (rTMS), as a novel noninvasive brain stimulation technique, was applied to the clinical rehabilitation of cognitive dysfunction after a stroke in our previous studies and showed good efficacy.8,9 rTMS can induce long-lasting changes in the activity of brain regions of cognitively impaired patients using powerful, focused magnetic field pulses. 10 Thus, rTMS may be a new option for the treatment of WM impairment in stroke patients. Although some studies have reported that rTMS is effective in improving WM impairment, it is mainly targeted at the elderly, parkinsonian, and depressed patient populations.11 -15 Moreover, these studies lacked follow-up to further understand its long-term efficacy. Despite the growing evidence supporting rTMS for WM impairment, the efficacy of rTMS in post-stroke WM impairment and its long-term effect are yet to be elucidated.
Therefore, the current randomized, double-blinded, sham-controlled trial applied neuropsychological tests and functional near-infrared spectroscopy (fNIRS) to detect the changes in WM and cerebral hemodynamics of stroke patients after rTMS intervention and follow-up at 4 weeks post-rTMS intervention. The efficacy of rTMS in the treatment of post-stroke WM impairment and its long-term effect were investigated from the behavioral and brain function aspects. It was hypothesized that rTMS can effectively improve WM in stroke patients, and its efficacy can be maintained for 4 weeks. In addition, safety outcomes for self-reported adverse events were compared.
Materials and Methods
Study Design and Participants
This randomized, double-blinded, sham-controlled, parallel group clinical trial was designed according to the Declaration of Helsinki. 16 The study protocol was reviewed and approved by the Medical Ethics Committee of the Third Affiliated Hospital of Sun Yat-Sen University (ID: RG2021-077-01), and the trial was registered with the Chinese Clinical Trial Registry (https://www.chictr.org.cn/; registration number: ChiCTR2100050717) on September 3, 2021. All participants signed written informed consent before participating in the study. The first and last subjects were enrolled on October 15, 2021 and October 27, 2023, respectively, with the last follow-up conducted on November 25, 2023.
Participants were recruited from the Department of Rehabilitation Medicine of the Third Affiliated Hospital of Sun Yat-Sen University, as well as through online and community advertisements. The inclusion criteria were as follows: (1) diagnosed with stroke; (2) scored 10 to 27 on the Mini-Mental State Examination (MMSE) and <26 on the Montreal Cognitive Assessment (MoCA); (3) inability to complete a 1-back test or <50% correct on this test; (4) those who were in stable condition and could complete paper and pencil tests; (5) first onset and duration of 1 to 12 months; (6) aged 40 to 75 years; and (7) capable of providing informed consent for the study.
Participants were excluded if they had (1) metal implants; (2) a history or family history of seizures; (3) failure of vital organs such as the heart, lungs, liver, or kidneys; (4) severe mental disorders; (5) speech disorders due to other neurologic disorders, such as complete aphasia; and (6) severe visual and hearing impairments, such as color blindness and deafness.
Sample Size, Randomization, and Blinding
The sample size was determined based on previous methodology. 17 To obtain 80% statistical power with an α level of .05, the two groups were divided in a 1:1 ratio, with 40 participants in each group. Considering a 20% dropout, the sample size required was 100 subjects (50 per group).
Participants were divided into two groups using a random number generator. After obtaining baseline measurements (day 0), subjects received active or sham rTMS over the left dorsolateral prefrontal cortex (DLPFC) for 14 consecutive days (days 1-14). An investigator who was not involved in the assessment or stimulation randomized the patients and used the envelope method to assign concealment.
The physicians and investigators performing the rTMS and randomization were not aware of the group information of the subjects. Both patients and clinical investigators were blinded to the treatment procedure until the completion of the study. In addition, the outcome assessor was isolated in a different clinical area and was blinded to the subject grouping information. The patients were instructed not to discuss their treatment allocation with the staff or other patients to ensure a double-blind design. If an adverse event such as a seizure occurs, the blinding must be lifted urgently and countermeasures taken.
Intervention Procedures
Before rTMS intervention, participants had high-resolution anatomical MRIs, and each treatment session used real-time MRI-guided neuro-navigation with a Visor neuro-navigation system (NHT-NV200, China) for coil positioning. According to our previous studies,8,9 the left DLPFC may be an effective target for patients with post-stroke cognitive impairment. Therefore, we restricted our target within the left DLPFC, a sphere region centered on the Montreal Neurological Institute (MNI) stereotaxic coordinate (−38, 44, 26) with a 10-mm radius. 18 The Statistical Parametric Mapping version 12 (SPM12) software and the internal rTMS-target software were used to convert the MNI coordinates into individual space. 19
The rTMS was performed using a transcranial magnetic stimulator (NS5000, Wuhan Yiruide, China) with a 70-mm air-cooled figure-of-eight coil. The rTMS parameters were as follows: 10 Hz, 90% resting motor threshold (RMT), 1280 pulses, 18 minutes per session, and 1 session per day for 2 weeks. 8 The stimulation coil was placed with Visor 2.0 and was held tangentially to the skull with a handle pointing in the posterolateral direction. The junction point of the figure-of-eight magnetic stimulation coil was placed directly over the localized region (Figure 1A). The RMT was gauged from the right first dorsal interosseous muscle’s stimulation intensity using a 70-mm figure-eight coil. It is defined as the minimal intensity needed to trigger a small (>50 mV) response in over half of 10 consecutive trials in the right first dorsal interosseous muscle.
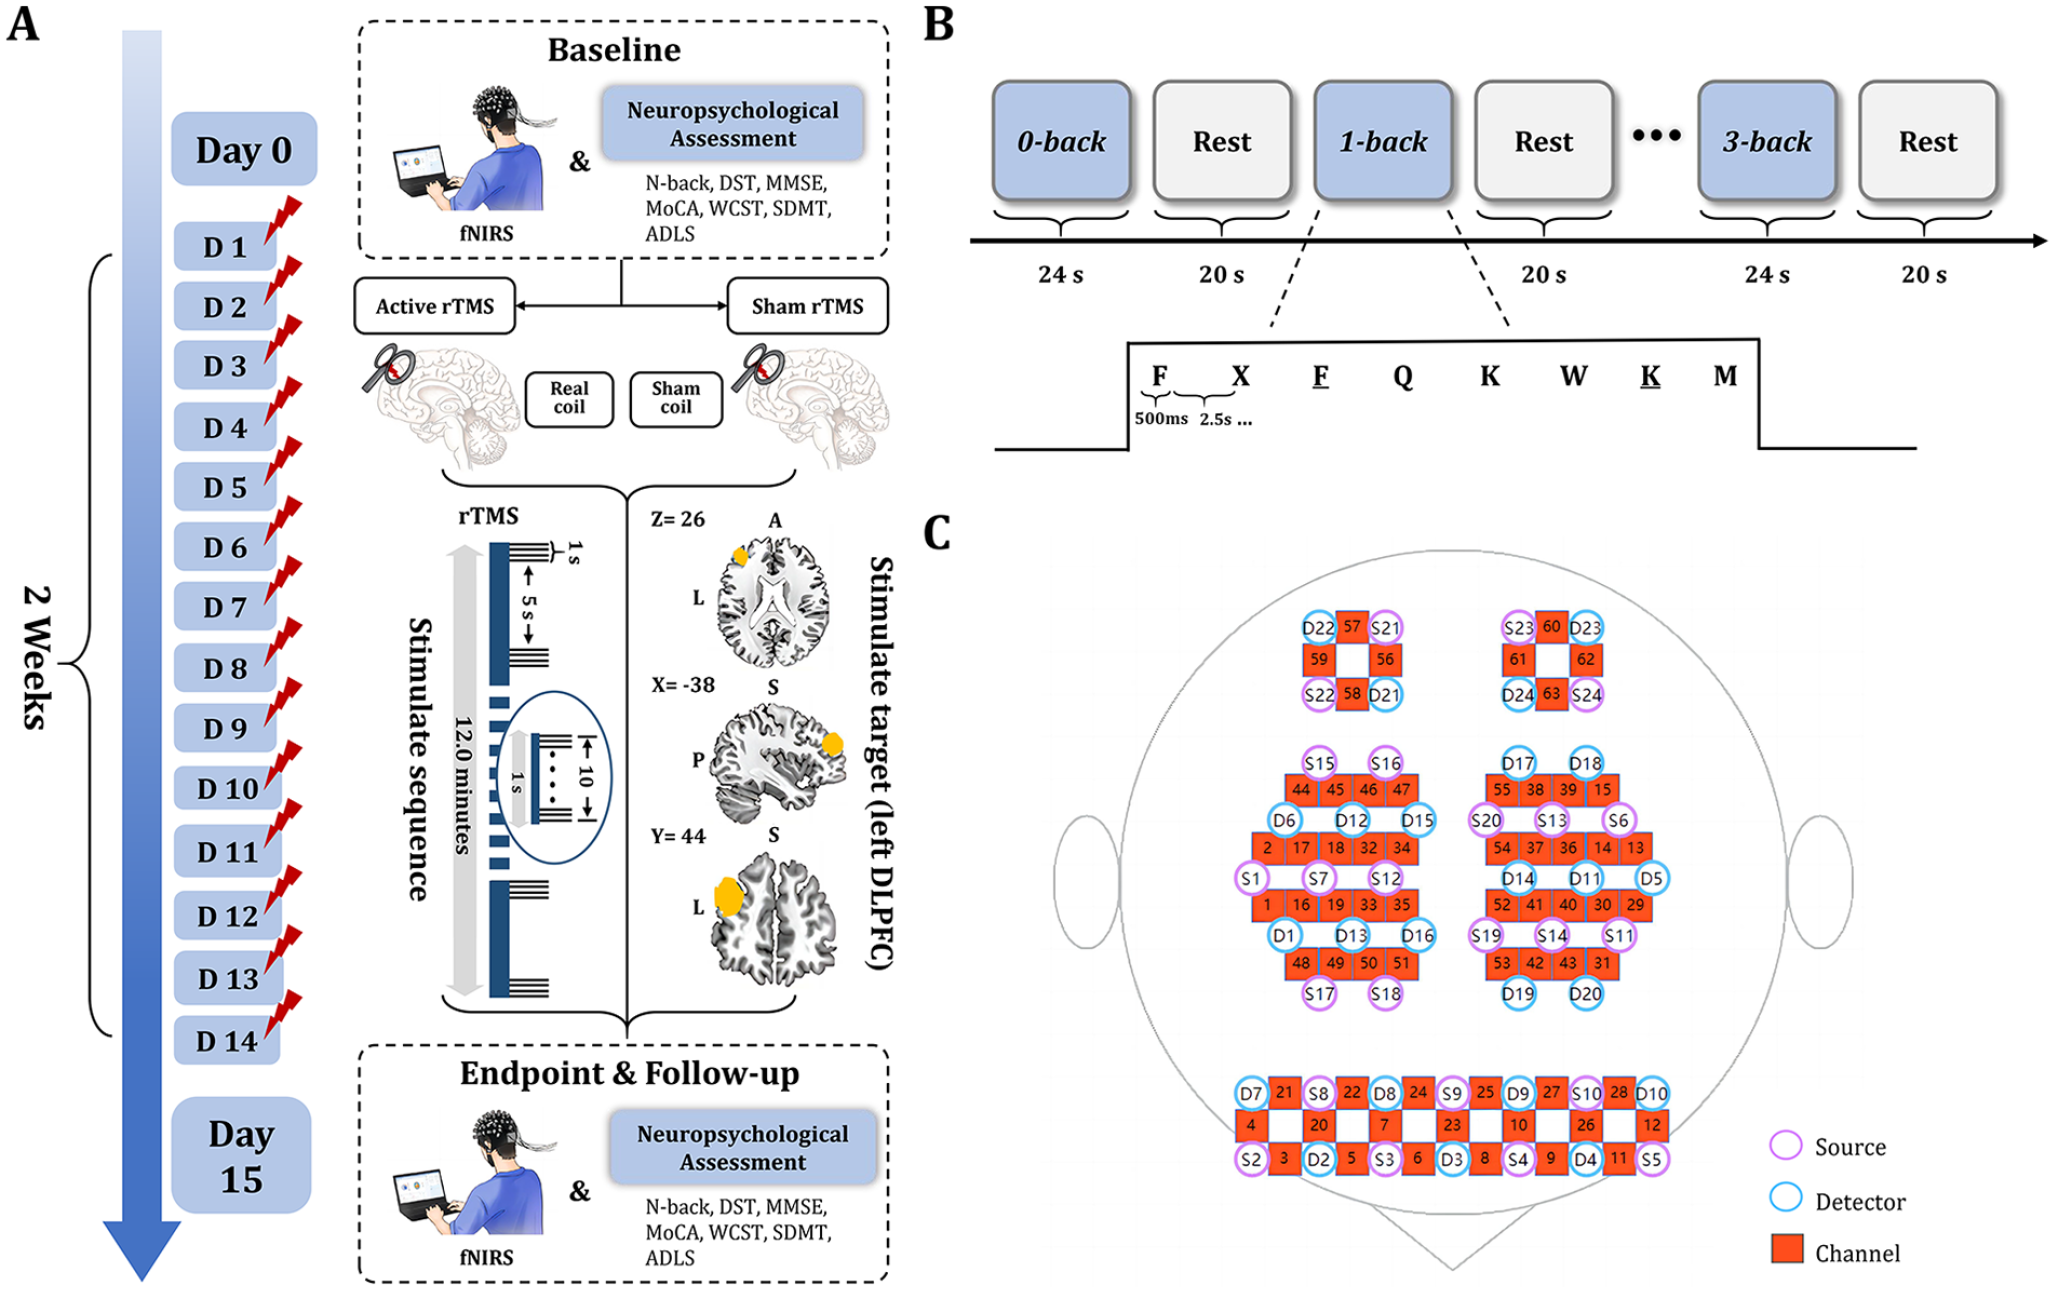
Study method. (A) rTMS intervention procedure and efficacy evaluation procedure. (B) Block design of N-back task. (C) The distribution of fNIRS 64-channels in DLPFC, PMC, and SPL.
Participants in the sham group received a placebo stimulation coil (NS1000). This coil appeared and sounded identical to the active coil, even producing similar scalp vibrations. However, it could not induce the magnetic field and current flow in the brain that were present with the active coil.
Primary Outcome
The only primary outcome was the visual N-back test, the classic test to assess WM, which was assessed for all participants at baseline, week 2, and week 6. In the N-back test, participants were required to analyze the congruence between the most recently displayed letter on the monitor and the letter that appeared in N positions prior. The participant was to respond by tapping the table when a similarity was detected. The complexity indices for the 0-, 1-, 2-, and 3-back tasks escalated sequentially. For example, in the 1-back task, participants were asked to respond when the currently presented letter was the same as the adjacent letter (eg, F K M M), and the 2-, 3-back task proceeded similarly. 20 Correctness was used as an evaluation index for the N-back test, with higher correctness suggesting better WM. 21 A 24-second block design was utilized, with each letter shown for 500 and 2500 microsecond response times, equating to 8 letters/block. Three blocks were used for each N-back difficulty level (0-, 1-, 2-, 3-back), totaling 12 blocks (Figure 1B). Block presentations in different N-back loads were randomized.
Secondary Outcomes
Secondary outcomes included changes in clinical symptoms, multi-domain cognitive tests, and functional brain activities at weeks 2 and 6. Adverse events (eg, headache, dizziness, eyelid twitching, nausea, or tinnitus) were recorded throughout the study by self-report.
The clinical symptom tests included the MMSE, MoCA, and activities of daily living scale. The multi-domain cognitive tests included the Digit Span Test (DST), Wisconsin Card Sorting Test (WCST), and Symbol Digit Modalities Test (SDMT). The functional brain activities were measured by fNIRS.
fNIRS Procedures
Participants in both groups performed the N-back test task during fNIRS testing. The fNIRS device (NirSmart-6000A, Danyang Huichuang, China) tracked brain activity, including oxygenated hemoglobin (HbO) and deoxygenated hemoglobin levels and functional connectivity in the DLPFC, pre-motor cortex (PMC), and superior parietal lobule (SPL) during the N-back task. It uses acquisition wavelengths of 730 and 850 nm, with a 11 Hz sampling rate, forming 63 channels across a 2.7 to 3.3 cm distance, 22 aligned with the 10/20 system. Data processing was performed in MATLAB software (R2017a, Mathworks Inc.).
Statistical Analyses
Statistical analyses were performed using SPSS statistical software version 26 (IBM). Results were reported as mean (standard deviation [SD]) or mean (95% confidence interval [CI]). The assumption of normality for continuous variables was tested using the Shapiro-Wilks test. The baseline characteristics were compared between the two groups using the chi-squared test for categorical variables and the two-sample t-test or Mann-Whitney U test for continuous variables. Linear mixed-effect models with restricted maximum likelihood estimation were employed to analyze the primary outcome and continuous secondary outcomes. In these models, repeated measures of clinical symptoms were the dependent variable, group status was the fixed-effect variable, and site was the random-effect variable. The group-by-time interaction was reported for these models. Multiple imputation by chained equations was used to impute missing outcome data for patients who withdrew or were lost to follow-up before 2 weeks without a primary-outcome event. The prevalence and proportion of side effects and adverse events in the two groups were calculated and compared using the Wilcoxon rank-sum test, chi-squared test, or Fisher’s exact test. All hypotheses were tested at a significance level of 0.05, using two-tailed tests.
Results
Characteristics of Participants Included in the Study
The study flow diagram is displayed in Figure 2. A total of 123 participants were screened for eligibility, of whom 23 (19%) were ineligible or declined to participate. Overall, 100 participants were randomly assigned to receive active rTMS (50 subjects [50%]) and sham rTMS (50 subjects [50%]). Of the remaining participants, 43 (86%) participants from the rTMS group and 44 (88%) from the sham group completed most of the 2-week treatment course (with 7 participants from the rTMS group and 6 participants from the sham group discontinuing treatment) and were analyzed for the primary outcome. After the completion of rTMS treatment, 41 (95%) participants in the rTMS group and 41 (93%) participants in the sham group completed a 4-week follow-up period, of whom 2 and 3 participants in the rTMS group and the sham group, respectively, were lost to follow-up. Table 1 provides the baseline characteristics of the study participants. Randomization was successful regarding the distribution of participants with previous treatment failure across groups.
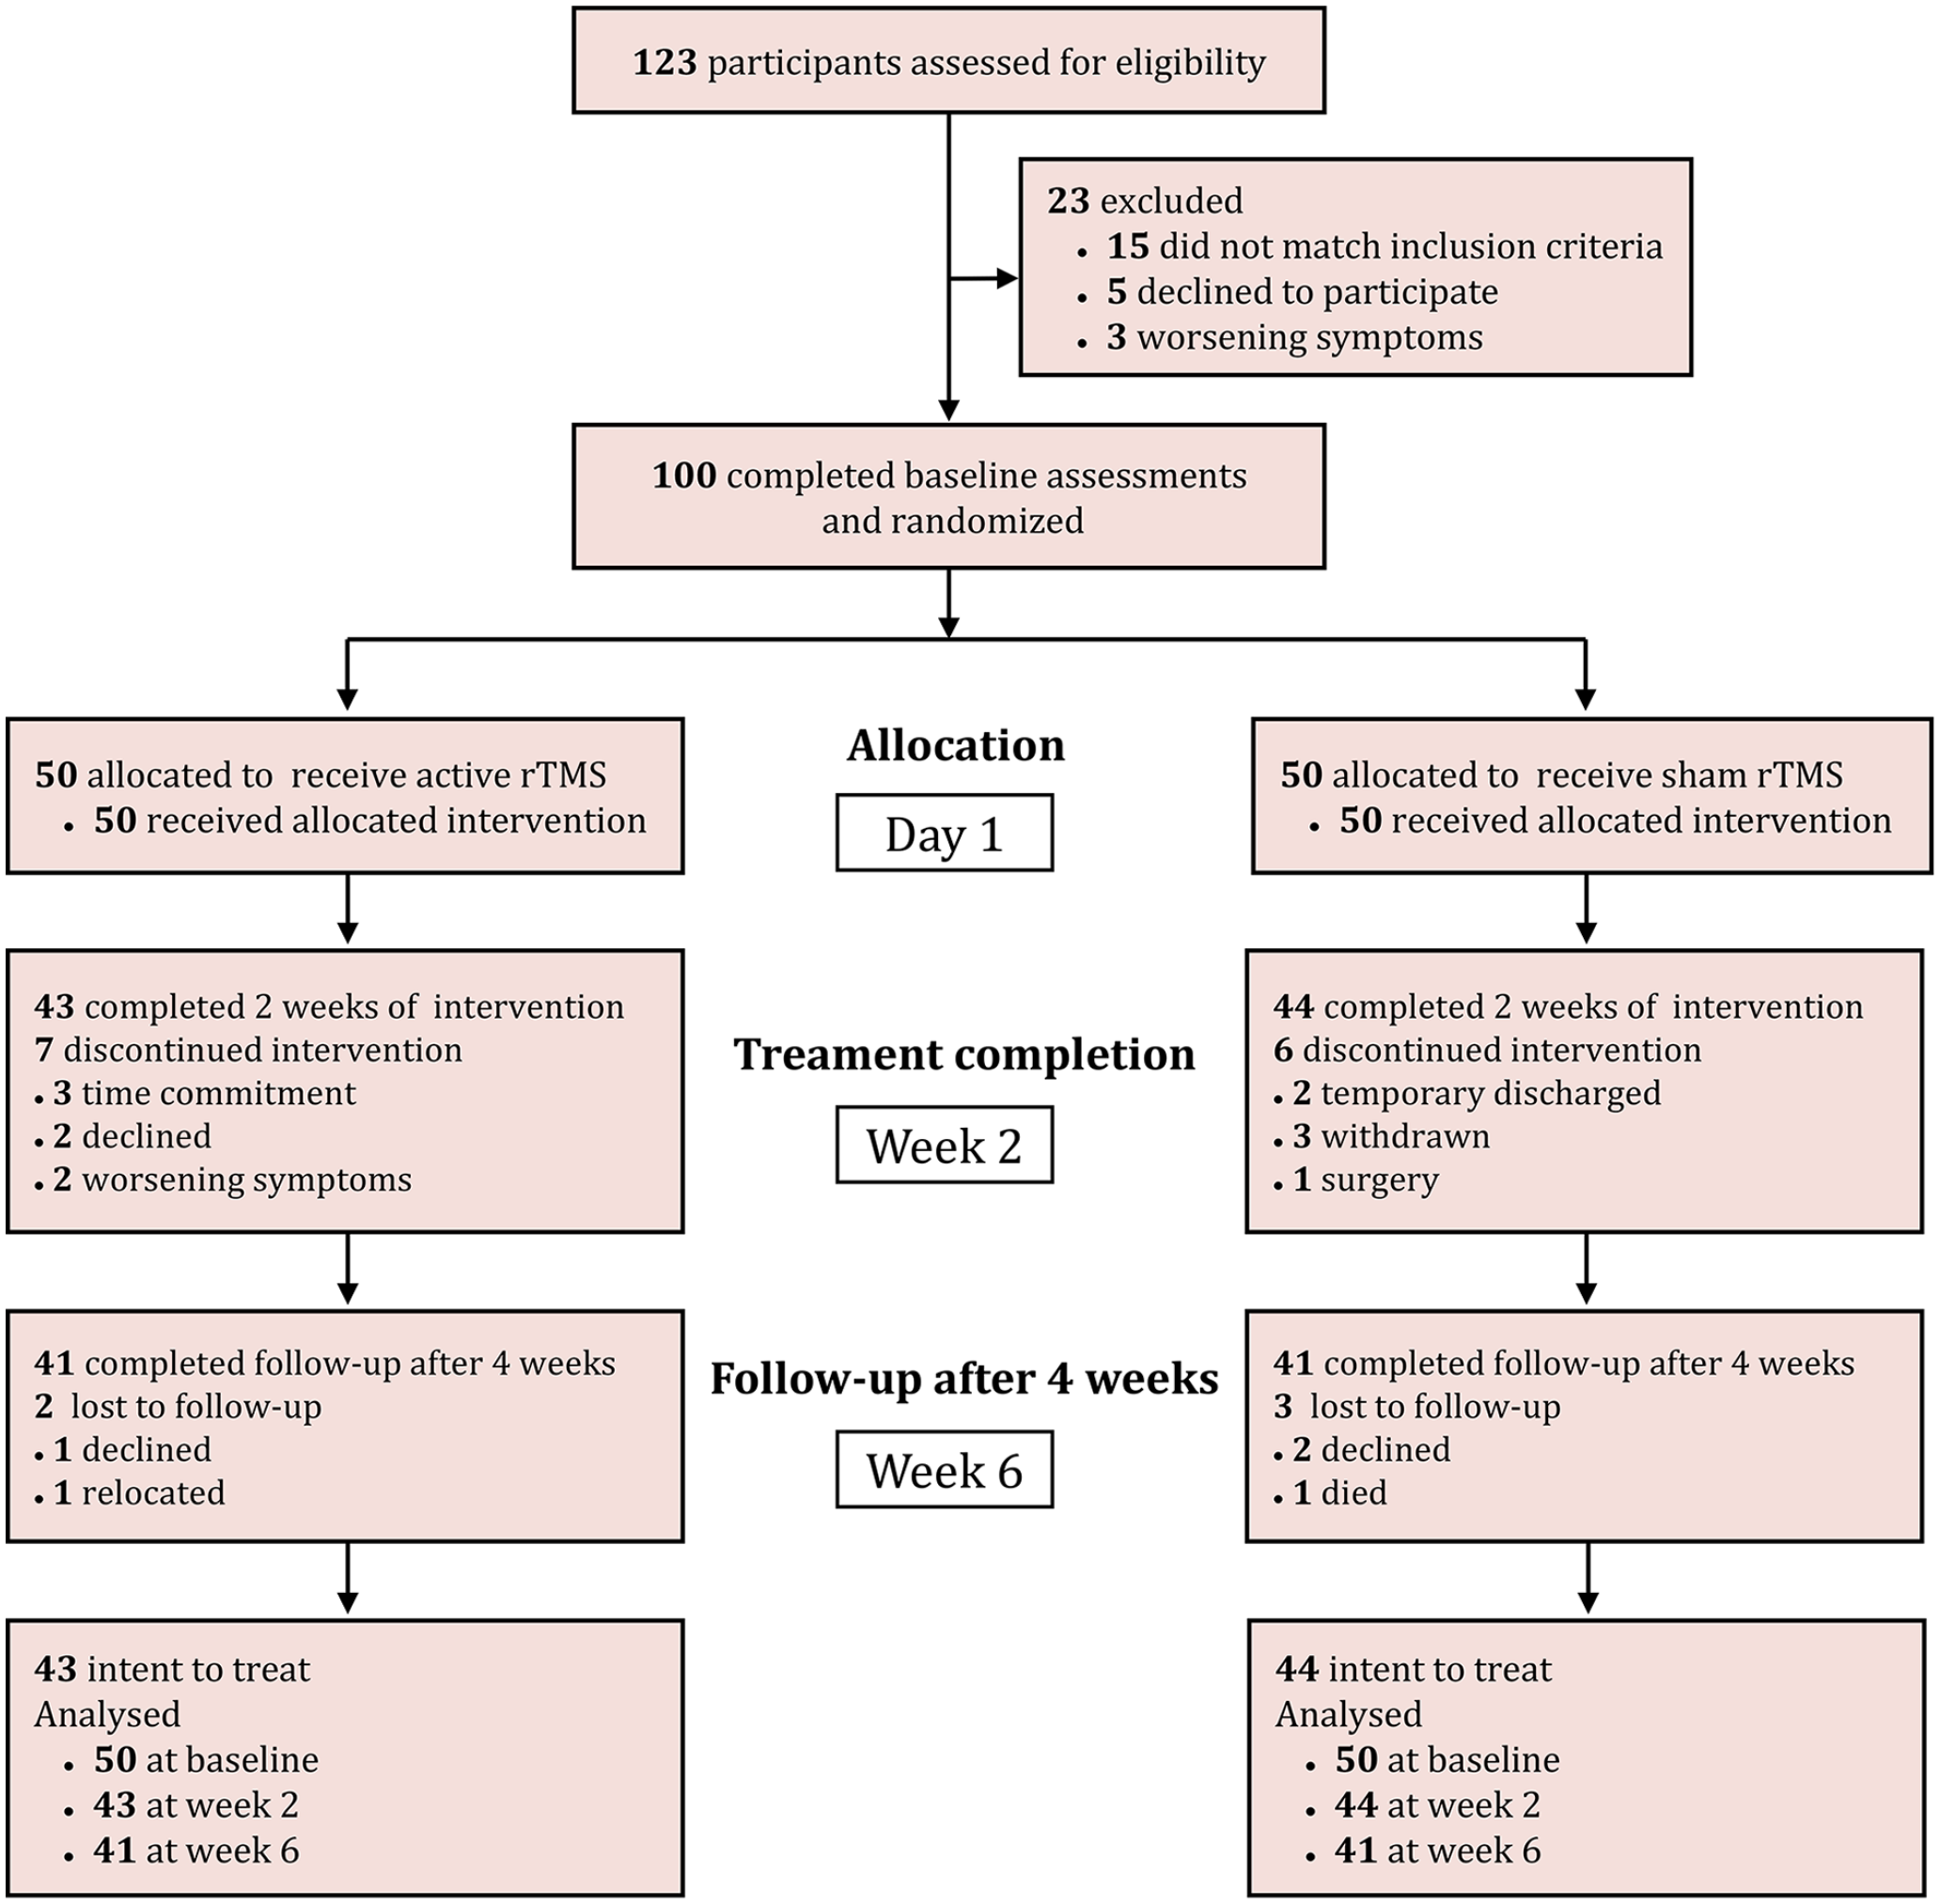
Participant enrollment flowchart.
Baseline Demographic and Clinical Characteristics.
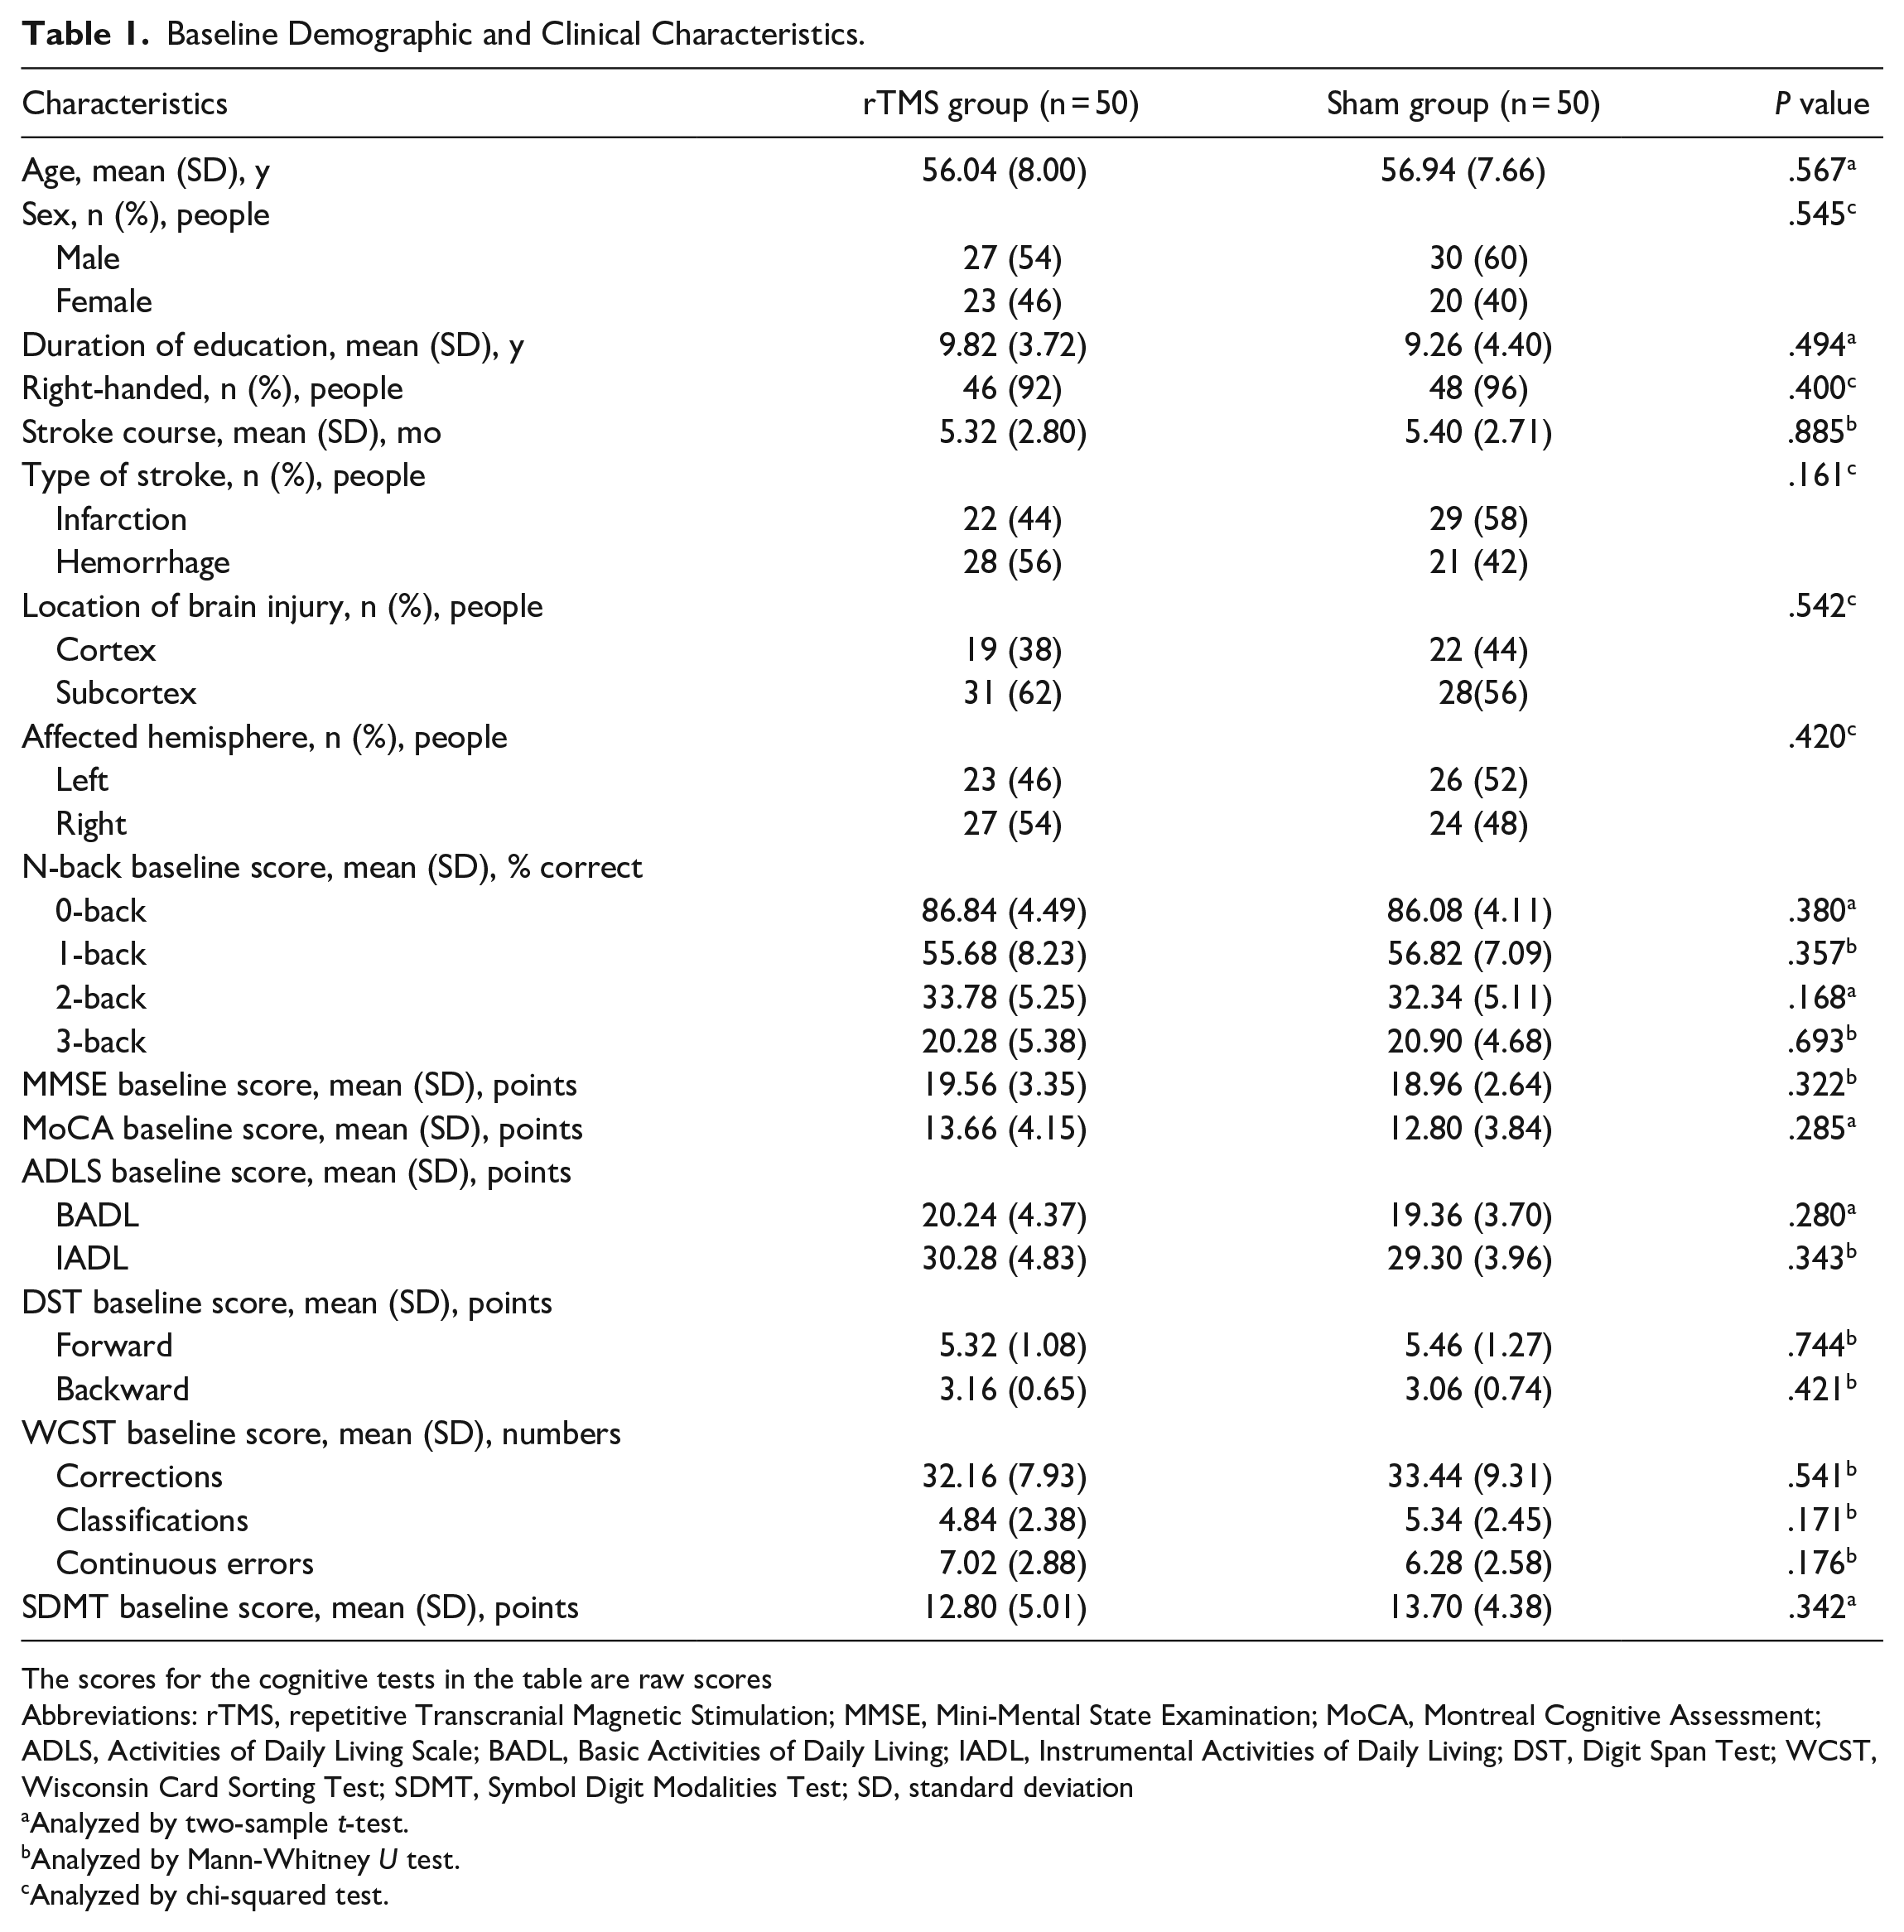
The scores for the cognitive tests in the table are raw scores
Abbreviations: rTMS, repetitive Transcranial Magnetic Stimulation; MMSE, Mini-Mental State Examination; MoCA, Montreal Cognitive Assessment; ADLS, Activities of Daily Living Scale; BADL, Basic Activities of Daily Living; IADL, Instrumental Activities of Daily Living; DST, Digit Span Test; WCST, Wisconsin Card Sorting Test; SDMT, Symbol Digit Modalities Test; SD, standard deviation
Analyzed by two-sample t-test.
Analyzed by Mann-Whitney U test.
Analyzed by chi-squared test.
Primary Outcome
There was an interaction effect between time (baseline and weeks 2 and 6) and group (active and sham) on 0-back (F(2,266) = 6.69, P = .001), 1-back (F(2,266) = 9.41, P < .001), 2-back (F(2,266) = 22.45, P < .001), and 3-back (F(2,266) = 8.00, P < .001) scores (Table 2). Compared with baseline, the scores of 0-back (t = 4.64, P < .001; 95% CI, 0.23-1.19), 1-back (t = 13.71, P < .001; 95% CI, 1.25-2.93), 2-back (t = 17.96, P < .001; 95% CI, 1.65-3.83), and 3-back (t = 14.815, P < .001; 95% CI, 1.29-3.23) improved markedly in the active group but not the sham group (0-back: t = 2.03, P = .09; 1-back: t = 1.96, P = .16; 2-back: t = 1.87, P = .21; 3-back: t = 1.90, P = .19) at week 2. Similar findings were observed at follow-up (week 6). Specifically, there was an improvement in 0-back (t = 2.13, P = .042; 95% CI, 0.11-0.59), 1-back (t = 8.67, P < .001; 95% CI, 0.74-1.96), 2-back (t = 10.45, P < .001; 95% CI, 0.85-2.29), and 3-back (t = 7.10, P < .001; 95% CI, 0.34-1.66) scores among participants in the active group but not the sham group (0-back: t = 1.67, P = .33; 1-back: t = 1.76, P = .26; 2-back: t = 1.54, P = .41; 3-back: t = 1.32, P = .59).
Study Outcome Measures.
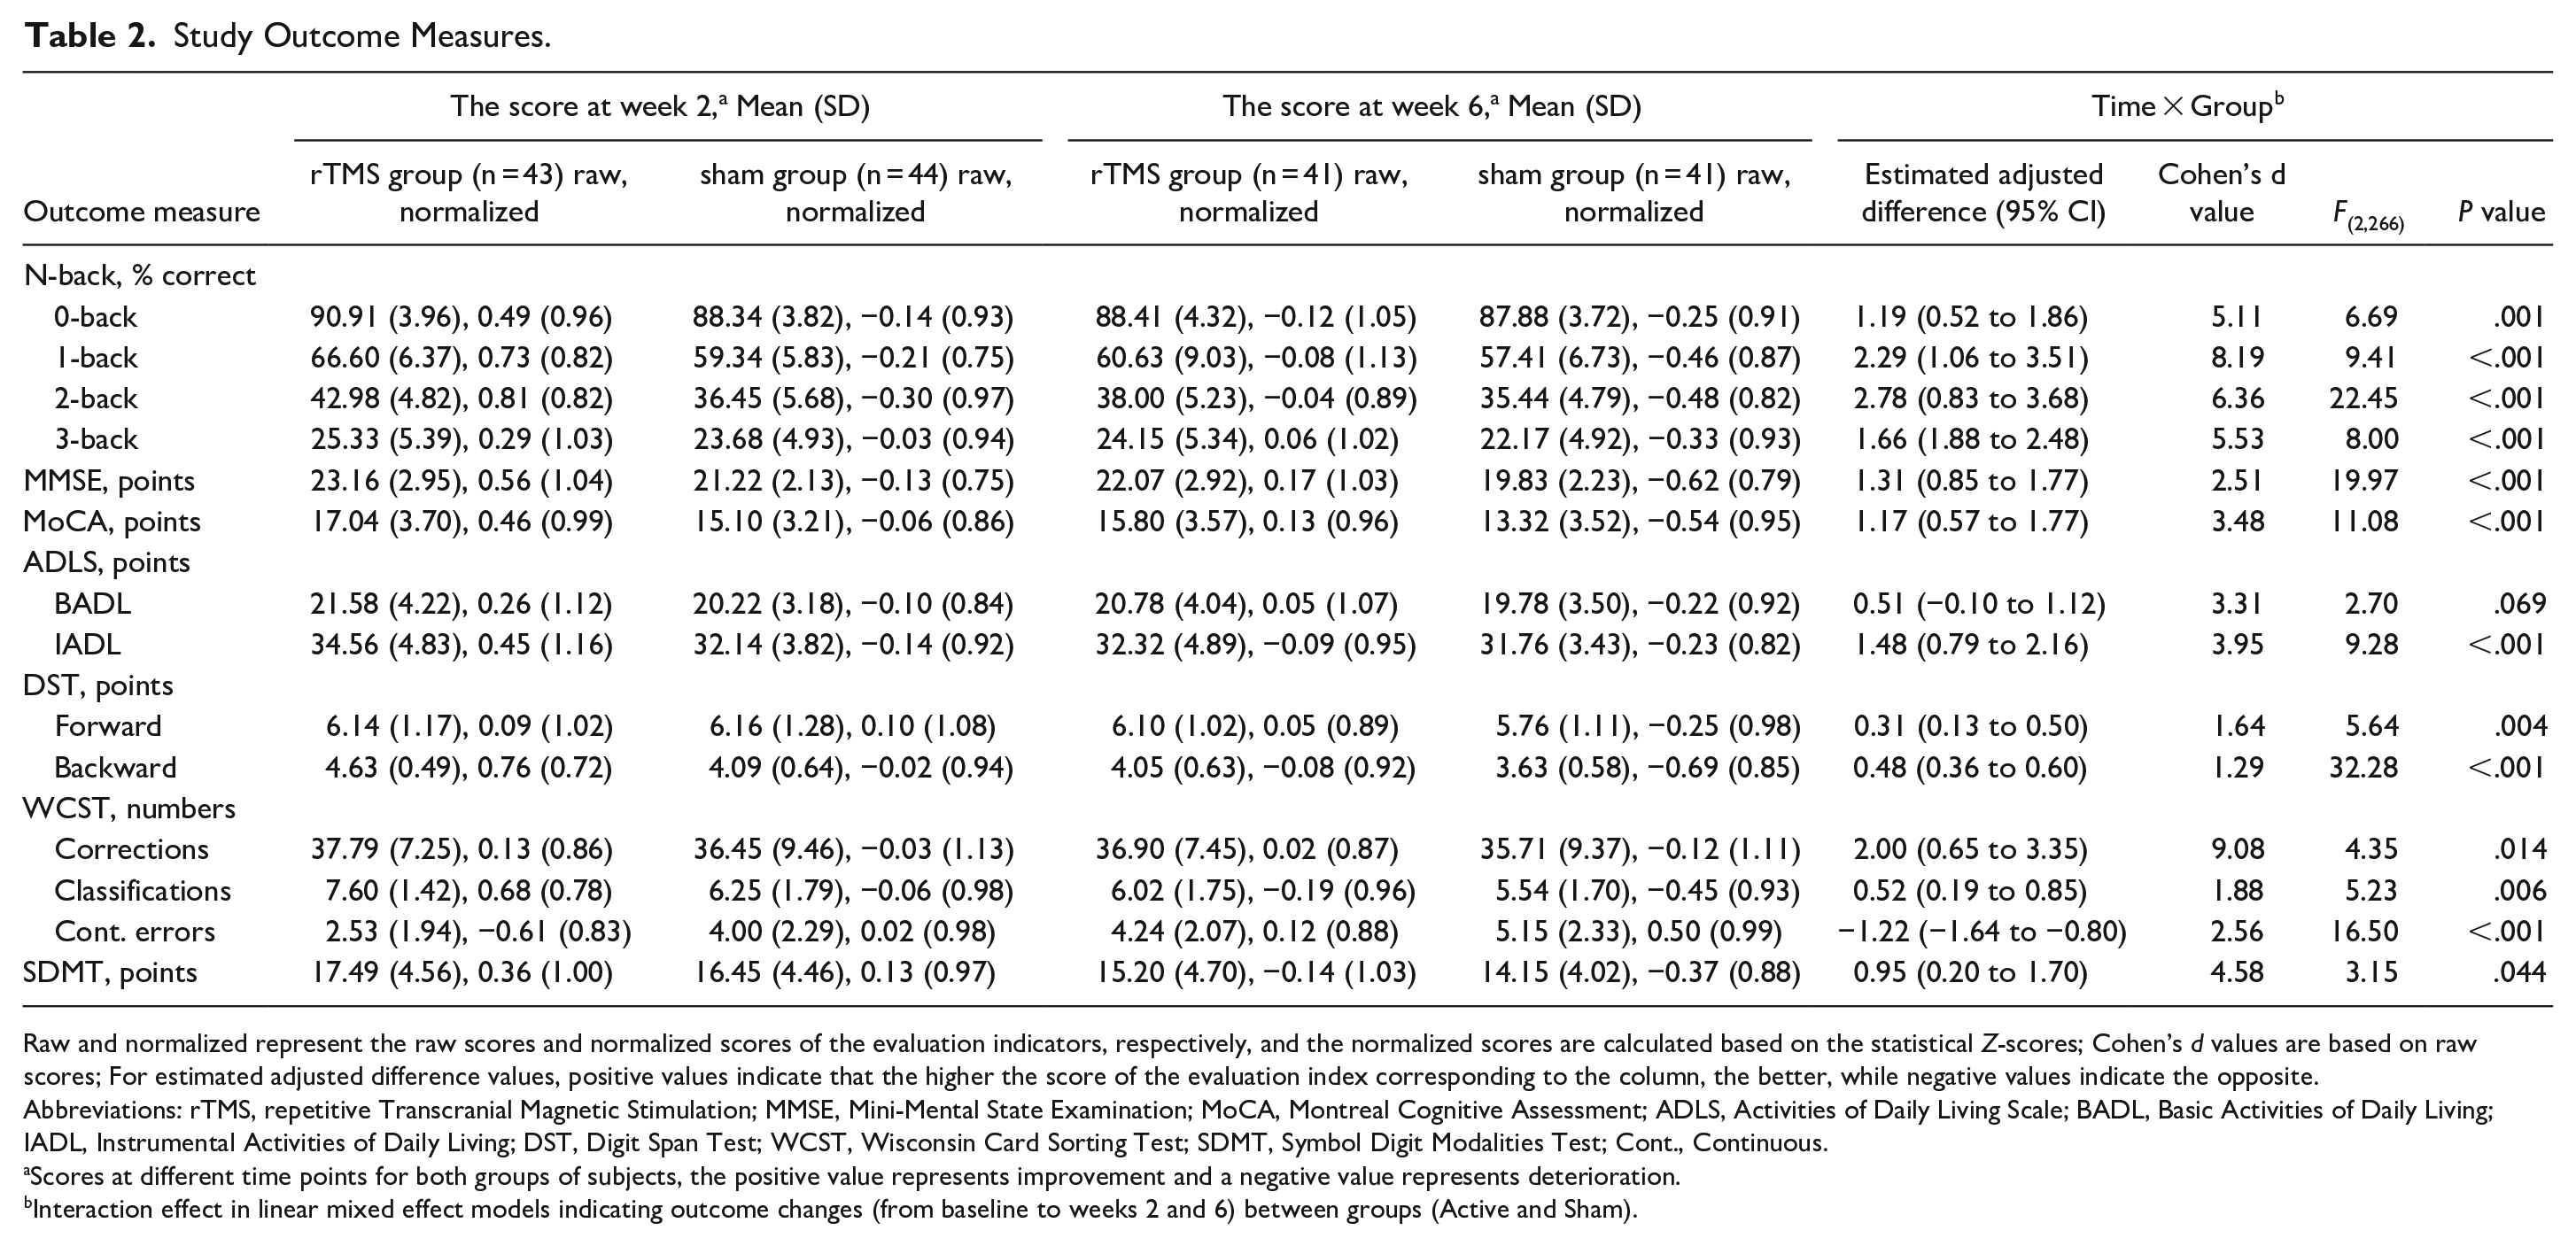
Raw and normalized represent the raw scores and normalized scores of the evaluation indicators, respectively, and the normalized scores are calculated based on the statistical Z-scores; Cohen’s d values are based on raw scores; For estimated adjusted difference values, positive values indicate that the higher the score of the evaluation index corresponding to the column, the better, while negative values indicate the opposite.
Abbreviations: rTMS, repetitive Transcranial Magnetic Stimulation; MMSE, Mini-Mental State Examination; MoCA, Montreal Cognitive Assessment; ADLS, Activities of Daily Living Scale; BADL, Basic Activities of Daily Living; IADL, Instrumental Activities of Daily Living; DST, Digit Span Test; WCST, Wisconsin Card Sorting Test; SDMT, Symbol Digit Modalities Test; Cont., Continuous.
Scores at different time points for both groups of subjects, the positive value represents improvement and a negative value represents deterioration.
Interaction effect in linear mixed effect models indicating outcome changes (from baseline to weeks 2 and 6) between groups (Active and Sham).
Moreover, 0-back (t = 3.077, P = .003; 95% CI, 0.23-1.09), 1-back (t = 5.55, P < .001; 95% CI, 0.73-1.65), 2-back (t = 5.77, P < .001; 95% CI, 0.78-1.70), and 3-back (t = 2.22, P = .036; 95% CI, 0.03-0.85) scores at week 2 and 0-back (t = 2.08, P = .047; 95% CI, 0.02-0.62), 1-back (t = 2.11, P = .045; 95% CI, 0.04-0.64), 2-back (t = 2.31, P = .023; 95% CI, 0.08-0.94), and 3-back (t = 2.15, P = .042; 95% CI, 0.02-0.74) scores at week 6 in the rTMS group were significantly higher than those in the sham group.
Secondary Outcomes
For symptom measures, group (active and sham) by time (baseline and weeks 2 and 6) interaction effects were observed in the MMSE (F(2,266) = 19.97, P < .001), MoCA (F(2,266) = 11.08, P < .001), and IADL (F(2,266) = 9.28, P < .001) scores but not the BADL (F(2,266) = 2.70, P = .069) (Table 2). In addition, the rTMS group showed significantly better improvement in the above clinical symptoms than the sham group at both weeks 2 and 6 (P < .05), except for BADL scores (P > .05; Table 2).
For multi-domain cognitive tests, interaction effects of group (active and sham) by time (baseline and weeks 2 and 6) were revealed in DST (Forward: F(2,266) = 5.64, P = .004; Backward: F(2,266) = 32.28, P < .001), WCST (Corrections: F(2,266) = 4.35, P = .014; Classifications: F(2,266) = 5.23, P = .006; Continuous errors: F(2,266) = 16.50, P < .001), and SDMT (F(2,266) = 3.15, P = .044) scores. Moreover, the improvement in the above cognitive domains was significantly better in the rTMS group than in the sham group at weeks 2 and 6 (P < .05; Table 2).
For functional brain activities, the average HbO value (Week 2: t = 39.45, P < .001; Week 6: t = 30.81, P < .001), average functional connection coefficient (Week 2: t = 18.90, P < .001; Week 6: t = 10.76, P < .001), and average brain network connection coefficient threshold (Week 2: t = 19.18, P < .001; Week 6: t = 12.47, P < .001) of the left DLPFC, right PMC, and right SPL were significantly improved in the rTMS group compared with baseline. Notably, a similar trend was found in the sham group, but the difference was not statistically significant (P > .05). In addition, the average HbO value (Week 2: t = 18.81, P < .001; Week 6: t = 21.57, P < .001), average functional connection coefficient (Week 2: t = 13.12, P < .001; Week 6: t = 8.75, P < .001), and average brain network connection coefficient threshold (Week 2: t = 11.78, P < .001; Week 6: t = 10.39, P < .001) for the left DLPFC, right PMC, and right SPL were significantly improved in the rTMS group compared with the sham group at weeks 2 and 6 (Figure 3).
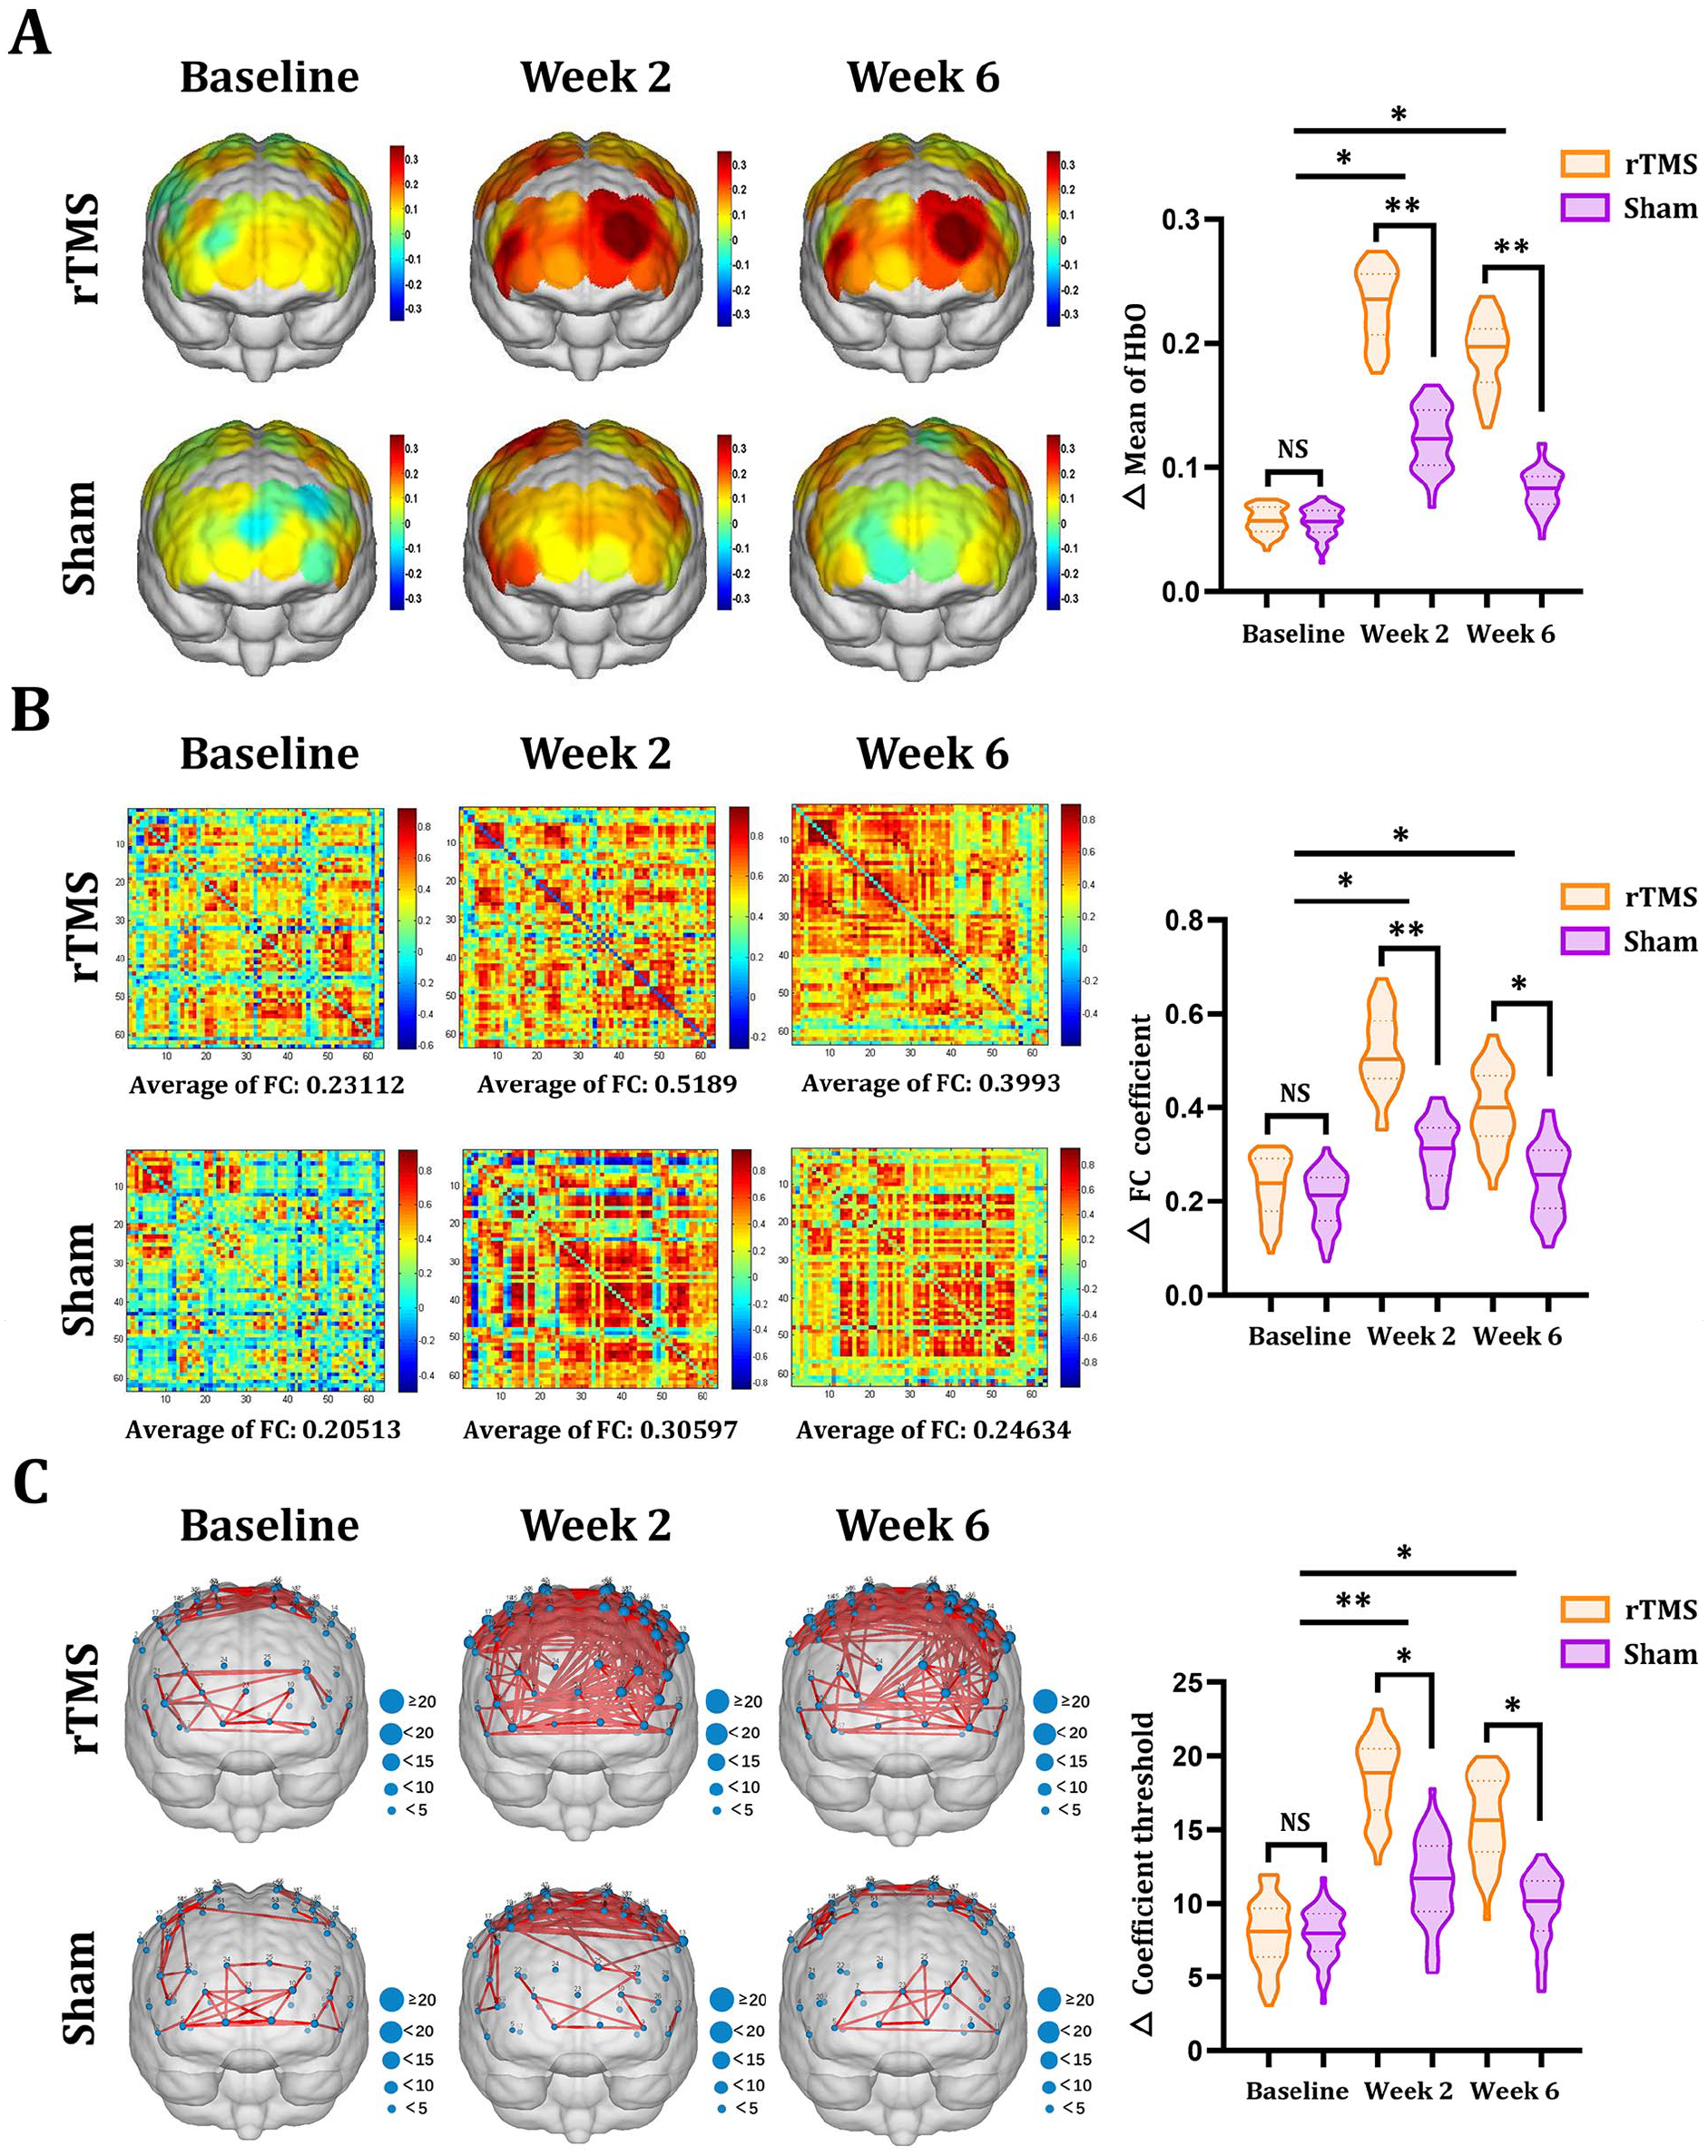
Functional brain activity maps based on fNIRS. (A) The average brain activation maps of DLPFC, PMC, and SPL of two groups of subjects at different time points. (B) The average functional connection coefficient matrix of DLPFC, PMC, and SPL of two groups of subjects at different time points. (C) The average brain network connection coefficient threshold of two groups of subjects at different time points.
Adverse Effects
Approximately 58% (29/50) and 50% (25/50) of the participants in the rTMS and sham groups, respectively, reported at least one side-effect during treatment (χ² = 0.64; P = .42; Table 3). Headache was the most common side-effect in both groups. The median number of side effects and the average number of side effects during treatment were 6.0 (interquartile range [IQR] = 2-10.5) and 6.6 (SD = 5.2) in the rTMS group and 5.0 (IQR = 1.5-9.0) and 5.8 (SD = 4.5) in the sham group, respectively (F(1,98) = 2.07; P = .038). All the events were tolerable and diminished gradually after treatment cessation. No epilepsy or epileptic seizures were recorded.
Adverse Events.
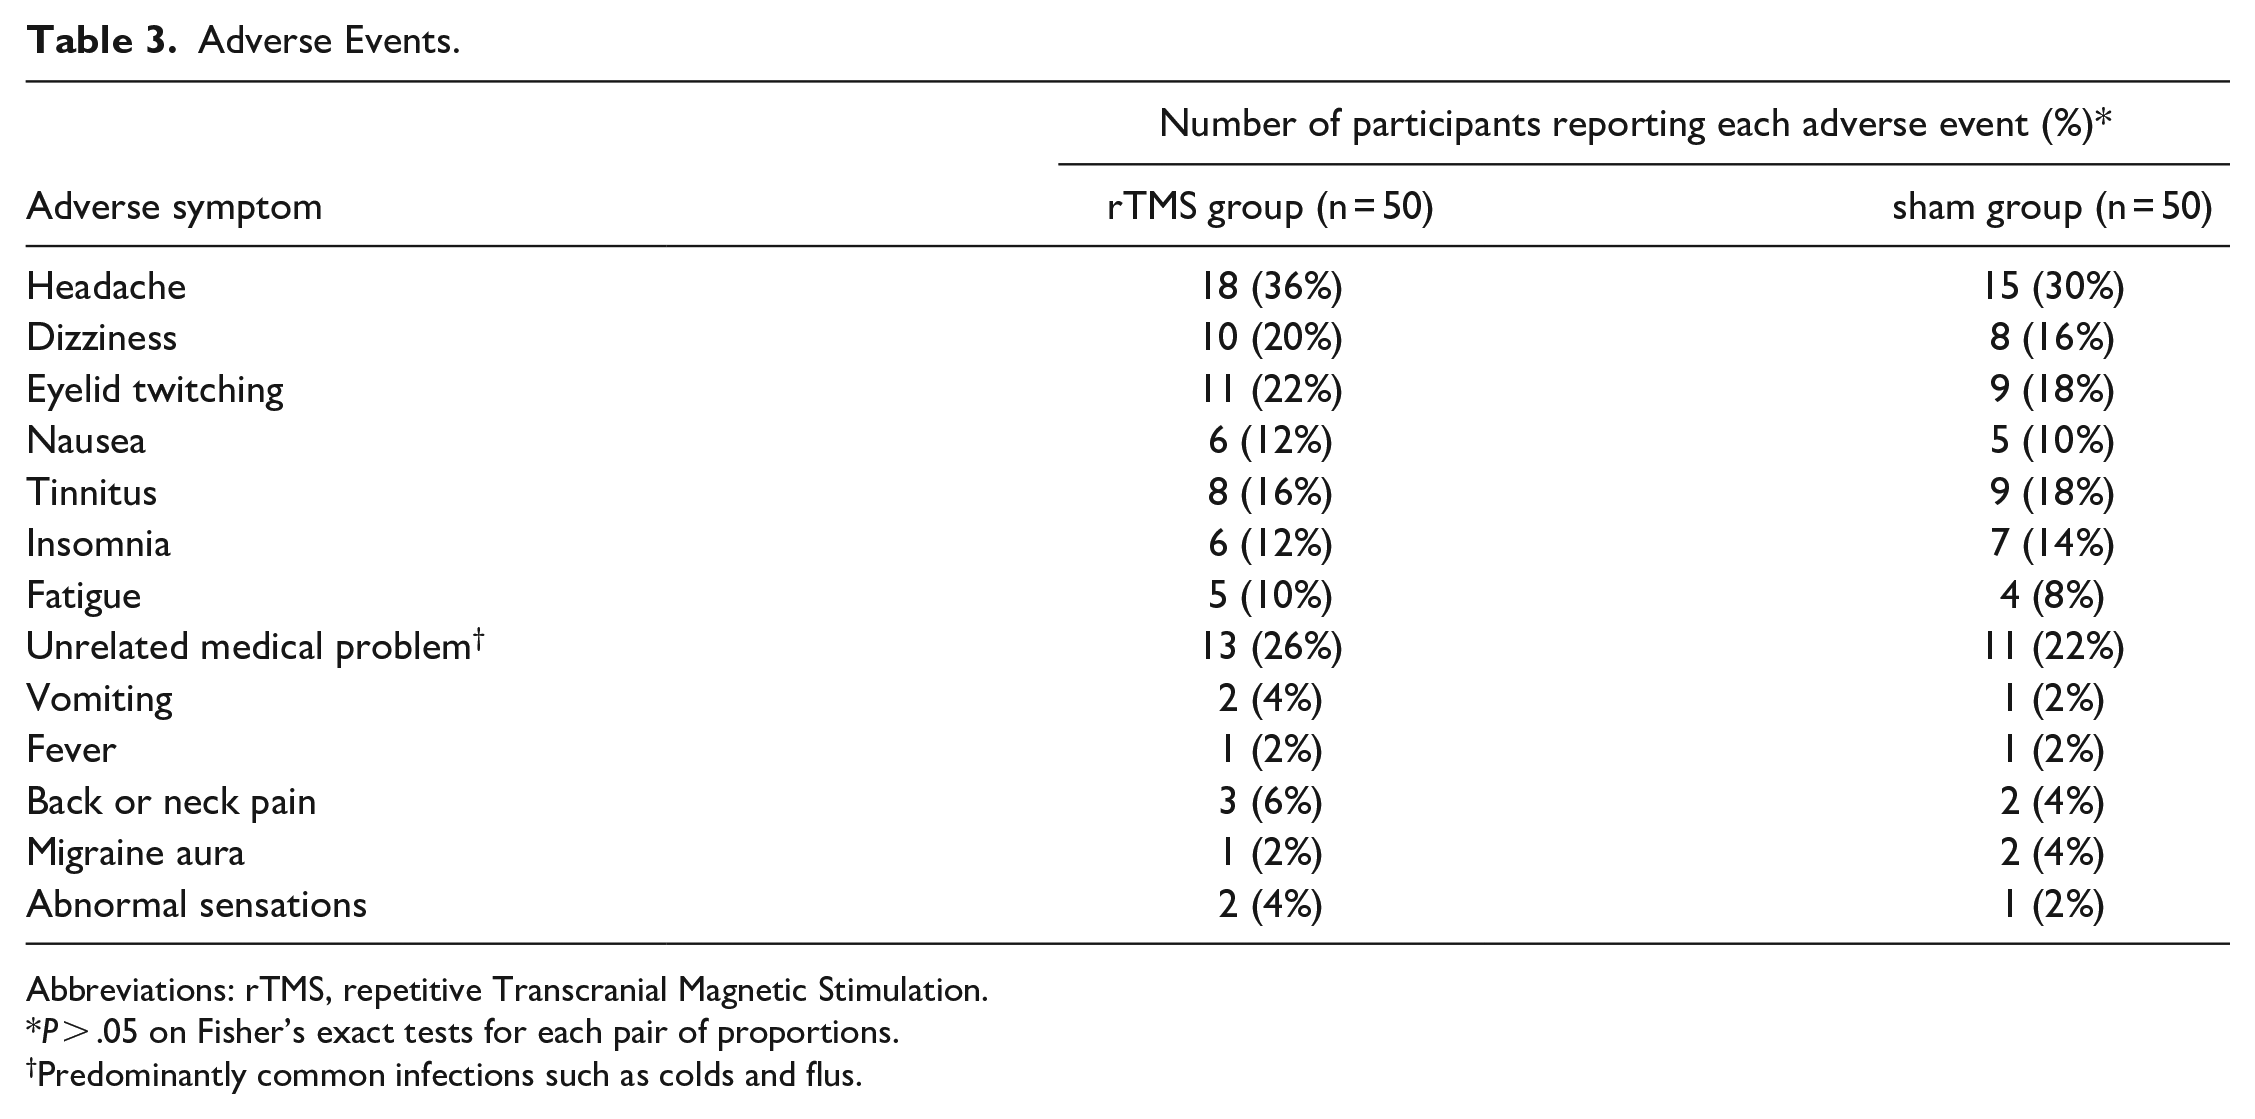
Abbreviations: rTMS, repetitive Transcranial Magnetic Stimulation.
P > .05 on Fisher’s exact tests for each pair of proportions.
Predominantly common infections such as colds and flus.
Discussion
To the best of our knowledge, this is the first double-blinded randomized controlled trial to specifically investigate the efficacy of rTMS in patients with post-stroke WM impairment. The results demonstrated that the symptoms of WM impairment in stroke patients were significantly improved after 14 days of high-frequency rTMS intervention. In addition, there were three secondary findings: (1) rTMS was effective in the treatment of WM impairment for up to 4 weeks after treatment cessation; (2) there were significant improvements in clinical symptoms (eg, MMSE, MoCA, and IADL) and several cognitive domains (including attentional functioning, and executive functioning) after active treatment; and (3) the left DLPFC, right PMC, and right SPL brain regions of stroke patients were significantly activated, and the functional connections between them were significantly enhanced after 2 weeks of rTMS treatment. The above results suggest that high-frequency rTMS can effectively improve WM as well as clinical symptoms and other cognitive functions in stroke patients, which validates our hypothesis. Our study results provide evidence-based evidence for rTMS for the treatment of WM impairment in stroke patients and new insights into understanding the pathological mechanisms of post-stroke WM impairment, which is an important guideline for optimizing clinical rehabilitation strategies for post-stroke WM impairment.
WM is an advanced cognitive function that plays an important role in everyday life situations such as work, learning, and social participation. 23 As a novel non-invasive neural modulation technology, rTMS was approved by the U.S. Food and Drug Administration for the treatment of cognitive disorders. 24 Several studies have attempted to study the effects of rTMS on WM impairment in the elderly or patients with Parkinson’s disease or depression and achieved good results.11 -15 Hence, there is mounting evidence-based evidence for rTMS in the treatment of WM disorders. Nevertheless, randomized, blinded, and sham-controlled studies on the use of rTMS in the targeted treatment of post-stroke WM impairment are limited. Meanwhile, there is also a paucity of studies exploring the long-term efficacy of rTMS in post-stroke WM impairment and its related rehabilitation mechanisms, which makes the present study innovative and of clinical significance. We found that participants in the rTMS group exhibited improved significantly WM compared with those in the sham group, confirming the therapeutic effect of rTMS on WM in stroke patients, which is similar to the results of related studies on the improvement of WM by rTMS in young or elderly individuals.12,25 However, the rTMS frequencies used in the above studies were 6 Hz 12 or 1 Hz, 25 whereas the frequency applied in the present study was 10 Hz, which was mainly based on the results of our previous studies,8,9 and the fact that 10 Hz produces a greater magnetic field effect compared with 6 Hz and 1 Hz, which can regulate cortical excitability to a greater extent and promote the remodeling of the functional brain network. 26 In addition, we did not choose a frequency higher than 10 Hz, mainly because the frequency is too high and there is a risk of inducing epilepsy. 27 Compared with traditional cognitive training that takes 30 to 40 minutes per session, the 10 Hz rTMS used in this study only takes 18 minutes per session and does not completely rely on the active cooperation of the patient, which is conducive to saving time and labor costs.
There was not much difference in the number of subjects with left-sided and right-sided brain injury in the two groups included in this study, which preliminary suggests that rTMS stimulation of the left DLPFC can promote the recovery of WM in patients with left and right stroke. The DLPFC is currently recognized as an effective stimulation target for improving cognitive dysfunction; however, the left and right DLPFC are associated with different cognitive functions. Watanabe et al reported that the left and right DLPFC play different roles in WM. 28 Weigand et al suggested that the right DLPFC is associated with withdrawal-related emotional fear. 14 Our previous studies confirmed the ameliorative effect of rTMS stimulation of the left DLPFC on post-stroke cognitive impairment.8,9 After careful consideration, the left DLPFC was chosen as the stimulation target in the current study. Although some previous studies also chose the left DLPFC as the stimulation target for rTMS to improve cognitive function, they did not show a positive effect, 29 which may be attributed to the lack of accurate localization of the left DLPFC. Further, various studies have used the international 10 to 20 EEG positioning reference system to locate the stimulation target of rTMS; nevertheless, this positioning method is relatively rough, inaccurate, and time-consuming. 30 The present study used a near-infrared optical neural navigator to locate the stimulation target, which allows real-time monitoring of the overlap between the rTMS stimulation coil and the target, 31 ensures the precision of rTMS stimulation and ultimately improves the therapeutic effect. The sham group in the current study used pseudo-stimulation coils with the same shape as the active stimulation coils, and the subjects were not allowed to discuss the treatment among themselves. Subsequently, the subjects in the sham group reported that they did not know the difference between the real and pseudo rTMS, suggesting that our double-blinded design was successful, which effectively prevented the placebo effect and improved the scientific validity of the study design.
Our results revealed interaction among the time points (baseline, week 2, and week 6) and groups (rTMS group and sham group) of the primary outcome N-back test. Particularly, the 2-back test was the most significant, suggesting that rTMS improved post-stroke WM deficits and these effects were prolonged, lasting up to 4 weeks after the end of rTMS treatment. Limited hospitalization duration in Chinese rehabilitation medicine departments pose a challenge in the provision of effective treatment. This study suggests that the benefits of rTMS therapy administered during hospitalization may persist even after discharge, potentially reducing healthcare resource utilization and costs. Thus, these findings need to be further investigated. In addition, we found that attention and executive function were improved to different degrees in stroke patients following rTMS treatment, and fNIRS revealed that the neural activities in the left DLPFC, right PMC, right SPL and other brain regions were enhanced, and the functional connections between them were significantly improved. This suggests that the improved WM may be driven by activation of the above brain regions and induction of functional remodeling. Studies have shown that the DLPFC and SPL brain regions play a role in cognitive functions such as attention, memory, executive function, and visuospatial structure. 32 This may explain the enhanced attention and executive function in the participants of this study. However, PMC is generally considered to be associated with motor functions such as postural regulation and ataxia. 33 In this study, we utilized rTMS to stimulate the DLPFC and observed significant activation of the PMC brain regions. This co-activation may be due to rTMS’s known influence on distant brain areas and the fact that the DLPFC and PMC belong to the same functional network. 34 This suggests an interaction between these two areas, potentially implicating the PMC in rTMS-induced WM improvements.
Of note, BADL in both groups was not improved following treatment, which may be due to the selection of DLPFC as the stimulation target in this study, which participates in the regulation of cognitive function. Therefore, the IADL index, which mainly reflects cognitive function, showed significant improvement. However, BADL is largely dependent on somatic motor functions (eg, transferring, walking, dressing, etc.), which may be achieved with only basic cognitive functions. 35 Considering that higher cognitive functions are not needed, there was no significant improvement in BADL scores.
Notably, there was no significant difference in the self-reported adverse events between the two groups after treatment with 10 Hz active and sham rTMS. The most common adverse event was headache, and most of the adverse events resolved after suspension of the rTMS treatment. There were no serious adverse events such as seizures or epileptic episodes, suggesting that the participants showed good tolerance to rTMS. In addition, the dropout rate was low (18%), and comparable between the two groups, and the projected sample size was achieved.
Although our findings clarify the efficacy of rTMS in improving WM after stroke, its long-term efficacy, and reveals its rehabilitation mechanisms, there are some limitations. For instance, this was a single-center clinical study, and thus whether the responsiveness and tolerability of rTMS observed in this study is similar in populations from different regions and ethnicities need to be investigated. Furthermore, this study conducted a 4-week follow-up. Therefore, the long-term efficacy of rTMS in improving WM needs to be further investigated in the future.
Conclusions
In conclusion, High-frequency rTMS stimulation of the left DLPFC can improve WM and several cognitive symptoms in stroke patients. Moreover, it is well tolerated, with its efficacy lasting for 4 weeks. These effects may be attributed to the following: activation of the left DLPFC, the right PMC, and the right SPL brain regions and their functional connectivity enhancement, which induce remodeling of functional brain networks. Beyond the individual patient benefits, the potential of rTMS for expanded therapeutic applications, shorter treatment sessions, and sustained effects could have broader societal implications. This could encourage government and health insurance companies to consider incorporating rTMS as a standard treatment for post-stroke WM deficits, leading to wider accessibility and advancements in cognitive rehabilitation.
Footnotes
Acknowledgements
We thank the participants for their cooperation during this study, and the Home for Researchers editorial team for language editing service.
Author Contributions
Declaration of Conflicting Interests
The author(s) declared no potential conflicts of interest with respect to the research, authorship, and/or publication of this article.
Funding
The author(s) disclosed receipt of the following financial support for the research, authorship, and/or publication of this article: This work was supported by Guangdong Basic and Applied Basic Research Foundation (No. 2023A1515011310, 2021A1515010951, and 2023A1515030080); National Key Research and Development Program of China (No. 2023YFC3603800, 2023YFC3603804, and 2022YFC3601200); National Natural Science Foundation of China (No. 82272605, 82372568, and 82172546); Third Affiliated Hospital of Sun Yat-Sen University, Clinical Research Program (No. QHJH202304, and YHJH202210); National Natural Science Foundation of China Incubation Special Youth Program of the Third Affiliated Hospital of Sun Yat-Sen University (No. 2021GZRPYQN10); Scientific and Technological Planning Project of Guangzhou City (No. 2024A03J0177).
Data Availability Statement
The datasets generated during this study are available from the corresponding author upon reasonable request.