
Abstract
Background. Three-dimensional kinematic analysis provides quantitative and qualitative assessment of upper-limb motion and is used as an outcome measure to evaluate impaired movement after stroke. The number of kinematic variables used, however, is diverse, and models for upper-extremity motion analysis vary. Objective. The authors aim to identify a set of clinically useful and sensitive kinematic variables to quantify upper-extremity motor control during a purposeful daily activity, that is, drinking from a glass. Methods. For this purpose, 19 participants with chronic stroke and 19 healthy controls reached for a glass of water, took a sip, and placed it back on a table in a standardized way. An optoelectronic system captured 3-dimensional kinematics. Kinematical parameters describing movement time, velocity, strategy and smoothness, interjoint coordination, and compensatory movements were analyzed between groups. Results. The majority of kinematic variables showed significant differences between study groups. The number of movement units, total movement time, and peak angular velocity of elbow discriminated best between healthy participants and those with stroke as well as between those with moderate (Fugl-Meyer scores of 39-57) versus mild (Fugl-Meyer scores of 58-64) arm impairment. In addition, the measures of compensatory trunk and arm movements discriminated between those with moderate and mild stroke impairment. Conclusion. Kinematic analysis in this study identified a set of movement variables during a functional task that may serve as an objective assessment of upper-extremity motor performance in persons who can complete a task, such as reaching and drinking, after stroke.
Introduction
The functional use of an upper extremity is impaired after stroke in approximately 80% of patients acutely and 40% chronically. 1,2 This limits effective movements and the level of activity and participation. 3 Impairment and disability in clinical settings is generally assessed by ordinal scales such as the Fugl-Meyer Assessment, Frenchay Arm Test, Motor Assessment Scale, and Action Research Arm Test, but they may not be sensitive to small and more specific changes. 4 More objective assessment methods are needed to evaluate and describe the upper-extremity function in detail.
Kinematic movement analysis can provide more specific information about movement components and strategies, although this requires special equipment and training and is most applicable to a research setting. Kinematics describes movements of the body through space and time, including linear and angular displacements, velocity, and acceleration, but without reference to the forces involved. 5,6 Three-dimensional imaging techniques, including optoelectronic systems, can provide a quantitative assessment of movement, but models for upper-extremity analysis are not fully established. 7
Kinematics of normal goal-directed reaching have been examined 8-12 to better understand biomechanical and motor control mechanisms in healthy participants. Kinematic studies with persons after stroke have yielded information about upper-extremity movement control, but most of these studies only examined pointing or reaching. 13-15 Reaching and grasping movements vary according to the goal and constraints of the task. For example, a pointing movement has different kinematics from arm extension combined with grasping an object, in the same way that reaching movement kinematics differ depending on whether an object is present. 6,16 Studies of purposeful motion for real-life activities are growing. 17-21 One challenge is to identify the kinematical variables that best quantify upper-extremity movements to reliably evaluate motor function and treatment efficacy in persons with hemiparesis. The goal of this study was to develop basic and clinically feasible measurements that discriminated between normal and impaired motor control and also discriminated between moderate (Fugl-Meyer scores of 39-57) and mild arm impairment (Fugl-Meyer scores of 58-64) during a daily activity, that is, drinking from a glass.
Methods
Participants
A total of 19 patients with hemiparesis following stroke and 19 healthy participants were recruited for this study as a sample of convenience. All participants were right-hand dominant. Background data of the stroke patients are provided in Table 1. Inclusion criteria for stroke patients were first unilateral cortical or subcortical stroke 3 or more months earlier and ability to perform the drinking task. Exclusion criteria were the presence of musculoskeletal or neurological problems that could affect the function of the arm. Mean age for healthy participants was 57.3 years (range, 41-78 years; 10 men, 9 women). All participants gave their written consent to participate in the study, which was approved by the Regional Ethics Committee Gothenburg, Sweden.
The upper-extremity motor function in stroke patients was assessed with the Fugl-Meyer Assessment for Upper Extremity (FMA-UE, scale 0-66) 22,23 at entry (Table 1). Three participants had poststroke spasticity. No participant reported pain during the drinking task. Stroke patients were divided into 2 groups based on FMA-UE scores between 39 and 57 (moderate arm impairment) and 58 to 64 (mild impairment).
Demographic Data and Clinical Characteristics for Stroke Patients
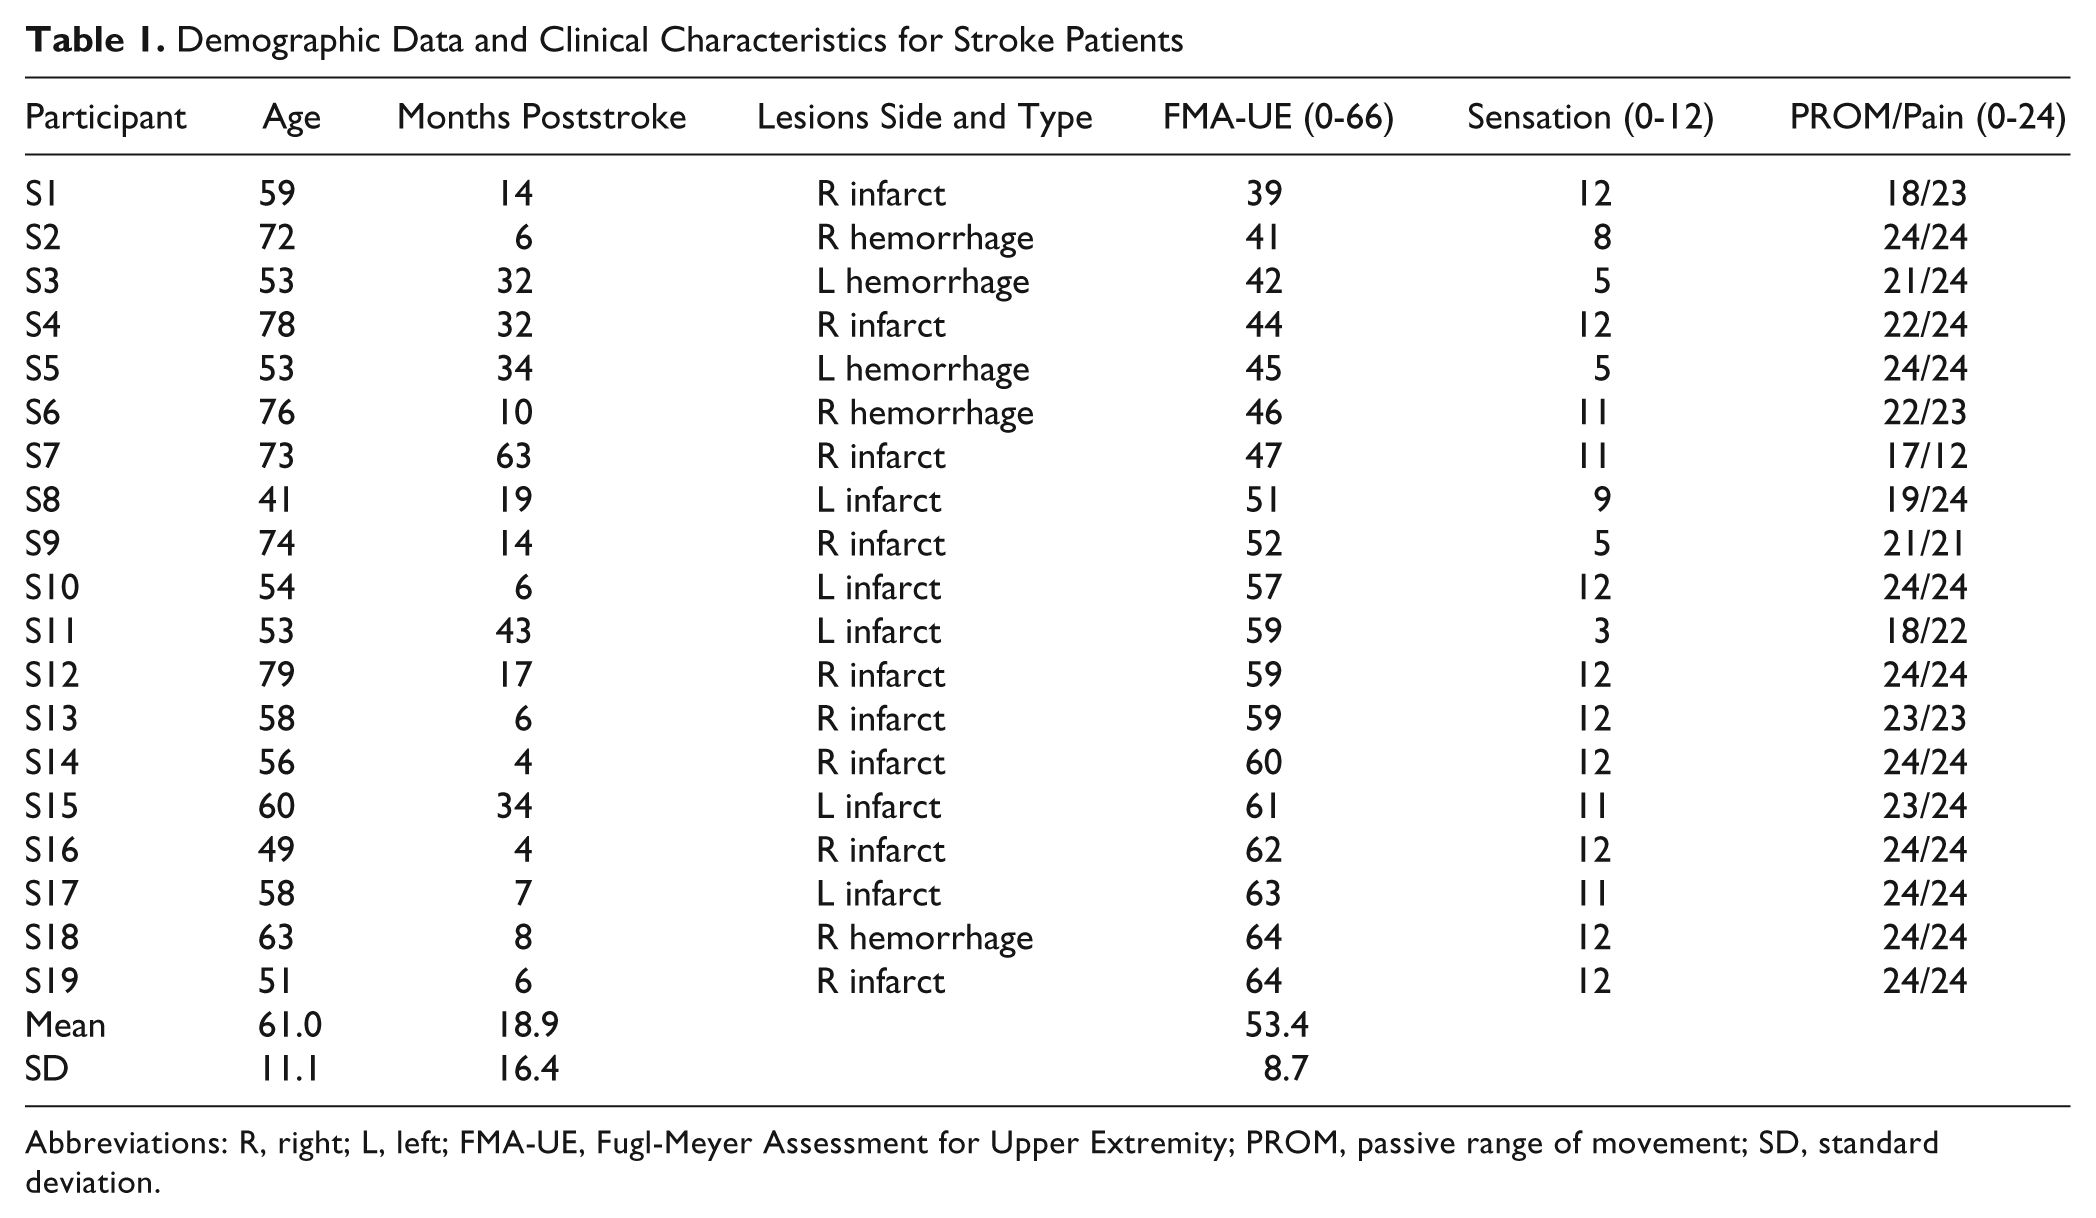
Abbreviations: R, right; L, left; FMA-UE, Fugl-Meyer Assessment for Upper Extremity; PROM, passive range of movement; SD, standard deviation.
Procedure
A standardized drinking task was used (Figure 1) with good test–retest reliability. 12 Participants were seated on a 46-cm high, straight-back chair in front of a 74-cm high table. The drinking glass was 7 cm in diameter and 9.5 cm high and was filled with 100 mL water. It was placed 30 cm from the table edge in the midline of the body. In the initial position, the participants were sitting close enough to reach the drinking glass, and the tested arm was pronated with the hand resting on the table and wrist line close to the edge of the table. The upper arm was in a neutral adducted position with approximately 90° flexion at the elbow. The participant’s other hand was resting on the lap. A total of 9 spherical 12-mm retroreflective markers were placed on the hand (third metacarpophalangeal joint), wrist (styloid process of ulna), elbow (lateral epicondyle), right and left shoulders (middle part of acromion), thorax (upper part of sternum), and face (notch between eyebrows) and also on the glass (upper and lower edge). Comparable marker positions have been used in other studies. 15,17,24,25
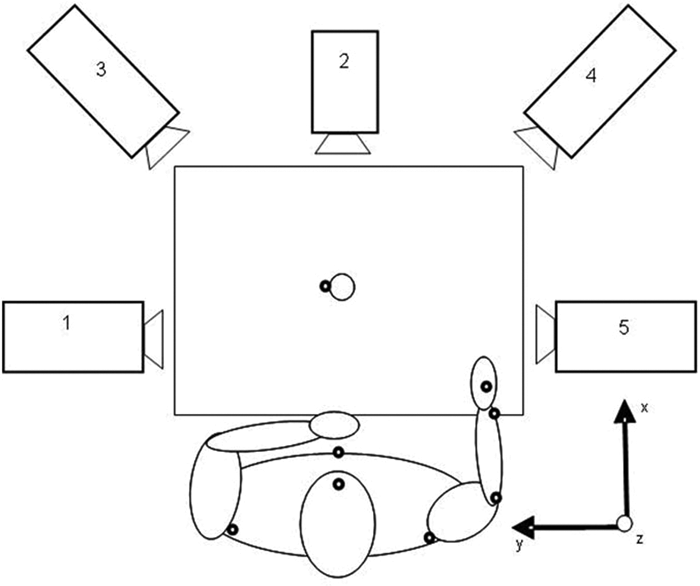
View from above of the setup for the drinking task with the 5-camera capture system: the participant is represented with the arm in the initial position, and marker sites are shown as black dots for the capture of right arm
The drinking task included reaching, grasping, and lifting the glass from the table and taking a drink (one sip); placing the glass back on the table behind a marked line; and returning to the initial position. Participants were instructed to sit against the chair back during the whole task, but the sitting position was not restrained, and compensatory movements were allowed if needed. All participants performed the drinking task starting randomly with their right or left arm. Participants practiced the drinking task a few times. They were instructed to initiate the drinking task at a comfortable self-paced speed after the test leader had announced, “you can start now.” Five trials of the task were recorded, but for statistical calculations, the mean of 3 middle trials was used.
Three-dimensional motion analysis was performed with a 5-camera optoelectronic ProReflex Motion Capture System (MCU240 Hz, Qualisys AB, Sweden). The 3-dimensional coordinate positions of the markers are calculated instantly in camera units with high spatial resolution 26 throughout the measured movement. The system was calibrated prior to every measurement session. 26 The data were collected automatically by Qualisys Track Manager, 2.0. The capture data were transferred to MATLAB (The MathWorks Inc) software for custom-made analysis. The data were filtered with a 6-Hz second-order Butterworth filter in both forward and reverse directions, resulting in zero-phase distortion and fourth-order filtering.
The drinking task was broken down into 5 logical phases: reaching for the glass, forward transport of the glass to the mouth, drinking, back transport of the glass to the table, and returning the hand to the initial position. The selection of kinematic variables and data analysis calculations were based on our earlier study. 12 Movement onset was defined as the time when the tangential velocity of the hand marker exceeded 2% of the maximum velocity in the reaching phase. Movement offset was detected when the velocity of the hand was less than 2% of the maximum velocity in the returning phase. Start of forward transport phase was defined as the time when the tangential velocity of the glass exceeded 15 mm/s. The drinking phase was identified by a 15% increase or decrease of the steady-state distance between the face and glass marker. The start of the returning phase was defined as the time when the tangential velocity of the glass was under 10 mm/s.
Kinematic Variables
The absolute and relative movement times were calculated separately for each phase and for the entire movement. The peak tangential velocity of the hand (PV) was calculated for the reaching phase with regard to the global coordinate system and combined both the arm and trunk movements. To describe the movement strategy in reaching, the time and percentage of time to peak hand velocity (TPV, TPV%) were obtained. To describe the initial movement effort in reaching, the first velocity peak was identified, and the time and percentage of time to the first peak (T1P, T1P%) were calculated. Peak angular velocity of the elbow joint was computed from the angular data for the reaching phase.
Smoothness of movement was quantified by computing the number of movement units (NMUs) during the reaching and forward transport phases. To define a movement unit, the tangential velocity profile of the hand was searched for local minima and maxima. A difference between a minimum and next maximum velocity value that exceeded the amplitude limit of 20 mm/s signified a velocity peak. The time between 2 subsequent peaks had to be at least 150 milliseconds. Those peaks reflect repetitive acceleration and deceleration during reaching and correspond to movement smoothness and efficiency. 14
Angular joint motions were computed from the 3D position data for elbow flexion/extension, shoulder flexion/extension in the sagittal plane, and abduction/adduction in the frontal plane. The relative elbow angle was determined by the angle between the vectors joining elbow and wrist markers and the elbow and shoulder markers, and the shoulder angle by the angle between the vectors joining the shoulder and elbow markers and the vertical vector from the shoulder marker toward the hip. Joint angles were calculated for maximal elbow extension and shoulder flexion during reaching as well for maximal shoulder abduction and flexion during drinking. Compensatory trunk movement was computed for the entire drinking task as the maximal displacement of the thorax marker from the initial position.
Interjoint coordination (IJC) between the shoulder and elbow joint angles was characterized both qualitatively and quantitatively in this study. Angle/angle diagrams were plotted for shoulder flexion and elbow extension in the reaching phase. The temporal IJC for shoulder flexion and elbow extension was computed using cross-correlation analysis of zero time lag. 27,28 A correlation coefficient closer to 1.0 indicates stronger correlation and indicates that joint motion of the 2 joints is tightly coupled.
Statistical Analysis
Statistical analyses were performed with SPSS (Statistical Packages for Social Sciences, 16.0, SPSS Inc, Chicago, IL). In the analysis of kinematic data, a mean of 3 recordings were used in statistical calculations. Kinematic data were explored quantitatively using factor analysis. Principal components analysis (PCA) with varimax rotation based on the correlation matrix was used to make informed decisions on reducing the number of kinematic variables while retaining as many variables as needed to describe performance. PCA gives the number of variables (components) that are needed in order to capture most of the variance in the original kinematic data set. The determination of the specific variables that are to be extracted is both a statistical and qualitative decision of the researcher. The correlation matrix was examined to see which kinematic variables clustered together in a meaningful way and may measure aspects of the same underlying dimension (factor). Extraction of components was made according to Kaiser’s criterion; thus, the variables with loading values greater than 0.6 were extracted from the rotated component matrix. 29
In comparisons between the dominant and nondominant arm in healthy participants, the paired-sample t test or Wilcoxon’s signed ranks test was used, depending on the data distribution. Comparisons between participants with stroke and healthy participants were made with the independent-samples t test or Mann-Whitney U Test. A significance level of .05 was used for all tests. Mean difference, standard deviation (SD), and confidence intervals of difference were studied to evaluate if they were clinically meaningful. The partial η2 statistics was used to calculate the effect sizes of differences between groups. Cohen’s guidelines for interpreting the effect sizes are as follows: 0.01 = small; 0.06 = moderate; and 0.14 = large effect. 30
Results
There were no significant differences in age, weight, height, and arm length between participants with stroke and healthy participants. The differences between dominant and nondominant upper extremities in healthy participants were not significant except in peak hand velocity, which was higher for reaching with the dominant arm. The nondominant arm was chosen for healthy participants’ group statistics because this put the participants with hemiparesis in the nondominant arm at less of a comparative disadvantage.
Exploring Kinematic Data
A total of 19 kinematic variables were included in the PCA. The analysis of scree plots showed 2 major factors (dimensions) in the data set. The varimax rotation revealed the presence of 5 components with eigenvalues exceeding 1, explaining together 86% of the total variance. Using Kaiser’s criterion, 13 variables were extracted from the rotated component matrix. Trunk displacement had an item value of 0.57 but was also extracted because of the clinical importance. 17,24 All extracted variables are listed in Table 2.
Mean Values and Standard Deviations for the Kinematic Variables During the Drinking Task for All Participants
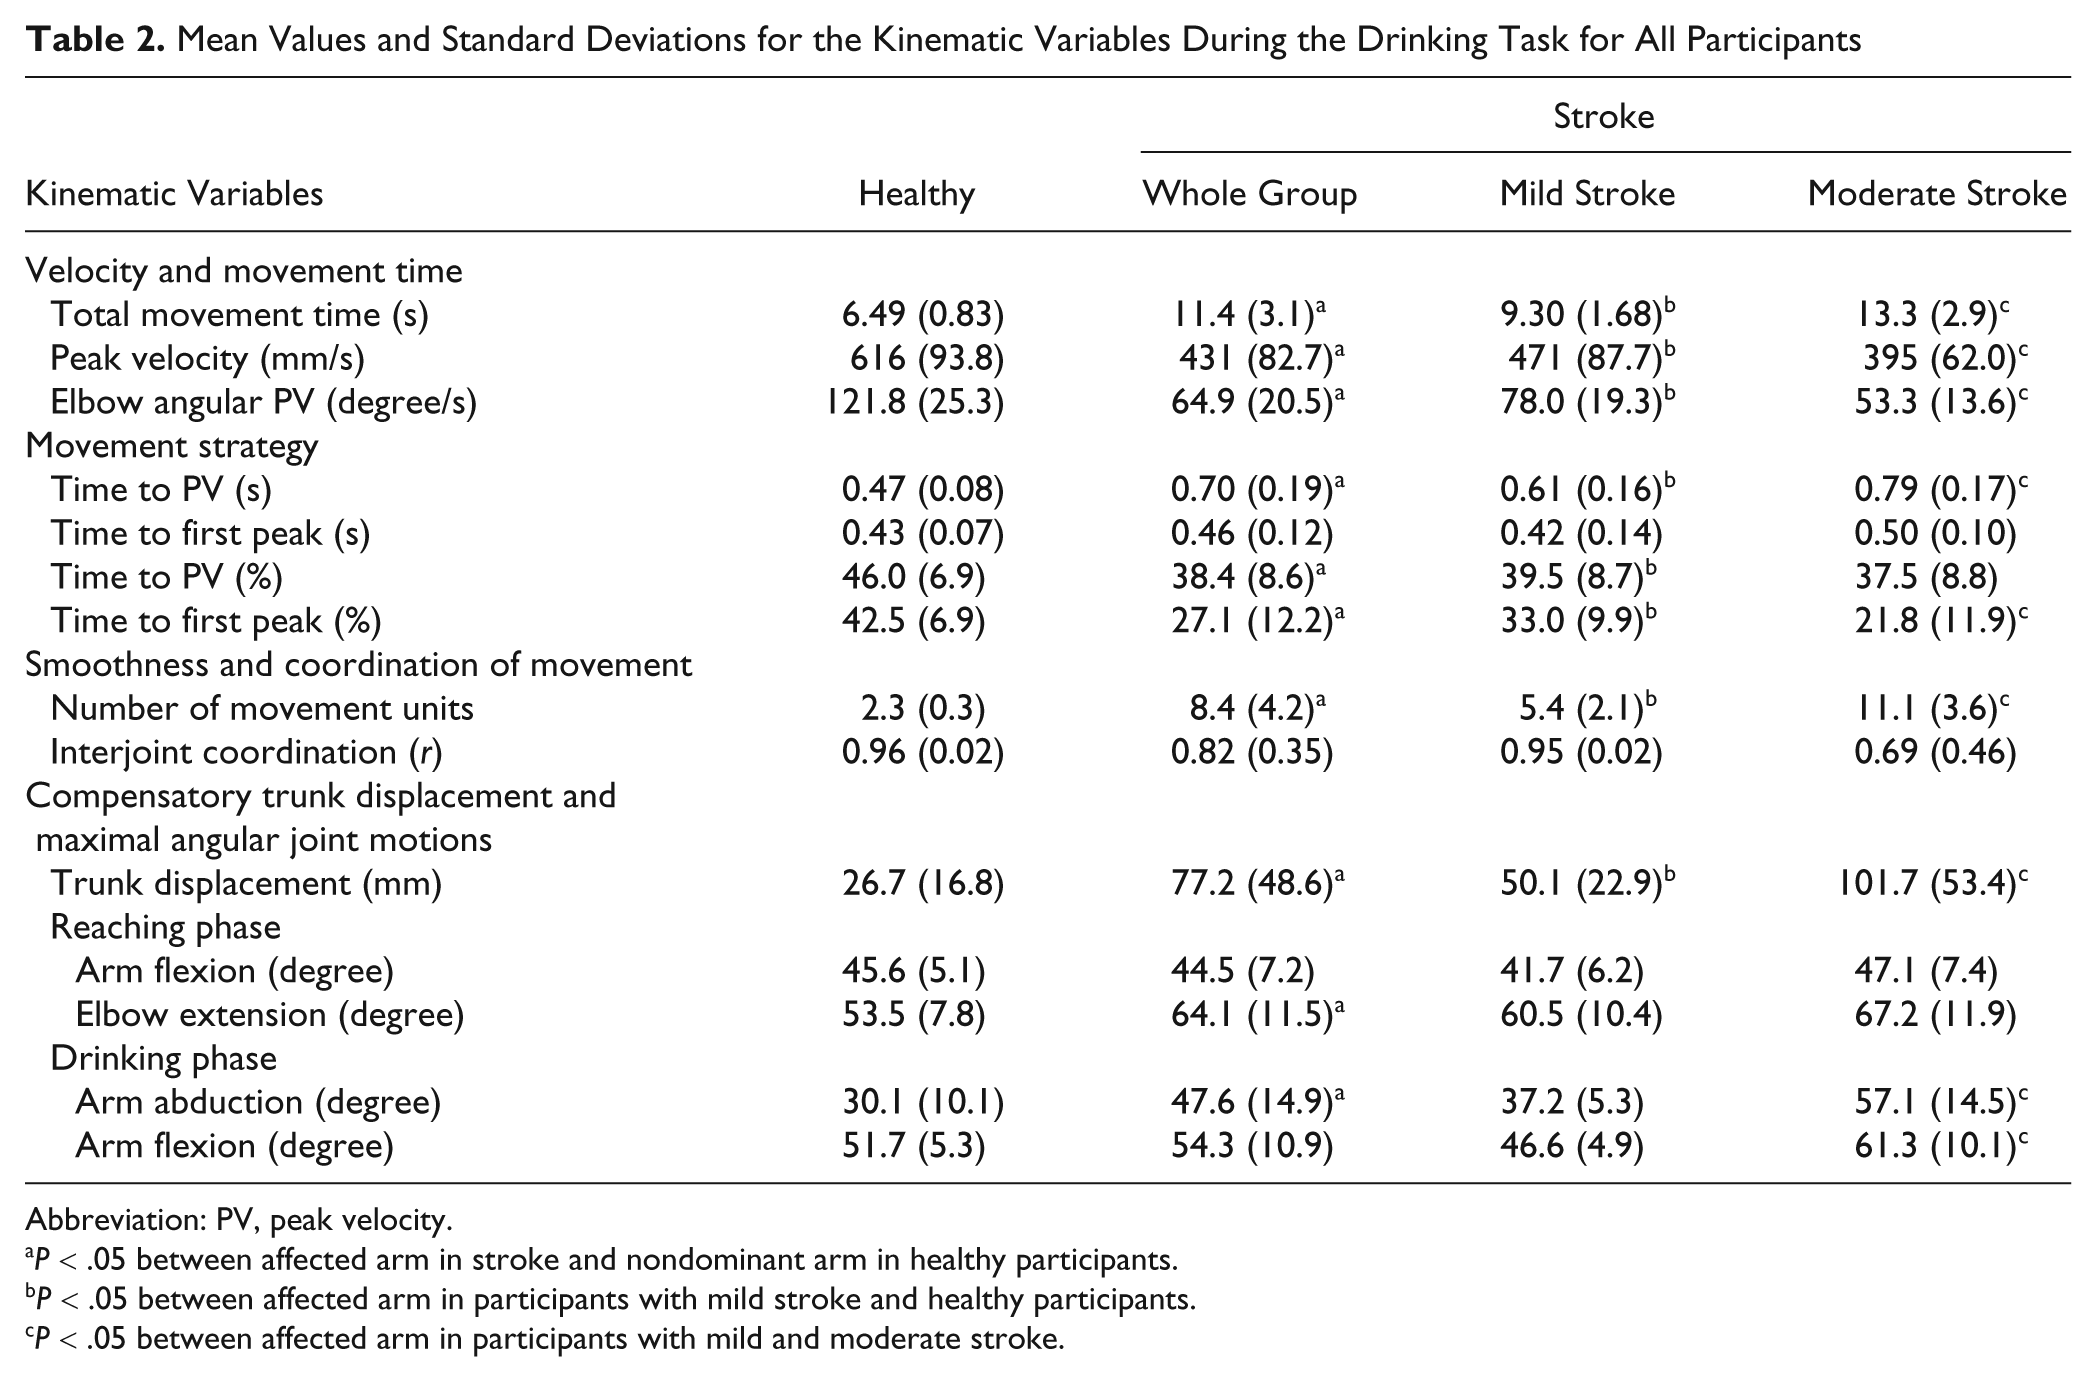
Abbreviation: PV, peak velocity.
P < .05 between affected arm in stroke and nondominant arm in healthy participants.
P < .05 between affected arm in participants with mild stroke and healthy participants.
P < .05 between affected arm in participants with mild and moderate stroke.
Inspection of the correlation matrix showed that total movement time (TMT) correlated strongly (r > 0.9) with time spent in different movement phases except for the drinking phase (r = 0.7). This means that TMT could be sufficient to evaluate the movement speed in healthy participants and those with stroke. NMU correlated very highly with TMT (r = 0.92) indicating that those with longer movement times show higher NMUs. Accordingly, the movement time and smoothness appeared to measure aspects of the same underlying dimension and together with measures of movement velocities composed one of the major factors. The second major factor in the original data consisted of compensatory movement patterns and IJC.
Movement Times
Stroke patients had significantly slower movement times in every phase and for the whole task (mean difference = 4.9 s; P < .001; η2 = 0.54). Differences in TMT were also significant between the moderate and mild stroke impairment groups (mean difference 3.9 s; P = .002; η2 = 0.44). The mean values and SDs for the kinematic variables are displayed in Table 2. Sensitivity and specificity for TMT were 94.7% and 82.6%, respectively, with a cutoff value at 7.32 s (mean + SD for healthy participants).
The relative time spent in every movement phase showed no significant differences between participants with stroke and healthy participants. This reveals that even if participants with stroke had slower movement times totally and in all phases, the sequencing of movement parts during drinking was not strongly influenced by stroke impairment in our cohort.
Movement Velocity and Strategy
The tangential velocity profiles in healthy participants were continuous, smooth, and bell shaped, with 1 predominant peak. Stroke patients, on the other hand, demonstrated oscillatory velocity profiles with multiple peaks (Figure 2).
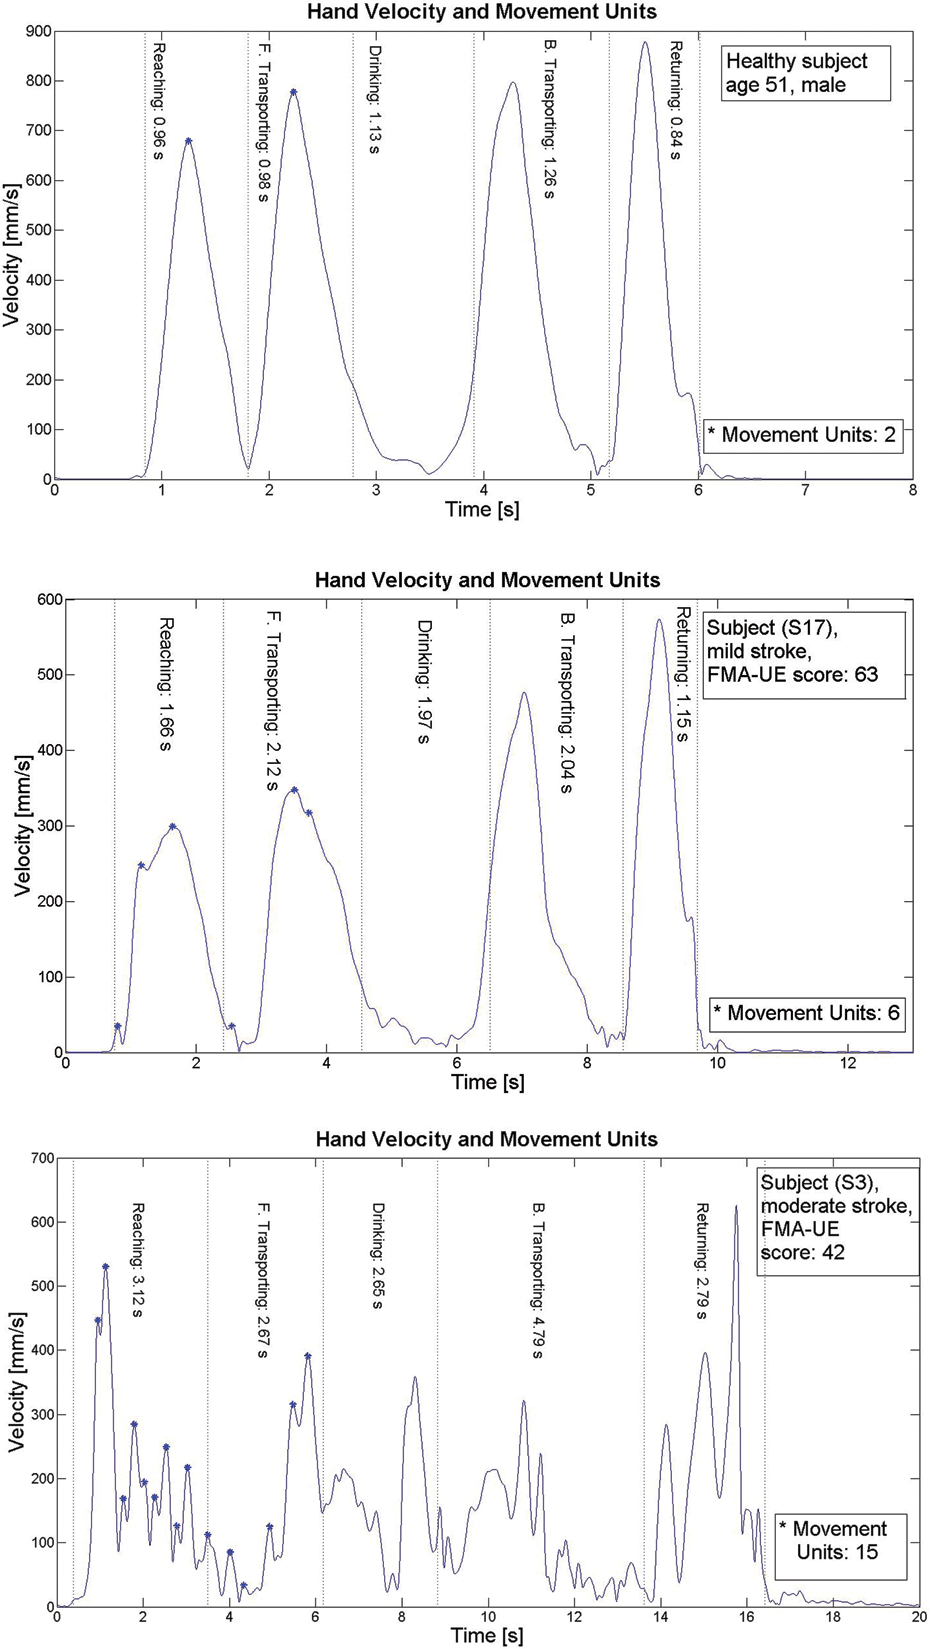
Velocity profiles of the drinking task for a healthy participant and for those with stroke with mild and moderate impairment levels
Stroke patients had significantly lower peak velocities (mean difference = 185 mm/s; P < .001; η2 = 0.54) and lower peak elbow angular velocities (mean difference = 56.8mm/s; P < .001; η2 =0.62) during reaching. The mean difference between moderate and mild stroke for PV was 75.5 mm/s (P = .043; η2 = 0.22), and for peak angular velocity of the elbow joint, it was 24.7 mm/s (P = .005; η2 = 0.38). Sensitivity and specificity for velocity measures were more than 94.7% (cutoff value calculated as mean minus SD of healthy participants).
The absolute TPV was significantly longer for stroke patients because of generally slower absolute movement times. The relative time to peak velocity (TPV%) was shorter (mean difference = 7.6%; P = .005; η2 = 0.20), indicating that stroke patients spend a relatively longer time in the deceleration phase. The initial movement effort (T1P%) was also shorter in stroke patients (mean difference = 15.4%; P < .001; η2 = 0.39). A significant difference was also found between mild and moderate stroke impairment groups for T1P% (mean difference = 11.2%; P = .41; η2 = 0.22) but not for TPV% (mean difference = 2.0%; P = .62; η2 = 0.01).
Smoothness of Movement: Number of Movement Units
Movement units were computed for 2 first-movement phases in the drinking task, which means that the minimum value was at least 2 units (Figure 2). The NMU ranged from 2 to 3 in healthy participants and from 3 to 15 in stroke patients (mean difference = 6.1; P < .001, η2 = 0.54). In the moderate stroke group, the NMU varied between 5.0 and 15.0, and in those with mild stroke from 3.3 to 8.7 (mean difference = 5.7; P < .001; η2 = 0.49), and the high effect size value indicated that NMU could differentiate between the 2 impairment levels. Sensitivity and specificity for NMU were 100% and 94.7%, respectively, with a cutoff value at 2.6 (mean + SD for healthy participants).
Angular Joint Motions and Compensatory Trunk Displacement
Stroke patients had a larger shoulder abduction angle during the drinking phase (mean difference = 17.6°; P < .001; η2 = 0.33), and the maximal elbow extension was less during reaching (mean difference = 10.6°; P = .002; η2 = 0.24). There was also a significant difference in shoulder abduction between moderate and mild stroke groups (mean difference = 19.9°; P = .001; η2 = 0.47). The maximum elbow extension in reaching was also smaller in the moderate group compared to the mild, but the difference was not significant (mean difference = 6.7°; P = .21; η2 = 0.09; Table 2).
Stroke patients used considerably larger forward trunk displacements compared with controls (mean difference = 50.5 mm; P = .001; η2 = 0.34), and the mean difference between the moderate and mild stroke groups was 51.6 mm (P = .016; η2 = 0.30).
Interjoint Coordination
Angle–angle graphs for the reaching phase were smooth and continuous, forming an almost straight line between elbow and shoulder joint excursions in healthy participants. Stroke patients with low IJC demonstrated problems in moving shoulder and elbow joints simultaneously in a continuous movement (Figure 3).
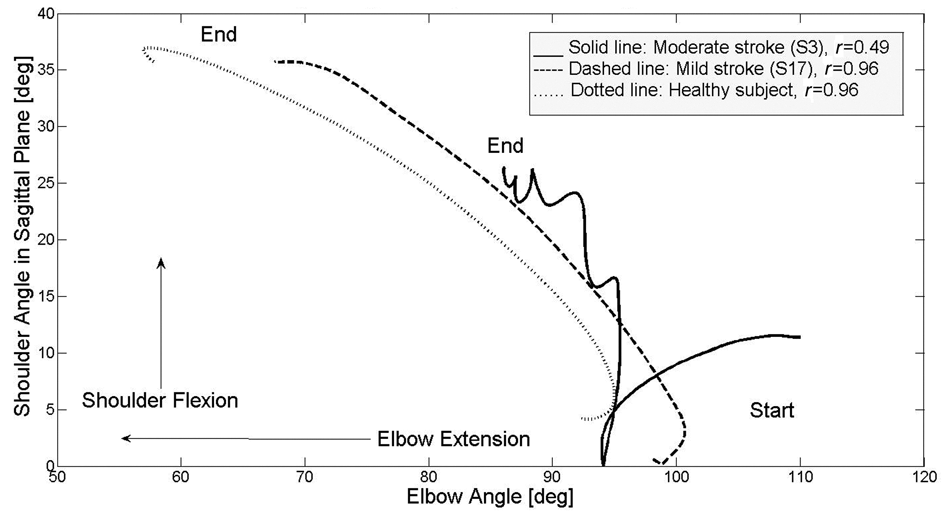
Angle/angle graph showing interjoint coordination between shoulder flexion and elbow extension in the reaching phase for a healthy participant and for those with mild and moderate poststroke impairment; correlation coefficient (r) of joint angle data is also displayed
Cross-correlation between shoulder and elbow joint angles ranged from 0.89 to 0.99 in healthy participants and from 0.51 to 0.98 in stroke patients (mean difference = 0.14; P = .84; η2 = 0.008). The mean difference between the moderate and mild stroke group was 0.25 (P = .117; η2 = 0.14). Four participants with moderate stroke impairment (S3, S7, S1, S5) had distinctly lower correlation values (0.49, 0.51, 0.62, 0.68), whereas the rest had IJC values ranging from 0.89 to 0.99, comparable with those of healthy participants.
Discussion
This study provides an objective method to evaluate the motor function of the upper extremity in those with moderate and mild arm impairment after stroke (FMA-UE scores more than 39). The majority of the kinematic variables showed significant differences between stroke patients and healthy participants and between mild and moderate stroke impairment levels. Our results demonstrated that the NMUs, TMT, and peak angular velocity of the elbow had the strongest ability to discriminate between healthy participants and those with stroke as well as between the different stroke impairment levels. Compensatory movements, such as forward trunk displacement during reaching and the higher elevation angle in the shoulder joint during drinking, also discriminated between moderate and mild stroke impairment.
Only a few studies have examined kinematic characteristics closely, 27 and there is no consensus among the researchers as to which kinematic parameters are to be preferred for evaluation of motor performance in stroke patients. At the same time, kinematic analyses are increasingly being used in clinical research as discriminative or evaluative measures. This reveals the need to quantify the specific kinematic parameters that provide reliable and valid information about movement characteristics in stroke patients. Our results from PCA revealed that the drinking task can for the most part be described with 2 major factors. Therefore, the analysis of this purposeful upper-extremity task should include variables from both factors, that is, variables describing movement time, smoothness, or velocity, as well as variables describing compensatory movement patterns or IJC. This information can provide some guidance to researchers in choosing kinematic variables as outcome measures for clinical studies. To our knowledge, this information has not been reported earlier in kinematical studies.
The smoothness of movement, quantified as NMUs, showed the strongest ability to discriminate movement quality. Comparable results were reported in a study examining reaching in children with spastic cerebral palsy. 31 In our study, we calculated movement units during the reaching phase as well during transport of the glass toward the mouth. These 2 phases correspond to 2 different constraints of a purposeful movement and can accordingly reflect the different movement deficits in stroke patients. This information can be helpful in planning individual treatment programs as well as for evaluation of the treatment effects. In this study, NMU also correlated strongly with movement time. The same observation was made in a study that examined reaching in children with spastic paresis. 31 This information supports the concept that movement time can provide indirect information about movement qualities like smoothness and efficacy, and timed testing in clinical practice should not be underestimated.
We found significantly larger compensatory trunk displacements in stroke patients. Similar results have been reported in earlier studies in reaching for targets close to the body. 20,24 Trunk displacement has been reported to have a significant correlation with stroke impairment severity. 17 This was confirmed in our study: a significant difference was found between participants with moderate versus mild stroke impairment levels. Thus, compensatory trunk movements should be considered as an essential part of movement patterns after stroke and included in evaluation models.
The shape of the velocity profile and the location of the peak indicate the strategy used in reaching. The preplanned, goal-directed movement is efficient when peak velocity is achieved around 40% to 50% of the reaching time. 32 In this study, healthy participants achieved peak velocity at approximately 46% and stroke patients at 38.4% of the reaching time. As in other studies, this means that stroke patients spend a longer time in the deceleration phase indicating the altered feed-forward and feedback control. 4,32,33 As in prior reports, our healthy participants demonstrated single peak velocity profiles, whereas stroke patients demonstrated the presence of multiple velocity peaks. 14,16,33,34
Prior studies showed that IJC between the shoulder and elbow joint during pointing movements is decreased after stroke, particularly in those with more severe impairment and with spasticity. 13,15,17,35 These studies suggest that IJC can provide beneficial information about movement deficits after stroke. In this study, the IJC was determined between shoulder flexion and elbow extension in reaching and showed that coupling between respective joint angles was reduced in stroke patients compared with healthy participants, but this difference was not significant. In a more detailed analysis, 4 stroke patients showed distinctly lower values of IJC. All 4 had moderate stroke impairment, and 3 of them had spasticity. The rest of the stroke patients had correlation values and angle/angle graphs rather similar to those of the healthy participants. To confirm the relationship between spasticity, impairment level, and reduced IJC, further studies with larger numbers of participants and, perhaps, a cohort of more impaired participants are needed.
The results of this study confirm that the use of single marker measurements combined with a subset of the kinematic analysis can differentiate between impairment levels after stroke. This is one measurement approach, and more detailed analysis may provide greater differentiation or suggest simpler measurement methods and models for more efficient clinical implementation. As marker triads were not used, axial rotations could not be measured, which is a known limitation of this approach.
The clinical relevance of the method used in this study requires additional assessment to investigate the relation between kinematics and clinical measures. The analysis of a purposeful activity from real life, however, increases the ecological validity of the study.
In conclusion, there are many possible kinematic variables that can be calculated to analyze the motor function of the upper extremity. We determined that the movement smoothness, movement time, and the peak elbow angular velocity clearly differentiated participants with deficits in motor performance and discriminated between mild and moderate arm impairment levels after stroke.
Footnotes
Acknowledgements
Thanks to all study participants for their valuable contribution and helpful staff at Sahlgrenska University Hospital. Thanks to Dr Steve Murphy for valuable discussions and software programming for kinematic data.
The author(s) declared no potential conflicts of interest with respect to the authorship and/or publication of this article.
The author(s) disclosed receipt of the following financial support for the research and/or authorship of this article: this study was supported by grants from FoU-rådet for Göteborg and Södra Bohuslän (VGFOUGSB-6339); Norrbacka-Eugenia Foundation (802/08); Hjalmar Svensson’s Research Foundation; Reneé Eanders Foundation; Health and Medical Care Committee of the regional Västra Götaland; Greta and Einar Askers Foundation; and Swedish Stroke Association.