
Abstract
Background. The extent to which pharmaceutical and behavioral therapies following central nervous system injury may either deter or encourage the development of compensatory movement patterns is a topic of considerable interest in neurorehabilitation. However, functional outcome measures alone are relatively insensitive to compensatory changes in movement patterns per se. Objective. This study used both functional outcome measures and kinematic analysis of forelimb movements to examine the effects of human adult bone marrow–derived somatic cells (hABM-SCs) on motor recovery in a rat model of stroke. Methods. Adult male Long–Evans black-hooded rats (n = 12) were trained in a forelimb reaching task and then underwent surgical middle cerebral artery occlusion, producing a stroke that impaired the trained paw. One week poststroke, animals were randomly assigned to either a hABM-SC injection or control injection group. Reaching behaviors were then compared at baseline and at 10 weeks poststroke. Results. Both groups improved their outcome scores during the 10-week recovery period. However, the hABM-SC group recovered significantly more function than controls in terms of the number of pellets retrieved. Furthermore, the control group appeared to improve their functional performance by using compensatory strategies that involved an increased number of trajectory adjustments, whereas the hABM-SC group’s kinematics more closely resembled prestroke movement patterns. Conclusions. This study demonstrates that kinematic measures established in stroke research on humans are also sensitive to performance differences prestroke versus poststroke in the rat model, reinforcing the utility of this method to evaluate treatments that may ultimately translate to patient populations.
Introduction
In a rat model of stroke, our laboratory has previously demonstrated that treatment with human adult bone marrow–derived somatic cells (hABM-SCs) leads to functional recovery on a skilled forelimb reaching task. 1 However, the extent to which the observed recovery is due to compensatory movement strategies versus the reestablishment of preinjury movement patterns remains unclear. This ambiguity parallels a larger debate within the clinical literature concerning whether neurorehabilitation should focus on restoring prestroke movement patterns per se or should focus more on the patient’s ability to accomplish functional tasks. 2
When rehabilitation focuses on movement patterns, the emphasis is on restoring specific motions and coordination patterns involved in a wide range of tasks (eg, shoulder flexion). When rehabilitation focuses on functional tasks, the emphasis is on whether the patient is able to achieve behavioral end goals (eg, drinking from a glass), regardless of whether or not compensatory strategies (eg, motor slowing, corrective trajectory adjustments, trunk flexion) are used. Some authors argue that reliance on inappropriate compensatory strategies may be a critical factor limiting recovery.3,4 Others point to the idea that seemingly abnormal motor patterns may actually represent adaptive changes, and as such should not be considered targets for therapeutic correction (for a thorough discussion of this topic, see Latash and Anson’s 1996 target article and invited responses). 5 This debate highlights the need for studies that examine performance measures both at the level of functional outcomes and at the level of movement patterns to fully characterize motor recovery following stroke.
Some poststroke movement abnormalities cannot be detected using clinical error measures but can be captured kinematically. For example, in a study of left-hemisphere stroke patients performing a hand positioning task, correct final positions were associated with degraded kinematics in 35.9% of trials. 6 Similarly, in rodent models of stroke, success scores may be dissociated from the qualitative aspects of movement because of animals’ use of compensatory movements.7-11 Taken together, these findings suggest that both endpoint measures of success and kinematic analyses of movement patterns are required if we are to achieve a more complete understanding of poststroke motor recovery.
To address this point, and to more fully characterize motor recovery following stroke, the purpose of the present research was to extend our previous study 1 by examining the effects of hABM-SCs on motor recovery in a rat model of stroke using both functional outcome measures and kinematic measures of limb trajectory. This dual approach allows us to examine the extent to which recovery reflects the reestablishment of prestroke movement patterns versus the development of compensatory movement strategies.
Materials and Methods
Animals and Approvals
Approval for all procedures was secured from the Institutional Animal Care and Use Committee of Hines VA Hospital. Twelve adult male Long–Evans black-hooded rats (250-300 g, age 8-10 weeks; Harlan, Indianapolis, Indiana) were randomly assigned to 1 of 2 experimental groups: stroke plus injected hABM-SCs (n = 6) or stroke plus injected control vehicle (n = 6). Animals were number-coded and investigators were blinded to treatment groups. Anatomic and behavioral results from some of the animals have been reported previously. 1 A total of 6 animals from our 2008 study are reported upon here (those animals that received intracranial injections of either hABM-SCs or control vehicle). Data from the animals that received intravenous injections have not been previously published.
Task
Animals were trained to perform a skilled forelimb reaching task in a Plexiglas testing chamber with a 1.5 × 3 cm aperture in one wall. The task involved reaching through the aperture for sucrose pellets (45 mg; Bilaney Consultants, Frenchtown, New Jersey) placed 1.5 cm away. Animals were reduced to 90% to 95% of their total body weight and maintained on a restricted diet with water freely available. Animals were trained at the same time each day, Monday through Friday, for up to 2 weeks until they began to show a limb preference (>70% of reaches performed using the same limb) and were able to retrieve 20 pellets using the preferred limb within 5 minutes. Only animals who reached this criterion were included. The study timeline is presented in Figure 1.
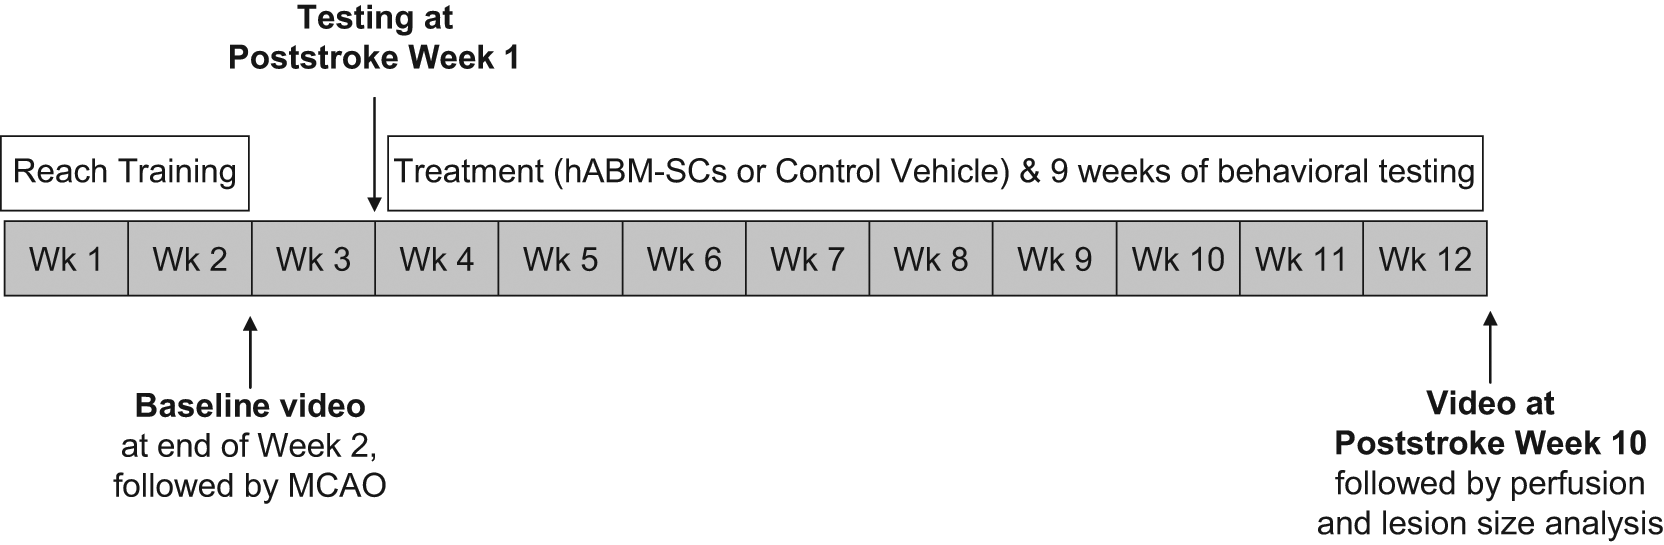
Study timeline: Experimental timeline for task training, stroke surgery, and treatment. Abbreviations: hABM-SCs, human adult bone marrow–derived somatic cells; MCAO, middle cerebral artery occlusion.
Middle Cerebral Artery Occlusion Surgery
Once training was complete, all rats underwent middle cerebral artery occlusion (MCAO) on the side contralateral to the trained forelimb as previously described. 1 In brief, animals were anesthetized with sodium pentobarbital and a burr hole was made to expose the middle cerebral artery, which was then occluded with a 10-0 suture and transected.
hABM-SC Preparation and Injection
One week after MCAO, animals were reanesthetized for hABM-SC injection. Nonhematopoietic (mesenchymal-like) cells were obtained from Garnet Bio Therapeutics, Inc (Malvern, Pennsylvania) and were prepared as previously described. 1 For intravenous delivery, a midline neck incision (approximately 0.5 inches) was made, the jugular vein ipsilateral to the MCAO was exposed, and either 4.5 million hABM-SCs suspended in 0.5 mL of injection vehicle (hABM-SC group) or 0.5 mL of injection vehicle alone (control group) were injected using a syringe with a 27-gauge needle. For intracranial delivery, the scalp flap was reopened and either injection vehicle alone (control group) or a total of 1.5 × 10⁶ cells (hABM-SC group) were injected into 3 sites. Relative to the bregma, injections were located (a) 2 mm anterior, 1 mm lateral, 1.5 mm ventral; (b) 1 mm posterior, 1 mm lateral, 1.5 mm ventral; and (c) 3 mm posterior, 2 mm lateral, 1.5 mm ventral. All animals were immunosuppressed with cyclosporin-A (10 mg/kg, intraperitoneal) daily for 15 days, and thereafter with biweekly injections.
Outcome Scoring
For the purpose of outcome scoring, each testing session was divided into blocks of trials. Each trial began with the placement of 1 pellet onto the platform and ended with the placement of the next pellet. The trial was scored as either successful (if the rat grasped the pellet and brought it to its mouth) or unsuccessful (if the rat dropped the pellet or knocked it out of reach). In each case, a new pellet was placed on the platform, marking the beginning of the next trial. Rats were allowed to continue reaching for up to 5 minutes, but only the first 20 trials in each testing session were scored and are reported here.
Kinematic Analyses
Reaching movements were recorded using a Canon GL2 DV camera sampling at a rate of 30 frames per second (ie, 60 fields per second). Animals were placed in a Plexiglas testing chamber, the floor of which defined the XZ plane for analysis (Figure 2). Relative to the animal, the X dimension was anterior–posterior, the Y dimension was dorsal–ventral, and the Z dimension was medial–lateral. Points on the rat’s limb and testing chamber were digitized from video using Peak Motus motion analysis software (Version 9.0, Peak Performance Technologies, Inc, Englewood, Colorado). Digitized points included the distal-most point of the third phalanx and the upper and lower boundaries of the aperture. Movements were analyzed in the X Y (sagittal) plane as viewed from a lateral perspective, since this plane encompasses the highest magnitude components of the reaching movement and therefore provides the greatest spatial resolution for analysis.
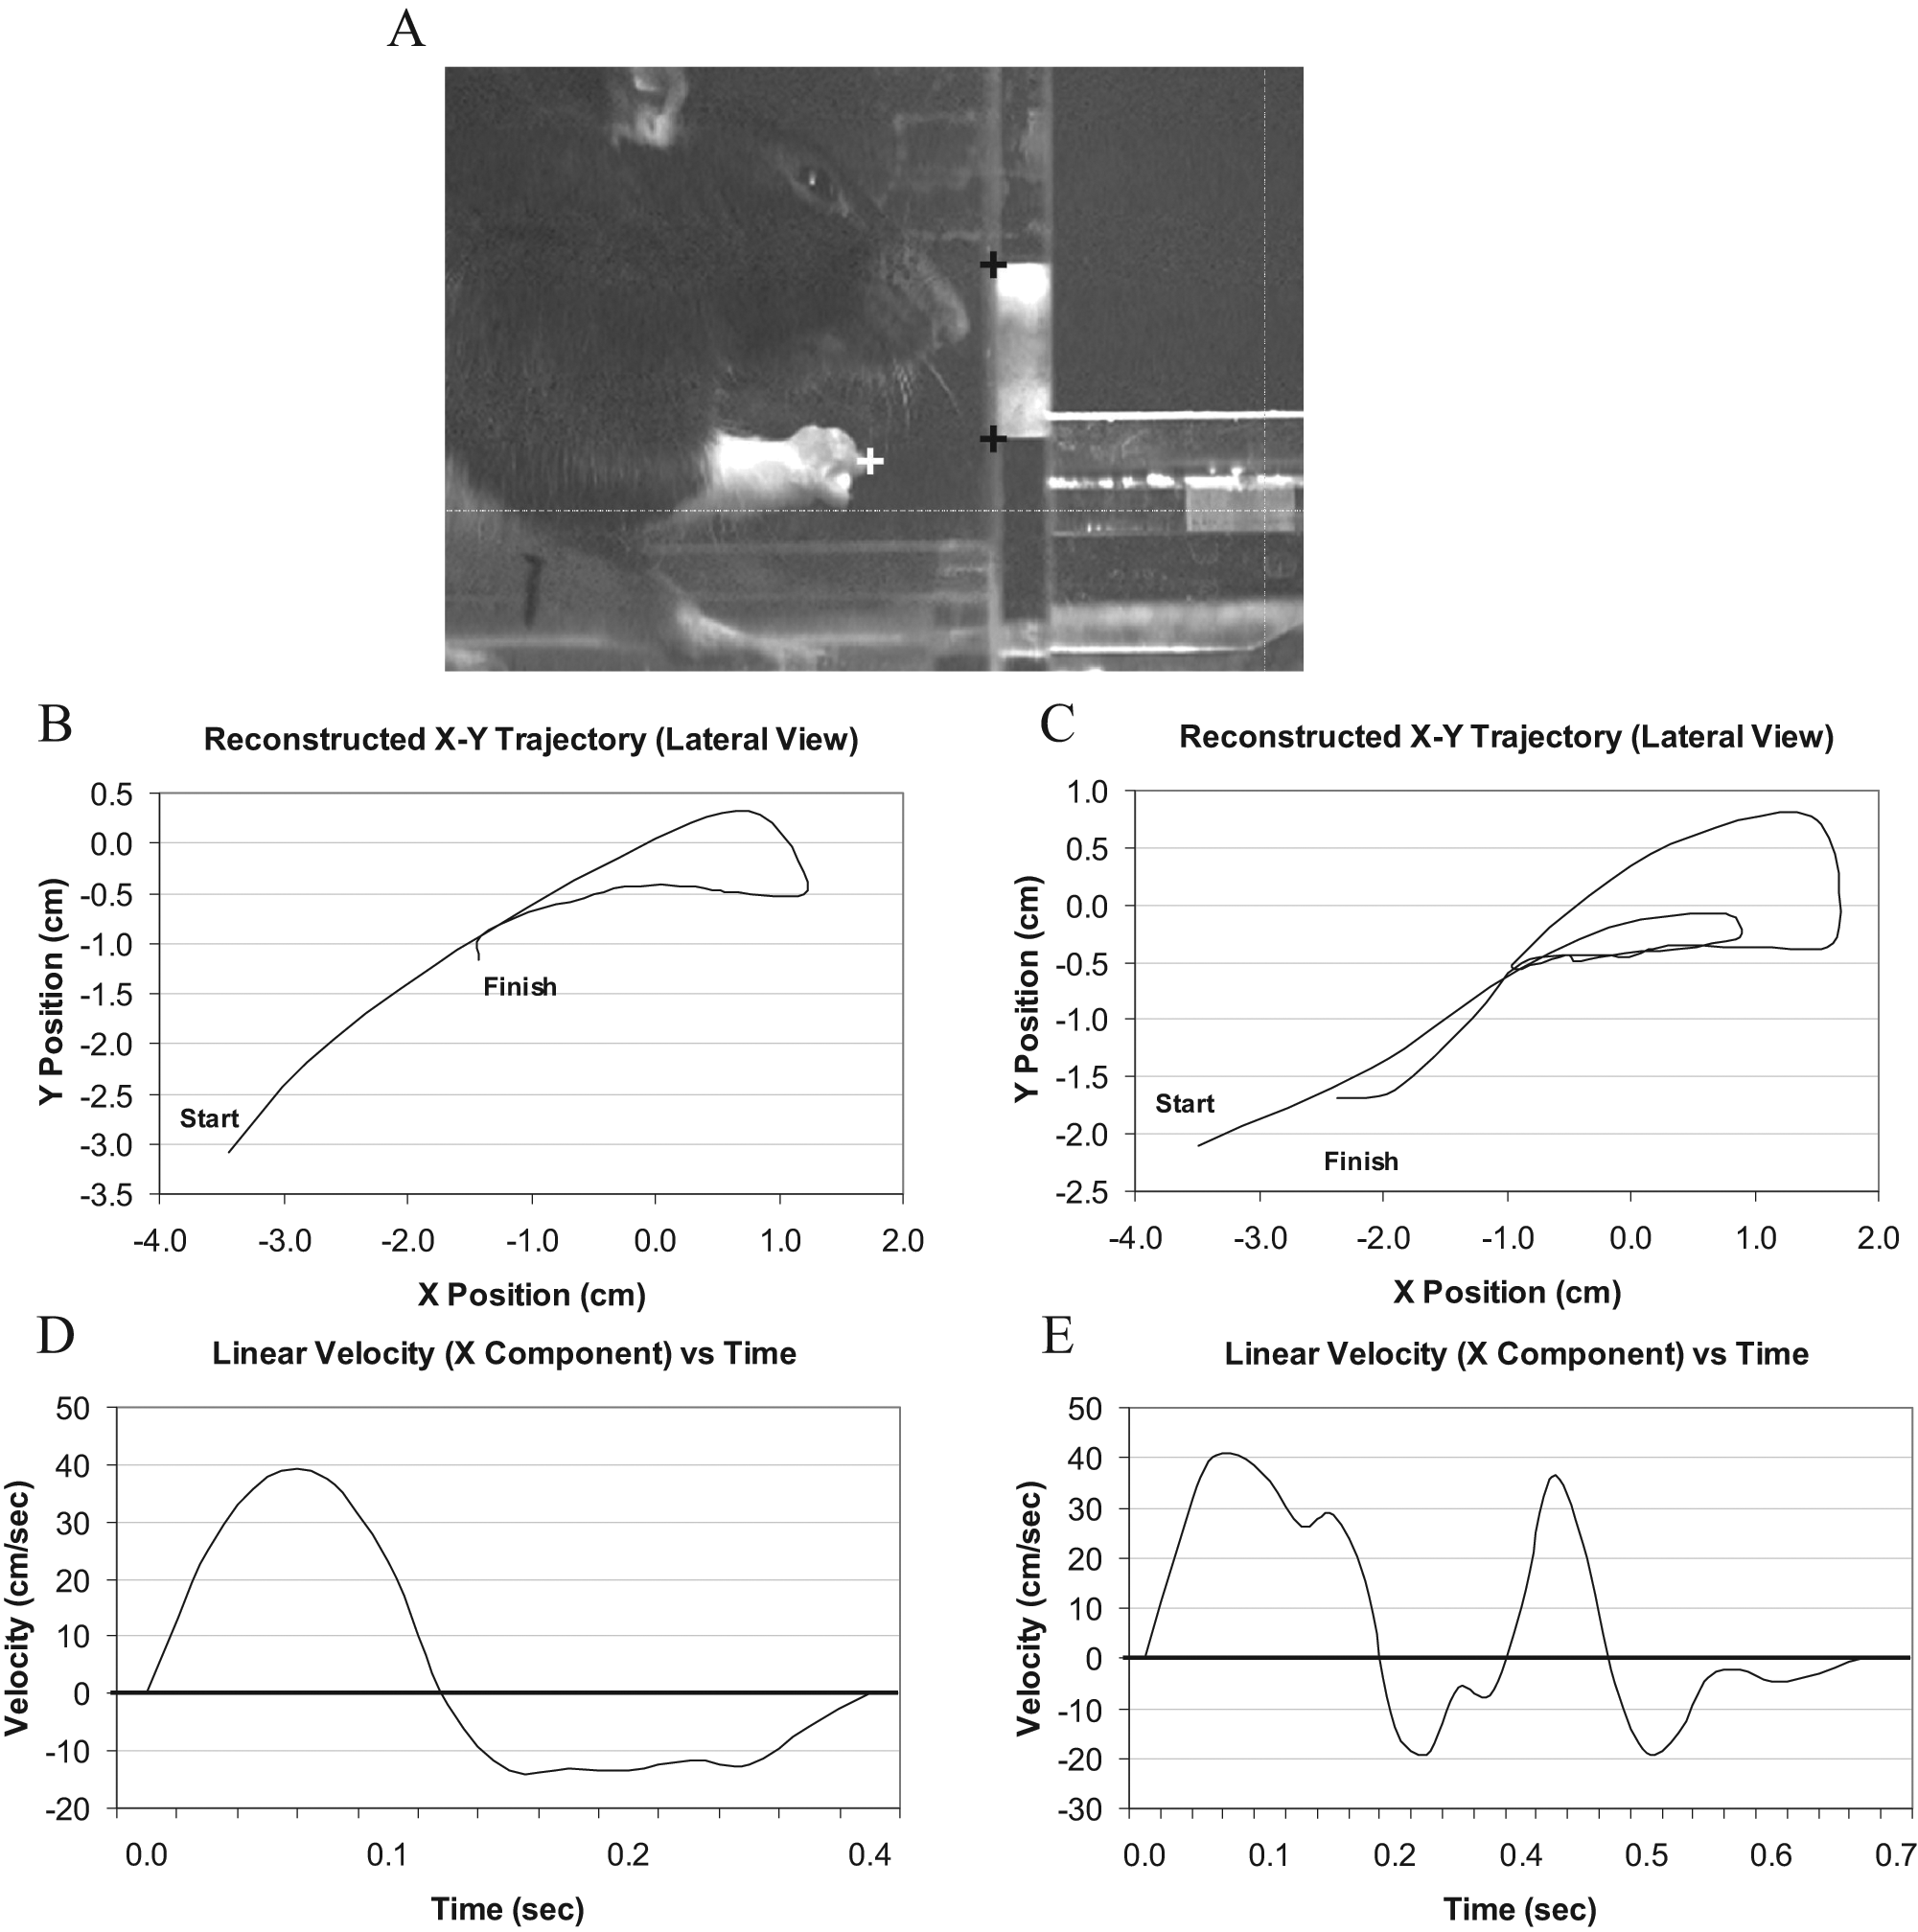
Reaching task and apparatus. A, The skilled forelimb reaching task tests the rat’s ability to reach through an opening and grasp a small food pellet. Black and white crosshairs indicate digitized points on the limb (white) and apparatus (black). B, Reconstructed limb trajectory in the X–Y plane (lateral perspective) for a hABM-SC-treated animal at 10 weeks poststroke, showing a single reach to obtain a pellet. C, Reconstructed limb trajectory for a control animal at 10 weeks poststroke, showing a double reach to obtain a pellet. D, Velocity profile derived from the data presented in B, showing a smooth, bell-shaped trace. E, Velocity profile derived from the data in C, showing a trace with multiple peaks and inflections.
Motion data were processed in Matlab (Version 7.1, Mathworks, Inc, Natick, Massachusetts). X, Y, and Z position data were extracted, and velocities were derived and smoothed in Matlab using a Savitsky–Golay filter (Matlab Signal Processing Toolkit). Custom algorithms in Matlab were applied to determine the number of zero crossings in the velocity profile (“Direction Changes”) and inflections in the velocity profile (ie, zero crossings in the acceleration profile, or “Speed Adjustments”). The sum of Direction Changes and Speed Adjustments was then computed to yield “Net Trajectory Adjustments.”
For the purpose of kinematic analysis, only those portions of each trial where the rat was actively reaching for or retrieving a pellet were digitized. This analysis window was defined as beginning when the rat had lifted its paw with digits closed into the “aiming” position described previously by Whishaw et al 12 and ending when either (a) the pellet was brought to the mouth or (b) when the next pellet was placed on the shelf. Thus, a single analysis window might include multiple reaching attempts directed to a single pellet. The number of pellets retrieved was expressed as a percentage of the number of pellets presented (the “Success Percentage”).
Determination of Stroke Size
To determine the size of the lesion produced by the MCAO surgery, at the conclusion of behavioral testing animals were sacrificed, their brains were removed, and lesion volume analysis was performed using methods as previously described by Papadopoulos et al. 13 The total area of the intact contralateral hemisphere minus the total area of the intact ipsilateral hemisphere was multiplied by the total distance between sections. Stroke size was expressed as a percentage of the intact contralateral hemispheric volume.
Statistics
Data were analyzed using SPSS for Windows, version 16.0 (IBM SPSS, Chicago, Illinois). Comparisons within groups over time were conducted using paired-samples t tests or repeated-measures analysis of variance (ANOVA) with follow-up Bonferroni tests where appropriate. Pairwise comparisons between groups were conducted using independent samples t tests or, in cases where assumptions of normality or equal variance were not met, Mann–Whitney U tests. Differences were considered significant at P < .05. All data are represented as means ± standard error of the mean (mean ± SEM).
Results
No Effect of Injection Route on Behavioral Measures or Lesion Size
Repeated-measures ANOVAs were conducted within each treatment group (using Time as the within-subjects factor and Injection Route as the between-subjects factor) to examine any potential effects of injection route on behavioral measures or lesion size. There were no significant Time × Route interaction effects in either treatment group for Success Percentage (hABM-SCs, F(1,2) = 0.19, P > .1; Controls, F(1,2) = 2.83, P > .1) or Net Trajectory Adjustments (hABM-SCs, F(1,1) = 0.48, P > .1; Controls, F(1,1) = 1.00, P > .1). Similarly, independent t tests within each treatment group revealed no significant difference in lesion size between route of injection (hABM-SCs, t(4) = 1.32, P > .1; Controls, t(4) = 1.49, P > .1). Given that no differences in behavioral measures or lesion size were observed on the basis of injection route, data were pooled across injection route within each treatment group for statistical purposes.
hABM-SC and Control Groups Were Equivalent Prior to Treatment
Repeated-measures ANOVAs were then conducted to examine the effects of treatment (using Time as the within-subjects factor and Treatment as the between-subjects factor). There were significant interaction effects of Treatment × Time for both Success Percentage, F (1, 2) = 19.3, P < .001, and Net Trajectory Adjustments, F (1, 1) = 8.72, P < .05. Further pairwise comparisons showed that the treatment groups were equivalent prior to receiving injections: Bonferroni t tests on the data obtained at baseline revealed no between-groups differences for Success Percentage, t(10) = 0.881, P > .1, or Net Trajectory Adjustments, t(10) = 1.362, P > .1. Likewise at 1 week poststroke, there was no significant difference in Success Percentage: t(10) = 0.896, P > .1. Finally, postmortem analysis of Lesion Size revealed no differences between treatment groups: t(10) = 0.043, P > .1.
hABM-SC-Treated Animals Recovered More Reaching Function Than Controls
In terms of the Success Percentage, both groups were able to improve their scores during the 10-week recovery period (hABM-SCs, 17% poststroke to 76% at week 10; Controls, 23% poststroke to 34% at week 10). However, the hABM-SC group recovered significantly more function than controls: t(10) = 6.111, P < .001. Nonetheless, performance deficits were not totally abolished, and paired t tests showed that at week 10, the Success Percentage for both groups remained significantly lower than at baseline (hABM-SCs, P < .05; Controls, P < .001). These results are depicted graphically in Figure 3.
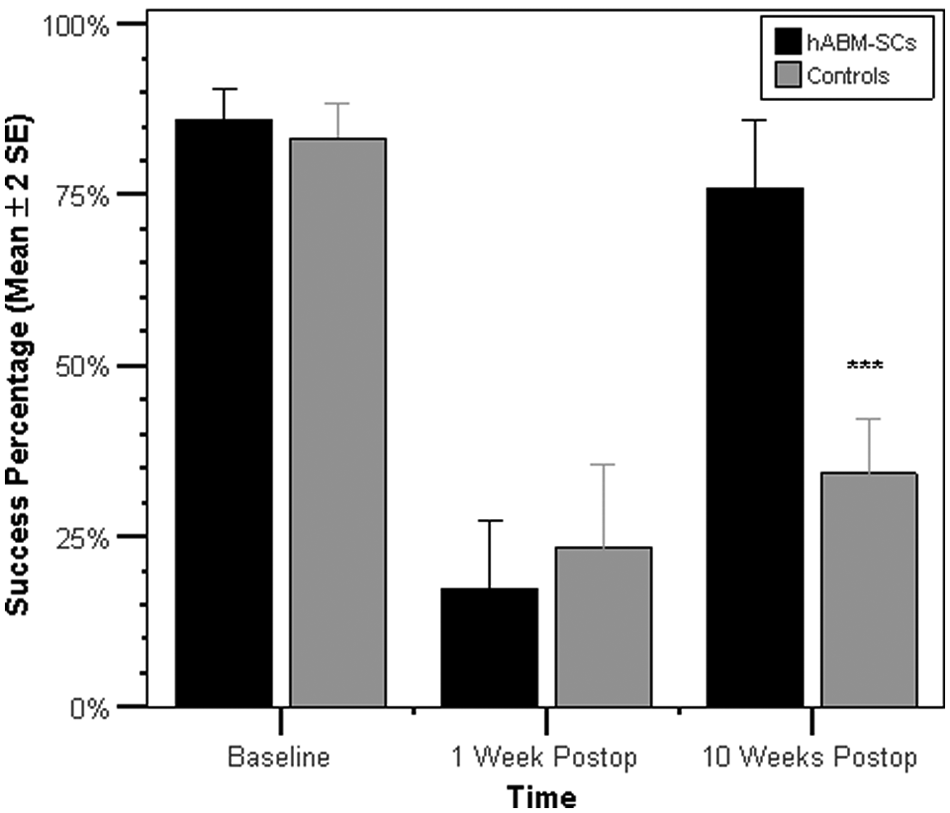
Success Percentage prestroke and poststroke. Both groups improved their Success Percentage scores during the 10-week recovery period. However, the hABM-SC group recovered significantly more function than controls: t(10) = 6.111, P < .001. Nonetheless performance deficits persisted at week 10, where the Success Percentage for both groups remained significantly different from their outcomes scores at baseline (hABM-SCs, P < .05; Controls, P < .001). Asterisks indicate significance value for comparison of hABM-SC versus Controls at 10 weeks postoperatively. *P < .05; **P < .01; ***P < .001. Error bars represent ±2SEM.
hABM-SC Animals Had Fewer Compensatory Trajectory Adjustments Than Controls
We then performed comparisons to determine whether the performance improvements described above were associated with altered kinematics (ie, compensatory movement patterns). On kinematic analysis, the hABM-SC-treated animals showed significantly fewer Net Trajectory Adjustments than controls at 10 weeks poststroke: t(10) = 3.106, P < .01. On further breakdown, this group difference was attributable to both Direction Changes, t(10) = 2.578, P < .05, and Speed Adjustments, t(10) = 2.387, P < .05. Thus, the control group appeared to improve their functional performance by using compensatory strategies that involved an increased number of trajectory adjustments, whereas the hABM-SC group’s kinematics more closely resembled prestroke movement patterns. These findings are depicted graphically in Figure 4.
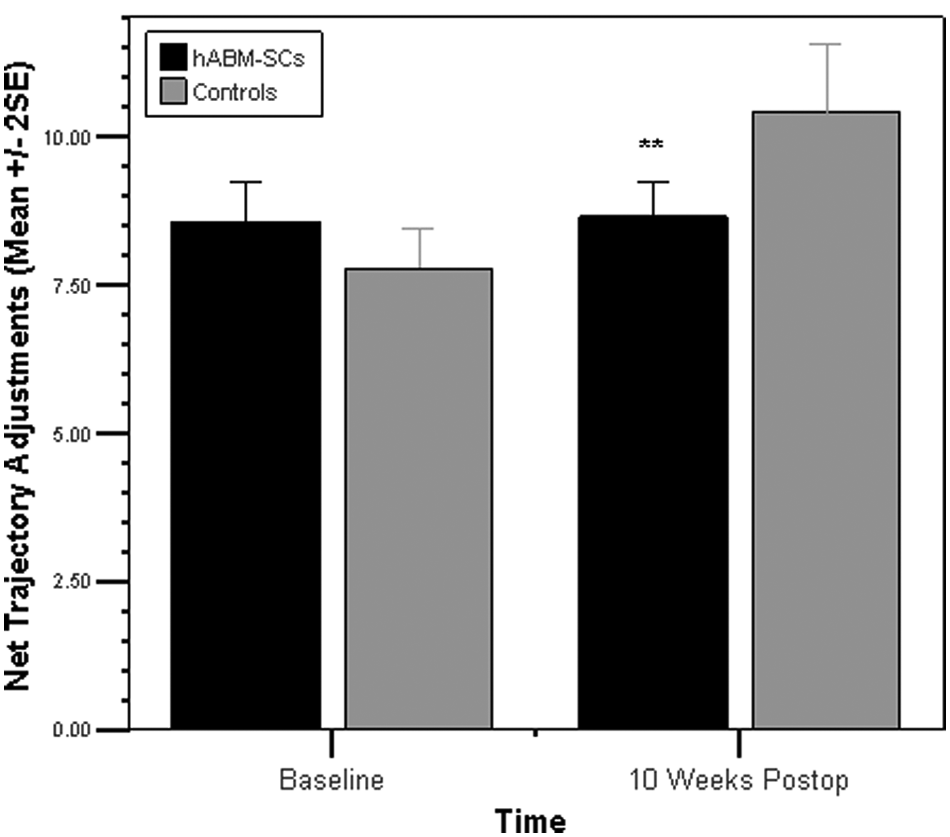
Net Trajectory Adjustments prestroke and poststroke. hABM-SC-treated animals showed significantly fewer Net Trajectory Adjustments than controls at 10 weeks poststroke: t(10) = 3.106, P < .01. On further breakdown, this group difference was attributable to both Direction Changes, t(10) = 2.578, P < .05, and Speed Adjustments, t(10) = 2.387, P < .05 (not depicted). Asterisks indicate significance value for comparison of hABM-SC versus Controls at 10 weeks postoperation. *P < .05; **P < .01; ***P < .001. Error bars represent ±2SEM.
Discussion
hABM-SC Treatment Improves Poststroke Recovery in the Rat
The current results support and extend our previous finding 1 that hABM-SC-treated animals recovered more function than controls in the performance of a skilled forelimb reaching task following stroke. Although both groups were able to improve their reaching performance during the 10-week recovery period, the hABM-SC group recovered significantly more function than controls in terms of the number of pellets successfully retrieved. Furthermore, on kinematic analysis, the control group appeared to improve their functional performance by using compensatory strategies that involved an increased number of trajectory adjustments, whereas the hABM-SC group’s kinematics more closely resembled prestroke movement patterns. The results reported here using nonhematopoietic (mesenchymal-like) hABM-SCs treatment are well aligned with previous reports of gross motor recovery using mesenchymal stem cell treatment poststroke in the rat.14-19
Kinematic Analysis as a Bridge Between Findings in Animal and Human Subjects
Although several previous rodent stroke studies have examined limb position and trajectory as kinematic variables,7,12,20,21 to our knowledge this is the first study to assess velocity and acceleration profiles as measures of stroke recovery in the rat model. This approach has allowed us to discern several parallels with previous reports in the human subjects literature, where poststroke arm movements have been characterized by multiple adjustments and inflections in the velocity profile of the contralesional limb.3,22,23 For example, the velocity profiles of healthy controls performing a pointing task are typically “smooth and bell-shaped,” demonstrating a “single-peaked” velocity profile, whereas those of stroke subjects are often “multipeaked.” 3 Similarly, stroke subjects demonstrate more velocity adjustments in the deceleration phase of a reach-to-target task than controls. 22 Furthermore, stroke subjects’ movements in a reciprocal pointing task may become smoother over the course of therapy, displaying a reduced number of velocity peaks. 23 The findings presented here demonstrate that kinematic measures established in stroke research on humans are also sensitive to performance differences prestroke versus poststroke in the rat model. This fact underscores the utility of this method as a means to evaluate treatments in the rat model that may ultimately translate to patient populations.
Motor Compensation Versus Restoration of Prestroke Movement Patterns
The extent to which pharmaceutical and behavioral therapies following central nervous system (CNS) injury may either deter or encourage the development of compensatory movement patterns is a topic of considerable interest in neurorehabilitation. Since functional outcome measures alone are relatively insensitive to compensatory changes in movement patterns per se, this study used both functional outcome measures and more detailed kinematic movement analysis to examine the effects of treatment on motor recovery. Other researchers have likewise recognized the need for studies that consider both of these aspects of motor recovery, notably the Whishaw group, who have published multiple articles on the topic.7,10,12,20,21 Their methods have involved the use of outcome scores equivalent to the Success Percentage reported here and more qualitative methods to describe movement, such as Eshkol–Wachman Movement Notation (“EWMN”). Their laboratory has also reported on certain kinematic variables, including position and displacement data. Among their main findings on poststroke motor compensation in the rat is the use of shoulder girdle rotation to compensate for the loss of forelimb pronation/supination poststroke.7,9,12,20 Concerning the strengths and limitations of their methodologies, these authors note that although analysis of limb trajectories did reveal differences in the topography of limb movements that could be readily quantified, it could not identify the specific movement impairments underlying those changes. 12 Conversely, EWMN could identify specific movement impairments in terms relationships between body parts in various spatial frames of reference, but was based on the raters’ judgment and thus more difficult to quantify. The authors go on to state that a synthesis derived from these combined measures provides a more complete understanding of the changes in animals’ reaching behavior after stroke.
Following the example set by these investigators, it is important to consider both the strengths and limitations of the measures used in the present study. A strength of this study in terms of its translational potential is the application of methods already established in the human stroke literature, namely limb trajectories and their associated time derivatives (ie, velocity and acceleration). Such analyses typically report on movements of the distal-most point in the kinetic chain, which represents the cumulative effect of the individual movements at each joint within the biomechanical system as a whole. This approach, although elegant in its simplicity, cannot reveal details of the movements that occur at each individual joint, or how those movements may differ from normal. Indeed it is possible that, although the ensemble of actions produced by each joint leads to an apparently normal overall endpoint trajectory, the individual joint actions may nonetheless display deviations from typical biomechanics.
This discussion raises one of the classic problems in motor control: the concept of “redundancy” within the motor system, 24 which essentially states that the musculoskeletal system has a larger number of ways to combine individual joint movements (degrees of freedom) than is necessary to achieve a given motor task. Therefore, the spatial trajectory taken by the endpoint of a limb does not implicate a unique pattern of joint rotations. The fact that the motor system has multiple ways to achieve the same endpoint trajectory makes the question of what constitutes “normal” movement a notoriously difficult one to answer in terms of peripheral joint configurations. Even for healthy subjects, a large degree of variability from one movement repetition to the next is to be expected and indeed is necessary for us to adapt to the constant changes in our physical relationship to the external environment. This has led some motor control theorists to speculate that what is specified by the nervous system in movement execution is not a particular combination of peripheral joint configurations or muscle activations, but rather a more central invariant structure (eg, a temporal pattern of neural impulses that is scaled to account for such variables as initial muscle length and joint position; discussion in Schmidt and Lee 25 and Wolpert and Ghahramani 26 ). This line of theory argues for the importance of quantifying the temporal, and also spatial, characteristics of movement. Thus, the time derivatives of position (eg, velocity and acceleration as reported here) should be considered a useful augment to the spatial methods applied by other investigators of poststroke motor recovery in the rat.
Potential Mechanisms of Neuroplasticity With hABM-SC Therapy Following Stroke
In the present study, hABM-SC therapy following stroke did not result in a decrease in stroke size. This finding is consistent with previous reports using cellular therapies poststroke.14,19,27 The mechanism of recovery, therefore, does not appear to be a result of regeneration of neuronal tissue within the lesion site itself. It is likely that the neuroplasticity of uninjured CNS tissue, rather than the repair of injured tissue, may account for the observed functional improvement. Although not directly examined here, our earlier 2008 study 1 showed that hABM-SC-treated rats had nearly double the number of corticorubral fibers crossing from the intact hemisphere to the denervated red nucleus (parvocellular region). This anatomic measure was furthermore positively correlated with functional outcomes. Thus, in agreement with the observations of other authors studying mesenchymal stem cell therapy, 28 we suggest that such recovery relies on the neuroplasticity of uninjured CNS tissue. The biochemical basis for such neuroplastic effects is likely related to the fact that when mesenchymal stem cells are exposed to injured CNS tissue, they express growth factors important for axonal growth and neuronal survival.15,17,18,29 Similarly, the cells used in the current study are known to express many proregenerative growth factors in vitro, including nerve growth factor, monocyte chemoattractant protein-1, vascular endothelial growth factor, stromal cell–derived factor, stem cell factor, brain-derived neurotrophic factor, and interleukin-6. 30 Although the mechanism for axonal plasticity with mesenchymal stem cell therapy following stroke is not well understood, it is likely that the neuronal growth promoting properties of these cells play an important role.
Limitations
The potential effect of route of injection (intracranial vs intravenous) on motor recovery is an important factor to consider when evaluating the translational value of this line of research. Indeed, prior to undertaking the current analysis, a study designed specifically to examine the effects of route of injection on treatment outcomes had already been completed in our laboratory with n = 9 animals assigned to each of the 4 conditions within an Injection Route × Treatment design. 31 However, the present study was not designed to evaluate such effects. Rather, our aim was to extend our prior research findings by using kinematics to characterize the behavioral differences that we had observed between treatment groups (hABM-SC vs Controls). Based on prior data, our study was designed and powered to evaluate differences between 2 treatment groups with n = 6 per group based on effect sizes of d = 1.28 to 2.20, and an α level of .05. The study was not optimally powered to evaluate differences between 4 groups (ie, an Injection Route × Treatment design, with n = 3 per group). This raises the possibility that there may be an effect of route of injection, which simply could not be detected here (type II error). Nonetheless, on the basis of the aforementioned data from our laboratory, 31 we did not expect groups to differ on the basis of injection route. Thus, we believe that collapsing groups across injection route is justified for the purposes of the analysis presented here.
The question of how well results from rodent models generalize to human populations often arises in the context of translational research. Certainly, the rat as a quadruped, when challenged by neurological or orthopedic injury, has various postural compensations at its disposal that simply are not available to bipeds. Nonetheless, the upper extremity movements of rats and humans are remarkably similar. This point has been previously addressed by Whishaw et al, 32 who conducted a study to compare rat and human reaching movements. Videos of rodent and human movements were subjected to frame-by-frame analysis to evaluate spatial and velocity features, as well as movement characteristics using Eshkol–Wachman notation. Their results showed a surprising degree of similarity between species in terms of movement components, movement sequences, and velocity profiles during reaching, although the human movements showed greater blending of movement components, more variability, and independent digit use. On the basis of the movement similarities discovered, these authors suggest that the extrapolation of findings from rat reaching to human reaching is both useful and justifiable. Our own findings clearly lend further weight to this argument.
Conclusions
In summary, the present findings demonstrate that rats treated with hABM-SCs experienced enhanced motor recovery following stroke as compared to controls. Control animals used compensatory strategies that involved an increased number of trajectory adjustments, whereas the hABM-SC treated group’s kinematics more closely resembled prestroke movement patterns. From a broader perspective, our findings also demonstrate that in the rat model, kinematic measures are sensitive to performance differences prestroke versus poststroke. These findings reflect trends similar to those seen in human subjects, where poststroke arm movements are characterized by multiple adjustments and inflections in the velocity profile of the contralesional limb. The parallel findings reported here in the rat model underscore the potential utility of this protocol as a means to examine treatment effects that may ultimately generalize to patient populations.
Footnotes
Declaration of Conflicting Interests
The author(s) declared no potential conflicts of interest with respect to the research, authorship, and/or publication of this article.
Funding
The author(s) disclosed receipt of the following financial support for the research, authorship, and/or publication of this article: This work was supported by the Foundation for PM&R (Education Research Fund), the Department of Veterans Affairs, the Illinois Department of Public Health/Illinois Regenerative Medicine Institute, and the Neuroscience Institute, Loyola University. The cells used in this study were donated by Garnet Bio Therapeutics, Inc.