
Abstract
Background
Although many studies have shown abnormalities in brain structure and function in people with Parkinson’s disease (PD), we still have a poor understanding of how brain structure and function relates to freezing of gait (FOG). Graph theory analysis of electroencephalography (EEG) can explore the relationship between brain network structure and gait function in PD.
Methods
Scalp EEG signals of 83 PD (42 PDFOG+ and 41 PDFOG−) and 42 healthy controls were recorded in an eyes-opened resting-state. The phase lag index was calculated for each electrode pair in different frequency bands, but we focused our analysis on the theta-band and performed global analyses along with nodal analyses over a midfrontal channel. The resulting connectivity matrices were converted to weighted graphs, whose structure was characterized using strength and clustering coefficient measurements, our main outcomes.
Results
We observed increased global strength and increased global clustering coefficient in people with PD compared to healthy controls in the theta-band, though no differences were observed in midfrontal nodal strength and midfrontal clustering coefficient. Furthermore, no differences in global nor midfrontal nodal strength nor global clustering coefficients were observed between PDFOG+ and PDFOG− in the theta-band. However, PDFOG+ exhibited a significantly diminished midfrontal nodal clustering coefficient in the theta-band compared to PDFOG−. Furthermore, FOG scores were negatively correlated with midfrontal nodal clustering coefficient in the theta-band.
Conclusion
The present findings support the involvement of midfrontal theta oscillations in FOG symptoms in PD and the sensitivity of graph metrics to characterize functional networks in PDFOG+.
Keywords
Introduction
The freezing of gait (FOG) phenomenon in people with Parkinson’s disease (PD), defined as an abnormal gait pattern that shows a sudden inability to step forward despite the intention to walk, has been described clinically; however, the pathophysiological description has not been well elucidated. 1 Previous functional neuroimaging studies have demonstrated the presence of dysfunctional connectivity between frontal cortical areas and subcortical nuclei in people experiencing FOG in PD.2 -4 Scalp electroencephalography (EEG) and basal ganglia local field potential studies have suggested that FOG in PD can be associated with abnormal oscillatory communication within and between cortical and basal ganglia neural networks.5 -8 Studies have also shown that people with PD and FOG (PDFOG+) exhibit abnormal frontal theta and beta oscillations in cortico-cortical and cortico-basal ganglia networks compared to people with PD without FOG (PDFOG−), specifically during motor and cognitive task performances.5,6 However, EEG-based network properties during the resting-state condition demonstrating the organization of cortical functional connectivity in people with PD with a specific emphasis on the FOG phenomenon are not clear.
Abnormal network organization in PDFOG+ can cause dysfunctional network connectivity, even when the number and strength of connections are relatively preserved. This feature can be identified by graph theory or network analysis. Graph theory of whole-brain resting-state EEG signals can provide a methodological framework to depict complex interactions between large-scale networks. 9 In graph theoretical analysis, several measurements can be derived from a graph, such as strength and clustering coefficient, to explain the topological properties of the network. 10 Functional interactions in cortical regions have been studied to understand the motor symptoms in PD, and cortical and associated networks in PDFOG+ have been identified based on different signals collected from different methods such as magnetic resonance imaging, positron emission tomography, and EEG.11 -15 Functional near infrared spectroscopy has also demonstrated an association between increased prefrontal cortical activity and poor walking and turning performance in PD. 16 Network analyses of these signals showed abnormal hierarchical, modular networks with clustering, path length, and connected network nodes (“hubs”) in people with PD compared to healthy subjects.17,18
Cortical oscillatory connectivity dynamics during FOG episodes showed that abnormal theta frequency coupling within frontal and central EEG channels is related to the transition from normal walking to FOG during up-and-go tasks. 19 Increased beta and gamma coupling in the occipital and parietal channels was also seen during FOG induced by turning movements. 12 Another recent EEG study during different motor tasks suggested that amplitude synchronization (stronger network links) increases across frequency bands (theta, alpha, beta, and gamma), on the level of the whole cortex, as disease and FOG severity increase. 11
Resting-state conditions can demonstrate the functional connectivity between spatially distributed cortical and subcortical brain regions. 20 The intrinsic connectivity networks have been described as resting state networks and found to be consistent among healthy subjects but different between healthy and disease groups. 21 Resting-state activity has been studied to map functional networks for motor symptoms in PD.13,22 Since studies suggest that spontaneous brain activity collected through scalp EEG provides crucial information about long-range communication between brain regions,23,24 the main objective of the current study is to compare the organization of functional networks using resting-state EEG signals between PD and healthy subjects and specifically between PDFOG+ and PDFOG−. We hypothesized that abnormal functional cortical connectivity in the theta frequency band associates with PD and FOG. We applied a phase-locking analysis method to the resting-state EEG signals that is appropriate for connectivity analyses to understand the functional global and local neural network connectivity in PD and PDFOG+. The phase-locking value (PLV) represents the phase synchrony between 2 signals and represents temporal relationships independent of their amplitude. 25
Methods
Participants
A total of 125 participants (42 PDFOG+, 41 PDFOG−, and 42 healthy control subjects) were recruited for this study. All participants provided written informed consent, and all procedures were approved by the University of Iowa and University of South Dakota Institutional Review Boards in accordance with the Declaration of Helsinki. Similar to our previous studies, all participants with PD were tested while ON their usually prescribed dose of anti-parkinsonian medication, approximately 60 to 90 minutes from the last dose because fall risk is higher in unmedicated PDFOG+ patients and ON state is how people with PD are in daily life, so it is worth studying them in that state.6,26 Disease and FOG severity in PD participants were assessed via the motor part of the Unified Parkinson’s Disease Rating Scale 27 and FOG questionnaire, respectively. 28 Similar to our previous studies,6,7,26 PDFOG+ were grouped if they met both of the following criteria: (i) participants confirmed they had problems starting, stopping, and turning during walking; (ii) their FOGQ (number 3) score was >0, suggestive of at least 1 FOG episode in the past month. Characteristics of all the participants have been described in Table 1.
Demographics and Clinical Scores.
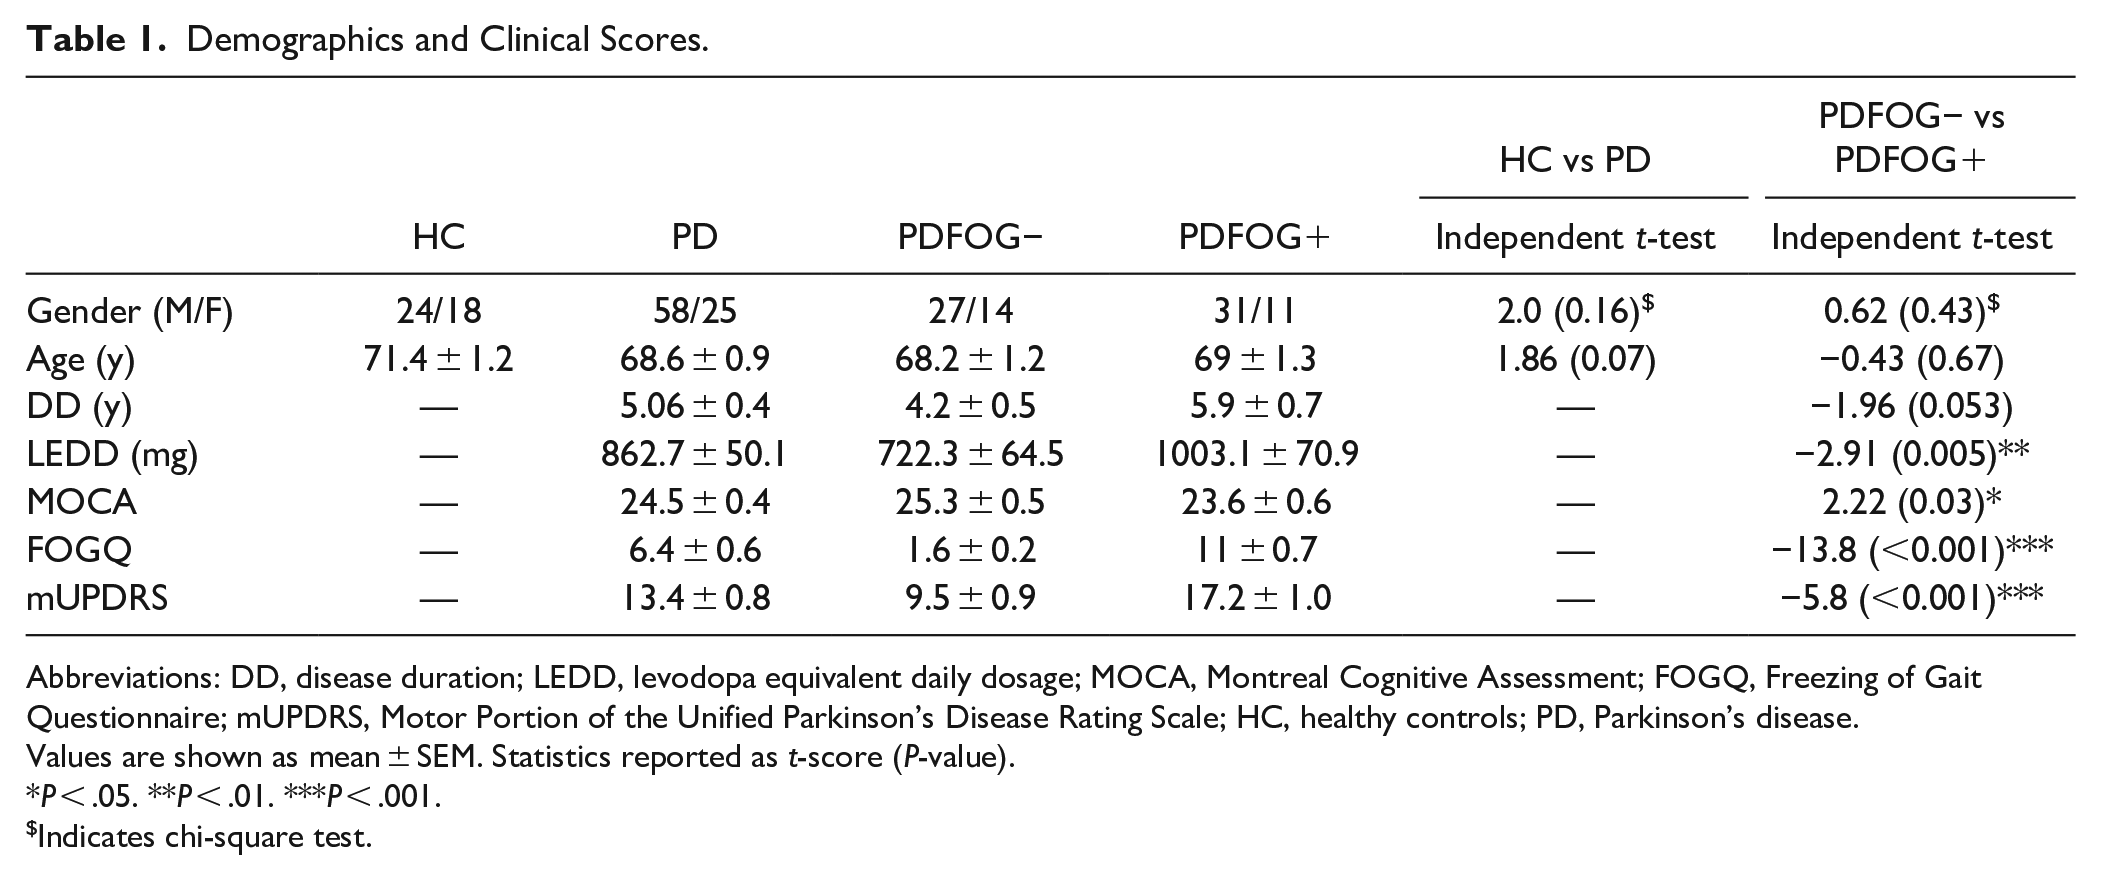
Abbreviations: DD, disease duration; LEDD, levodopa equivalent daily dosage; MOCA, Montreal Cognitive Assessment; FOGQ, Freezing of Gait Questionnaire; mUPDRS, Motor Portion of the Unified Parkinson’s Disease Rating Scale; HC, healthy controls; PD, Parkinson’s disease.
Values are shown as mean ± SEM. Statistics reported as t-score (P-value).
P < .05. **P < .01. ***P < .001.
Indicates chi-square test.
EEG Recordings and Analysis
A 64-channel EEG cap was used to collect EEG signals with a 0.1 Hz high-pass filter and 500 Hz sampling rate. Electrode Pz was used as the reference. For the resting-state task, EEG signals were collected while subjects sat with their eyes open and looking straight away for 180 seconds. EEG signals were processed in EEGLAB. We removed electrodes Fp1, Fp2, FT9, FT10, TP9, and TP10 due to their susceptibility to eyeblink and muscle artifact. Data were re-referenced to the average, epoched into 3-second consecutive epochs, and bad epochs and artifacts were removed during pre-processing.29,30 Signals from all 59 channels were filtered in 5 frequency bands (delta 1-4 Hz, theta 4-7 Hz, alpha 7-13 Hz, beta 13-30 Hz, and gamma 30-50 Hz). Then PLV was calculated for each band using the Hilbert transformation. We selected a PLV measure for phase synchronization quantitation in order to minimize the volume conduction effect since the PLV computes the asymmetry in the distribution of instantaneous phase differences. 31 PLV is used to measure frequency-specific relationships between cortical regions and allows us to directly explore the relationship between different frequency bands and network communication. Further, we created a thresholded matrix across all electrode pairs (59 × 59), so that the top 20% of weighted links computed using Pearson correlation were kept in the final graph (Supplemental Figure 1). 32 Based on our previous work, we focused our analysis on the theta (4-7 Hz) frequency band and selected the midfrontal Cz channel for nodal analysis.6,7,30,33
For network features, we chose 2 commonly used graph theory features, strength and clustering coefficient, and used the Matlab-based Brain Connectivity Toolbox. 34 Strength shows the “strength” of connectivity for a node by summing up its correlation values with its thresholded links. Moreover, clustering represents another basic measure of node centrality as it considers the ratio of a node’s triangles (i.e., nodes whose connections are also connected to each other) relative to the total number of potential triangles. In other words, the clustering coefficient of a node in a graph computes how close its neighboring nodes are to being a clique. We computed global values (i.e., nodal values averaged across each electrode/node) as well as nodal values centered on the midfrontal Cz electrode of both connectivity measures. This approach allowed us to examine both the individual strength of connectivity of the midfrontal Cz electrode and the connectivity across its thresholded connections (i.e., its “neighbors”). In other words, we were able to examine the overall connectivity of the individual node and the “neighborhood” of surrounding nodes.
Statistical Analysis
We initially performed the Shapiro–Wilk normality test. Afterward, we implemented two-sample t-tests comparing people with PD with healthy controls examining differences in global strength of connectivity and nodal midfrontal strength in the theta-band. In addition, we performed these same analyses comparing PDFOG+ with PDFOG−. Next, we performed two-sample t-tests comparing people with PD with healthy controls examining differences in global clustering coefficient and nodal midfrontal clustering coefficient in the theta-band. Similarly, we also performed these same analyses comparing PDFOG+ and PDFOG− patients. These analyses were also performed across delta, alpha, beta, and gamma frequency bands. Moreover, we analyzed the differences between three groups (PDFOG+, PDFOG−, and healthy controls) via one-way ANOVAs with Tukey–Kramer multiple comparison tests for the theta-band. Topographic maps were plotted to demonstrate the connectivity features (strength and clustering coefficient) across each channel. ANCOVAs were applied to detect differences in connectivity measures in the theta-band between the PDFOG+ and PDFOG− groups whilst adjusting for covariates (disease severity using the motor part of UPDRS, and levodopa equivalent daily dose [LEDD]).
To further determine whether associations between global or nodal measures in PDFOG+ are associated with FOG or other measures, such as disease severity, we performed Pearson correlation analyses and regression relating disease severity and FOG scores to global and nodal connectivity measures.
Results
The normality test demonstrated that the data was normally distributed. We compared global strength between people with PD and healthy controls in the theta frequency band (Figure 1A). This comparison yielded a significant difference between people with PD and healthy controls (t(123) = −3.9, P < .001; Figure 1B), with people with PD exhibiting significantly higher global strength (mean ± SEM = 8.51 ± 0.11) compared to healthy controls (7.76 ± 0.17). In addition to global measures of strength, we also compared midfrontal nodal strength between people with PD and healthy controls. This comparison demonstrated no difference in midfrontal nodal strength between people with PD and healthy controls (t(123) = 0.47, P = .64; Figure 1C). Though we specifically focused on the midfrontal Cz electrode, differences in strength at other frontal and parietal nodes were also observed (Figure 1A). We next examined global clustering coefficient between people with PD and healthy controls in the theta frequency band (Figure 1D). This comparison demonstrated a significant difference (t(123) = −2.26, P = .03; Figure 1E), with people with PD exhibiting a significantly higher global clustering coefficient (mean ± SEM = 0.51 ± 0.01) compared to healthy controls (0.46 ± 0.02). For midfrontal nodal clustering coefficient, no difference was observed between people with PD and healthy controls (t(123) = 0.43, P = .67; Figure 1F) in the theta-band. Outside of our region of interest, topographic plots showed differences in clustering coefficient at other frontal and posterior nodes (Figure 1D). Fully connected and thresholded matrices of PLV in healthy controls, PD, PDFOG−, and PDFOG+ groups, and differences in thresholded matrices, can be seen in Supplemental Figure 1.
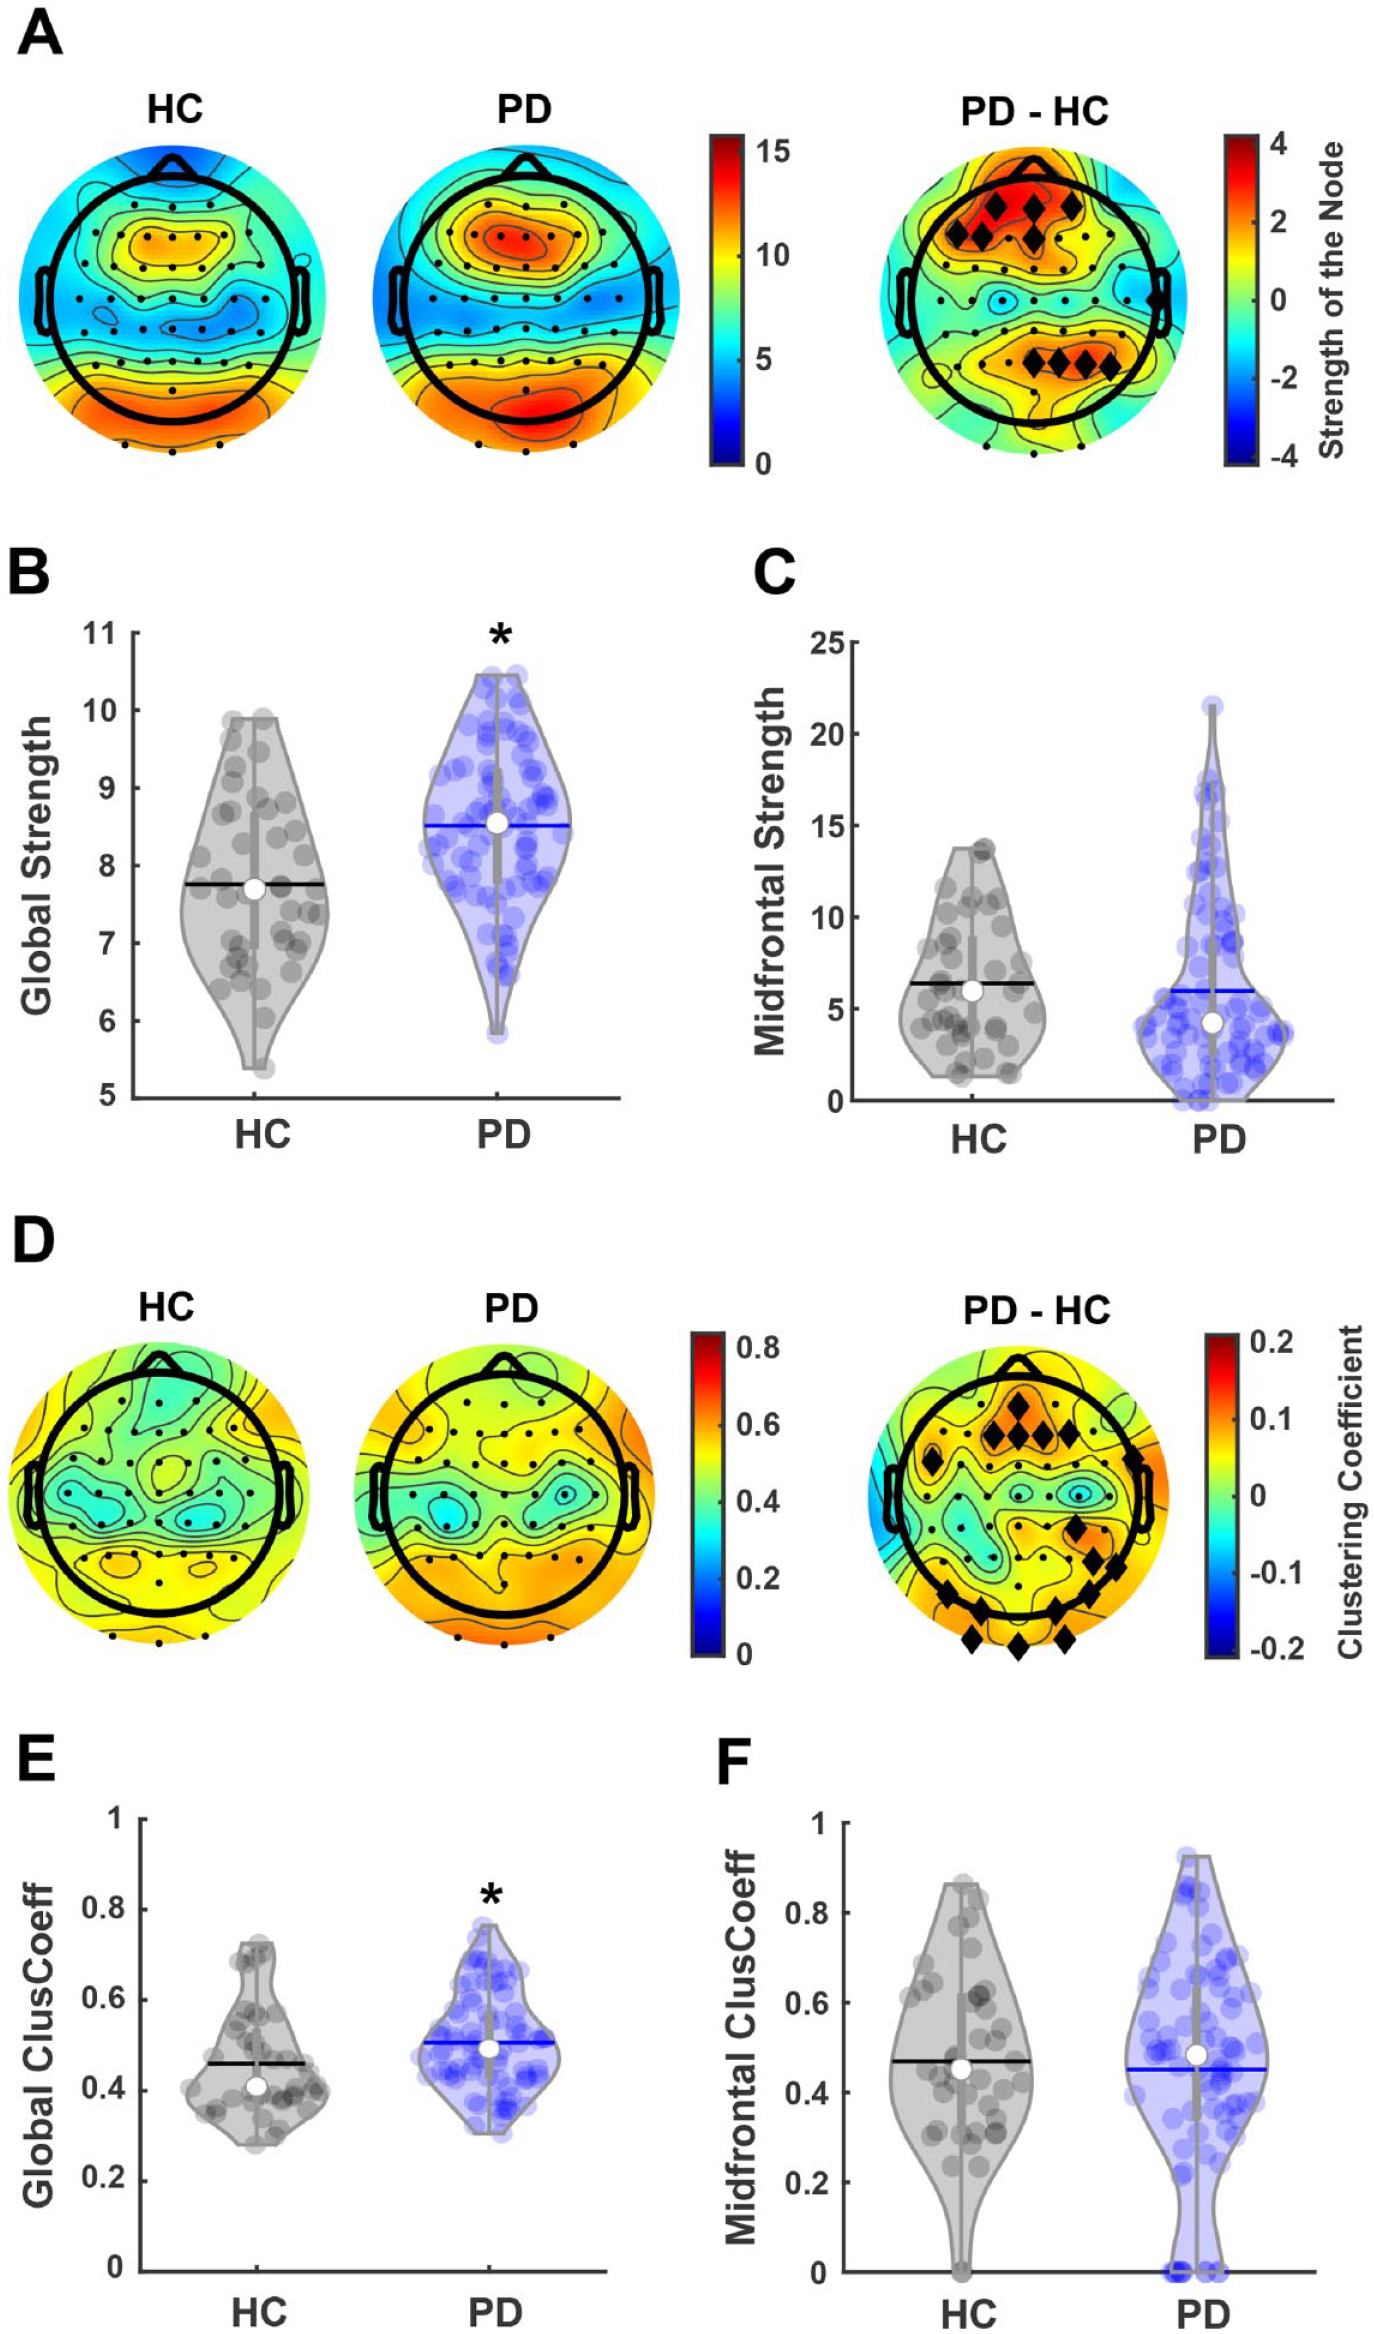
Global and local midfrontal strength and clustering coefficient in the theta-band for PD and healthy controls. (A) Topographic plots showing nodal strength for healthy controls (HC) and people with Parkinson’s disease (PD). Right panel shows the difference between groups. (B) People with PD exhibit a significantly higher global strength compared to HC. (C) No difference in midfrontal nodal strength is observed. (D) Topographic plots showing nodal clustering coefficient for HC and people with PD. Right panel shows the difference between groups. (E) People with PD exhibit a significantly higher global clustering coefficient compared to HC. (F) No difference in midfrontal nodal clustering coefficient is observed. Black diamonds in difference topographic plots indicate nodal differences at P < .05. *P < .05. In violin plots, horizontal lines and white circles represent the mean and median values, respectively.
Next, these analyses were also performed in PDFOG+ and PDFOG− (Figure 2A). The initial comparison in the theta-band between these groups for global strength showed no difference between groups (t(81) = 0.65, P = .52; Figure 2B). Furthermore, no difference was observed between PDFOG+ and PDFOG− groups for midfrontal nodal strength in the theta-band (t(81) = 1.51, P = .13; Figure 2C). Similar to midfrontal nodal strength, topographic plots also show differences in strength at some of the left frontal hemisphere and a couple of central nodes outside of our region of interest (Figure 2A). For a graphic representation of nodal strength at each electrode, please see Supplemental Figure 2. These interesting findings demonstrate that people with PD exhibited heightened overall strength of their functional connectivity, perhaps as a compensatory mechanism to accommodate for different motor and cognitive deficits. However, these differences do not exist over the midfrontal node, nor do they translate to PDFOG+, meaning they may have more to do with disease progression than with FOG. Moreover, our comparison between PDFOG+ and PDFOG− (Figure 2D) showed no difference in global clustering coefficient (t(81) = 0.92, P = .36; Figure 2E). However, we observed a significant difference in midfrontal nodal clustering coefficient between PDFOG+ and PDFOG− (t(81) = 2.8, P = .01; Figure 2F), with PDFOG+ exhibiting a significantly lower midfrontal nodal clustering coefficient (mean ± SEM = 0.38 ± 0.04) compared to PDFOG− (0.52 ± 0.04). ANCOVA tests also showed significant differences between both groups after controlling for disease severity (t = 2.69, P = .009), LEDD (t = 2.37 P = .0197), and including both covariates (t = 2.38, P = .0195). For a graphic representation of nodal clustering coefficient at each electrode, please see Supplemental Figure 3. Similar to our comparisons between people with PD and healthy controls, the increased global clustering coefficient in the theta-band in PD could reflect a compensatory mechanism and heightened connectivity in the resting-state. In contrast to our previous midfrontal nodal measures, the significant decrease in midfrontal clustering coefficient for the PDFOG+ group could reflect decreased connectivity in the “neighborhood” surrounding the midfrontal region. This finding coincides with our previous work demonstrating deficits in midfrontal low frequency oscillations in individuals with FOG.6,7
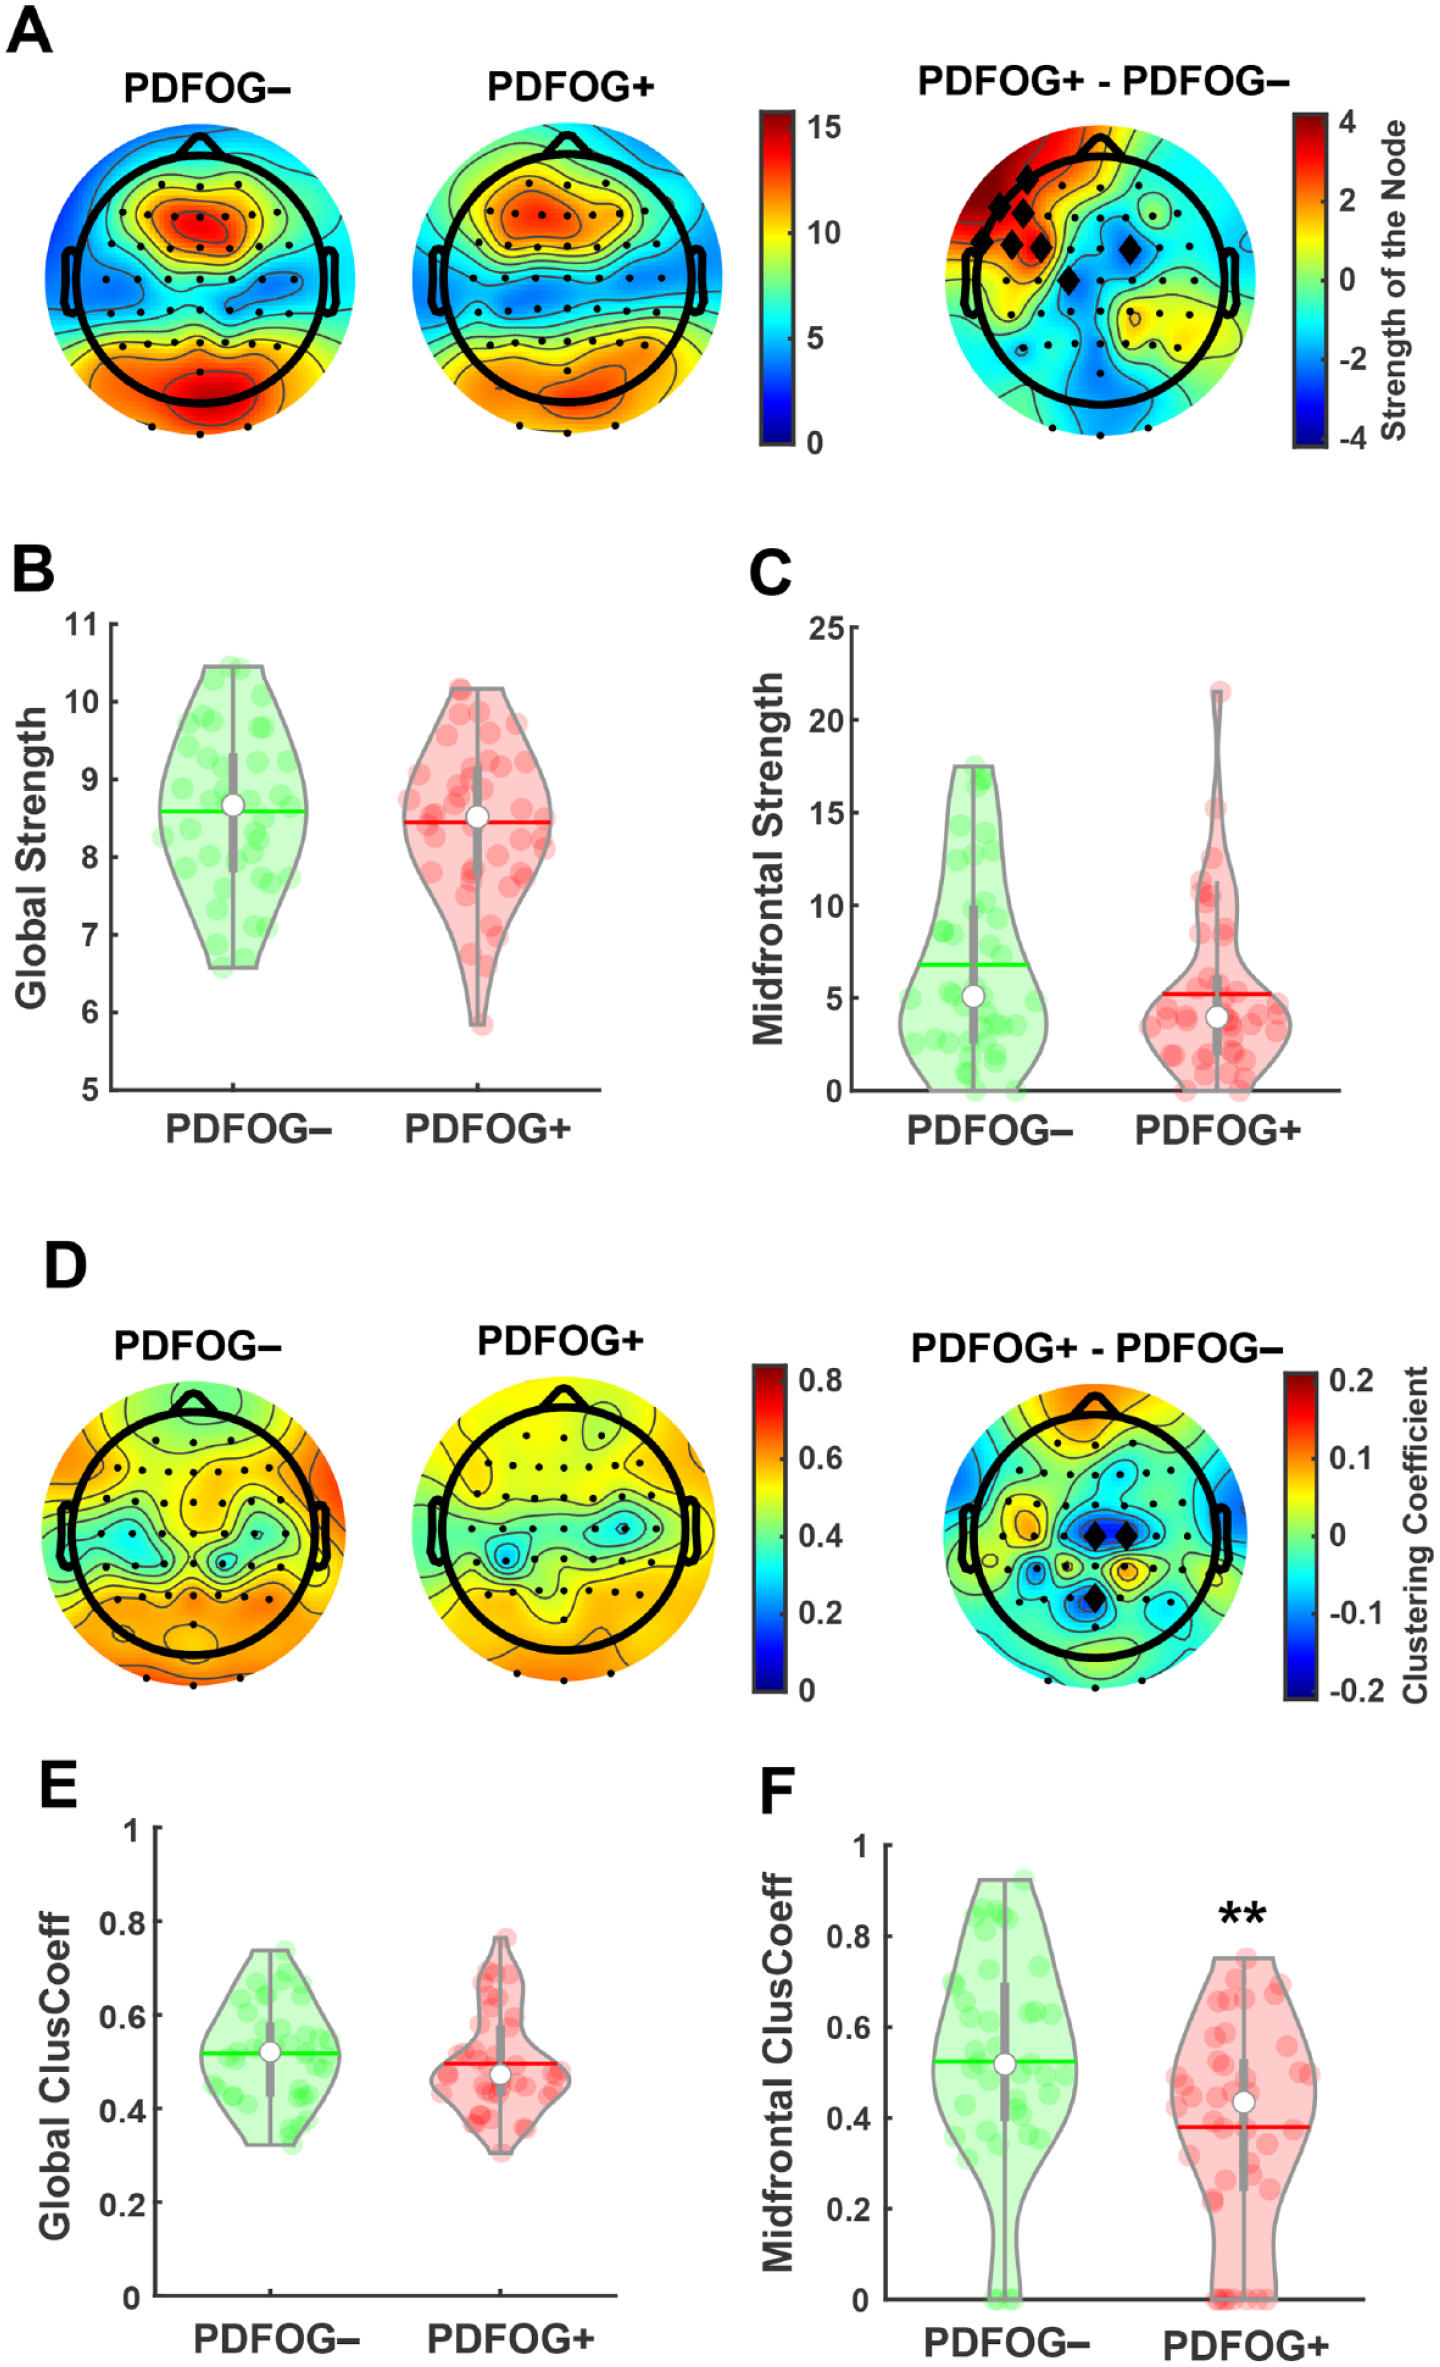
Global and local midfrontal strength and clustering coefficient in the theta-band for PDFOG+ and PDFOG−. (A) Topographic plots showing nodal strength for PD participants with freezing of gait (PDFOG+) and those without (PDFOG−). (B and C) No differences in global strength and midfrontal nodal strength were observed between PDFOG+ and PDFOG−. (D) Topographic plots showing nodal clustering coefficient for PDFOG+ and PDFOG−. (E) No difference in global clustering coefficient is observed between PDFOG+ and PDFOG−. (F) PDFOG+ exhibit decreased midfrontal nodal clustering coefficient compared to PDFOG−. Black diamonds in difference topographic plots indicate nodal differences at P < .05. **P < .01. In violin plots, horizontal lines and white circles represent the mean and median values, respectively.
In order to determine whether the decreased theta-band midfrontal clustering coefficient in PDFOG+ is related to FOG or is associated with disease severity, we performed correlation analyses between midfrontal clustering coefficient and FOGQ scores and disease severity assessed using mUPDRS scores. These analyses demonstrated a moderate significant negative correlation between midfrontal theta clustering coefficient in PD patients and FOGQ scores (r = −.29, P = .01; Figure 3A), indicating that decreases in midfrontal theta clustering coefficient are associated with increases in FOG scores. Moreover, regression analysis demonstrated that midfrontal theta clustering coefficient can predict FOG severity in PD (P = .007). However, no significant association was observed between midfrontal theta clustering coefficient and disease severity (r = −.1, P = .35; regression: P = .32; Figure 3B). Also, we found no significant correlation between midfrontal theta clustering coefficient and disease duration (P = .82) or MOCA scores (P = .59). Furthermore, no significant relationship was observed between midfrontal theta strength and FOGQ scores (r = −.19, P = .08; regression: P = .078) or disease severity (r = −.06, P = .59). These findings may suggest that FOG can be directly related to decreased midfrontal clustering coefficient in the theta-band during the resting state.
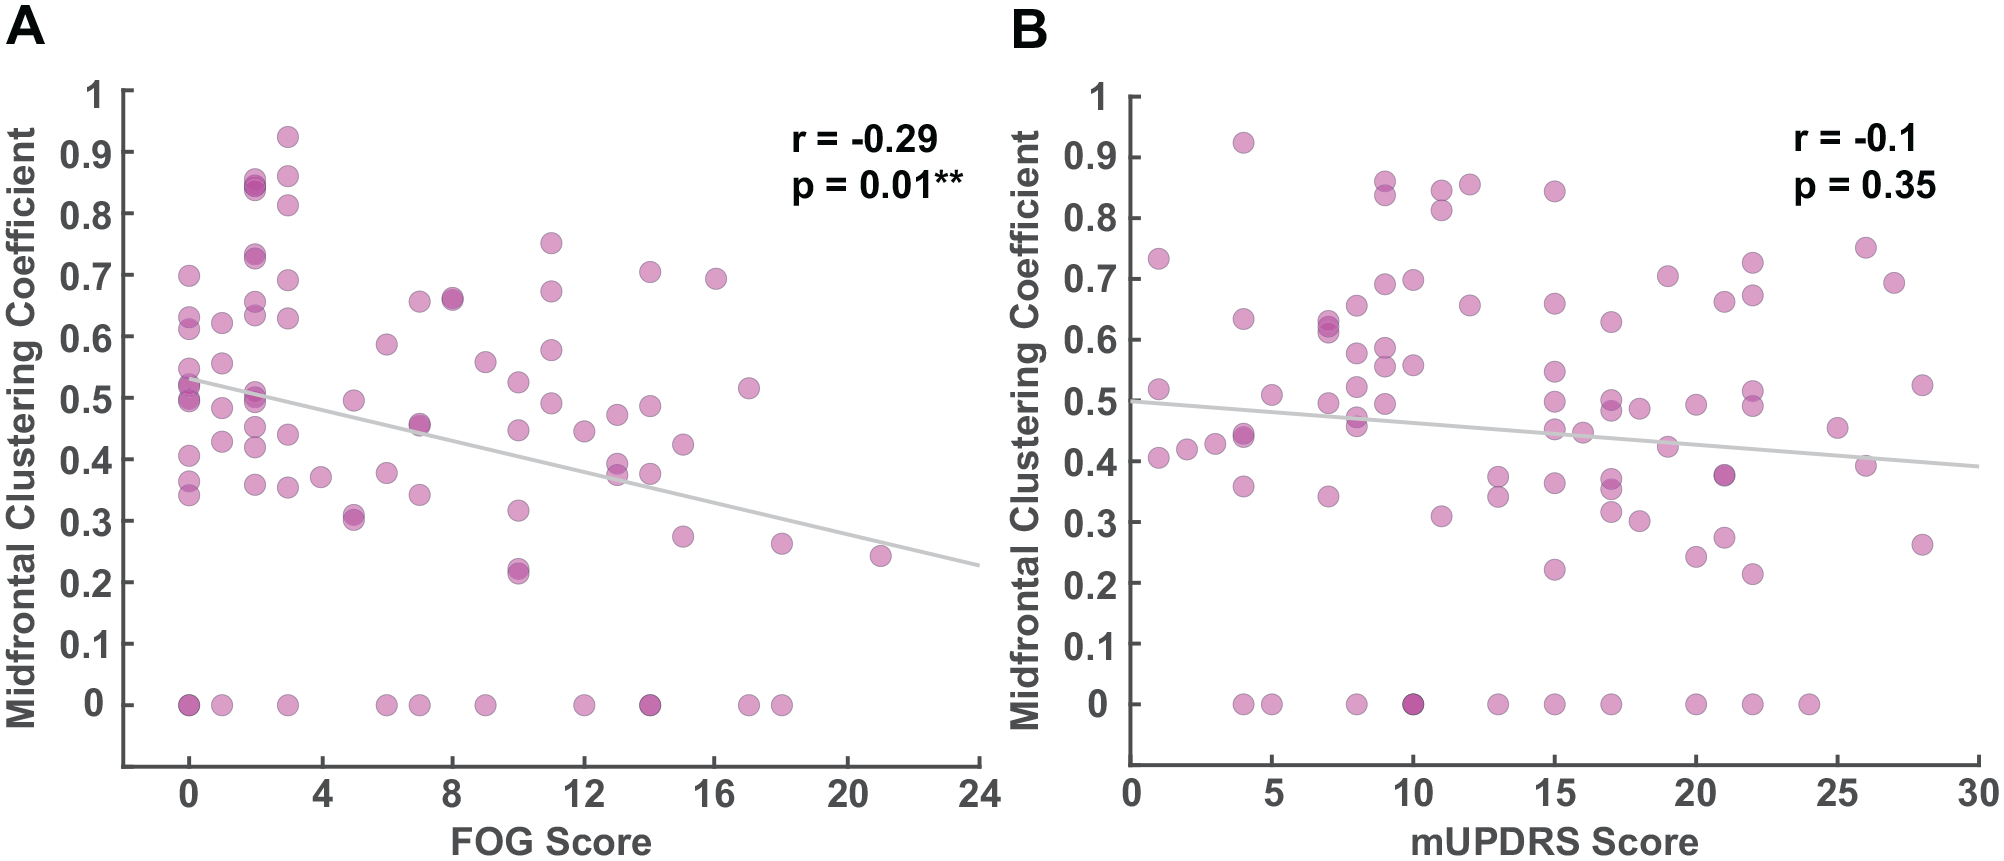
Correlations between midfrontal theta clustering coefficient and clinical measures. (A) Midfrontal nodal clustering coefficient is significantly associated with freezing of gait questionnaire (FOGQ) scores in the theta-band. (B) No association is observed between midfrontal nodal clustering coefficient in the theta-band and disease severity as indicated by mUPDRS (Motor Portion of the Unified Parkinson’s Disease Rating Scale) scores.
Additionally, the one-way ANOVA test on global strength in the theta-band for PDFOG+, PDFOG−, and healthy controls showed a main effect of group (F(2, 122) = 7.74, P = .001; Supplemental Figure 4A) and the multiple comparison tests showed significant differences between healthy controls, PDFOG−, and PDFOG+; however, no main effect of group was observed for midfrontal nodal strength (P = .24; Supplemental Figure 4B). In addition, the one-way ANOVA tests showed a main effect of group on theta global clustering coefficient (F(2, 122) = 2.94, P = .05; Supplemental Figure 4C) and midfrontal clustering coefficient (F(2, 122) = 4.47, P = .01; Supplemental Figure 4D). Multiple comparison tests demonstrated differences between healthy controls and PDFOG− in global theta clustering coefficient and between PDFOG− and PDFOG+ in midfrontal theta clustering coefficient.
Moreover, we performed global and nodal comparisons in other frequency bands between PD patients and healthy controls, as well as between PDFOG+ and PDFOG− (Supplemental Tables 1 and 2). In summary, we noted a significant increase in global strength in all frequency bands for people with PD compared to healthy controls, but we observed no differences in midfrontal nodal strength between these groups in any frequency band. Similarly, no differences in either global or midfrontal nodal strength were observed between PDFOG+ and PDFOG−. In addition to the differences in global clustering coefficient seen in the theta-band, we also observed significantly increased global clustering coefficient in the alpha and gamma bands for people with PD compared to healthy controls (Supplemental Table 2, P < .05). No significant differences were observed in midfrontal nodal clustering coefficient between people with PD and healthy controls (P > .05). In addition to the previously noted theta-band differences, PDFOG+ also exhibited significantly decreased gamma-band midfrontal nodal clustering coefficient compared to PDFOG− (P < .01, Supplemental Table 2), though no global differences were observed between these groups. These results demonstrate widespread global differences in resting-state network connectivity between PD patients and healthy controls. However, differences between PDFOG+ and PDFOG− appear less widespread and localized to the midfrontal brain region.
Discussion
Our results demonstrate EEG-based evidence of network alterations in people with PD compared to healthy control subjects, as well as in PDFOG+ compared to PDFOG−. Specifically, we observed significant network alterations in certain neural measures (strength and clustering coefficient) across different frequency bands globally and locally at midfrontal cortical sites. Similar to our previous reports, altered network measures existed in the lower frequency band for PD versus healthy subjects, and PDFOG+ versus PDFOG−.6,7 Furthermore, lower frequency midfrontal clustering coefficient correlated with patient-reported severity of FOG.
EEG-based network information from healthy individuals and people with PD, including those with FOG, can be an important factor in understanding the pathophysiology of PD and developing clinical biosignature routines. In addition to other EEG network analyses, graph theory can further characterize network information through different types of network measures. In the current study, we observed that certain EEG network measures in the theta-band, such as strength and clustering coefficient, appear to be more prominent alternative biosignatures for PD than other network measures. Both network features can work as neural correlates for motor symptoms in PD and thus these cortical measures can be studied to observe beneficial clinical outcomes of neuromodulation35,36 and pharmacological 37 interventions to improve motor problems in PD. Furthermore, decreased midfrontal clustering in PDFOG+ suggests that the clustering coefficient measure can be sensitive to elusive changes in lower-extremity motor symptoms in PD. Thus, in the context of severe lower-extremity motor problems such as abnormal gait or FOG, the midfrontal clustering coefficient measure may be a precursor of severe gait issues in PD, and our analysis method could enhance therapeutic monitoring options to alleviate and detect FOG events, thereby minimizing possible fall-injuries and improving the quality of life of PDFOG+ patients.
Dopaminergic depletion in PD can alter the neuronal input to cortico-basal ganglia networks.38,39 Cortical activities are associated with subcortical subthalamic activities via the hyper-direct pathway and abnormal neural and neuronal networks can be seen in this pathway in PD models.40,41 Our results suggest that abnormal inter-regional cortical networks in the theta-band, specifically in the midfrontal region, can be an outcome of irregularities in subcortical input to different cortical regions in PD and further abnormalities can occur with the progression of the disease, specifically when PD patients develop FOG issues.
Based on our previous reports showing altered midfrontal theta activity during motor and cognitive tasks in PD and PDFOG+, we focused our analysis on the theta frequency band and selected the midfrontal location as a provincial hub.6,7,30,33 Theta activity in the midfrontal cortical region has been observed during cognitive tasks and motor tasks that require attention or cognitive load. 42 Furthermore, we previously observed alterations in midfrontal theta activity during cognitive tasks and dual tasks (i.e., motor tasks with cognitive challenge) in PD and PDFOG+ groups.6,30,33 When compared to walking, FOG episodes have been associated with changes in frontal and central theta power, and theta frequency coupling between those regions. 19
In addition to the theta band, the involvement of cortical and subcortical beta frequency oscillations has been studied extensively in PD.38,43 For example, increased subcortical beta-band oscillations have been observed in PDFOG+ and during FOG episodes.5,44 Our previous study has also described the occurrence of high beta-band power in the central cortical region of PDFOG+ during a lower-limb motor task with higher attention. 6 However, alterations in cortical beta or other higher frequency oscillations (gamma-band) have not been detailed during the resting-state condition in PDFOG+. Resting-state EEG can reveal differences in cortical organization and fluctuations between different frequency bands. 45 Variabilities in network organization as represented by strength and clustering coefficient measures were larger in the theta-band compared to the beta and gamma frequency bands in all groups. Besides resting-state theta-band, network measures were increased in the beta as well as gamma frequency bands in PD compared to healthy controls. However, these differences were prominent at the global level, suggesting the contribution of network measures at broader frequency bands and in different cortical regions in PD symptomology. Network measures indicate the interplay of global information processing and local processing efficiency in the cortical regions that fluctuate in a frequency-specific way, 45 and are altered profoundly in the theta-band in the PD condition. In this study, we examined network measures in all frequency bands and found differences in global network measures in the PD and PDFOG+ groups, but the prominent regional difference was restricted to the theta-band in PDFOG+. Also, we focused our analyses in the theta-band since it was proposed as our primary hypothesis. However, outcomes in other frequency bands are exploratory and should be examined further in detail to reveal the potential significance of these resting-state EEG network measures or properties, including their clinical applicability.
We observed increased strength and clustering coefficient of EEG in people with PD compared to healthy controls globally across low and high frequency bands, and these changes were seen locally at frontal and posterior regions rather than midfrontal. Interestingly, strength and clustering coefficient at the midfrontal lead were lower in PDFOG+ compared to PDFOG−, suggesting a reduction in local network theta-band connectivity in PDFOG+ since no changes in network measures were seen globally. These results are consistent with our previous findings confirming the role of midfrontal theta alterations in PDFOG+. 6 Furthermore, our correlation analysis showed that reduced midfrontal clustering coefficient in the theta-band is moderately associated with severe FOG abnormalities rather than disease severity in PD subjects. This association suggests that midfrontal theta oscillations play a crucial role in gait dysfunction.
Interestingly, recent studies have shown a significant relationship between gait dysfunction/FOG and cognitive impairment in PD patients.26,46 This relationship has been characterized by reduced midfrontal low-frequency oscillations in delta and theta frequency bands in PDFOG+ compared to PDFOG−.6,7 Consistent with these reports, our PDFOG+ group showed lower MOCA scores compared to PDFOG−, suggesting higher cognitive deficits. However, studies have shown that differences between both groups in some of the cognitive domains may not sustain after correcting for disease severity or other clinical variables.26,46 Overall, these results suggest that midfrontal theta clustering coefficient may be a novel candidate biosignature that can also be used to elucidate cognitive impairments in PDFOG+ with disease progression.
Since anatomical or functional disconnection between cortical and related areas can generate spontaneous oscillations in low and high frequency bands in practically all recorded neurons, the increase in global strength at these frequencies is likely due to the effect of the disease on neural networks. Similar to our results, a previous study has shown increased degree of synchronization (strength of network links) in EEG amplitudes across all frequency bands for PD patients. 11 This same study also demonstrated no differences in synchronization between PDFOG+ and PDFOG−, although both groups exhibited quite different clinical characteristics. Our data also showed no differences in strength either globally or locally at the midfrontal region in any frequency band between the PDFOG+ and PDFOG− groups. This outcome suggests that strength may not be a suitable cortical network measure for gait abnormalities, perhaps because FOG risk can change from day-to-day in patients, whereas cortical activities change between “prone-to-FOG” and non-FOG conditions. 11
In contrast to strength, the clustering coefficient measure in the midfrontal theta frequency band was different between PDFOG+ and PDFOG− groups. In this context, a higher global clustering coefficient (i.e., higher interconnection in the network) in the theta frequency band can be pathophysiological for PD but reduced regional clustering (i.e., lower interconnection of neighboring nodes) at the midfrontal region in the theta-band in PDFOG+ may represent a precursor for gait abnormalities. This finding suggests that PD patients who suffer from gait dysfunctions/FOG can exhibit reduced regional network clustering in the midfrontal region. Since the pathophysiology of gait abnormalities in PD are largely unknown, it is unclear whether reduced midfrontal clustering is consequential or causal to the gait deficits in PDFOG+. Nevertheless, a reduced midfrontal clustering coefficient among this subgroup of PD participants implies that disease progression or more severe disease symptomatology can lead to lower interconnection of neighboring nodes in the midfrontal cortical region. Altogether, midfrontal clustering in the theta-band can be a critical network measure that could be utilized to help monitor FOG events and develop therapeutic approaches to improve gait dysfunction in PDFOG+.
Our study has some potential limitations. The current study is cross-sectional; therefore, we could not observe dynamic network changes in the theta frequency or other frequency bands at midfrontal or other regions during the progression of PDFOG+ from PDFOG−. We recruited PD subjects only with levodopa medication, therefore, we could not compare the data with the OFF-medication condition. Levodopa medication state can exhibit other variables such as timing of the dose, efficacy of the dose, and degree of the levodopa response. Due to these variables, patients may not show the true condition of the disease state. However, our previous studies have shown no changes in frontal or cerebellar activities during motor and cognitive tasks in PDFOG+ and PDFOG− groups whether in ON or OFF medication states.6,29,30,33 There are multiple subtypes of FOG (pharmacological and pathophysiological) that can likely have differences in network changes, particularly in the ON state. 47 As a limitation of our analysis, we could not correlate network analysis outcomes to different subtypes of FOG because we could not collect the data related to subtypes of FOG. We studied network measures during the resting-state condition, however, network analysis during gait or FOG episodes could be advantageous to further understand network connectivity in the PDFOG+ group. In this study, we used a proportional threshold (20% of the edge’s weights) to eliminate weak connections in the functional connectivity matrices, however, different thresholds (ranging from 5% to 20%) can be implemented. Though a previous study has shown that range of threshold can exhibit only slight changes and obtained results cannot be sensitive to the threshold value. 48 Next, we focused and described the results obtained in theta oscillations based on previous findings.6,19,33 However, other frequency bands could also exhibit differences between PDFOG+ and PDFOG−, though our own analyses in other low and high frequency bands seemingly validated the critical role of the theta frequency band.
In the future, cortical and subcortical signals can be collected using Percept™ deep brain stimulation devices during gait in PD patients and during FOG episodes. Neural network measures from those cortical and subcortical recordings can then be used for machine learning approaches to automatically detect and predict FOG events. In addition, future studies may benefit from combining the high temporal resolution of EEG connectivity with the high spatial resolution of fMRI to show these important and imperative network measures mapped onto brain regions that play an essential role in gait dysfunction in PD patients.
In conclusion, people with PD exhibit alterations in functional connectivity network measures (strength and clustering coefficient) in low and high frequency bands globally, however, those with FOG show reduced clustering in the theta-band locally in the midfrontal region. In people with PD and marked gait dysfunction/FOG, alterations in lower-extremity motor and non-motor functions may be related to loss of local midfrontal integration in the theta frequency band. In general, we can state that PDFOG+ showed altered functional connectivity and random neural networks at the midfrontal cortical level. Several studies have reported cortical alterations in functional connectivity in PD and PDFOG+ groups, defining it as a disorder of functional disconnection.11,13,49 Therefore, the examination of EEG-derived functional connectivity patterns in PD with disease progression, particularly midfrontal theta clustering, can be a valuable tool to assess motor symptoms including gait abnormalities.
Supplemental Material
sj-pdf-1-nnr-10.1177_15459683221129282 – Supplemental material for Functional Connectivity in Patients With Parkinson’s Disease and Freezing of Gait Using Resting-State EEG and Graph Theory
Supplemental material, sj-pdf-1-nnr-10.1177_15459683221129282 for Functional Connectivity in Patients With Parkinson’s Disease and Freezing of Gait Using Resting-State EEG and Graph Theory by Taylor J. Bosch, Arturo I. Espinoza, Martina Mancini, Fay B. Horak and Arun Singh in Neurorehabilitation and Neural Repair
Footnotes
Declaration of Conflicting Interests
The author(s) declared no potential conflicts of interest with respect to the research, authorship, and/or publication of this article.
Funding
The author(s) disclosed receipt of the following financial support for the research, authorship, and/or publication of this article: AS was supported by SSOM Faculty Research awards.
Data Availability
Data supporting the findings of this study are available from the corresponding author upon reasonable request.
Supplementary material for this article is available on the Neurorehabilitation & Neural Repair website along with the online version of this article.
References
Supplementary Material
Please find the following supplemental material available below.
For Open Access articles published under a Creative Commons License, all supplemental material carries the same license as the article it is associated with.
For non-Open Access articles published, all supplemental material carries a non-exclusive license, and permission requests for re-use of supplemental material or any part of supplemental material shall be sent directly to the copyright owner as specified in the copyright notice associated with the article.