
Abstract
Background
The Action Observation Therapy (AOT) is a well-established post-stroke rehabilitation treatment based on the theoretical framework of the Mirror Neuron System (MNS) activation. However, AOT protocols are still heterogeneous in terms of video contents of observed actions.
Objective
The aim of this study was to analyze electroencephalographic (EEG) recordings in stroke patients during the observation of different videos of task-specific upper limb movements, and to define which category of actions can elicit a stronger cortical activation in the observer’s brain.
Methods
Signals were analyzed from 19 chronic stroke subjects observing customized videos that represented 3 different categories of upper limb actions: Finalized Actions, Non-Finalized Actions, and Control Videos. The Event-Related Desynchronization in the µ and β bands was chosen to identify the involvement of the cerebral cortex: the area of the normalized power spectral density was calculated for each category and, deepening, for the reaching and completion sub-phases of Finalized Actions. For descriptive purposes, the time course of averaged signal power was described. The Kruskal–Wallis test (P < .05) was applied.
Results
The analysis showed a greater desynchronization when subjects observed Finalized Actions with respect to Non-Finalized in all recorded areas; Control videos provoked a synchronization in the same areas and frequency bands. The reaching phase of feeding and self-care actions evoked a greater suppression both in µ and β bands.
Conclusions
The observation of finalized arm movements seems to elicit the strongest activation of the MNS in chronic stroke patients. This finding may help the clinicians to design future AOT-based stroke rehabilitation protocols.
Clinical Trial Registration:
Clinical Trial Registration—URL: http://www.clinicaltrials.gov. Unique identifier: NCT04047134.
Keywords
Introduction
Loss of upper limb function occurs in up to 85% of stroke survivors and has a significant long-term impact on the quality of life. 1 Therefore, the upper limb recovery after stroke is critical for increasing functional performance and participation in Activities of Daily Living (ADLs).2,3 Successful upper limb recovery approaches are typically based on early, intensive, repetitive, task-oriented practice,4,5 and pioneering strategies.6 -9 Among these approaches, Action Observation Therapy (AOT) represents an innovative treatment that generates multisensory stimulation and modifies neuroplasticity by activating the Mirror Neuron System (MNS).10 -12 Empirical evidence on the human MNS has shown that the motor cortex excitability is significantly modulated not only when actions are actually performed, but also when they are merely observed.13 -16 A recent meta-analysis has shown that the MNS, as revealed by electroencephalography (EEG), responds to object-directed actions 17 by desynchronizing µ (8-13 Hz) and β (15-20 Hz) rhythms in the sensorimotor areas of healthy adults.
The AOT as a neurorehabilitation treatment is based on the hypothesis of neuroplasticity stimulation following the observation of actions through the rearrangement of partially injured motor circuits, thus favoring motor recovery.18 -25 Considering this assumption, a number of clinical studies have been published in recent years suggesting the efficacy of AOT to enhance motor recovery and autonomy in ADLs.26 -29 In particular, functional improvements have been found in both subacute30 -32 and chronic33 -35 stroke patients which was also confirmed by the systematic reviews of Borges et al 27 and Zhang et al. 29 In addition, some studies with instrumental assessments found that AOT facilitated motor cortical activity36 -38 and improved the upper limb kinematics. 39 However, the treatment protocols proposed by the AOT clinical trials are heterogeneous in terms of video content, time frame of action observation and execution, and treatment dose. 27 In the light of the potential effect of AOT in neurorehabilitation, it is necessary to determine which categories of actions can evoke a stronger cortical activation in the observer’s brain.
Given the unclear mechanisms of modulation of neural activity after AOT, a number of recent publications have examined the cortical responses of healthy adults during the observation of videos with different features.40 -46 The EEG-based studies by Angelini et al 40 and Ikeda et al 41 compared the cortical responses obtained by watching videos in which the manipulation of different objects was recorded from different viewing angles: AOT administered by moving specific target objects (ie, blue ball, stick, or cube) causes suppression of sensorimotor µ rhythm in α and β bands. This effect is further enhanced by color saturation. Similarly, in another recent study, 42 greater desynchronization of frontal β rhythms was observed when the action was shown in a frontal visual perspective. Moreover, Puzzo et al 43 compared EEG recordings during the observation of different videos showing a moving hand, a static hand, or a bouncing ball (as a control) with different durations. The authors found desynchronization of the β band only during the repetition of short videos with the moving hand. Recently, Hsieh et al 44 found that observing hand movements in a video performed by a real hand and by a computer graphics hand elicited comparable activations of the primary motor cortex that were significantly different from the control videos. Other studies on cerebral activity 45 showed stronger reactivity of the primary motor cortex when observing live actions compared with videos, but also greater desynchronization of the brain cortex when observing goal-directed actions compared with non-goal-directed actions. 46 To our best knowledge, AOT in stroke patients has been investigated only in a study by Zhu et al. 47 They verified the activation of the primary motor cortex, measured by magnetoencephalography during observation and execution of “grasping a soft ball.” Therefore, the literature on the cortical responses of stroke subjects during the observation of videos with different features is limited.
Following the hypothesis that different video stimuli can evoke a greater or smaller cortical rhythms desynchronization that would promote a stronger or weaker cortical activation, this study aims to analyze the EEG recordings in stroke patients while observing different videos of task-specific upper limb movements and to define which category of actions may elicit stronger cortical activation in the observer’s brain.
Specifically, EEG recordings were compared during the observation of Finalized Actions (ADLs such as feeding, self-care, and external actions), Non-Finalized Actions (upper limb movements without a specific goal), and control videos (without the presence of a person or an animal). Analysis of cortical responses could lead to the selection of the most appropriate video stimuli to be used in future AOT-based stroke rehabilitation protocols.
Materials and Methods
This observational pilot study involved 2 Italian rehabilitation centers (A and B) and was conducted with the same standardized methodology for the patients’ recruitment and stimulation procedures. The written informed consent was signed by each subject. The treatment and evaluation protocol was approved by the Ethics Committee (code number: RP05/2018). The data processing was performed at center A.
Participants
The subjects were recruited from the outpatient facility of 2 rehabilitation centers involved in the study. The demographic and clinical data were collected from all participants: age, gender, stroke onset, affected side, and lesion location (classified by BAMFORD classification). All subjects were evaluated by senior Physical Therapists (PTs) before starting the experimental set-up with the following clinical assessment scales: National Institute of Health Stroke Scale (NIHSS); Chedoke-McMaster Stroke Assessment (CMSA); Modified Ashworth Scale-Upper Limb (MAS-UL); Fugl–Meyer Assessment-Upper Limb (FMA-UL; motor assessment range including the reflexes 0-66) 48 ; Frenchay Arm Test (FAT); and modified Barthel Index (mBI).
Patients with the following characteristics were considered eligible for the study:
Inclusion criteria: (1) adult subjects with chronic stroke (stroke onset ≥6 months); (2) first unilateral ischemic stroke confirmed by Magnetic Resonance Imaging; (3) segmental MAS-UL ≤2; (4) residual moderate to mild upper limb motor impairment due to stroke (FMA-UL >22) 49 ; (5) ability to maintain the sitting position at least for 30 minutes; (6) CMSA >1; (7) ability to comprehend the study instructions and give the informed consent.
Exclusion criteria: (1) hemorrhagic stroke; (2) bilateral stroke; (3) posterior fossa stroke (BAMFORD classification); (4) inability to perform the required motor tasks due to severe upper limb impairment (FMA-UL ≤22); (5) severe cognitive impairment; (6) neglect; (7) severe aphasia and/or apraxia.
This study concerns the first phase of a comprehensive clinical project (Clinical Trial Registration—www.clinicaltrials.gov. Unique identifier: NCT04047134.) which aims to assess the clinical and instrumental efficacy of AOT in chronic stroke survivors. Since the project includes the individuals’ upper limb movements both during the AOT and the assessment phases, subjects with severe impairment were not considered.
Experimental Setup
The following equipment was used for the administration of the AOT protocol and recording of the EEG signals: (1) a laptop to set up the video stimuli; (2) an EEG recording system. The EEG recording system was the EGI Geodesic 400 128-channel EEG (Electrical Geodesics Inc., Eugene, OR, USA) at Center A and the BrainAmp 64 channel EEG (Brain Product GmbH, Germany) at Center B. A tape measure defined the electrode position measuring the distances between nasion and inion and between left and right preauricular points. The synchronization between 2 devices was guaranteed by an in-house Python-based software programmed with PsychoPy 2.0 (Open Science Tools Ltd, UK).
The subjects were asked to sit on a chair in front of a desk with the laptop placed at about 50 cm of patient-display distance and to observe the video stimuli. The EEG electrode placement is shown in Figure 1, where only the highlighted electrodes were considered in the analysis. Environmental noises and lights were controlled. Before the start of the experimental procedure, a PT described the protocol to the patient. Patients were asked to carefully follow the instruction of the PT during each phase of the study. After setting up the system, the AOT stimulation protocol started by running the PsychoPy code for the signal synchronization and recording the EEG signals.
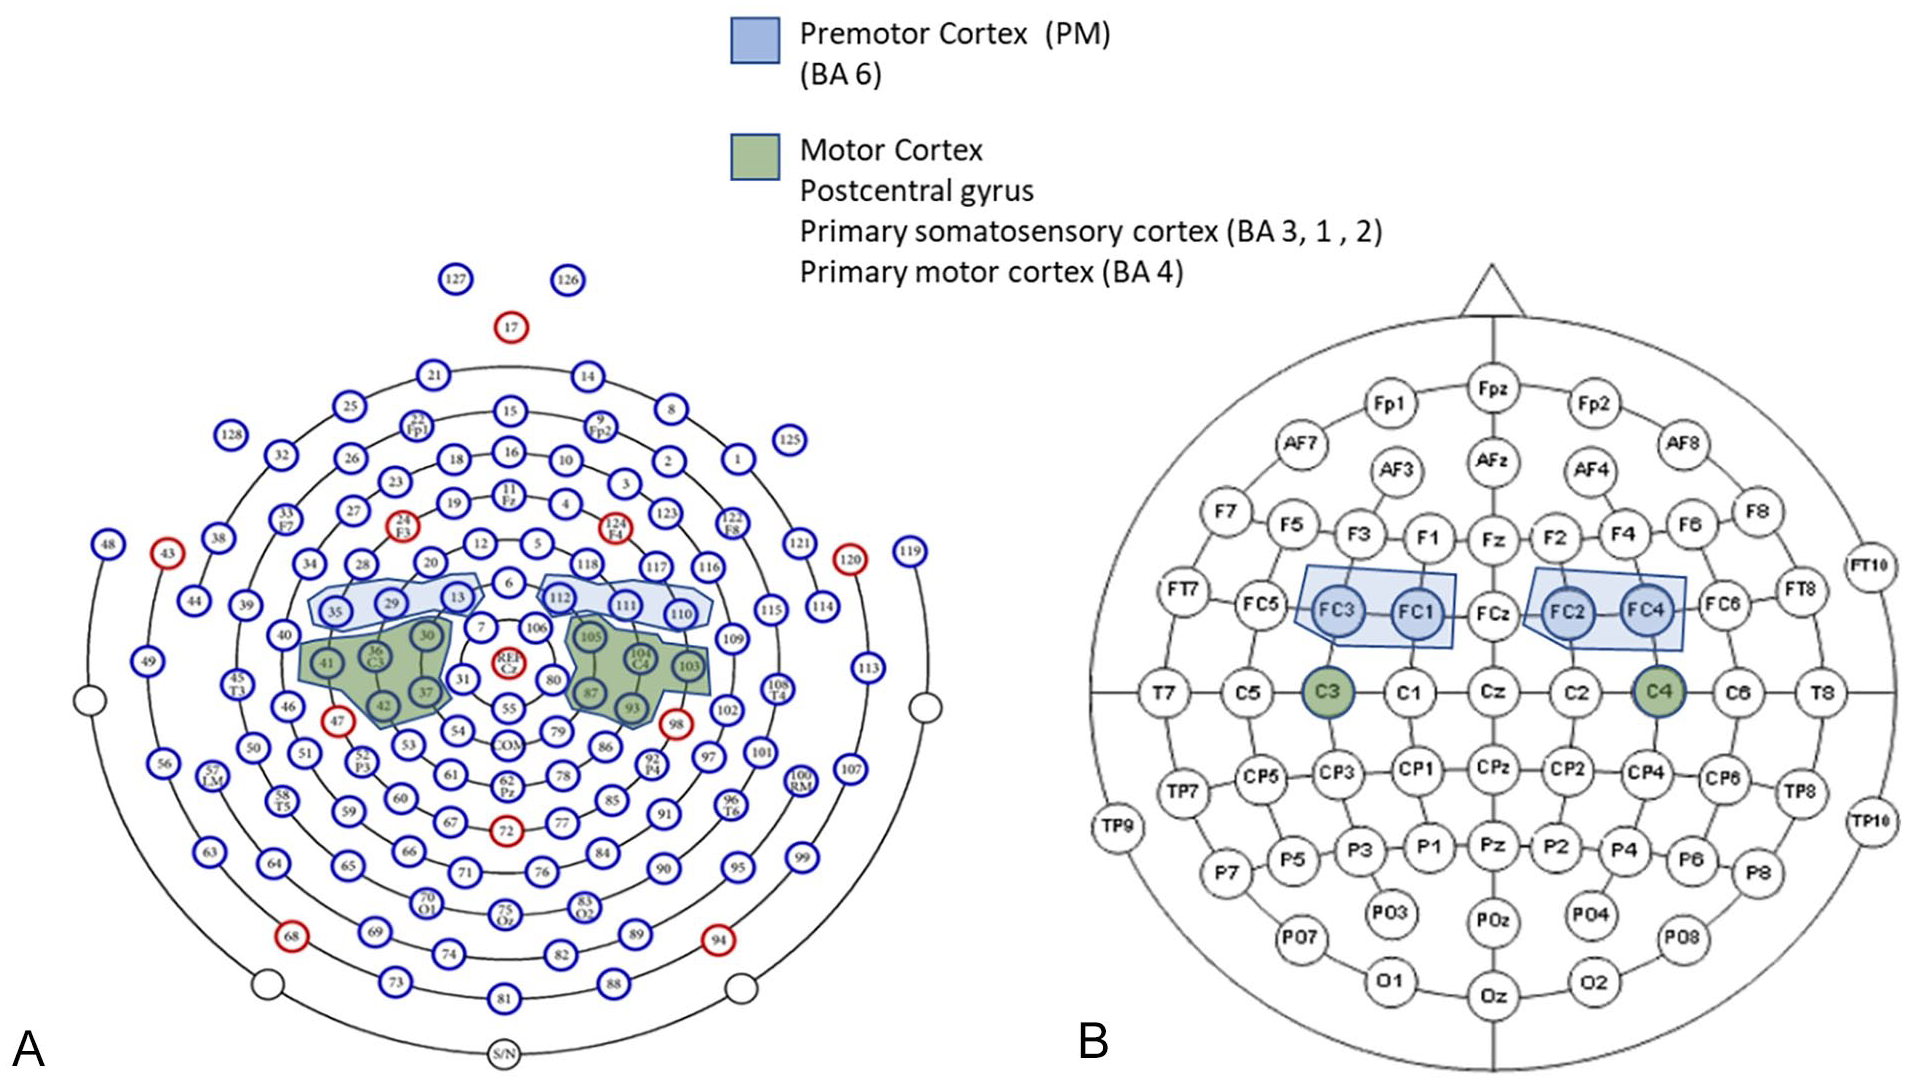
EEG electrode placement (only the highlighted electrodes were considered for the analysis). (A) Geodesic 400 128-channel EEG system. (B) BrainAmp 64-channel EEG system. Reprinted from manuals.
AOT Stimulation Protocol
The AOT stimulation protocol for each participant lasted approximately 30 minutes. The EEG recording was composed of 3 phases: (1) resting phase with open eyes for 3 minutes; (2) resting phase with closed eyes for 3 minutes; (3) stimulation phase consisting of the action observation protocol with 40 video stimuli randomly presented to prevent systematic and confounding carryover effects, each lasting 4 seconds and repeated for 3 times (Appendix). In detail, before each video stimulus, a black image (evt1) was displayed to verify the synchronization of the recorded areas. The duration of evt1 randomly varied from 3 to 4 seconds. Subsequently, an image of a white cross in the center of a black background (evt2) appeared to attract the patient’s attention and to avoid eye movement. The duration of evt2 was 500 ms. Finally, the video stimulus (evt3) was shown. During the stimulation phase, a sentence written in white color on a black background (evt4) was occasionally presented in order to control the attention level. It invited the patient to perform a simple motor task on the keyboard (eg, “press an arrow-key button”). The duration of the evt4 event depended on the patient’s response time.
The video stimuli (evt3) were divided into 2 main categories:
Human motion videos: 32 videos showing an actor’s performance of the upper limb movements during specific tasks.
Control Videos (CV): 24 videos showing landscapes (without the presence of a person or an animal).
Human motion videos were recorded in a home-like environment where the noise and illumination were controlled. The recordings were made by a digital video camera (24 fps; mp4 compression) with a resolution of 1920 × 1080 pixels. Human motion videos were further divided into the following sub-categories: Finalized Actions (FA) and Non-Finalized Actions (NFA).
The FA sub-category is the collection of videos showing FEeding Actions (FEA), Self-Care Actions (SCA), and External Actions (EA). In FEA videos, nutrition-related tasks were executed by the actor. The SCA included the simulation of self-care activities with the actor interacting with specific objects (eg, combing the hair or spraying deodorant under the armpit). The EA videos contained other actions regarding the ADLs (eg, opening a drawer or turning on the light).
The NFA sub-category was composed of upper limb targetless movements (eg, non-functional hand movements on a table without any object). The Appendix shows the description of each video.
In videos of the FA sub-categories (FEA, SCA, EA), 2 timestamps were manually set to distinguish 2 different phases of the stimulus: the first part, labeled the reaching phase, represents the initial intention to perform the action, the second part, labeled the completion phase, represents the conclusion of the action. In other words, the reaching phase is the time interval during which the actor reaches the object, and the completion phase is the time interval during which the actor finalizes the utilization of the grasped object.
EEG Data Processing
The EEG recordings were offline processed with MATLAB 2019 (The MathWorks, Inc., Natick, Massachusetts, United States) and the EEGLAB toolbox. 50
The EEG pre-processing was based on the following steps:
(1) Band pass filtering with an FIR filter set at 0.5 to 45 Hz Hamming window. The baseline correction (offset removing) was automatically solved by the 0.5 Hz cut-off.
(2) Manual bad channel rejection for all the channels that presented high impedances or out-of-range amplitude from the whole raw recording (from a minimum of 6 to a maximum of 17 removed channels per participant).
(3) Artifacts manual removal by Independent Component Analysis (ICA): after-ICA signals were carefully compared with pre-ICA signals to make sure the signals were correctly filtered and cleaned up.
Subsequently, the signals were filtered for µ (8-13 Hz) and β (15-20 Hz) EEG bands, and data was segmented considering each recorded event. Since the EEG recording systems were different in the center A and B, the software checked the electrodes’ position and averaged the signal from electrodes allocated into the same cerebral area. All the trials were detrended, filtered on µ and β bands, and phase-locked on the stimulus onset (eg, reaching phase for FA, movement onset for NFA, and 200 ms after the stimulus starting for CV). The subsequent step was trials’ averaging and normalization obtained by dividing the maximum value of the signal.
The ERD/ERS was described using (1) the time course of averaged signal power, and (2) the normalized power spectral density (PSD), this last approach gave the measures used as the primary outcome of the present study. As suggested in Pfurtscheller and Da Silva, 51 1-second-long reference EEG segments (“rest” period during evt1) and EEG data during the AOT stimulation (“event” period during evt3) were considered. Specifically, the 1-second-long reference data was identified by moving a 1-second-long window across the evt1 signals and finding the one having the minimum power variation. Thus, the temporal power ERD was calculated with the following formula:
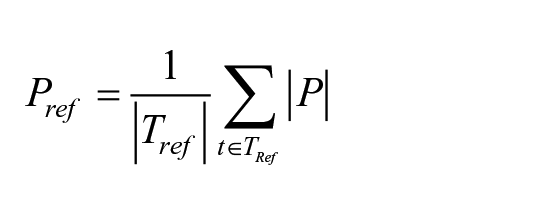
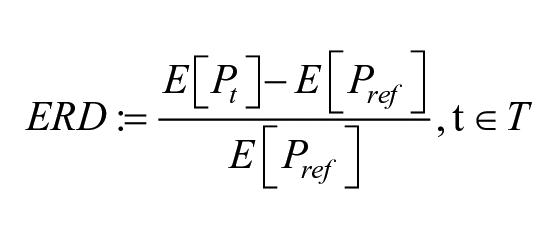
where P is the instantaneous power, Pref is the PSD of the “rest” period in the 1-second-long window Tref, Pt represents the PSD of the “task” period and E[. . .] is the expected value. The expected value is an average of the signal power map at a time lag and the 2 frequency bands of interest (µ and β). Finally, the average temporal power waveform between all sequences of each video clip category was obtained. In addition, a temporal trend of the signal power was performed. Whereas, the PSD was calculated using the Welch periodogram with a Hamming window of 128 samples and 50% overlap for both reference EEG and AOT segments.
The following video categories have been considered as “task” segments: FA and NFA videos, and CV. More in particular, the FA were further analyzed by comparing the ERD/ERS calculated in the reaching and completion phases.
A comparative analysis was made between the affected and unaffected hemispheres: we flipped the functional (EEG time series) and anatomical (scalp electrode positions) data of patients with left-side lesions along the midsagittal plane so that the ipsilesional side was in common across all patients.21,52,53 The Event-Related Desynchronization and Synchronization (ERD/ERS) of the µ and β rhythms during the observation of FA, NFA, and CV were calculated for the following cerebral areas: Affected Motor Cortex (AMC), Unaffected Motor Cortex (UMC), Affected Premotor Cortex (APC), and Unaffected Premotor Cortex (UPC) during the observation of FA, NFA, and CV.
The ERD/ERS normalized power spectral densities for µ and β bands calculated for reaching and completion phases of FA, NFA, and CV and of each FA sub-category (SCA, FEA, EA) were used as primary outcome measures.
In order to eliminate the risk of bias associated with the higher number of electrodes of the EGI Geodesic 400 128-channel EEG system compared to the BrainAmp 64-channel one (see Figure 1), a comparative analysis before the flipping procedure was conducted considering the single channels of the motor cortex (C3 and C4) for both the EEG systems.
Statistical Analysis
Since the data was not normally distributed (Shapiro–Wilk test), the Kruskal–Wallis test was applied to find differences between video stimuli (FA reaching phase, FA completion phase, NFA, and CV) in the 4 investigated cortical areas in µ and β bands. Consequently, the video categories were analyzed separately: The Dunn test was applied for multiple comparisons (ie, for verifying which stimuli elicit a greater neuronal enrollment).
Wilcoxon–Mann–Whitney tests on frequency domain values were applied to verify the absence of bias generated by the higher number of electrodes of the EGI Geodesic 400 128-channel EEG system with respect to the BrainAmp 64-channel one and to compare the affected and unaffected hemispheres.
The significance level was set at P < .05 (IBM SPSS Statistics for Windows, Version 26.0. Armonk, NY: IBM Corp).
Data Availability
The data supporting the findings of this study are available from the corresponding author on request.
Results
Thirty-six chronic stroke subjects were screened, and 21 subjects satisfied the inclusion/exclusion criteria. All recruited subjects gave informed consent to participate in the study. Two patients were excluded from the data processing: one subject due to the motion artifacts during the trials and the other one for the lack of attention paid to the tasks during data recording. Figure 2 presents the patients’ recruitment flowchart. Table 1 shows the clinical and demographic characteristics of the sample (N = 19). All patients were right-handed.
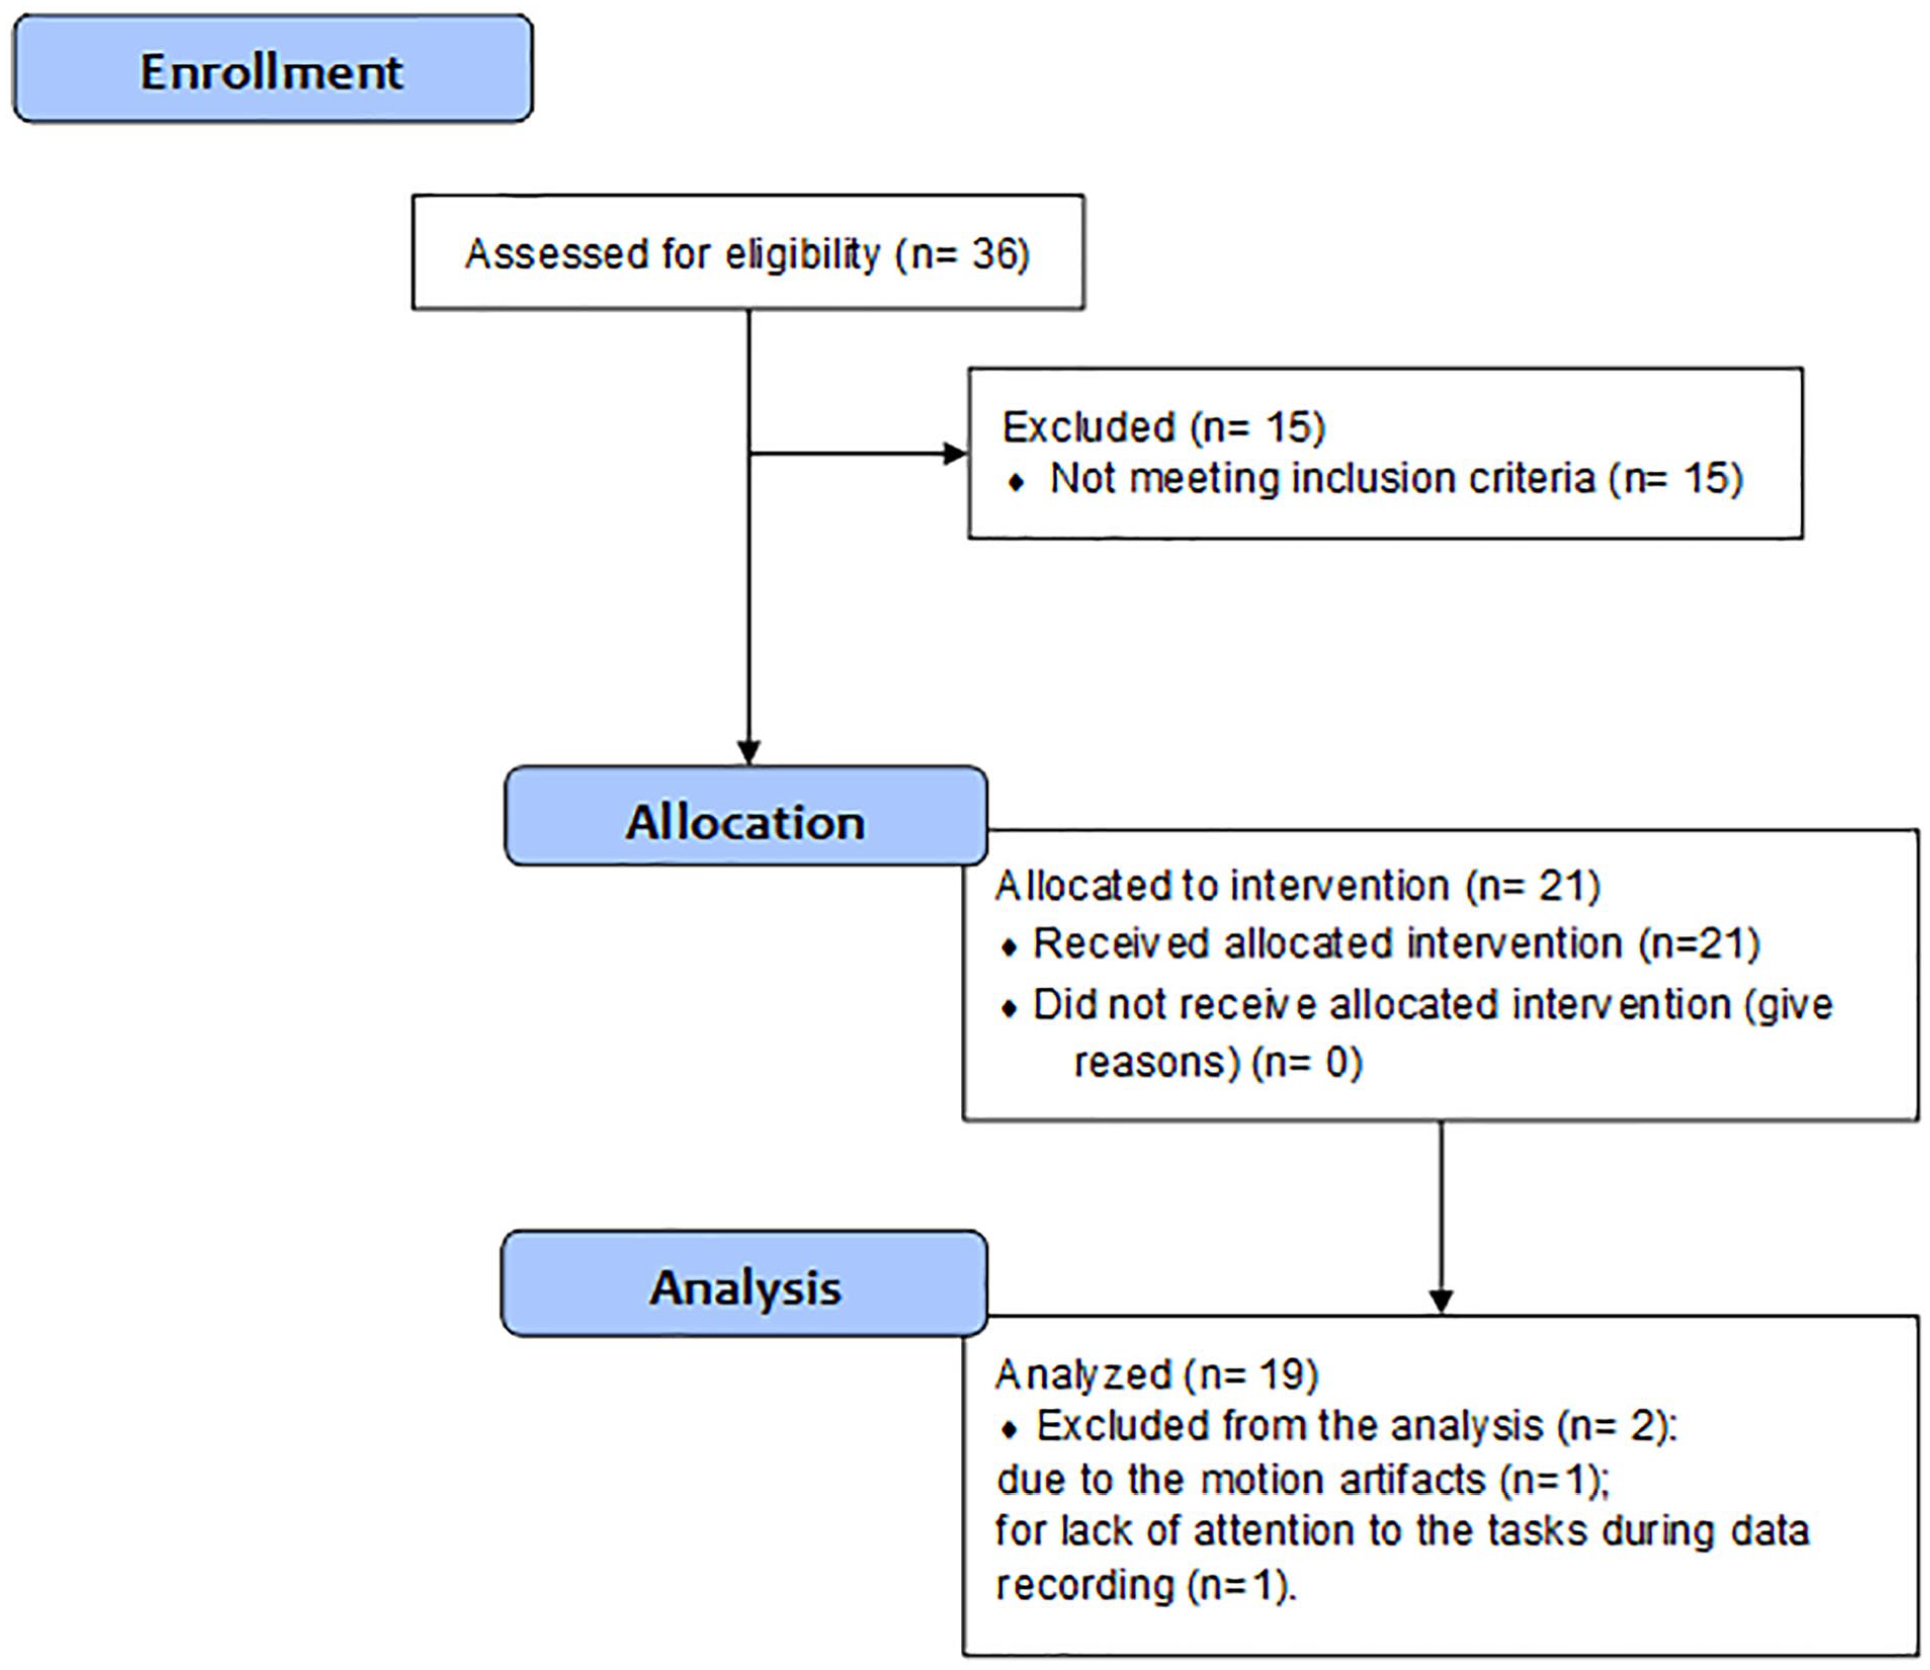
Patients’ recruitment flowchart.
Demographic and Clinical Characteristic of the Sample (N = 19).
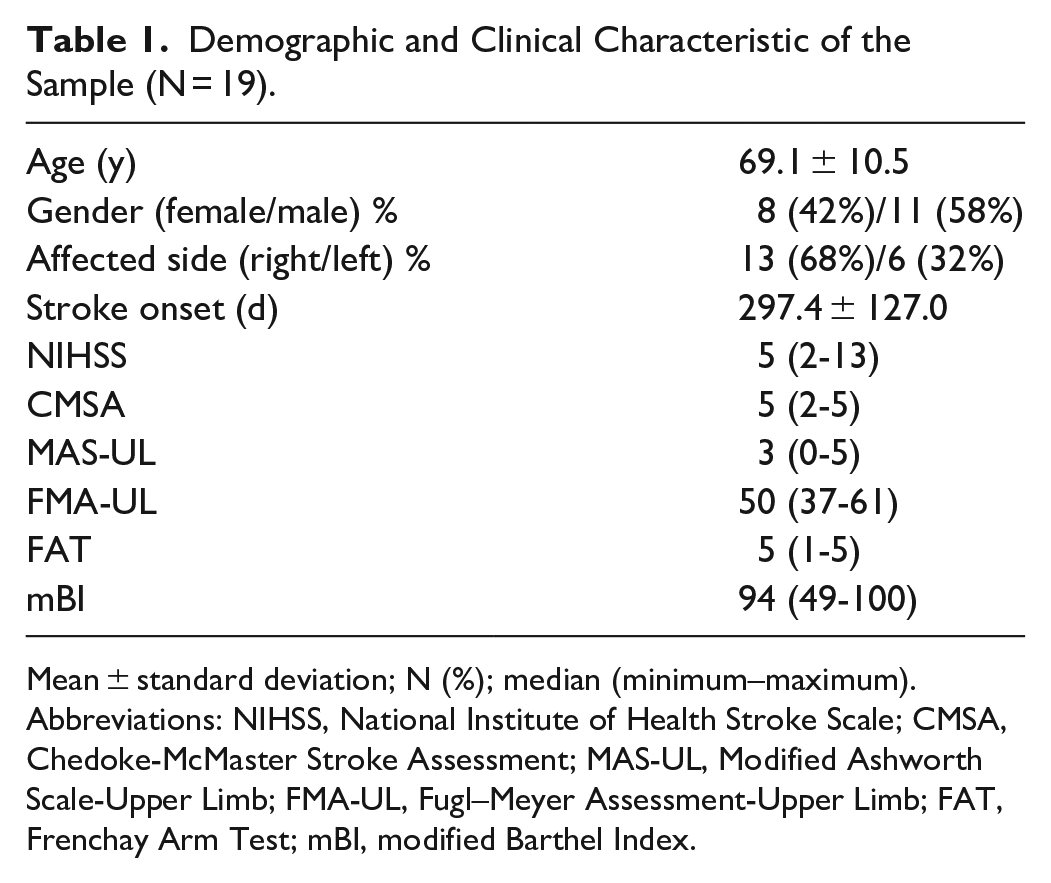
Mean ± standard deviation; N (%); median (minimum–maximum).
Abbreviations: NIHSS, National Institute of Health Stroke Scale; CMSA, Chedoke-McMaster Stroke Assessment; MAS-UL, Modified Ashworth Scale-Upper Limb; FMA-UL, Fugl–Meyer Assessment-Upper Limb; FAT, Frenchay Arm Test; mBI, modified Barthel Index.
The EEG systems comparative analysis between the single channels of the motor cortex (C3 and C4) and the average signal from electrodes distributed in the same cerebral area (Figure 1), revealed no significant differences (P > .05) in the ERD/ERS values in the frequency domain (see Supplemental Material). Therefore, the subsequent analyses were executed by considering the average signal from electrodes allocated in the same cerebral areas.
For descriptive purposes, Figure 3 shows the average across subjects (with shaded standard error) ERD/ERS time waveform for β and µ bands. Data depicts an event-related desynchronization when the subjects observed FA and NFA in all recorded areas, with the µ band more desynchronized than the β one. The trend was comparable in AMC, UMC, APC, and UPC.
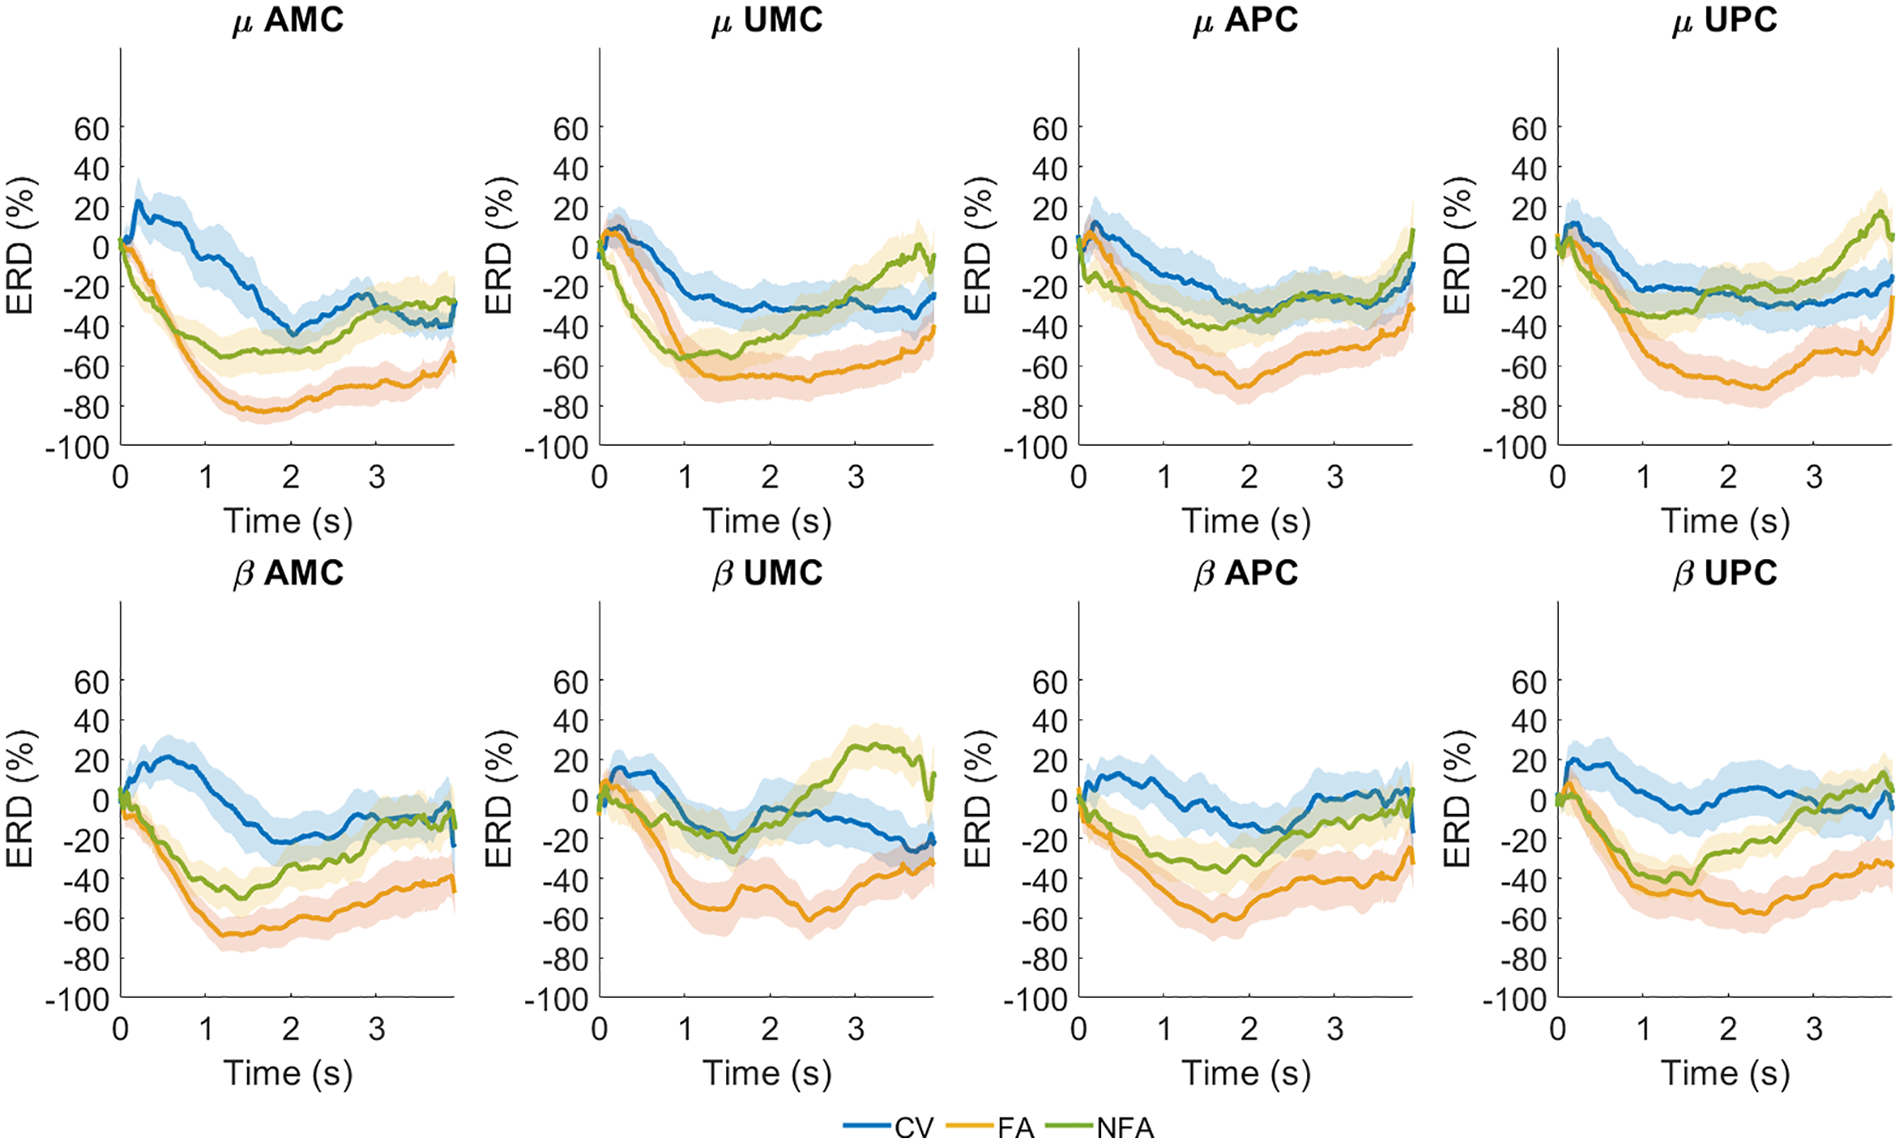
Time course of averaged signal power (mean and standard error) for µ and β bands in the Affected Motor Cortex (AMC), Unaffected Motor Cortex (UMC), Affected Premotor Cortex (APC), and Unaffected Premotor Cortex (UPC) during visual stimulation. Finalized Actions (FA), orange line; Non-Finalized Actions (NFA), green line; Control Videos (CV), blue line. Waveforms are depicted from stimulus onset to the end of the video (evt3).
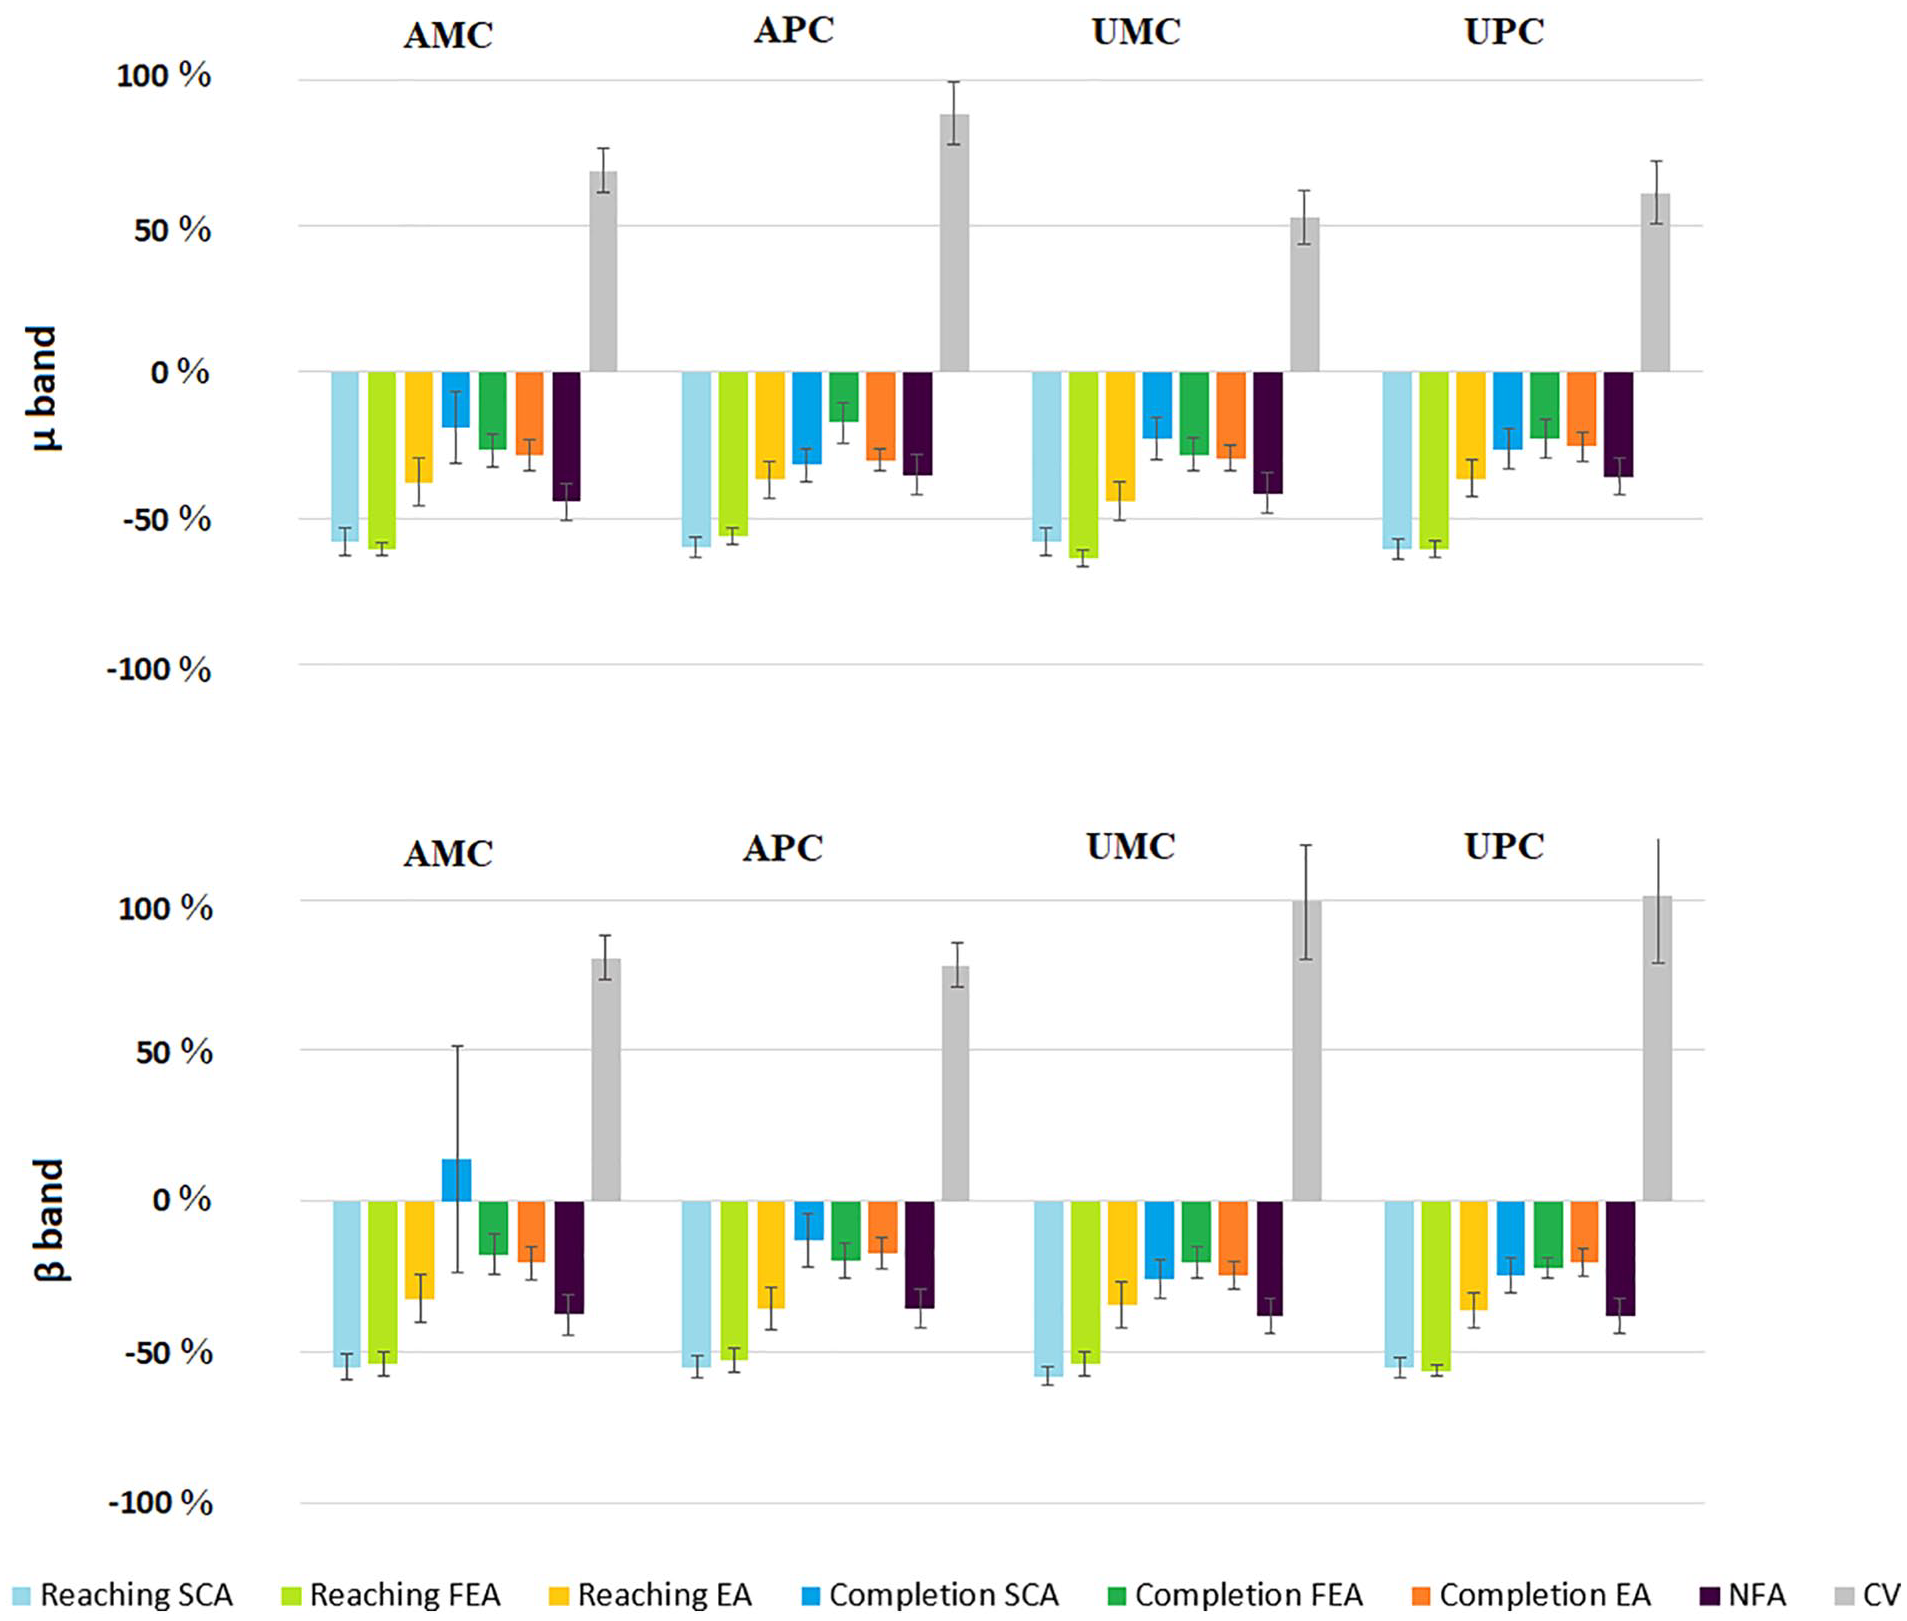
Table 2 and Figure 4 summarize the main results of the present study showing statistical results on the primary outcomes.
ERD/ERS Normalized Power Spectral Density. (A) In FA (Reaching and Completion), NFA, and CV. (B) In the Reaching Phase of FEA, SCA, and EA. Both the β and µ Bands Have Been Analyzed.
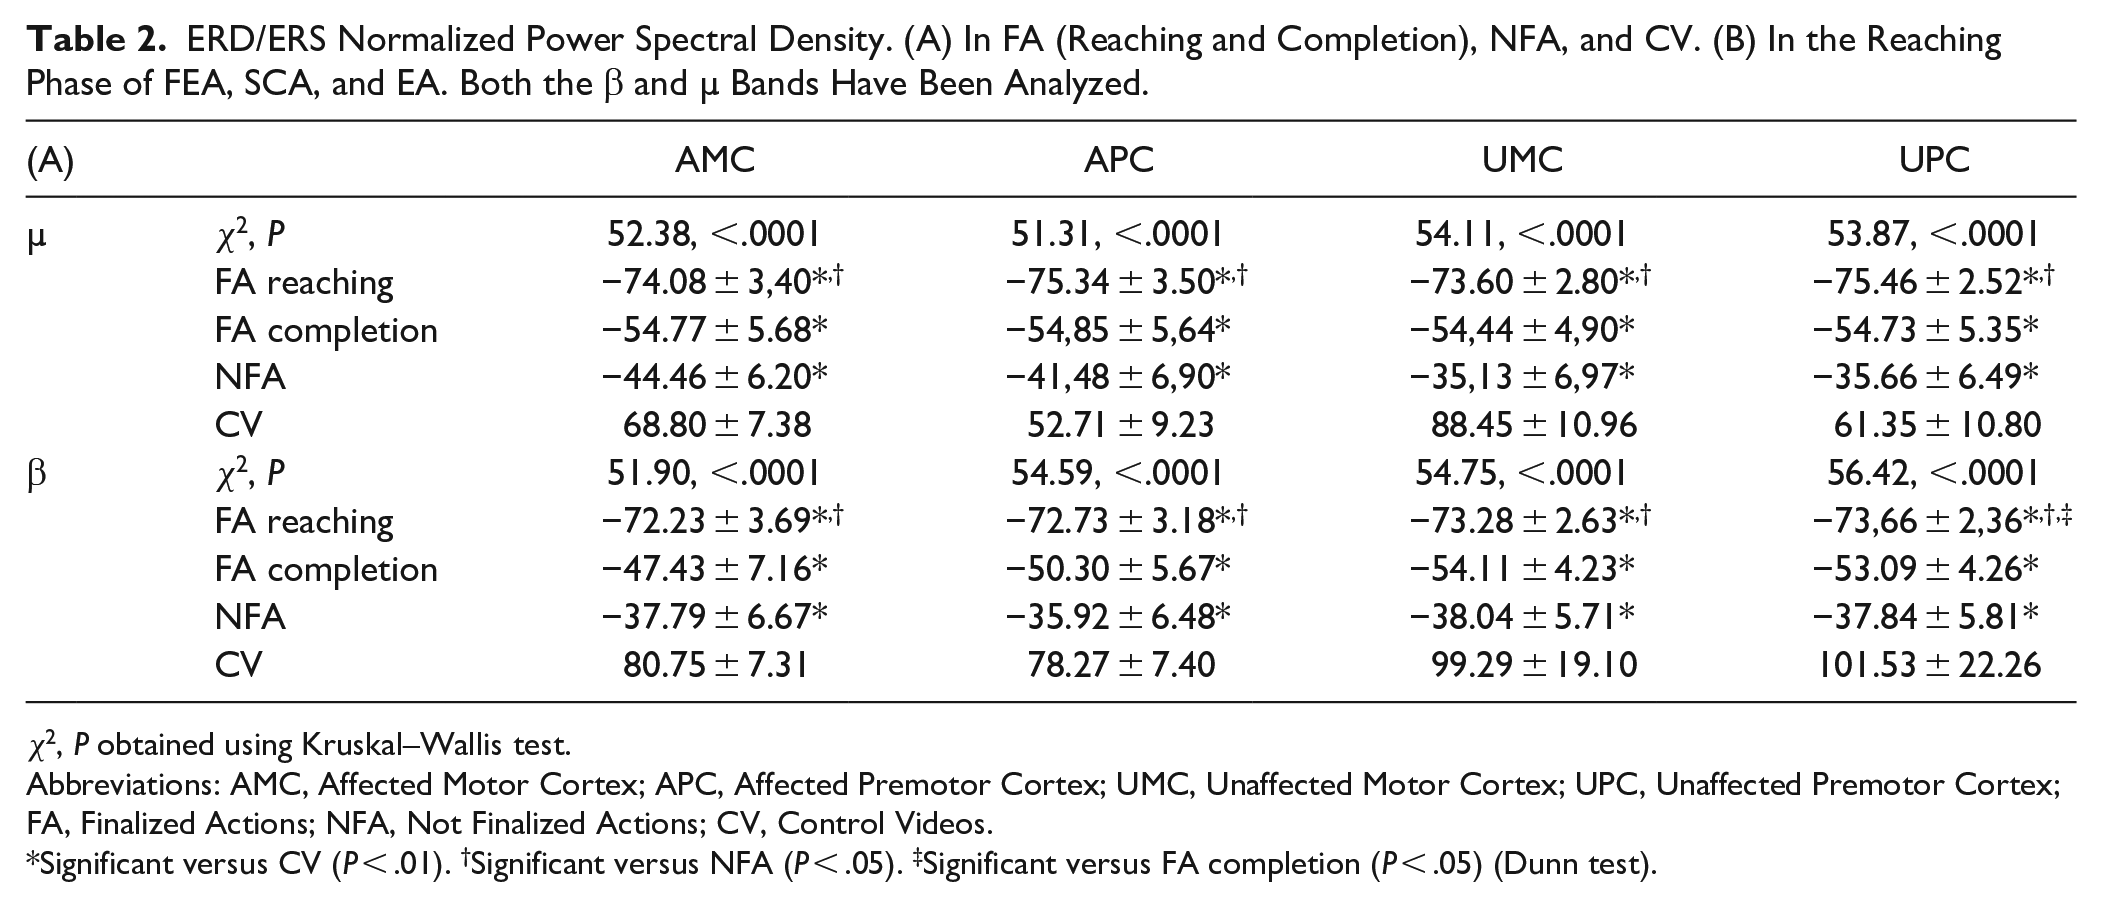
χ2, P obtained using Kruskal–Wallis test.
Abbreviations: AMC, Affected Motor Cortex; APC, Affected Premotor Cortex; UMC, Unaffected Motor Cortex; UPC, Unaffected Premotor Cortex; FA, Finalized Actions; NFA, Not Finalized Actions; CV, Control Videos.
Significant versus CV (P < .01). †Significant versus NFA (P < .05). ‡Significant versus FA completion (P < .05) (Dunn test).
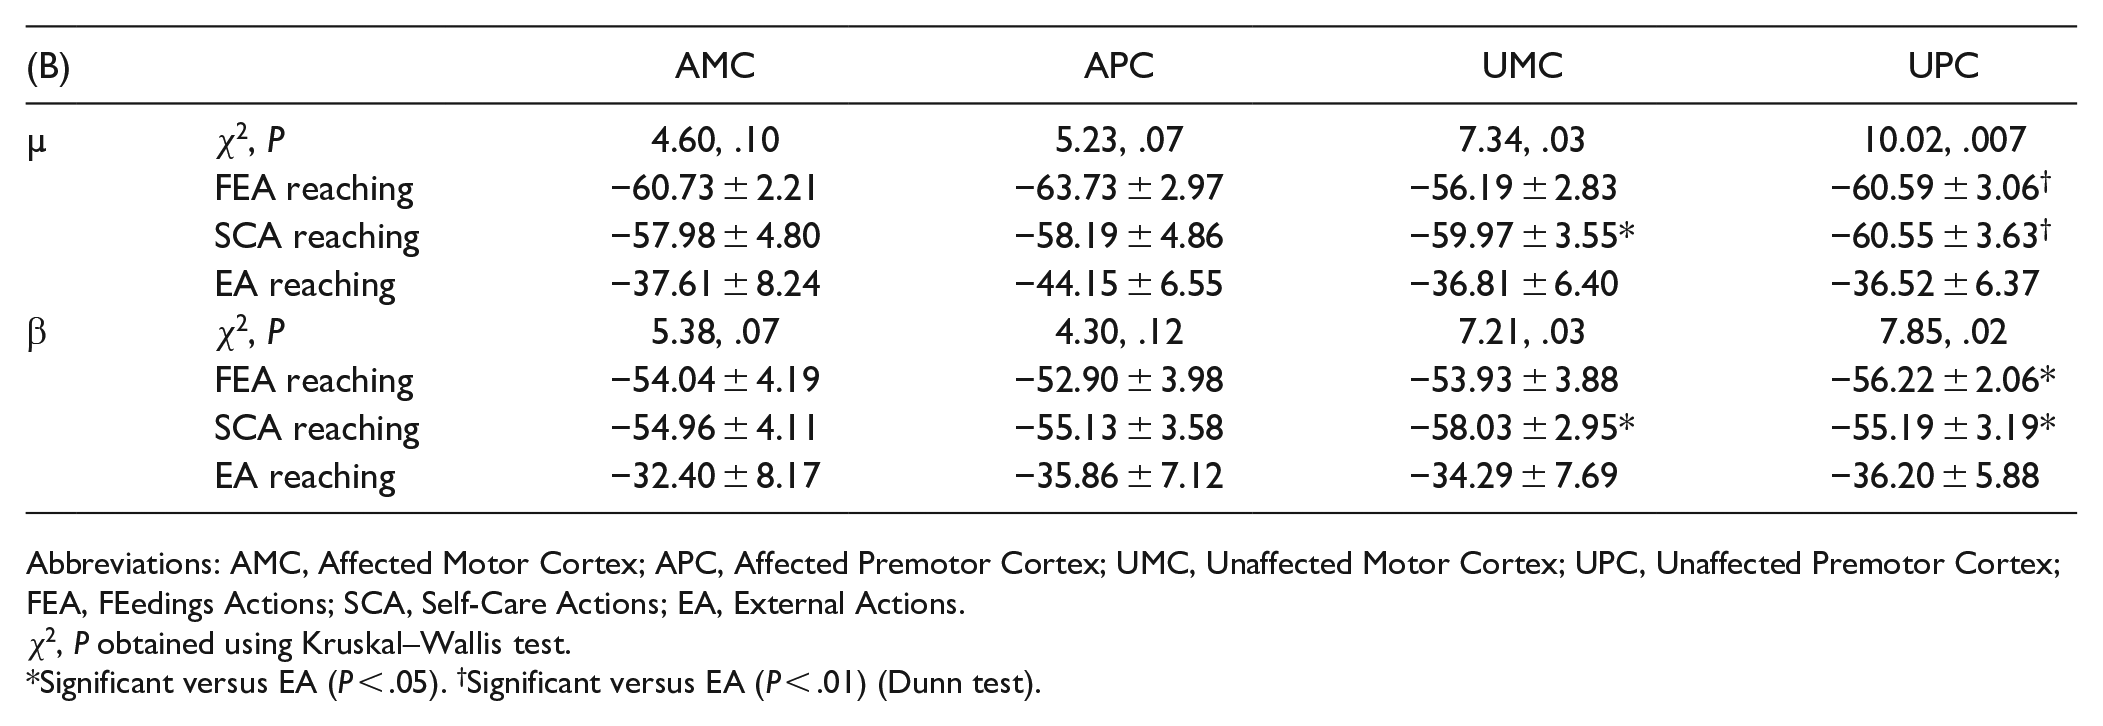
Abbreviations: AMC, Affected Motor Cortex; APC, Affected Premotor Cortex; UMC, Unaffected Motor Cortex; UPC, Unaffected Premotor Cortex; FEA, FEedings Actions; SCA, Self-Care Actions; EA, External Actions.
χ2, P obtained using Kruskal–Wallis test.
Significant versus EA (P < .05). †Significant versus EA (P < .01) (Dunn test).
The µ and β bands in the Affected Motor Cortex (AMC), Unaffected Motor Cortex (UMC), Affected Premotor Cortex (APC), and Unaffected Premotor Cortex (UPC): the ERD/ERS normalized power spectral density (PSD) calculated for reaching and completion phases of each Finalized Action (FA) sub-categories (SCA, Self-Care Actions; FEA, FEedings Actions; EA, External Actions) and the Non-Finalized Actions (NFA) and Control Videos (CV) categories.
Data in Table 2A shows the ERD/ERS normalized PSD of FA considering the reaching and completion phases, separately. Both FA (reaching and completion phases) and NFA desynchronized the EEG and were significantly different from the CV which tended to synchronize the EEG. Moreover, the ERD/ERS normalized PSD of the FA reaching phase was significantly different from the NFA one. The FA reaching phase induced a strong event-related desynchronization in all considered bands and cortical areas. This outcome was significantly different regarding the UPC in the β band compared to FA completion phase, NFA, and CV and for all areas in both µ and β bands compared to NFA and CV. On the other hand, the FA completion phase and the NFA were significantly different from CV only.
Considering the FA reaching phases of FEA, EA, and SCA sub-categories, the Kruskal–Wallis test revealed different cortical activations (Χ2 and P are shown in Table 2). The post hoc analysis (Table 2B) showed no significant differences in the affected hemisphere in both bands. In the unaffected hemisphere, the SCA reaching phase revealed a significant desynchronization in both β (UMC and UPC) and µ (UMC) bands compared to EA. The UPC registered a similar event-related desynchronization for both FEA and SCA with respect to EA.
The comparative analysis between the affected and unaffected hemispheres revealed no significant differences (P > .05) for both µ and β bands in the 4 considered areas.
Figure 4 depicts the ERD/ERS normalized PSD areas calculated considering the reaching and completion phases of each FA sub-category (FEA, EA, SCA), NFA, and CV. In both β and µ bands, the FA (FEA, EA, SCA) and NFA induced a desynchronization, while the CV caused an ERD/ERS synchronization. A similar trend can be observed in most of the considered cortical areas, and for both β and µ bands.
Discussion
The use of videos showing motor actions is the fundamental tool underlying the theoretical framework aimed at rehabilitation of the motor system of stroke subjects by MNS stimulation. Therefore, the main process underlying this approach is the activation of the central nervous system in response to the reception of visual stimuli. Brain responses to the observation of actions are a well-known topic that should involve a methodical evaluation of the series of stimuli to be applied. The decision to maximize the cortical response to the stimuli could be interpreted as another step toward optimizing AOT. There are several characteristics of the video stimuli that may contribute to the observer’s brain response. These features may be physical (such as brightness or the amount of motion contained in the videos), related to the position of the observer, or linked to the type of objects being manipulated (common objects of everyday life or neutral objects).
In this context, our study sought to examine the effects of observing video sequences on premotor and motor cortexes in order to find the subset of videos that may elicit greater neural recruitment of the MNS in chronic stroke subjects. Following previous findings, our study was conducted with the repetition of short stimuli (lasting 4 seconds each), frontal perspective, use of the daily life’s objects, and finalized actions. The novelty proposed consisted in the investigation of the cortical response in relation to the type of finalized actions used in the video stimulus.
In the present study, the EEG signals of 19 patients were analyzed during the observation of videos belonging to categories defined by the type of actions reproduced and the presence or absence of a person and objects. In accordance with Zhu et al, 47 we recruited patients with both right and left hemisphere injuries. This decision was made because of the observational nature of our study and because the analysis was based on a single session of action observation rather than a period of AOT. Data were analyzed by flipping the EEG time series along the midsagittal plane so that the ipsilesional side was to the same for all patients, with a procedure consistent with Fallani et al 52 and Pichiorri et al. 53 The inclusion of patients with both right- and left-sided hemisphere damage is also supported by the recent clinical systematic reviews of AOT by Buchignani et al 54 and Zhang et al. 29
Since the suppression of µ and β rhythms in the motor cortex is considered as a neuro-marker of the MNS activation, 17 the event-related desynchronization and synchronization of these rhythms in the premotor and motor cortices were calculated for each video category. The outcome revealed differential effects of video sequences in activating the patients’ MNS.
The observation of FA, characterized by a person conducting actions with a specific aim, elicited the maximum desynchronization in both µ and β rhythms (described by average temporal power waveforms). This outcome is confirmed with the analysis of EEG recordings during the observation of each FA sub-category (FEA, SCA, EA). Specifically, the observation of the reaching phase of FEA and SCA produced comparable values of ERD/ERS normalized PSD areas, which were different from the same phase of EA in the UPC. On the other hand, the completion phase of each sub-category elicited less desynchronization in both β and µ bands.
The figure of the temporal trend of desynchronization shows an expected reactivity for the µ and the β rhythms during action observation, similar to Angelini et al. 40 This refers to the component in the 8 to 13 Hz band (µ rhythm), commonly associated with sensorimotor function, and to the component in the 15 to 20 Hz band (β rhythm), which is associated with motor control.
Observation of NFA, characterized by a person performing actions without a specific goal, resulted in a desynchronization of the 2 rhythms. However, the modulation of the normalized range of PSD area indicated less activation of the MNS compared with FA. These findings are consistent with those of Järveläinen et al 46 who found weak desynchronization of the brain cortex during the observation of non-goal-directed actions.
In contrast, observation of CV (landscapes without the presence of a person or an animal) triggered an ERD/ERS synchronization, which was significantly different from both FA and NFA categories. This outcome might be related to the non-activation of the MNS during these visual stimuli.
Comparison between observation of the motor actions with functional purpose and non-functional actions showed greater desynchronization in the former compared with the latter. Although differences in cortical activity between observing and performing a movement have been shown in the literature, few studies on able-body subjects have addressed neural correlates when observing actions with different purposes or target-directed versus non-target motion.55,56 Furthermore, our results showed that during the observation of an action, a more pronounced β and µ band power desynchronization occurred in the reaching phase than in the completion phase. This could be due to a rebound effect as shown by Avanzini et al 55 in the central and parietal cortices but thanks to a careful analysis of the results obtained with NFA, this hypothesis can be ruled out in our study. Indeed, the rebound effect was revealed during the NFA videos, whereas it was less evident in FA, where there was no rebound effect but a slight modulation of the power of cortical rhythms.
The comparative analyses between the affected and unaffected hemispheres revealed no significant differences suggesting the bilateral activation of MNS. It was shown, in fact, that even in the face of the observation of unilateral tasks, the observer’s brain responds with a bilateral activation. This could be related to a brain-behavior experienced in the field of MNS imaging studies; for example, a confirmation of a bilateral activation for both action observation and imitation was obtained by Caspers et al, 57 running a meta-analysis of 139 functional magnetic resonance and positron emission tomography studies, Furthermore, the bilateral activation of MNS was also reported by Cole and Barraclough 58 investigated MNS response measuring corticospinal activity during a protocol of Transcranial Magnetic Stimulation. The eventual unilateral activation, even of a small entity, linked to the lateralization of the lesion or the exact context of stimuli administered should be addressed using a larger sample in future studies.
Indeed, a limitation of this study concerns the relatively small number of stroke patients, which should be addressed in future large clinical studies. Future research should exhaustively compare desynchronization between reaching and completion phases, separating the observed stimuli instead of the completion that constantly follows the reaching as presented in the current study.
Conclusions
This study analyzed the EEG recordings during the video-based action observation and found the categories of motor tasks that caused stronger cortical responses. An increased suppression of β and µ bands occurred during the observation of finalized upper limb movements including self-care and feeding actions. Moreover, the reaching phase of each action led to a stronger desynchronization compared to the completion phase. The results of this study could help clinicians to define optimized AOT protocols to elicit an effective activation of the MNS and draft clinical trials to prove the effect it could have on stroke patients.
Supplemental Material
sj-doc-1-nnr-10.1177_15459683221110884 – Supplemental material for The Reaching Phase of Feeding and Self-Care Actions Optimizes Action Observation Effects in Chronic Stroke Subjects
Supplemental material, sj-doc-1-nnr-10.1177_15459683221110884 for The Reaching Phase of Feeding and Self-Care Actions Optimizes Action Observation Effects in Chronic Stroke Subjects by Marco Franceschini, Marco Ottaviani, Paola Romano, Michela Goffredo, Sanaz Pournajaf, Margherita Lofrumento, Stefania Proietti, Irma Sterpi, Enrica Tricomi, Peppino Tropea, Massimo Corbo, Luciano Fadiga and Francesco Infarinato in Neurorehabilitation and Neural Repair
Footnotes
Appendix
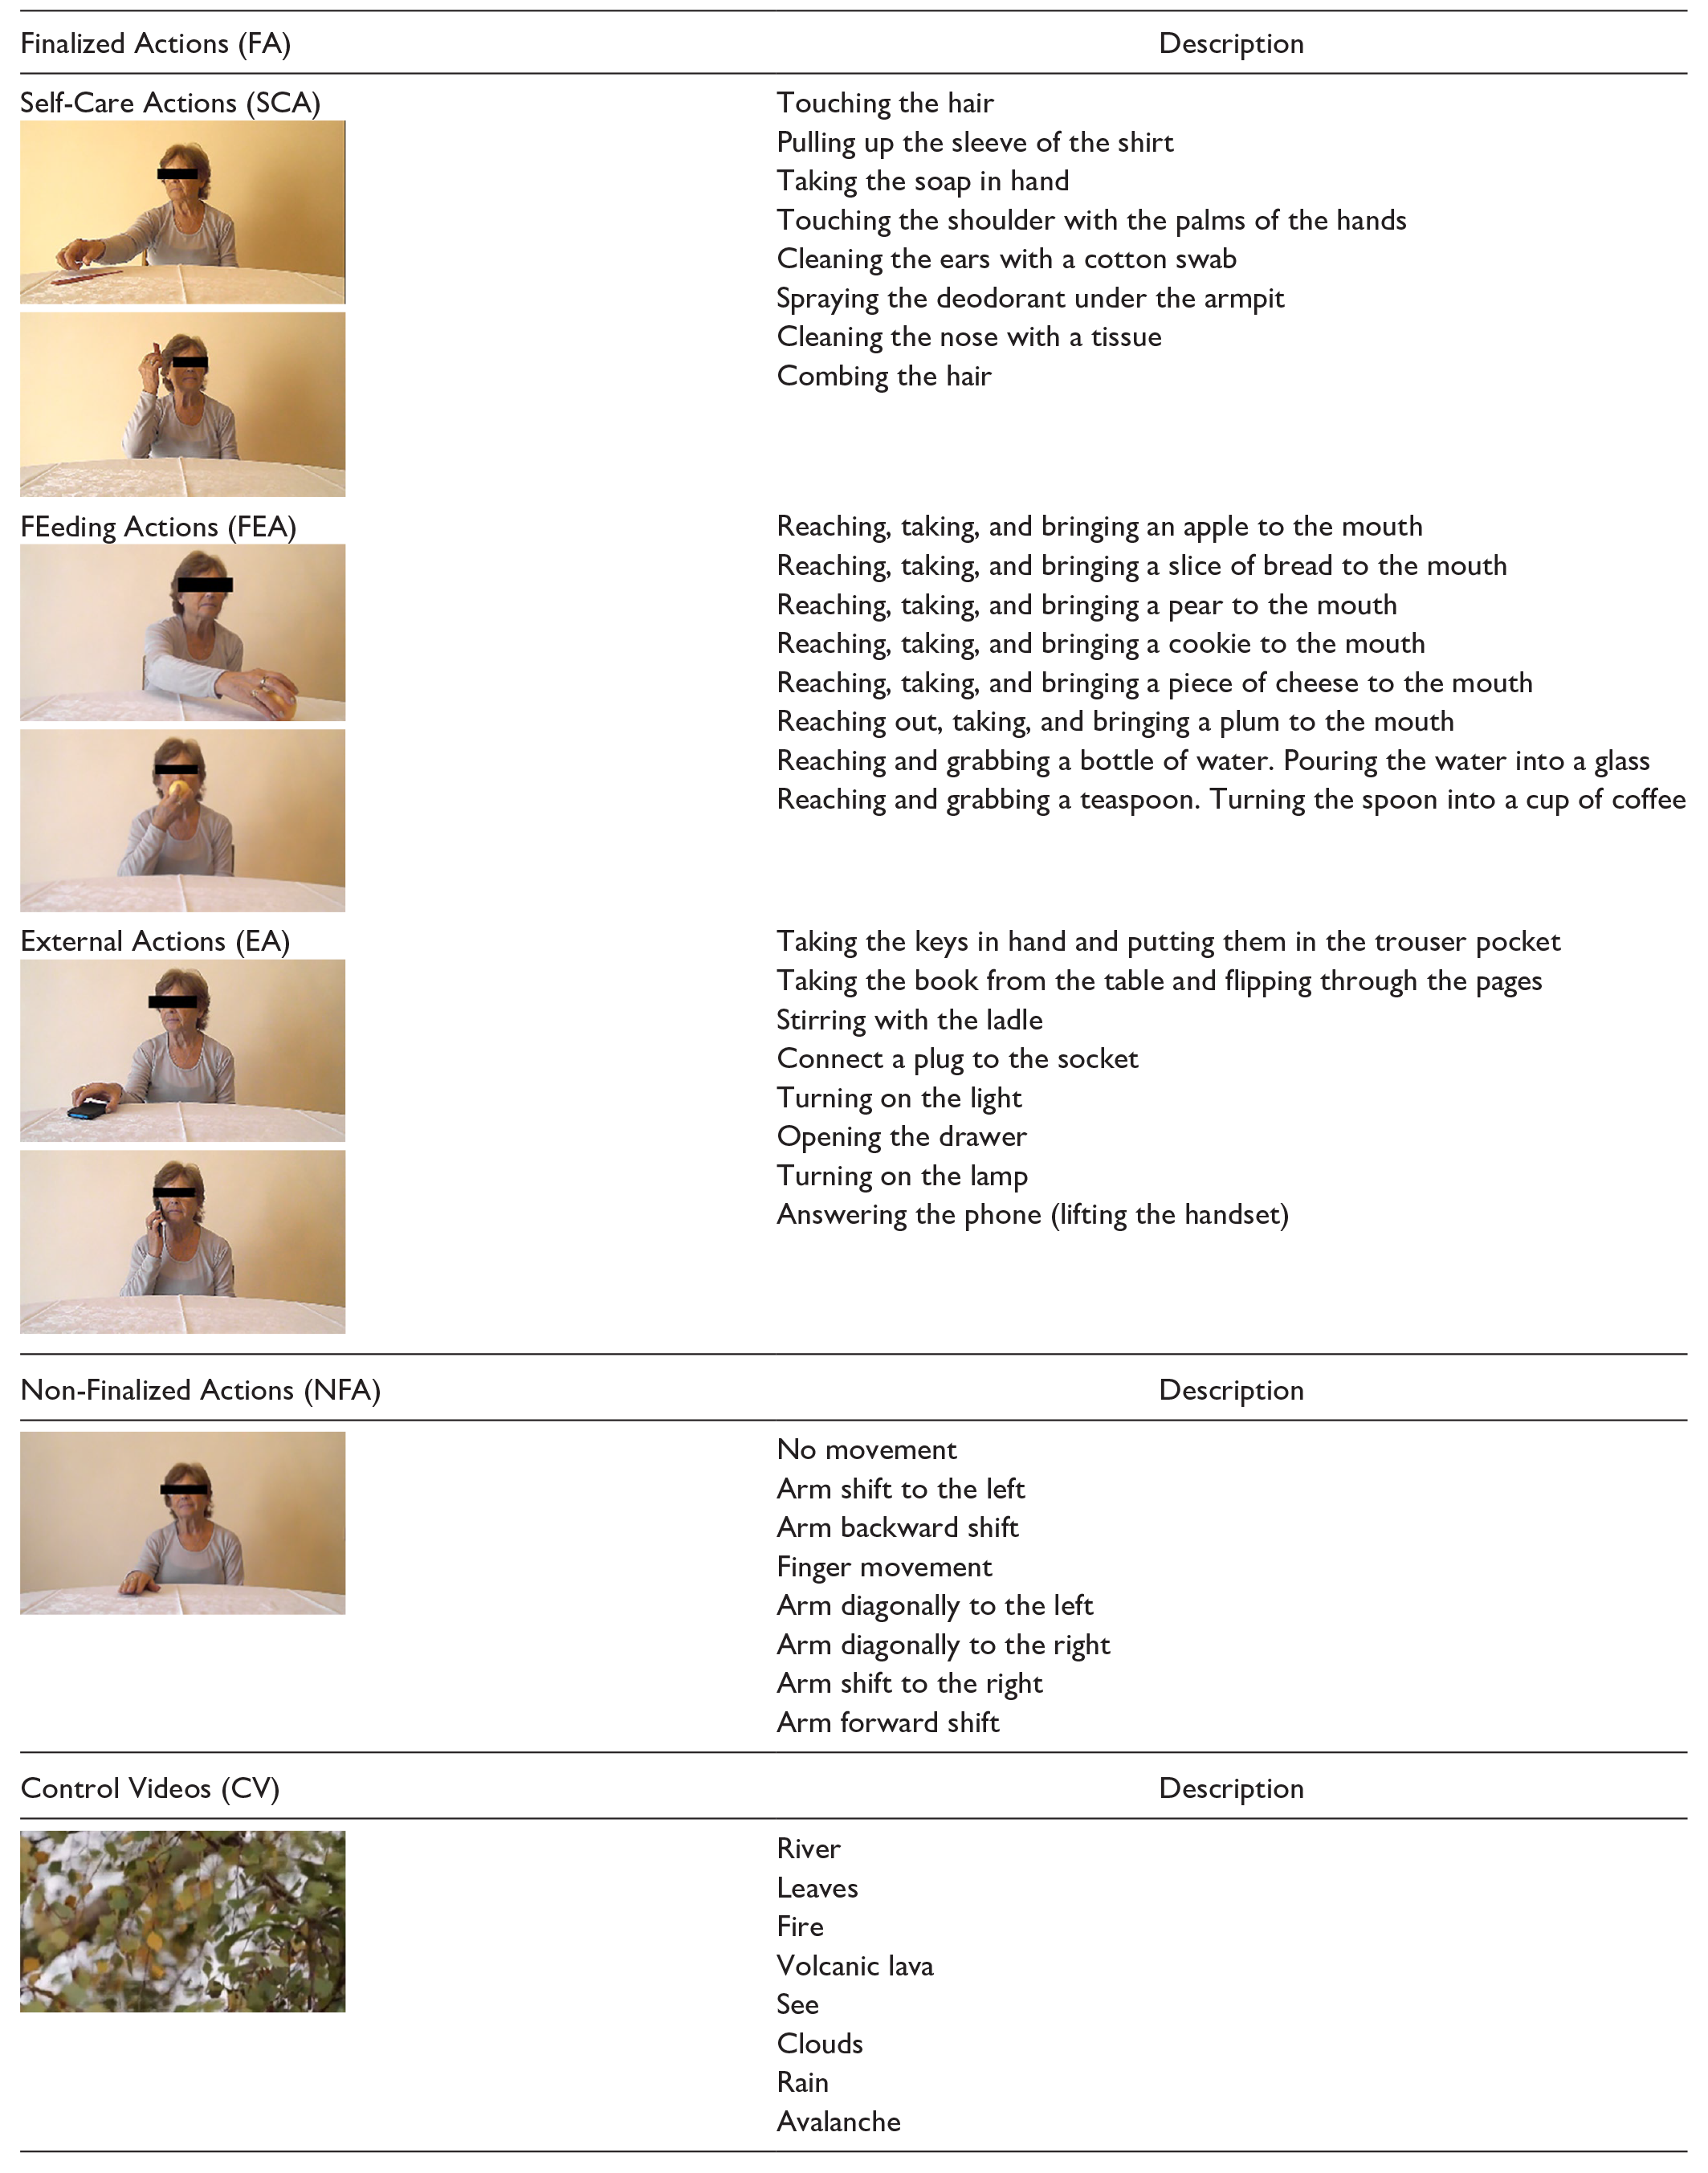
| Finalized Actions (FA) | Description |
|---|---|
| Self-Care Actions (SCA) |
Touching the hair |
| Pulling up the sleeve of the shirt | |
| Taking the soap in hand | |
| Touching the shoulder with the palms of the hands | |
| Cleaning the ears with a cotton swab | |
| Spraying the deodorant under the armpit | |
| Cleaning the nose with a tissue | |
| Combing the hair | |
| FEeding Actions (FEA) |
Reaching, taking, and bringing an apple to the mouth |
| Reaching, taking, and bringing a slice of bread to the mouth | |
| Reaching, taking, and bringing a pear to the mouth | |
| Reaching, taking, and bringing a cookie to the mouth | |
| Reaching, taking, and bringing a piece of cheese to the mouth | |
| Reaching out, taking, and bringing a plum to the mouth | |
| Reaching and grabbing a bottle of water. Pouring the water into a glass | |
| Reaching and grabbing a teaspoon. Turning the spoon into a cup of coffee | |
| External Actions (EA) |
Taking the keys in hand and putting them in the trouser pocket |
| Taking the book from the table and flipping through the pages | |
| Stirring with the ladle | |
| Connect a plug to the socket | |
| Turning on the light | |
| Opening the drawer | |
| Turning on the lamp | |
| Answering the phone (lifting the handset) | |
| Non-Finalized Actions (NFA) | Description |
| No movement | |
| Arm shift to the left | |
| Arm backward shift | |
| Finger movement | |
| Arm diagonally to the left | |
| Arm diagonally to the right | |
| Arm shift to the right | |
| Arm forward shift | |
| Control Videos (CV) | Description |
| River | |
| Leaves | |
| Fire | |
| Volcanic lava | |
| See | |
| Clouds | |
| Rain | |
| Avalanche |
Declaration of Conflicting Interests
The author(s) declared no potential conflicts of interest with respect to the research, authorship, and/or publication of this article.
Funding
The author(s) disclosed receipt of the following financial support for the research, authorship, and/or publication of this article: This work was supported by the Italian Ministry of Health [ricerca corrente]; the Italian Ministry of Health [grant GR-2016-02361678].
Supplementary material for this article is available on the Neurorehabilitation & Neural Repair website along with the online version of this article.
References
Supplementary Material
Please find the following supplemental material available below.
For Open Access articles published under a Creative Commons License, all supplemental material carries the same license as the article it is associated with.
For non-Open Access articles published, all supplemental material carries a non-exclusive license, and permission requests for re-use of supplemental material or any part of supplemental material shall be sent directly to the copyright owner as specified in the copyright notice associated with the article.