
Abstract
Background. Abnormal brain excitability influences recovery after stroke at which time a prolonged transcranial magnetic stimulation (TMS)–induced electromyographic silent period is thought to reflect abnormal inhibitory interneuron excitability. Cortical excitability can be probed directly during the silent period using concurrent electroencephalography (EEG) of TMS-evoked responses. Objective. The primary study objectives were to characterize TMS-evoked cortical potentials (TEPs) using EEG and to investigate associations with persistent hand and arm motor dysfunction in individuals with chronic stroke. Methods. Thirteen participants with chronic stroke-related mild-moderate arm motor impairment and 12 matched controls completed a single TMS-EEG cortical excitability assessment. TEPs recorded from the vertex during cortical silent period (CSP) assessment and while at rest were used to evaluate differences in cortical excitability between stroke and control participants. Associations between TEPs and CSP duration with measures of upper extremity motor behavior were investigated. Results. Significantly increased TEP component peak amplitudes and delayed latencies were observed for stroke participants compared with controls during CSP assessment and while at rest. Delayed early TEP component (P30) peak latencies during CSP assessment were associated with less manual dexterity. CSP duration was prolonged in stroke participants, and correlated with P30 peak latency and paretic arm dysfunction. Conclusions. Abnormal cortical excitability directly measured by early TMS-evoked EEG responses during CSP assessment suggests abnormal cortical inhibition is associated with hand dysfunction in chronic stroke. Further investigation of abnormal cortical inhibition in specific brain networks is necessary to characterize the salient neurophysiologic mechanisms contributing to persistent motor dysfunction after stroke.
Introduction
Following a stroke, most individuals demonstrate lasting functional disability that is associated with diminished quality of life, increased morbidity, and higher health care costs.1,2 With an increased number of individuals living with poststroke impairments, the development of effective rehabilitation approaches is imperative. One strategy to improve the effectiveness of rehabilitation is to develop new approaches to define the neurobiological substrates contributing to incomplete functional recovery after stroke.
Transcranial magnetic stimulation (TMS) is a noninvasive brain stimulation approach used to evaluate changes in cortical excitability and connectivity in the primary motor cortex (M1) following stroke.3,4 Evidence suggests imbalances in ipsilesional (i) and contralesional (c) M1 excitability and connectivity (ie, decreased iM1 and increased cM1 excitability, increased interhemispheric inhibition from cM1 onto iM1)5,6 may persist into the chronic stage of recovery7,9 and may adversely affect functional outcomes.9-11 The cortical silent period (CSP) is one TMS assessment that reflects postsynaptic inhibition in the motor cortex mediated by both GABAA (type A γ-aminobutyric acid) and GABAB activation.12-14 Previous research reported abnormally prolonged CSP measures in stroke that may be related to functional recovery.5,15-17 However, standalone TMS provides an indirect and somewhat limited assessment of motor cortical excitability and connectivity, as outcomes (eg, motor-evoked potentials [MEPs] and CSP) are restricted to recording from peripheral muscles rather than directly from the brain. Due to the combined spinal and supraspinal contributions to the CSP, the exact origin of the electromyographic (EMG) CSP is unknown. 18 Furthermore, peripheral motor responses may not be present in many cases after stroke because of substantial corticospinal tract disruption.
Combining TMS with concurrent electroencephalography (EEG) allows for the direct characterization of cortical excitability and connectivity with excellent temporal resolution19-21 and repeatability in healthy individuals.22-24 TMS-evoked potentials (TEPs) are a series of positive and negative EEG deflections (components) time-locked to TMS delivery reflecting postsynaptic activity of local and distributed circuits, especially GABA-mediated inhibition.24-28 TMS-EEG approaches have the potential to identify unique neurophysiologic biomarkers of stroke recovery 29 ; however, few studies have been conducted to date. There is recent evidence to suggest that beta frequency (15-30 Hz) oscillations in primary sensorimotor cortical regions, which are related to movement,23,30 may be altered in stroke and associated with motor impairment.31,32 One study evaluated a single TEP component (N100) in individuals 1 week after stroke and its relationship to functional recovery at 3 months poststroke, 33 but to our knowledge, characterization of TEPs during the TMS-induced EMG silent period and the potential relationship between cortical markers of abnormal inhibition and motor dysfunction has not been elucidated in chronic stroke.
Identification of novel neurophysiologic biomarkers of persistent stroke-related disability have the potential to effectively guide the development of and identify responders to targeted, individualized therapeutic rehabilitative interventions to improve the restoration of arm function after stroke. For example, Brodie et al 34 demonstrated that the degree of neural substrate quantified with magnetic resonance imaging (MRI) was predictive of response to neuromodulation coupled with a novel rehabilitation training intervention in chronic stroke. TEP component characteristics quantified with synergistic TMS-EEG that reflect salient neuronal mechanisms for poststroke motor recovery could potentially serve as a similar clinically feasible prognostic biomarker in stroke survivors. Thus, the primary purposes of this article were 2-fold: (1) to characterize TEPs during TMS-induced EMG silent period in individuals with chronic stroke to study direct cortical markers of abnormal excitability and (2) to investigate the relationship between TEPs and persistent upper extremity motor dysfunction.
Materials and Methods
Participants
Thirteen individuals with subcortical ischemic stroke (age: 66 ± 10 years, 8 males) in the chronic stage (>6 months) of recovery participated in the single-session study protocol. Twelve healthy control individuals (age: 52 ± 15 years, 6 males) were also recruited and completed the study. Participant characteristics are shown in Table 1. Exclusion criteria included the following: (1) hemorrhagic stroke, (2) history of multiple strokes, (3) neurodegenerative disorder or psychiatric diagnosis, (4) outside the age range of 18 to 85 years, or (5) contraindications to TMS. 35 Written informed consent was obtained from all participants in accordance with the Declaration of Helsinki. Study procedures were approved by the Emory Institutional Review Board.
Control and Stroke Participant Characteristics. a
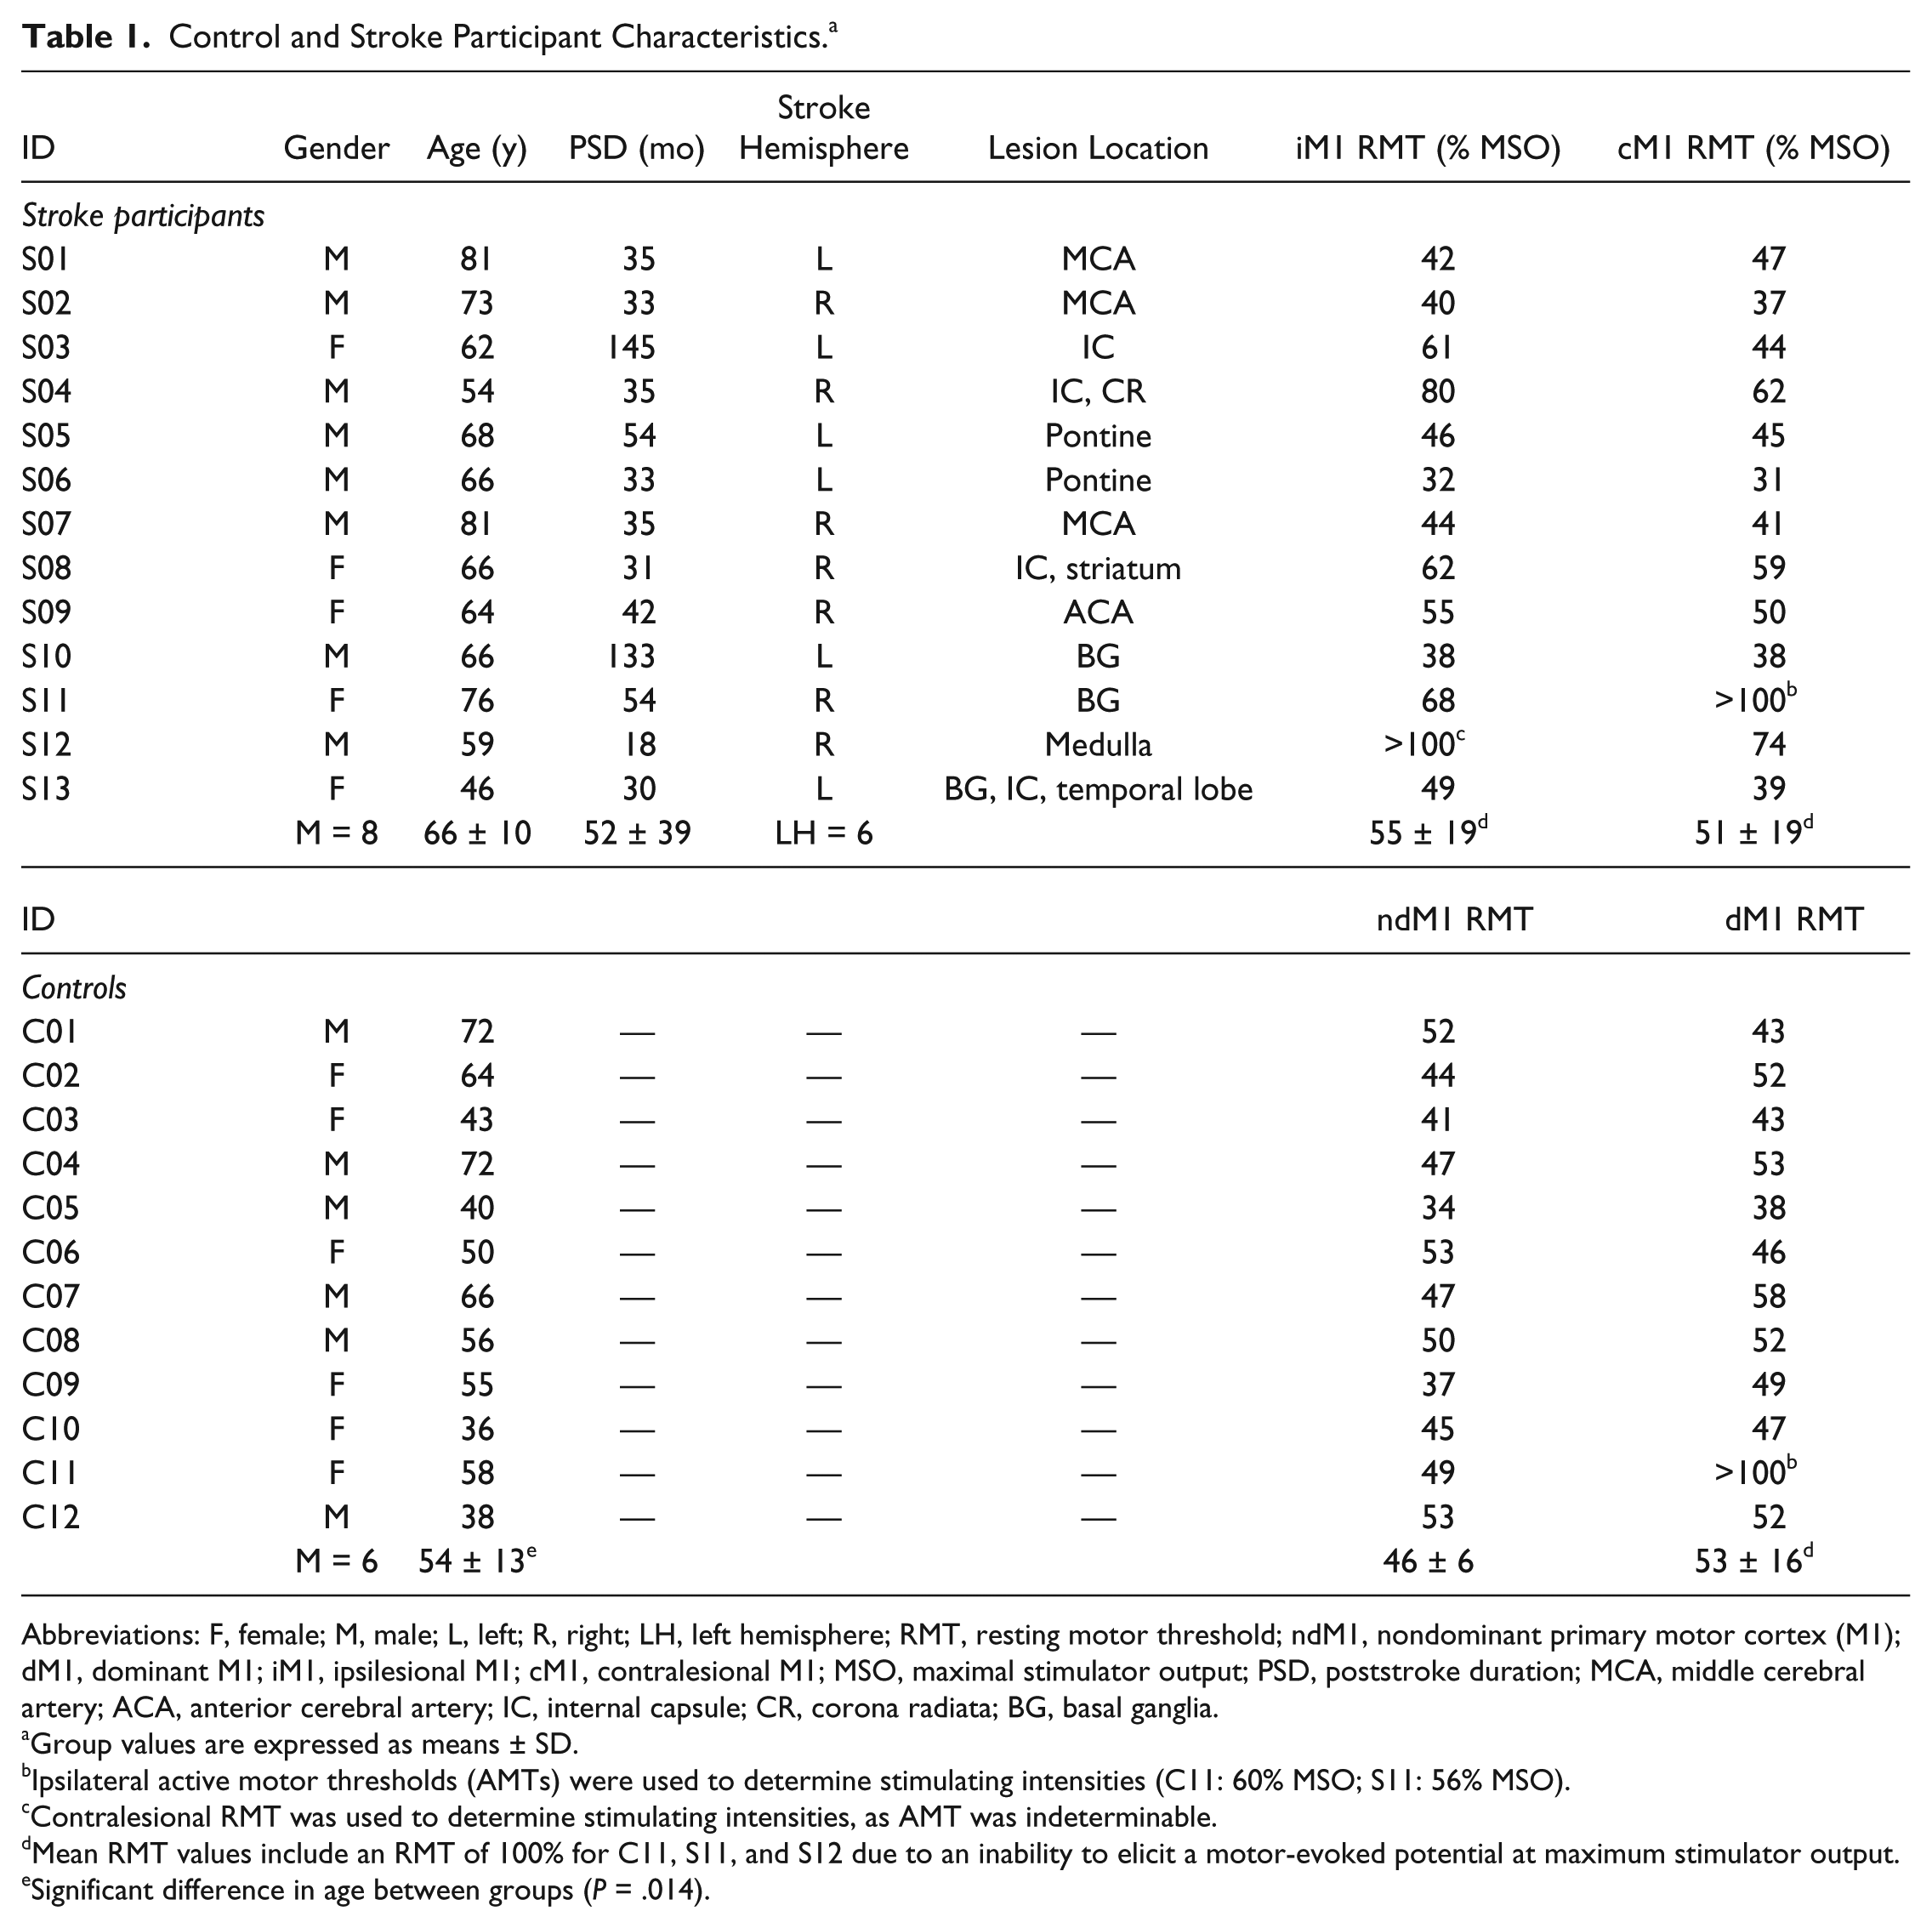
Abbreviations: F, female; M, male; L, left; R, right; LH, left hemisphere; RMT, resting motor threshold; ndM1, nondominant primary motor cortex (M1); dM1, dominant M1; iM1, ipsilesional M1; cM1, contralesional M1; MSO, maximal stimulator output; PSD, poststroke duration; MCA, middle cerebral artery; ACA, anterior cerebral artery; IC, internal capsule; CR, corona radiata; BG, basal ganglia.
Group values are expressed as means ± SD.
Ipsilateral active motor thresholds (AMTs) were used to determine stimulating intensities (C11: 60% MSO; S11: 56% MSO).
Contralesional RMT was used to determine stimulating intensities, as AMT was indeterminable.
Mean RMT values include an RMT of 100% for C11, S11, and S12 due to an inability to elicit a motor-evoked potential at maximum stimulator output.
Significant difference in age between groups (P = .014).
Procedures
Transcranial Magnetic Stimulation
Single TMS pulses were delivered using a figure-of-eight 70-mm coil (Magstim Company Ltd, Dyfed, UK) connected to a monophasic stimulator (Magstim 2002). At the beginning of the experimental session, the optimal coil position for eliciting maximal MEP responses in the abductor pollicis brevis (APB) muscle was determined. 36 Resting motor threshold (RMT) was determined bilaterally using standard procedures. 36 Quantifiable MEPs could not be elicited in one hemisphere in 3 participants (2 stroke: 1 ipsilesional (i)M1, 1 contralesional (c)M1; 1 control: dominant (d)M1); therefore, either ipsilateral active (A)MT 36 or contralesional RMT was used to determine stimulating intensities (see Table 1, footnotes b and c). The coil handle was pointed posterolaterally 45° to the sagittal plane to induce a current in the posterior-anterior direction. 37 T1-weighted magnetic resonance images were obtained for participants prior to the session and registered within neuronavigation software (Brainsight v. 2.2.14, Rogue Research Inc, Canada) to aid in determining the location of the optimal coil position and maintaining accurate placement of the coil throughout the testing session. Four stroke participants were unable to be scanned prior to the session, and a template MNI image was used for M1 targeting and real-time navigated TMS delivery. Earplugs were provided to each participant for comfort during stimulation and to reduce auditory artifact in the EEG recording. 38
Two TMS paradigms were performed to assess the effect of cortical motor state (active vs rest) on TEPs: CSP and single-pulse stimulation at 120% of RMT (SP120). For the CSP condition, participants were instructed to contract the APB contralateral to the hemisphere of stimulation to 20% of maximal voluntary contraction (MVC) as measured by a pinch dynamometer (Lafayette Instrument Company). To reduce the influence muscle fatigue on TMS responses, periodic rest breaks (every ~10 trials) were provided during the assessment. For the SP120 condition, participants maintained a resting muscle state throughout stimulation confirmed by an experimenter monitoring prestimulus EMG activity. In both conditions, 50 pulses were delivered using a stimulation intensity of 120% RMT at a frequency ≤0.25 Hz (jittered from 0.05 to 0.25 Hz to minimize potential modulatory effects of low-frequency repetitive TMS application). In 3 stroke participants, SP120 assessments were not completed for one or both hemispheres due to time constraints and/or coil overheating from high TMS intensities.
Electromyography
Participants were seated in an adjustable chair with armrests and their forearms and hands positioned in a neutral position on a pillow placed in their lap. Following standard skin preparation procedures, 2 disposable conductive adhesive hydrogel electrodes were attached in a muscle belly-tendon arrangement over each APB and a ground electrode was placed on the dorsum of each hand. EMG signals were recorded using a 2-channel EMG device (Rogue Research Inc, Canada) and visualized using Brainsight software (version 2.2.14). Participants were asked to maintain a relaxed position throughout testing, unless specifically asked to perform a volitional contraction during CSP assessment.
Electroencephalography
EEG signals were continuously acquired from a 32-channel TMS-compatible electrode cap (Easy Cap, Brain Products, Germany) connected to a BrainAmp DC amplifier (Brain Products, GmbH) and recorded using Recorder software (Brain Products, GmbH). The FCz electrode position was used as the reference channel and the ground was located in the AFz position. Eye blinks were recorded with an electrode located infraorbitally on the right side. Impedance levels were lowered to ≤5 kohm for all channels and periodically checked to maintain a similar level throughout the experimental session. Signals were collected at a sampling rate of 5 kHZ and filtered (range: DC to 1000 Hz) and stored for offline analysis.
Behavioral Outcome Measures
Measurements of gross and fine motor impairment, function and manual dexterity were collected at the beginning of the experimental session by a licensed physical therapist using the upper extremity motor portion of the Fugl-Meyer Assessment (FM), 39 the Wolf Motor Function Test (WFMT), 40 and the Nine Hole Peg Test (NHPT), 41 respectively. Scores were collected bilaterally for the WMFT and NHPT (Table 2).
Behavioral Outcome Measures for Stroke Participants. a
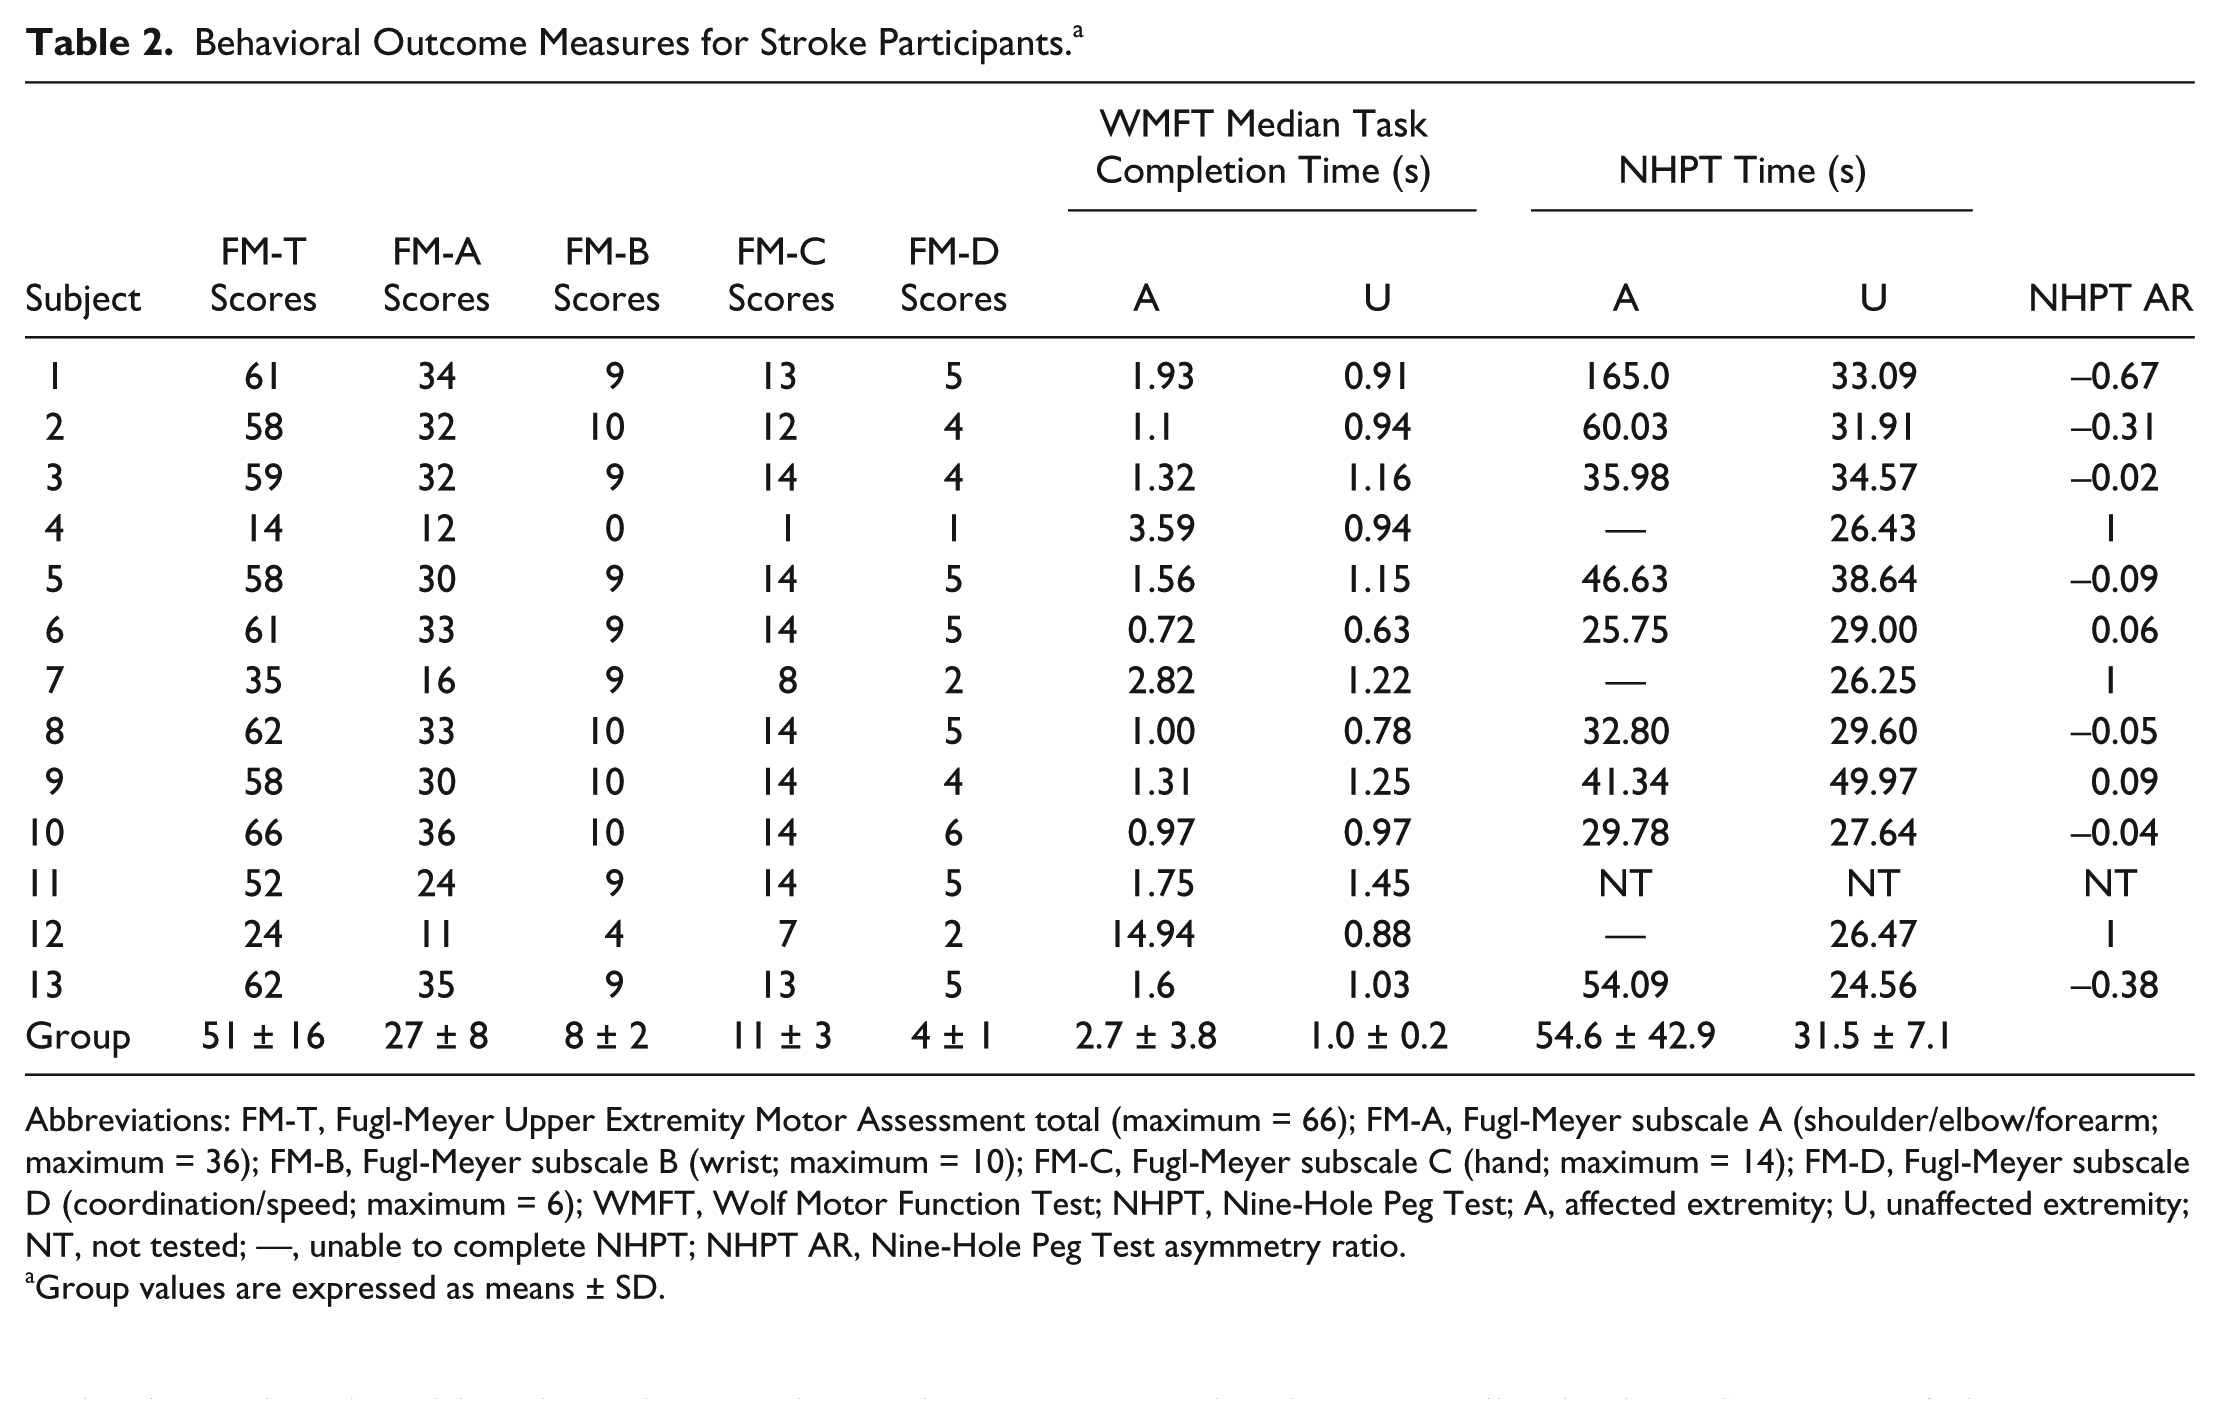
Abbreviations: FM-T, Fugl-Meyer Upper Extremity Motor Assessment total (maximum = 66); FM-A, Fugl-Meyer subscale A (shoulder/elbow/forearm; maximum = 36); FM-B, Fugl-Meyer subscale B (wrist; maximum = 10); FM-C, Fugl-Meyer subscale C (hand; maximum = 14); FM-D, Fugl-Meyer subscale D (coordination/speed; maximum = 6); WMFT, Wolf Motor Function Test; NHPT, Nine-Hole Peg Test; A, affected extremity; U, unaffected extremity; NT, not tested; —, unable to complete NHPT; NHPT AR, Nine-Hole Peg Test asymmetry ratio.
Group values are expressed as means ± SD.
To evaluate gross and fine/dexterous motor impairment, Total and Subsection (A, shoulder/elbow/forearm; B, wrist; C, hand; D, coordination/speed) scores of the FM were used. 39 The timed portions of the WMFT were also divided into 2 sections: gross motor (tasks 1-8, excluding weight to box) and fine motor (tasks 9-17, excluding grip strength).40,42 To evaluate dexterity, an asymmetry ratio (AR) was calculated for NHPT performance using each hand based on the time taken to place and remove each peg:
where a value of 1 indicated that the participant was unable to complete the task using the affected hand.
Data Analysis
TMS-Evoked Potentials
EEG processing occurred offline using MATLAB 2014a version 8.3 (MathWorks, Natick, MA) and the public toolbox, EEGLAB (version 13.3.2b). 43 Large-amplitude stimulation artifact was removed using the plugin ARfit studio (version 0.13); a majority of datasets had resolution of the artifact within 10 ms (CSP, 83.3% controls, 58% stroke; SP120, 87.5% control, 63.6% stroke). Individual components affected by artifact contamination due to delayed resolution were excluded from analyses (see Table 3 [N, sample size]).
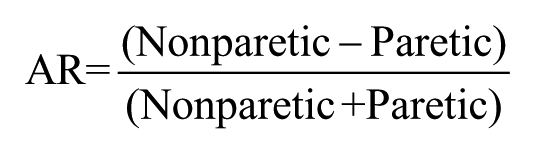
Group Mean Amplitudes and Latencies of TMS-Evoked Potentials Recorded From Cz Across Hemispheres. a
Abbreviations: TMS, transcranial magnetic stimulation; CSP, cortical silent period; C CSP, CSP condition in control participants; S CSP, CSP condition in stroke participants; C SP120, SP120 condition in control participants; S SP120, SP120 condition in stroke participants.
Values are expressed as means ± SD.
Sample size includes nondominant and dominant hemispheres for control participants (CSP, max = 22; SP120, max = 24), and ipsilesional and contralesional hemispheres for stroke participants (CSP, max = 22; SP120, max = 21).
Denotes significant difference between groups (control vs stroke) (P < .05).
P = .090.
Welch and Brown-Forsythe tests performed to correct for unequal variances between groups.
P = .075.
P = .069.
P = .066.
Signals were then high-pass filtered at 1 Hz, and line noise between 60 and 120 Hz was removed using a plugin, CleanLine (version 1.03), in EEGLAB. EEG data were downsampled to 1000 Hz. The TrimOutlier (version 0.16) plugin was used for channel rejection. Across participants, an average of 2-3 channels (<10%) were rejected for both CSP and SP120 ([mean percentage of channels ± SD] CSP, 6.6% ± 3.4%; SP120, 6.7% ± 3.3%; range, 0-4 channels). The primary channel of interest, Cz, was rejected during CSP assessments in 2 control (1 ndM1, 1 dM1) and 3 stroke (1 iM1, 2 cM1) participants; therefore, those data were not available for statistical analyses (see Table 3, footnote b).
Data were next average rereferenced and extracted into 3-second epochs (−1 to 2 seconds with regard to TMS delivery). Using the automatic epoch rejection function in EEGLAB, individual epochs falling outside a set threshold of 5 SD for detection of probable TMS-evoked related activity were marked for rejection and confirmed through visual inspection. On average, 1 to 3 epochs (out of 50) were rejected across TMS paradigms ([mean percentage of epochs ± SD] CSP, 3.1% ± 2.5% for controls, 5.8% ± 1.1% in stroke; SP120, 1.9% ± 2.2% in controls, 6.0% ± 0.0% in stroke).
To assess local TMS-evoked responses, TEP component peak amplitude and peak latency values from Cz were extracted using custom-written scripts in MATLAB to identify either the maximum or minimum value for the following peaks: P30, N45, P60, N100, P180, and N280. Default time windows, relative to TMS delivery, were used for initial extraction of amplitude and latency data for each peak (P30, 20-40 ms; N45, 38-50 ms; P60, 51-65 ms; N100, 85-115 ms; P180, 160-200 ms; N280, 260-300 ms). Extracted data were then visually inspected by a single investigator to ensure that the peaks captured within the default time windows were consistent with known TEP waveform characteristics. If a correct TEP component peak was not captured automatically, the window was manually adjusted.
Cortical Silent Period
Duration of the CSP was defined as the time from the first peak of the MEP to the sustained return of at least 50% of the mean prestimulus background EMG activity16,44 (Figure 1A). In participants where short, resolving “breakthrough” bursts of EMG activity were noted during the silent period (control, n = 2; stroke, n = 2), latencies associated with the sustained resumption of EMG activity were used in statistical analyses. A CSP was not detected during iM1 stimulation in 2 stroke participants (S04 and S12), therefore, those data were not available for statistical analyses. Additionally, we calculated the latency of the first MEP peak as the duration of the time from the stimulus artifact to the peak of the first MEP.
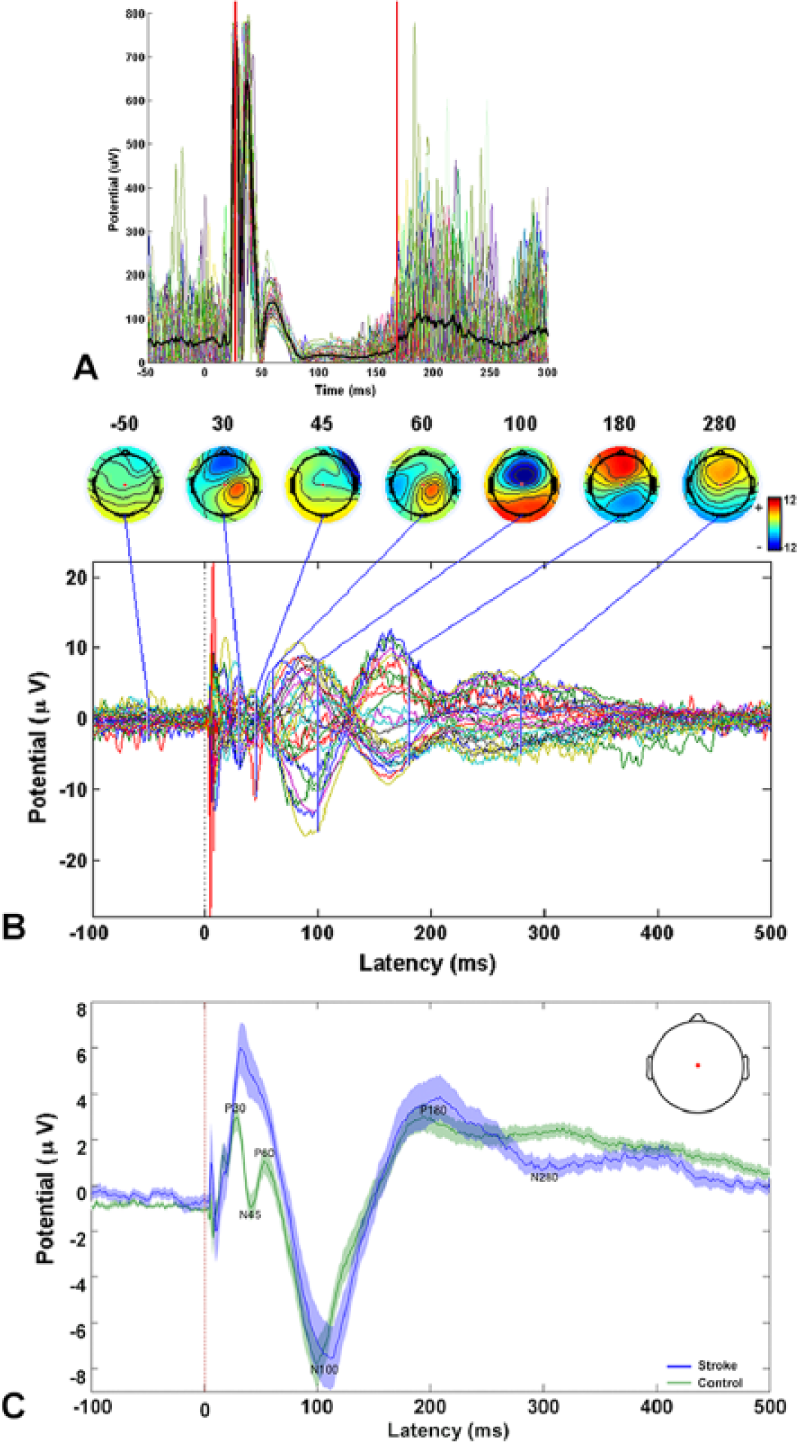
Evaluation of the transcranial magnetic stimulation (TMS)–evoked silent period. (A) Colored traces represent rectified electromyographic (EMG) data recorded from the abductor pollicis brevis muscle contralateral to TMS for a single control participant. All trials are illustrated (colored lines) and the mean value calculated across trials is represented by the bolded trace (black line). Vertical red lines indicate the onset and offset of the TMS-evoked EMG silent period. (B) Waveforms represent TMS-evoked potentials (TEPs) recorded (averaged across trials) from 32 scalp electroencephalography (EEG) channels during silent period evaluation. Topographic head plots illustrate the temporal evolution of the TEPs at specific latencies of interest (P30, N45, P60, N100, P180, N280) and at a single time point (−50 ms) prior to stimulation onset (0 ms). Note that TEPs in each channel generally return to baseline around 400ms after TMS delivery. Red dot denotes the EEG channel of interest (Cz) for statistical analyses. (C) Group-mean averaged TEPs recorded during silent period assessment. Uncorrected group mean TEPs recorded from Cz during TMS delivered over iM1 in the stroke group (n = 12, blue) compared with TMS delivered over ndM1 in the control group (n = 12, green) are shown. Standard error is represented by shaded areas. Data: −100 ms to 500 ms relative to TMS delivery (red dashed line). In these tracings, statistical outliers for amplitudes and latencies have not been removed. Inset: head plot depicting location of Cz.
Statistical Analysis
TMS-Evoked Potentials
Individual 2-way (group × hemisphere) analyses of variance (ANOVAs) were performed for each TEP component amplitude and latency. Stimulation hemisphere was matched between groups (iM1/ndM1 and cM1/dM1). Data were analyzed separately by assessment (CSP and SP120). An additional analysis was performed to determine if TEPs were different between assessments (CSP vs SP120) across participants. Individual 3-way (group × hemisphere × condition) ANOVAs were performed for each TEP component amplitude and latency. For all analyses, analysis of covariance (ANCOVAs) were performed for TEP amplitude components that were correlated with RMT (P30, N100, and N280 amplitudes; see Table 3). Bonferroni correction was applied to adjust for multiple comparisons. Assumptions of normality and homogeneity were assessed via inspection of descriptive statistics (skewness, kurtosis, box plots) and Levene’s test, respectively. Extreme outliers, defined as values more than 3 times the interquartile range, were removed to meet the assumptions of normality (CSP, P30 latency: n = 5 [4 controls, 1 stroke], N45 latency: n = 1 [1 control]; SP120, N45 amplitude: n = 1 [1 stroke]).
As TEP component latencies and amplitudes are not independent of one another, removal of identified outliers in TEP latencies necessitated removal of the corresponding amplitudes from analyses, and vice versa. If a significant F statistic for Levene’s test was observed (CSP, P180 amplitude, N100 latency; SP120, P60 and P180 amplitudes), Brown-Forsythe and Welch’s tests were used to correct for unequal variance between groups. One stroke participant was excluded from all statistical analyses due to a nonresolving EEG artifact that precluded extraction of TEP component information. For each component, values are reported as mean ± SD.
Cortical Silent Period
To evaluate differences in CSP duration, a 2-way (group × hemisphere) ANOVA was performed. Simple effect analyses were performed for significant interaction effects.
Correlation Analyses
Pearson’s correlation coefficients were calculated to evaluate the relationships in the stroke group between (1) ipsilesional TEP component amplitudes/latencies and behavioral outcome measures, (2) ipsilesional and contralesional CSP durations and TEP component amplitudes and latencies, and (3) ipsilesional CSP durations and behavioral measures. For all correlations performed, the false discovery rate (FDR) was used to calculate an adjusted P value (P = .002) to control for type I error during multiple comparisons. 45 Uncorrected P values are presented to illustrate potential meaningful correlations that did not achieve the adjusted threshold for statistical significance. All statistical analyses were performed with SPSS (version 24.0).
Results
TMS-Evoked Potentials
CSP Assessment
Group TEP data are illustrated in Figure 1C and summarized in Table 3. Greater TEP component amplitudes were observed in the stroke group versus controls for P30 (F1,29 = 7.62, P = .010), and N45 (F1,35 = 9.09, P = .005), with a potential trend toward significance for P60 (F1,37 = 3.03, P = .090). Longer latencies were observed in the stroke group for P30 (F1,30 = 6.52, P = .016), N100 (F1,33.1 = 8.27, P = .007), and N280 (F1,40 = 4.63, P = .038) (Table 3, Figure 1). No hemispheric differences or interaction effects were detected for component amplitudes or latencies.
SP120 Assessment
Group TEP data are summarized in Table 3. Longer latencies were observed in the stroke group for P30 (F1,40 = 9.13, P = .004), N45 (F1,40 = 4.32, P = .044), N100 (F1,41 = 5.48, P = .024), and N280 (F1,40 = 4.63, P = .038). More positive component amplitudes were observed for the stroke group for P30 (F1,39 = 4.10, P = .050), and N45 (F1,40 = 4.37, P = .043). More negative N100 (F1,40 = 0.51, P = .013) and N280 (F1,41 = 12.23, P = .001) amplitudes were observed in the stroke group. No hemispheric differences or interaction effects were detected for component latencies or amplitudes. For the secondary analysis, there was a main effect of condition (CSP vs SP120) on N280 amplitude, with more positive N280 amplitudes observed during the CSP condition (F1,41 = 3.98, P = .049). No interaction or effect of condition was observed for any other TEP component amplitude or latency (Figure 2).
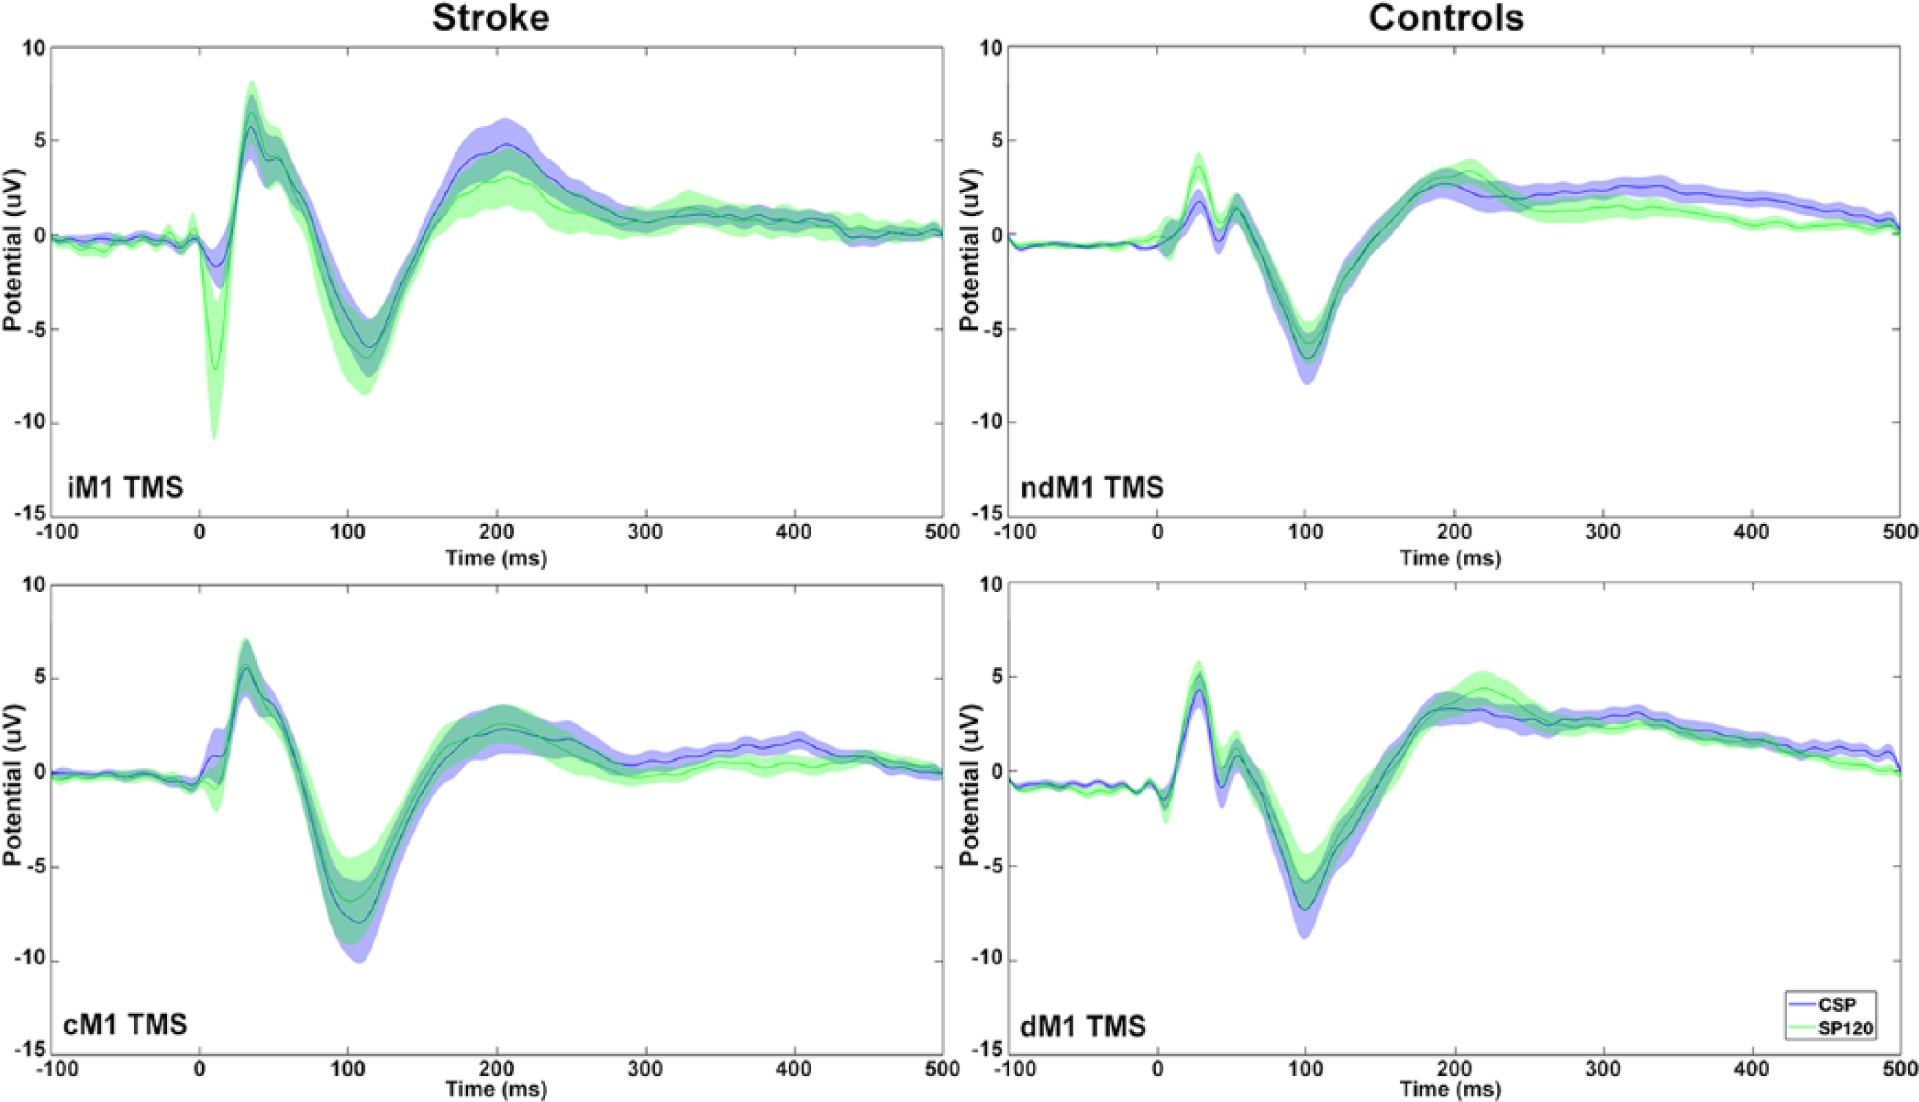
Mean ± standard error (SE) transcranial magnetic stimulation (TMS)–evoked potentials (TEPs) recorded during each condition (cortical silent period [CSP] blue and SP120 green) during TMS delivered over iM1/ndM1 (top) and cM1/dM1 (bottom) in stroke (left) and control (right) groups. There was a main effect of condition (active vs rest) on N280 amplitude. No interaction or main effect of condition or hemisphere was observed for any other TEP component amplitude or latency. ndM1, nondominant primary motor cortex (M1); dM1, dominant M1; iM1, ipsilesional M1; cM1, contralesional M1.
Associations Between TEP Components and Motor Behavior
No Pearson correlation coefficients reached the FDR-adjusted level of significance (P < .002). Correlations with an unadjusted level of significance (P < .05) are reported below. P30 peak latency during ipsilesional CSP assessment was positively correlated with NHPT AR (r = 0.816, P = .014, n = 8), and FM-D scores (r = −0.747, P = .021, n = 9) (Figure 3A and B). No relationships were detected for TEPs collected during SP120 assessment.
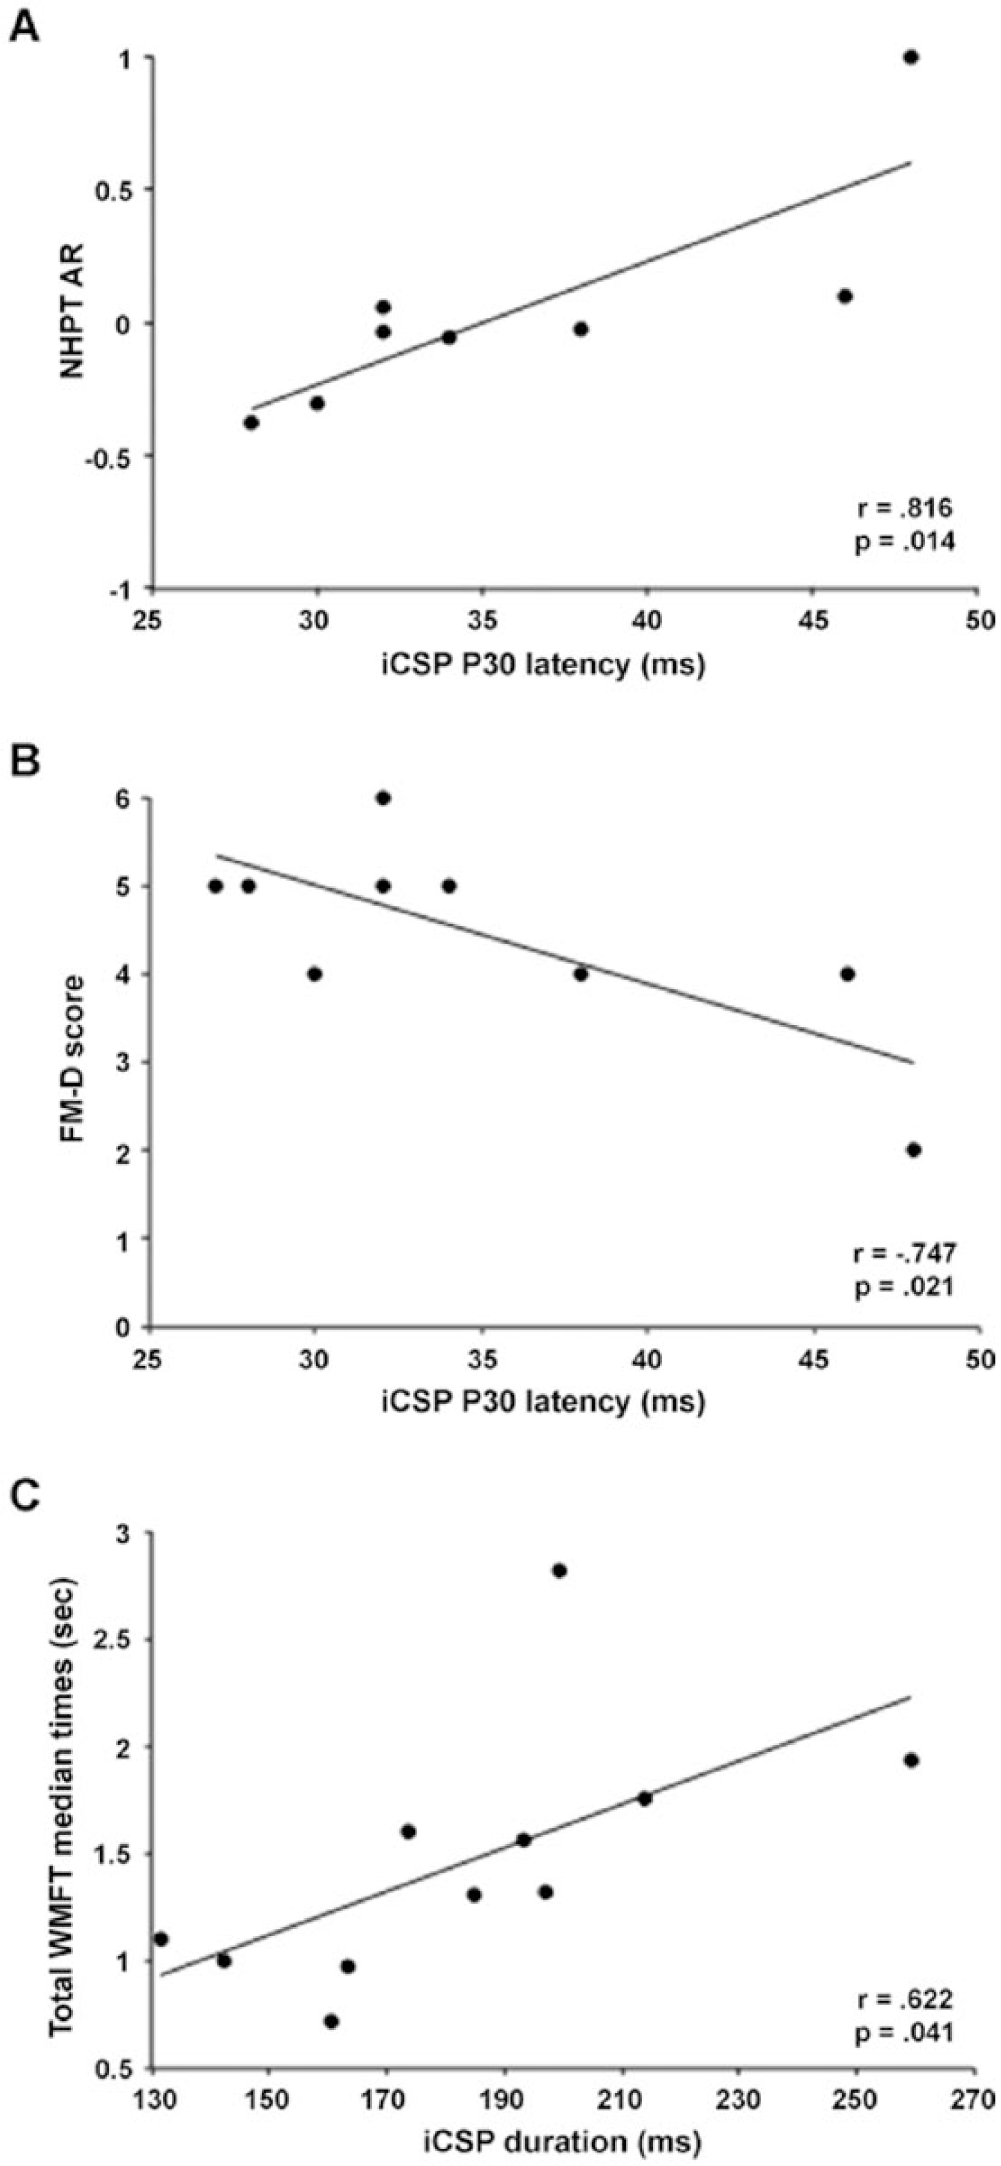
Association between ipsilesional cortical excitability during cortical silent period (CSP) assessment and upper extremity motor performance in the stroke group. Delayed onset of the P30 component peak amplitude (iCSP, x-axis) was associated with (A) greater asymmetry in performance on the NHPT (NHPT AR, y-axis) between the affected and less affected hand (NHPT AR = 1: unable to perform task with affected hand) and a trend for (B) decreased coordination and speed of movements of the affected hand (lower FM-D scores, y-axis). (C) Longer iCSP duration was associated with decreased paretic arm motor function (increased median Wolf Motor Function Test [WMFT] task completion time, y-axis).
Cortical Silent Period Duration
The average first MEP peak latency for the stroke group was 30.3 ± 2.9 ms for iM1 and 28.9 ± 2.7ms for cM1 and for controls, 26.9 ± 3.3 ms for ndM1 and 27.8±4.1 ms for dM1 stimulation. Results of the ANOVA demonstrated prolonged CSP durations in the stroke versus control group (stroke, 161.6 ± 40.2 ms; controls, 136.0 ± 33.0 ms; F1,39 = 6.05, P = .018). Although there was no effect of hemisphere (F1,39 = 1.92, P = .174), a significant group-by-hemisphere interaction was observed (F1,39 = 8.56, P = .006). Simple effects analyses revealed a difference in CSP between groups (stroke, ipsilesional, 183.6 ± 46.3 ms; control, nondominant, 128.5 ± 48.6 ms; F1,39 = 14.16, P = .001). There was also a hemispheric difference in CSP duration for the stroke group (ipsilesional, 183.6 ± 46.3 ms; contralesional, 144.3 ± 47.4 ms; F1,39 = 9.52, P = .004) but not controls (nondominant, 128.5 ± 48.6 ms; dominant, 139.5 ± 46.3 ms; F1,39 = 1.16, P = .289).
Association of CSP Duration With TEP Components and Motor Behavior
During contralesional stimulation, we observed a negative relationship between CSP duration versus P30 latency (r = −0.692, P = .039, n = 8) and N100 amplitude (r = −0.761, P = .011, n = 10). CSP duration during ipsilesional stimulation was positively correlated with total WMFT median time (r = 0.622, P = .041, n = 11; Figure 3C).
Discussion
The principal finding of this study is that TMS-evoked EEG responses are abnormal in individuals with chronic stroke. Importantly, abnormal early EEG responses during the TMS-induced silent period were associated with hand dysfunction in chronic stroke. By measuring cortical responses to stimulation of the motor cortex, the reported findings offer new insights into the possible mechanisms associated with persistent poststroke motor impairment. These initial findings demonstrate the potential utility of TMS-EEG to identifying novel neurophysiologic biomarkers of persistent motor impairment in chronic stroke.
We observed significant alterations in TEP amplitude and latency profiles in stroke survivors compared with controls (Figure 1, Table 3), with TEP components during active motor contraction being associated with poststroke motor behavior. Certain TEP components are thought to be generated by GABAA (P30, N45) and GABAB (P60, N100, P180, N280) receptor activity and may represent diffuse interhemispheric signal spread via callosal and/or subcortical (thalamus or basal ganglia) pathways.25,27,28 Preclinical work has shown increased levels of cortical inhibitory activity following stroke, predominately in perilesional cortex6,7 and stand-alone TMS studies in humans have generally shown reduced cortical excitability in the ipsilesional hemisphere (for review, see Wittenberg et al 8 ). However, TMS-based measures of GABA-mediated intracortical inhibition have not consistently demonstrated increased GABAergic activity. Larger amplitudes and delayed onset of these later TEP components observed in the present study coupled with the lengthened CSP (presumed to reflect greater GABA receptor-mediated activity47,48) suggest increased GABAergic activity is present in stroke survivors. These findings provide direct evidence of the presence of abnormal cortical excitability in the chronic phase of stroke recovery.
Importantly, we observed that longer P30 latencies were associated with greater asymmetry between paretic and nonparetic hands on the NHPT. Thus, the P30 may index abnormal GABAA activity that is relevant to motor dysfunction after stroke. As improvements in GABAA receptor activity after stroke in an animal model were associated with improvements functional recovery, 49 the P30 response may offer a possible biomarker to target with therapeutic intervention. However, the structural contributors and the extent to which other factors (eg, corticocortical pathway disruption or activity of other neurotransmitters) could also influence the amplitude and latency of TMS-evoked cortical responses requires further exploration.
In agreement with previous research, stroke survivors showed prolonged CSP duration in the ipsilesional hemisphere.5,15,16 Previous work found that TEP characteristics at later time points (>50 ms post-TMS) were correlated with CSP in young healthy adults. 50 Here, we extended those findings by evaluating earlier TEP components and their relationship with CSP duration in individuals poststroke. We observed that longer P30 latency was associated with shorter CSP duration when stimulating over the contralesional motor cortex, consistent with previous work suggesting short CSPs are influenced by GABAA receptor activation.47,51,52 We speculate that a longer P30 latency and shorter CSP duration may represent reduced GABAergic in the contralesional hemisphere. The N100 amplitude was also positively associated with CSP duration during cM1 stimulation, consistent with previous results and supporting the relationship between GABAB receptor-mediated neurotransmission and the CSP. 50 Intracortical inhibition in the contralesional hemisphere is generally normal, with some exceptions, after stroke thus the mechanisms underlying relationships between TEPs and the CSP, although potentially interesting, remain speculative. Similar relationships were not observed with ipsilesional stimulation. This observation may suggest that direct and indirect TMS-based assessments of intracortical excitability reflect unique aspects of functional reorganization in the stroke-affected hemisphere. As a direct measure of abnormal cortical activity, TEPs might not be confounded by noncortical influences (eg, spinal excitability) and may provide unique information to standalone TMS estimates of cortical excitability.
The current study has limitations. The sample size in both cohorts was small, limiting our ability to detect statistical significance due to interindividual variability in cortical and peripheral responses. A heterogeneous sample of stroke participants was recruited but quantitatively examining the possible effects of lesion location on TEP component characteristics was not possible due to the sample size. Additionally, coil overheating precluded collection of full datasets for 3 participants that may have been due to high stimulation intensities, stimulation frequency and/or large numbers of pulses delivered. Despite this potential limitation, significant TEP and behavioral differences were observed between stroke and control participants. We chose to restrict our analyses for this initial investigation to evoked cortical data collected from a single scalp channel (Cz). Although data from additional channels may provide valuable information regarding spatiotemporal dynamics of induced cortical activity, we chose a priori to focus on a single channel with well-characterized TEPs in healthy participants due to the exploratory nature of the study and to limit the number of statistical comparisons performed. Focusing on a single channel well-characterized in healthy individuals for this foundational investigation of using TMS-EEG in chronic stroke may offer a potentially simple, clinically feasible biomarker of motor recovery in stroke. However, we also conducted an exploratory full-scalp TEP analysis to study spatiotemporal dynamics of the TMS-evoked response (see Supplementary Materials for details). Future studies with larger participant samples and increased EEG recording sites will comprehensively characterize changes in cortical dynamics after stroke. Due to the methodological and technical challenges of TMS-EEG, TMS-related artifacts in EEG recordings remain a challenge in obtaining discernable and reproducible TEPs. 29 Steps were taken in attempt to minimize TMS-related EEG artifact; however, the technical and methodological challenges of utilizing TMS-EEG, especially in stroke where higher stimulation intensities are generally required, compromised capturing some data for statistical analyses. During TMS, the coil click generates an auditory-evoked potential (AEP) that is present predominately over central electrodes (including Cz) and can influence TEP components at N100 and P180.38,53 Participants wore ear plugs to minimize the AEP, however, earplugs are insufficient to fully mask the AEP. 54 We performed a secondary analysis comparing a sham TMS condition to the SP120 condition and observed significant TEP differences suggesting that although the AEP was not eliminated, its contribution to the N100 and P180 was limited (see Supplementary Materials for details). Given the TEP results suggesting abnormal GABAA receptor activity in stroke, future TMS-EEG studies in chronic stroke survivors could incorporate TMS measures of GABAA (SICI) and GABAB (LICI) receptor activity3,26 to comprehensively characterize the role of GABA-mediated cortical inhibition on functional recovery. There is the potential that age may have influenced the groups differences observed since cortical excitability has been shown to be different between old and young adults (for review, see Bhandari et al 55 ). However, previous TMS-EEG findings suggest there is not a significant effect of age on TEP amplitude. 56 We did not observe a significant group difference in RMT further supporting the conclusion that age differences did not significantly influence the observed findings.
Overall, results from this investigation illustrate the application of concurrent TMS-EEG methods to directly characterize evoked cortical activity to improve our mechanistic understanding of the salient neural circuits mediating motor recovery after stroke. The observed findings further support the role of GABA receptor–mediated activity in motor recovery after stroke suggesting the timing and magnitude of inhibitory activity influences motor function. Future work will need to concurrently investigate the functional, structural and metabolic factors underlying motor recovery after stroke as a fundamental basis for developing targeted, individualized therapeutic interventions that could effectively restore arm function after stroke.
Footnotes
Acknowledgements
The authors would like to thank Alice Halter and Aanand Patel for assistance with data processing.
Declaration of Conflicting Interests
The authors declared no potential conflicts of interest with respect to the research, authorship, and/or publication of this article.
Funding
The authors disclosed receipt of the following financial support for the research, authorship, and/or publication of this article: MRB was supported by the National Institutes of Health (4K12 HD055931-10). WAG was supported by a postdoctoral fellowship from the National Institute of Neurological Disorders and Stroke (grant number 1U10NS086607). SLW was supported by the National Institute of Neurological Disorders and Stroke (5U10NS086607-04).
Supplementary material for this article is available on the Neurorehabilitation & Neural Repair website along with the online version of this article.
References
Supplementary Material
Please find the following supplemental material available below.
For Open Access articles published under a Creative Commons License, all supplemental material carries the same license as the article it is associated with.
For non-Open Access articles published, all supplemental material carries a non-exclusive license, and permission requests for re-use of supplemental material or any part of supplemental material shall be sent directly to the copyright owner as specified in the copyright notice associated with the article.