
Abstract
Background. Addressing the role of somatosensory impairment, that is, afferent pathway integrity, in poststroke motor recovery may require neurophysiological assessment. Objective. We investigated the longitudinal construct validity of position-cortical coherence (PCC), that is, the agreement between mechanically evoked wrist perturbations and electroencephalography (EEG), as a measure of afferent pathway integrity. Methods. PCC was measured serially in 48 patients after a first-ever ischemic stroke in addition to Fugl-Meyer motor assessment of the upper extremity (FM-UE) and Nottingham Sensory Assessment hand-finger subscores (EmNSA-HF, within 3 and at 5, 12, and 26 weeks poststroke. Changes in PCC over time, represented by percentage presence of PCC (%PCC), mean amplitude of PCC over the affected (Amp-A) and nonaffected hemisphere (Amp-N) and a lateralization index (L-index), were analyzed, as well as their association with FM-UE and EmNSA-HF. Patients were retrospectively categorized based on FM-UE score at baseline and 26 weeks poststroke into high- and low-baseline recoverers and non-recoverers. Results. %PCC increased from baseline to 12 weeks poststroke (β = 1.6%, CI = 0.32% to 2.86%, P = .01), which was no longer significant after adjusting for EmNSA-HF and FM-UE. A significant positive association was found between %PCC, Amp-A, and EmNSA-HF. Low-baseline recoverers (n = 8) showed longitudinally significantly higher %PCC than high-baseline recoverers (n = 23). Conclusions. We demonstrated the longitudinal construct validity of %PCC and Amp-A as a measure of afferent pathway integrity. A high %PCC in low-baseline recoverers suggests that this measure also contains information on cortical excitability. Use of PCC as an EEG-based measure to address the role of somatosensory integrity to motor recovery poststroke requires further attention.
Introduction
Progress of time as a reflection of underlying spontaneous neurobiological recovery appears to account for 80% to 90% of the observed improvement in motor function and upper limb capacity in patients after stroke.1-3 This accounts for approximately 70% of patients in which some patients are expected to recover, that is, patients with a relatively high baseline motor function, while other patients are not, that is, patients with a low baseline motor function. It is unknown why 20% to 30% of patients, the so-called non-recoverers, with a low motor function at 26 weeks poststroke, fail to show spontaneous recovery. 4
Patients with somatosensory impairments have a lower probability of regaining upper limb capacity than patients in whom this function is not affected. 3 Somatosensory impairments may influence motor recovery due to a tight interaction of the afferent and efferent pathways with a supposed cortical loop.5,6 Disturbance of afferent pathway integrity is therefore important to study to understand motor recovery. 7 The Erasmus modification of the Nottingham Sensory Assessment of the upper extremity (EmNSA-UE) is a common and reliable clinical measure of somatosensory impairment in patients with stroke. 8 However, it is not a direct measure of afferent pathway integrity, and is not very responsive to change.8-10
Finger stimulation evoked somatosensory potentials could theoretically be an approach to study somatosensory processing, however, may not be recommend due to the lack in reliability. 11 Cortical rebound responses in the beta band of the affected hemisphere measured with magnetoencephalography during manual passive finger movements, were found to correlate with the initial severity and recovery of motor activity as measured with the box and block test at 1 and 12 months poststroke. 12 Joint position perturbations act as an external excitation signal for the proprioceptive system, primarily the Golgi tendon organs and muscle spindles, providing an interesting approach to study sensorimotor processing in severely affected patients. 12 Coherence between mechanical perturbations and subsequent cortical responses as measured with EEG, that is, position-cortical coherence (PCC), represent the unidirectional information transfer across the afferent pathways.13,14 A cross-sectional study in stroke patients found significant differences in the presence of PCC between groups with poor and good motor function as measured by FM-UE using this system identification approach. 14 A similar protocol was used by Vlaar et al, 15 who reported a reduced amplitude in ipsilesional cortical responses, quantified by a signal-to-noise ratio, in patients with severe somatosensory impairment (reduced EnMSA-UE score for more than 2 subtests) in patients in the chronic phase after stroke.
To address the potential added value of neurophysiological measures, prospective studies are required with fixed moments of measurements poststroke to establish their construct validity. 16 These neurophysiological biomarkers could help to improve the prediction of outcome, and enhance accurate selection of patients for clinical trials.17,18
We aimed to evaluate the longitudinal construct validity of PCC as a measure of afferent pathway integrity and its relation to poststroke recovery, in a prospective cohort study with repetitive measurements at fixed time points within 3 weeks and at 5, 12, and 26 weeks in patients after a first-ever ischemic stroke. We addressed the following research questions and corresponding hypotheses:
How does PCC change over the first 26 weeks poststroke? We expected measures of PCC to show a significant change over time as a reflection of spontaneous neurobiological recovery. Because of these spontaneous neurobiological processes, we also expected this association over time to be influenced by the recovery of motor function, reflected by FM-UE and somatosensory function, reflected by EmNSA hand and finger subset (EmNSA-HF).
Does PCC relate to clinical somatosensory scores, and how does this compare with motor recovery? We expected measures of PCC to represent somatosensory integrity, that is, to show a significant association with EmNSA-HF and not with FM-UE score. We hypothesized that these associations would be independent of time.
How does PCC relate to motor recovery poststroke? We expected a higher PCC in recoverers compared with non-recoverers.
Methods
Participants and Design
The present cohort consisted of 48 patients with a first-ever ischemic stroke who were recruited within three weeks after stroke onset, between August 2012 and July 2016. A flowchart is displayed in Figure 1. Inclusion criteria were (1) first-ever ischemic lesion within 3 weeks after onset, established with computed tomography, magnetic resonance imaging, or clinically; (2) hemiparesis of the upper limb, that is, a National Institutes of Health Stroke Scale, motor arm score of 1 to 4 points at the moment of inclusion; (3) no orthopedic limitations of the upper extremity; (4) no other neurological condition; (5) aged 18 years or older; (6) able to sit for 30 minutes with support; (7) no severe cognitive deficits (Mini Mental State Examination score ≥19); and (8) sufficient motivation to participate. Measurements were performed at baseline, that is, within 3 weeks, and repeated at 5, 12, and 26 weeks poststroke. All procedures were in accordance with the declaration of Helsinki and were approved by the Medical Ethics Committees of Leiden University Medical Center (NL39323.058.12, for 11 patients measured) and VU University Medical Center (NL 47079 029 14, for 37 patients measured). All participants gave their written informed consent.
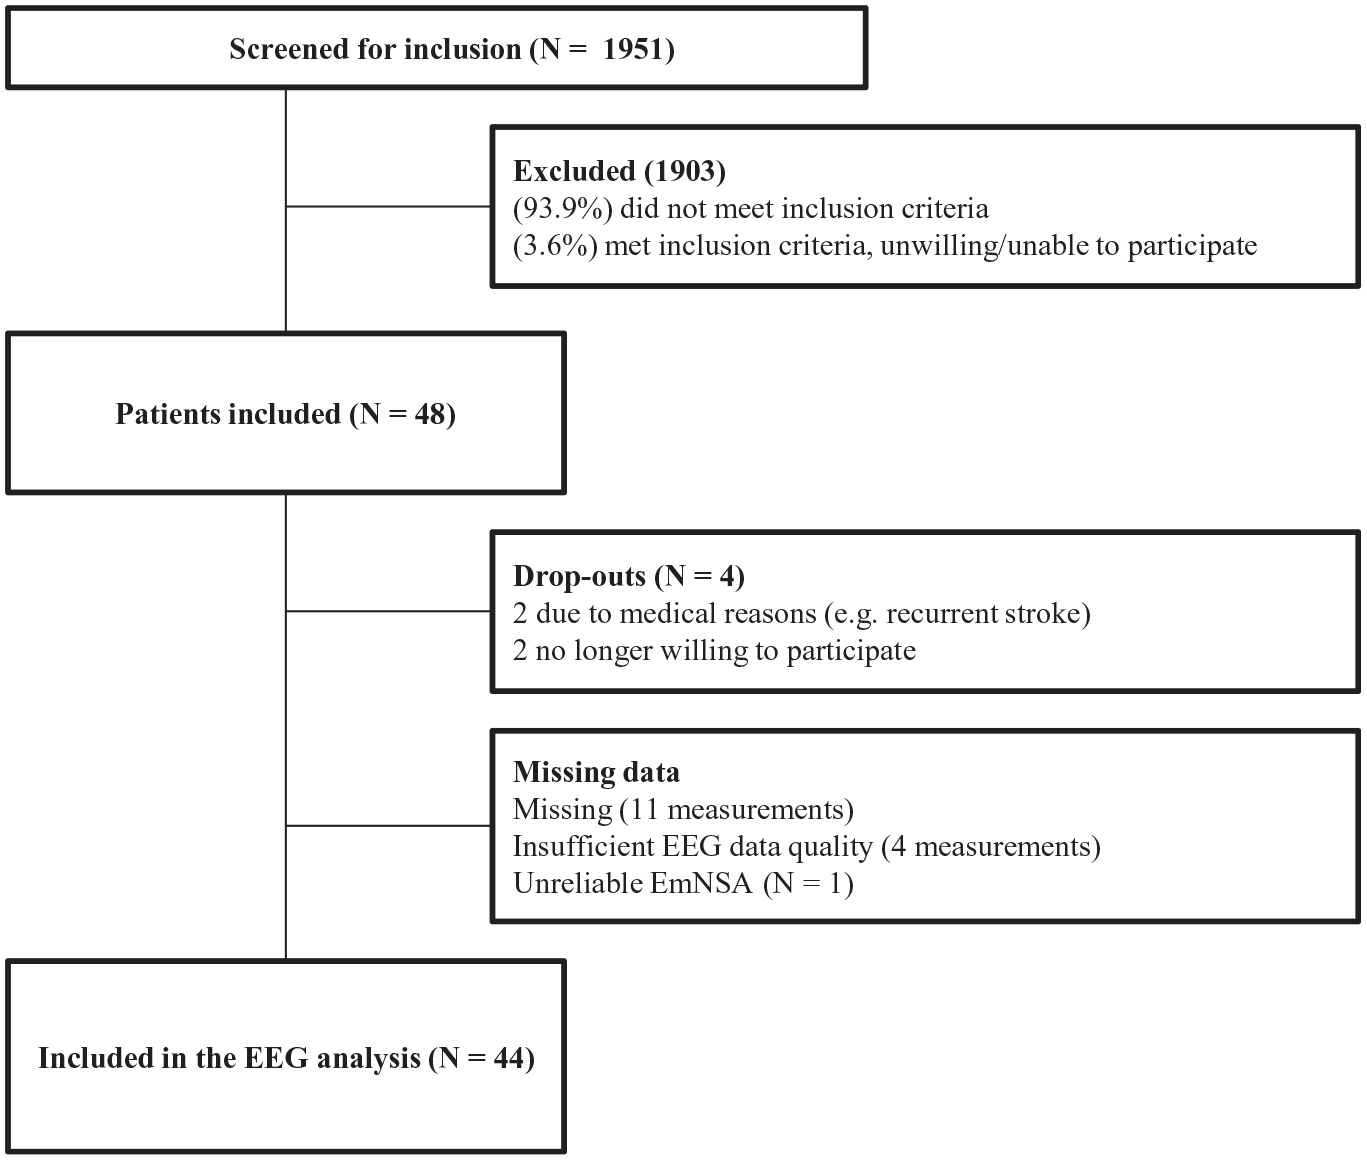
Flow diagram.
Experimental Setup
Measurement Van
Eleven patients were measured in a hospital-based setup at Leiden University Medical Center; the remaining 37 patients, from different stroke units in the Nether-lands, were measured in a customized measurement van (Volkswagen Crafter, Wolfsburg, Germany; Figure 2A), certified as a medical room complying with NEN1010:2007 +C1:2008 +C1/A1 regulations of the VU University Medical Center. This measurement van enabled us to measure patients at their current site of residence, minimizing the burden of traveling.
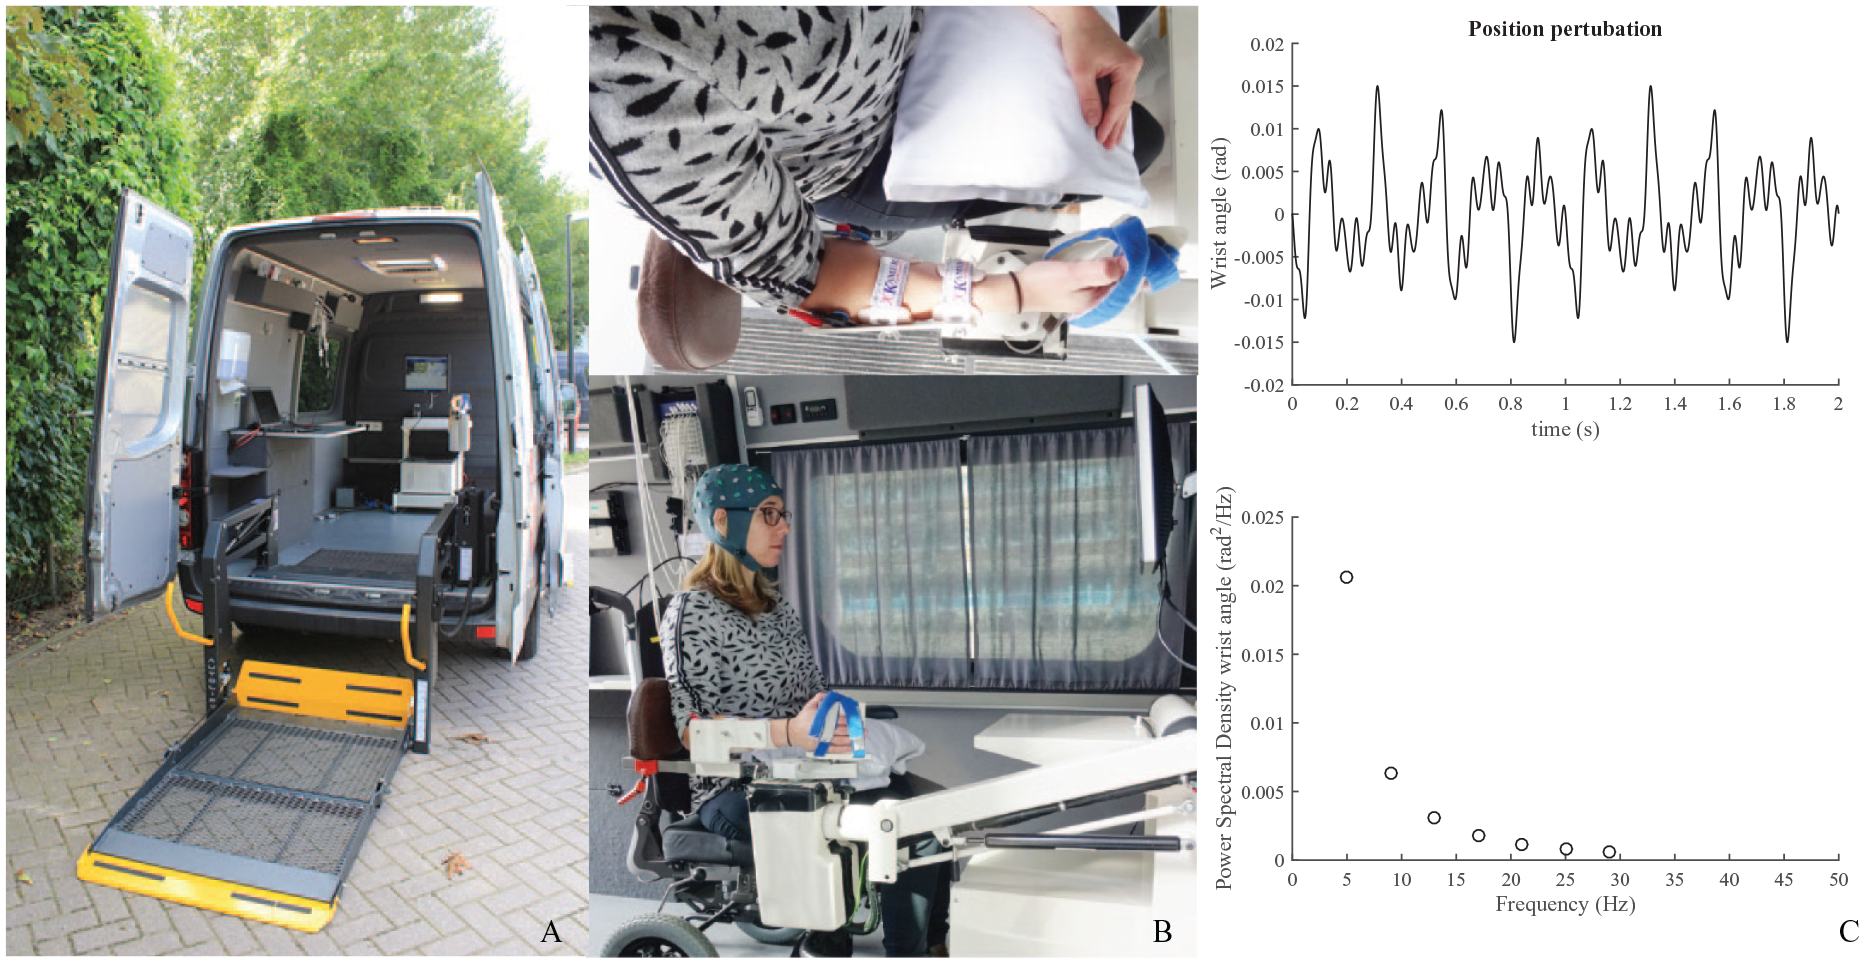
Experimental setup. (Panel A) Experimental setup in the measurement van. (Panel B) The patient’s arm is placed in an arm rest and the wrist aligned with the axis of rotation of the wrist manipulator; the hand and arm are held in place with Velcro straps. (Panel C) Two-second segment of the position perturbation. The position perturbation is a sum of sinusoids with a decreasing value of the power with frequency.
Mechanical Joint Position Perturbations
Patients were seated with their affected arm into a wrist manipulator (Wristalyzer, Moog Inc, Nieuw-Vennep, the Netherlands), a 1-degree of freedom actuated rotating device by which angular perturbations can be imposed in flexion and extension direction onto the wrist (Figure 2B).
EEG Equipment and Signal Acquisition
A 64-channel EEG setup with a 2048 Hz sample frequency was used to record cortical activity (Leiden University Medical Center: Refa, ANTneuro, Enschede, the Netherlands, measurement van: Refa, TMSi International, Oldenzaal, the Netherlands). Electrodes were placed on the skull using a 64-channel actively shielded EEG cap according to the international 10-20 system (TMSi, Oldenzaal, the Netherlands). Bipolar pairs of Ag/AgCl electrodes were used to monitor activity of the wrist muscles (Refa, TMSi International, Oldenzaal, the Netherlands). The force and position signals from the manipulator were recorded via optical isolation onto the same amplifier.
Preparation
An EEG cap was placed over the head of the subject, after which the electrodes were filled with conductive gel. EMG electrodes were placed over the muscle bellies of the musculus flexor carpi radialis and the musculus extensor carpi radialis longus of both the affected and the nonaffected arm. Before placement, the skin was shaved, scrubbed, and cleaned with alcohol to ensure a good signal-to-noise ratio. The height of the manipulator was adjusted to enable the subject to sit with their affected lower arm in 90° elbow flexion and approximately 45° shoulder abduction. The axis of rotation of the wrist manipulator was aligned with the axis of rotation of the affected wrist.
Measurement Protocol
Relax Task With Multisine Position Perturbations
Subjects were asked to remain relaxed (monitored by EMG activity) while a series of perturbations were imposed onto the handle. The trials lasted 300 seconds and were performed 5 to 8 times. The wrist manipulator moved the affected wrist according to an unpredictable, smooth, periodic pattern consisting of a sum of sinusoids with power at frequencies of 5, 9, 13, 17, 21, 25, and 29 Hz with a fixed peak to peak amplitude of 0.03 rad (Figure 2C). More details about the used perturbation signal can be found in Campfens et al. 13
Data Processing
All EEG data processing was performed in Matlab 2012b (The MathWorks, Inc, Natick, MA, USA) using the Fieldtrip toolbox for EEG analysis. 19 Statistical comparisons were performed using IBM SPSS statistics, v22 (IBM Corporation, Armonk, NY, USA). MLwiN (2.28) was used for the mixed model analysis (Centre for Multilevel Modelling, University of Bristol, Bristol, UK).
EEG Signal Preprocessing
EEG signals were filtered with a high-pass second-order Butterworth filter with a cutoff frequency of 1 Hz to remove the linear trend and inspected for large artifacts, which were removed from the data. Subsequently the signals were band stop filtered between 49 and 51 Hz and its multiples with a second order Butterworth filter in both directions. Channels with no or very poor data quality were interpolated using a weighted method. An independent component analysis was applied to remove eye blink components based on the signal characteristic and topography. Components with a median frequency ≥60 Hz were considered EMG artifacts and removed. Signals were then manually inspected for remaining artifacts, which were removed from the data, and were divided into epochs of one second with 75% overlap.
Position-Cortical Coherence
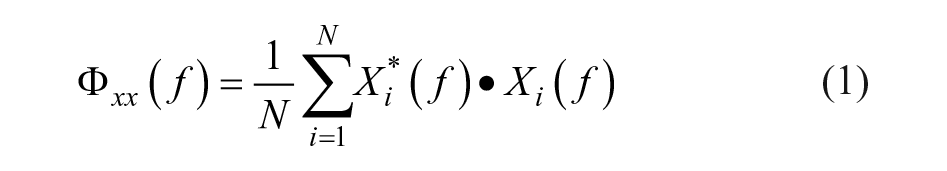
The EEG segments were multiplied with a Hamming window and transformed to the frequency domain by a fast Fourier transformation. The power spectral density
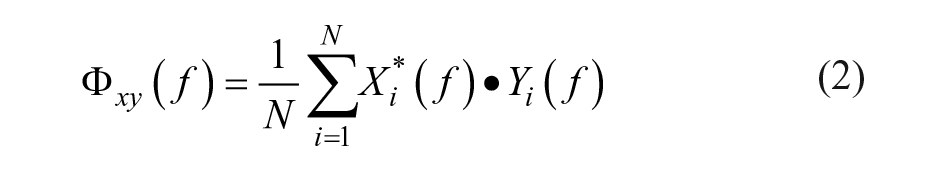
Subsequently, the (magnitude-squared) coherence
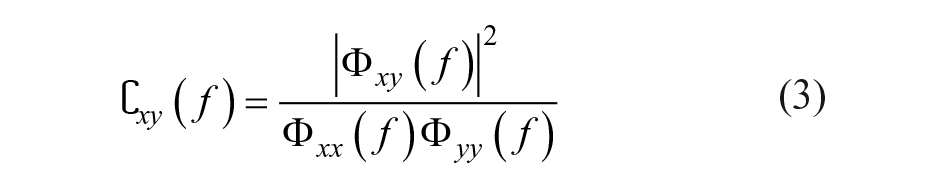
PCC was calculated as the coherence between the measured perturbation signal and each EEG channel at the perturbed frequencies. The confidence limit (CL) was determined using an approximation method for overlapping segments, in which

Clinical Measurements and Subgrouping of Patients
The Fugl-Meyer motor assessment of the upper extremity (FM-UE) 21 and the Erasmus modification of the Nottingham Sensory Assessment (EmNSA) 8 were used as measures of motor function and somatosensory function. Since the mechanical perturbation via the manipulator was applied to the wrist, only the test items for hand and finger somatosensory function were used (EmNSA-HF; maximal score of 20 points) for comparisons.
Patients were classified based on the amount of spontaneous neurobiological recovery they showed. The proportional recovery model4,22 defined as: 0.7 ∙ (66 − initial score FM-UE) + 0.4, 22 was used to determine the expected amount of spontaneous neurobiological recovery over time. Based on this expected improvement, patients who showed and patients who failed to show spontaneous neurobiological recovery (recoverers and non-recoverers), were distinguished by means of a hierarchical cluster analysis using Mahalanobis distances. 4 The categorization into low- and high-baseline was made based on the FM-UE baseline score, with a cutoff of 18 points, which was found to characterize non-recoverers in the study by Winters et al. 4
Retrospectively, we distinguished 3 motor recovery subgroups: (1) patients with an initial score of 18 points or higher on the FM-UE, who were expected to and showed spontaneous recovery (high-baseline recoverers); (2) patients with an initial score less than 18 points on the FM-UE, who nevertheless showed spontaneous recovery (low-baseline recoverers); and (3) patients with an initial score less than 18 points on the FM-UE, who fail to show spontaneous recovery (non-recoverers).
Statistics
Normality was examined by inspecting the histograms, q-q plots and Z-scores for skewness and kurtosis of the data, or the residuals when appropriate. A natural log transformation was applied when these assumptions were not met. If this transformation was not sufficient, or in the case of ordinal or nominal data, a nonparametric test was used. The significance level α was set 2-tailed at .05.
To examine the longitudinal change in the four PCC parameters over time, a mixed-model analysis was performed. EmNSA-HF and FM-UE were added to the model as a second step. A 10% change in effect estimates (β-values) was considered an improvement to the model. 23
The longitudinal association of the 4 PCC parameters with EmNSA and FM-UE was examined using a second mixed-model analysis. We tested for possible interaction effects between measurement time point and EmNSA-HF as well as between time point and FM-UE.
A third association model was used to examine the relation between the PCC parameters and the different motor recovery subgroups, that is, high- and low-baseline recoverers and nonrecoverers. EmNSA-HF and measurement time points were tested for possible confounding and interaction effects.
In the fourth model, EmNSA-HF was taken as an outcome variable to examine the fixed effects between motor recovery subgroups over time and between subjects.
Differences in characteristics and baseline parameters between motor recovery subgroups were tested with a 1-way analysis of variance model in the case of continuous normally distributed data, with a Bonferroni correction for post hoc analysis. The Kruskal-Wallis test was used for ordinal data, with a Mann-Whitney U test for post hoc analysis. Categorical/nominal variables were tested with Pearson’s chi-square, a 2 × 2 cross table was used for post hoc analysis.
Results
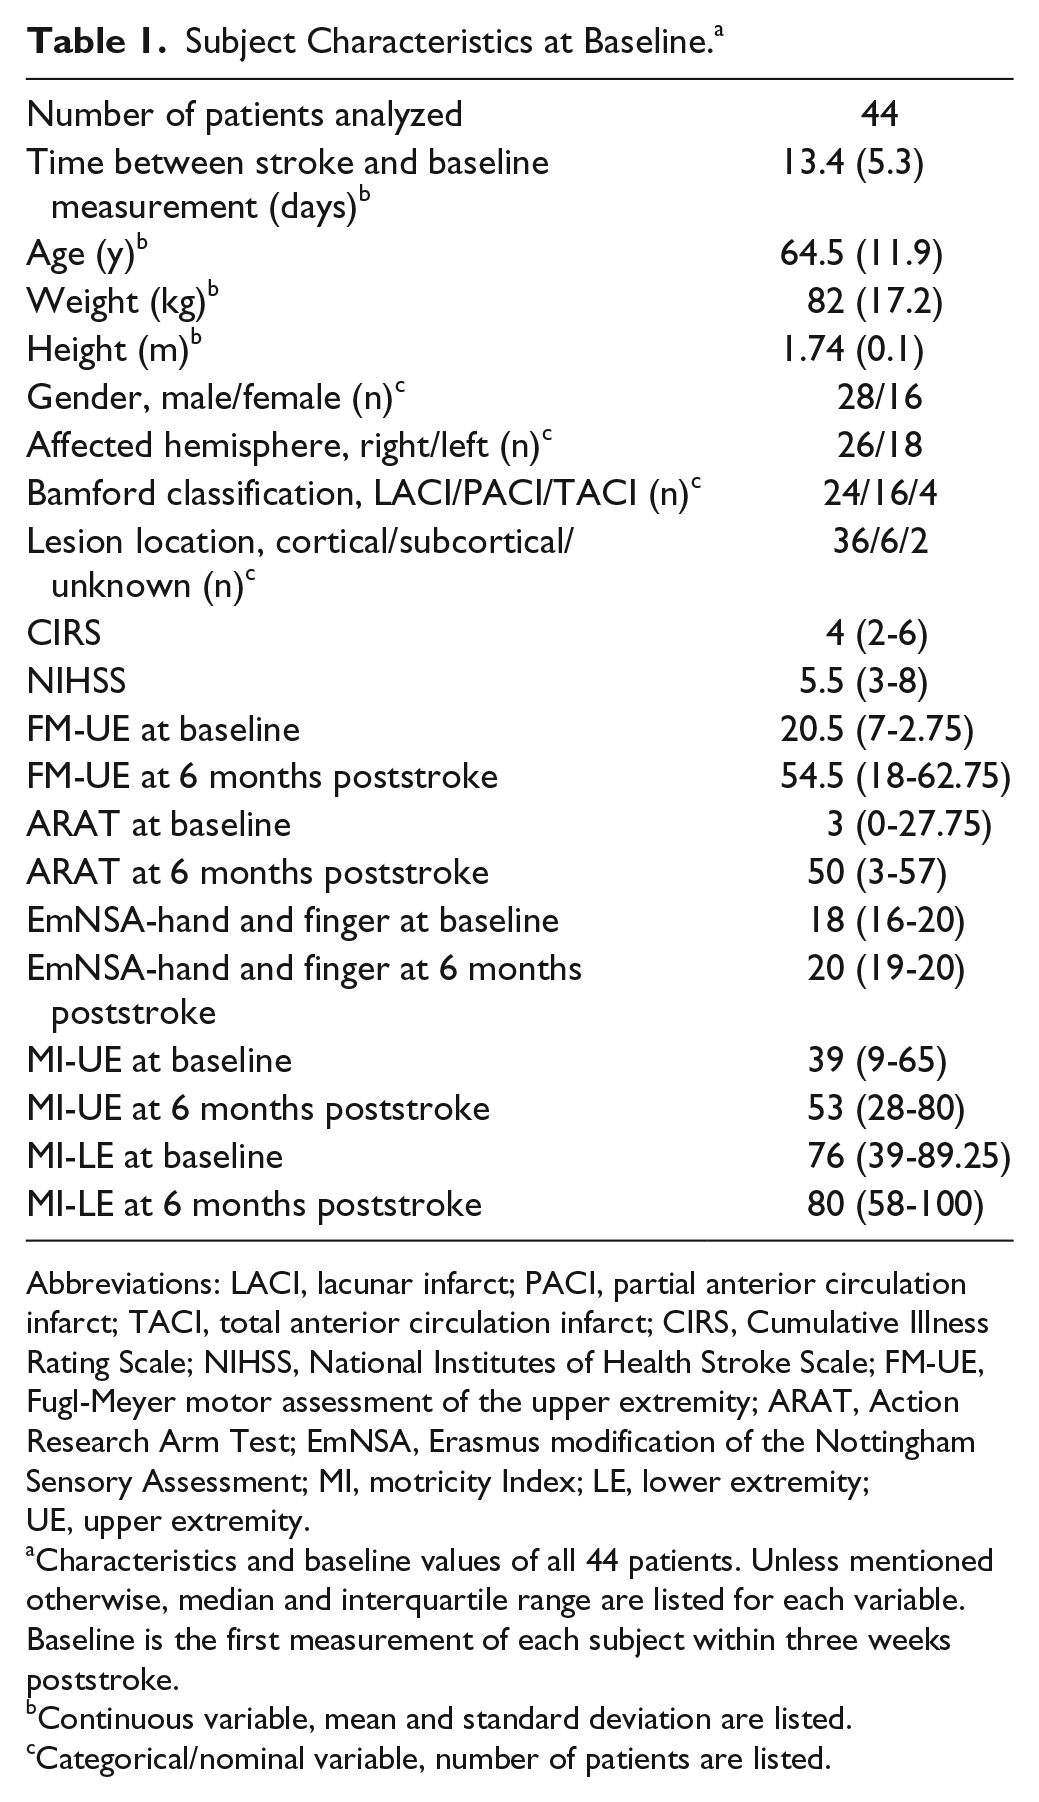
Forty-eight of the 1951 screened patients were included for this prospective cohort study. During follow-up, 4 patients withdrew from the study. Among the 44 remaining patients, 165 measurements were performed. One EEG measurement was missing in 11 patients with an additional missing of clinical measurement in 2 of these patients. See Figure 1 for a flowchart. EEG data quality was not sufficient to calculate the parameters for 3 measurements in 1 patient and for 1 measurement in 1 other patient. In 17 of the 165 measurements, 1 channel, and in 5 measurements, 2 channels were interpolated in the affected sensorimotor area from which PCC was calculated. This concerned 13 different patients. In 3 patients, the same channel was interpolated in 2 measurements. An example of the measured signals and their quality is displayed in Supplementary Figure 1. In 1 patient, EmNSA-HF could not be measured correctly due to failure to understand the instructions. Baseline characteristics of the study population are displayed in Table 1.
Subject Characteristics at Baseline. a
Abbreviations: LACI, lacunar infarct; PACI, partial anterior circulation infarct; TACI, total anterior circulation infarct; CIRS, Cumulative Illness Rating Scale; NIHSS, National Institutes of Health Stroke Scale; FM-UE, Fugl-Meyer motor assessment of the upper extremity; ARAT, Action Research Arm Test; EmNSA, Erasmus modification of the Nottingham Sensory Assessment; MI, motricity Index; LE, lower extremity; UE, upper extremity.
Characteristics and baseline values of all 44 patients. Unless mentioned otherwise, median and interquartile range are listed for each variable. Baseline is the first measurement of each subject within three weeks poststroke.
Continuous variable, mean and standard deviation are listed.
Categorical/nominal variable, number of patients are listed.
Changes in PCC Over Time
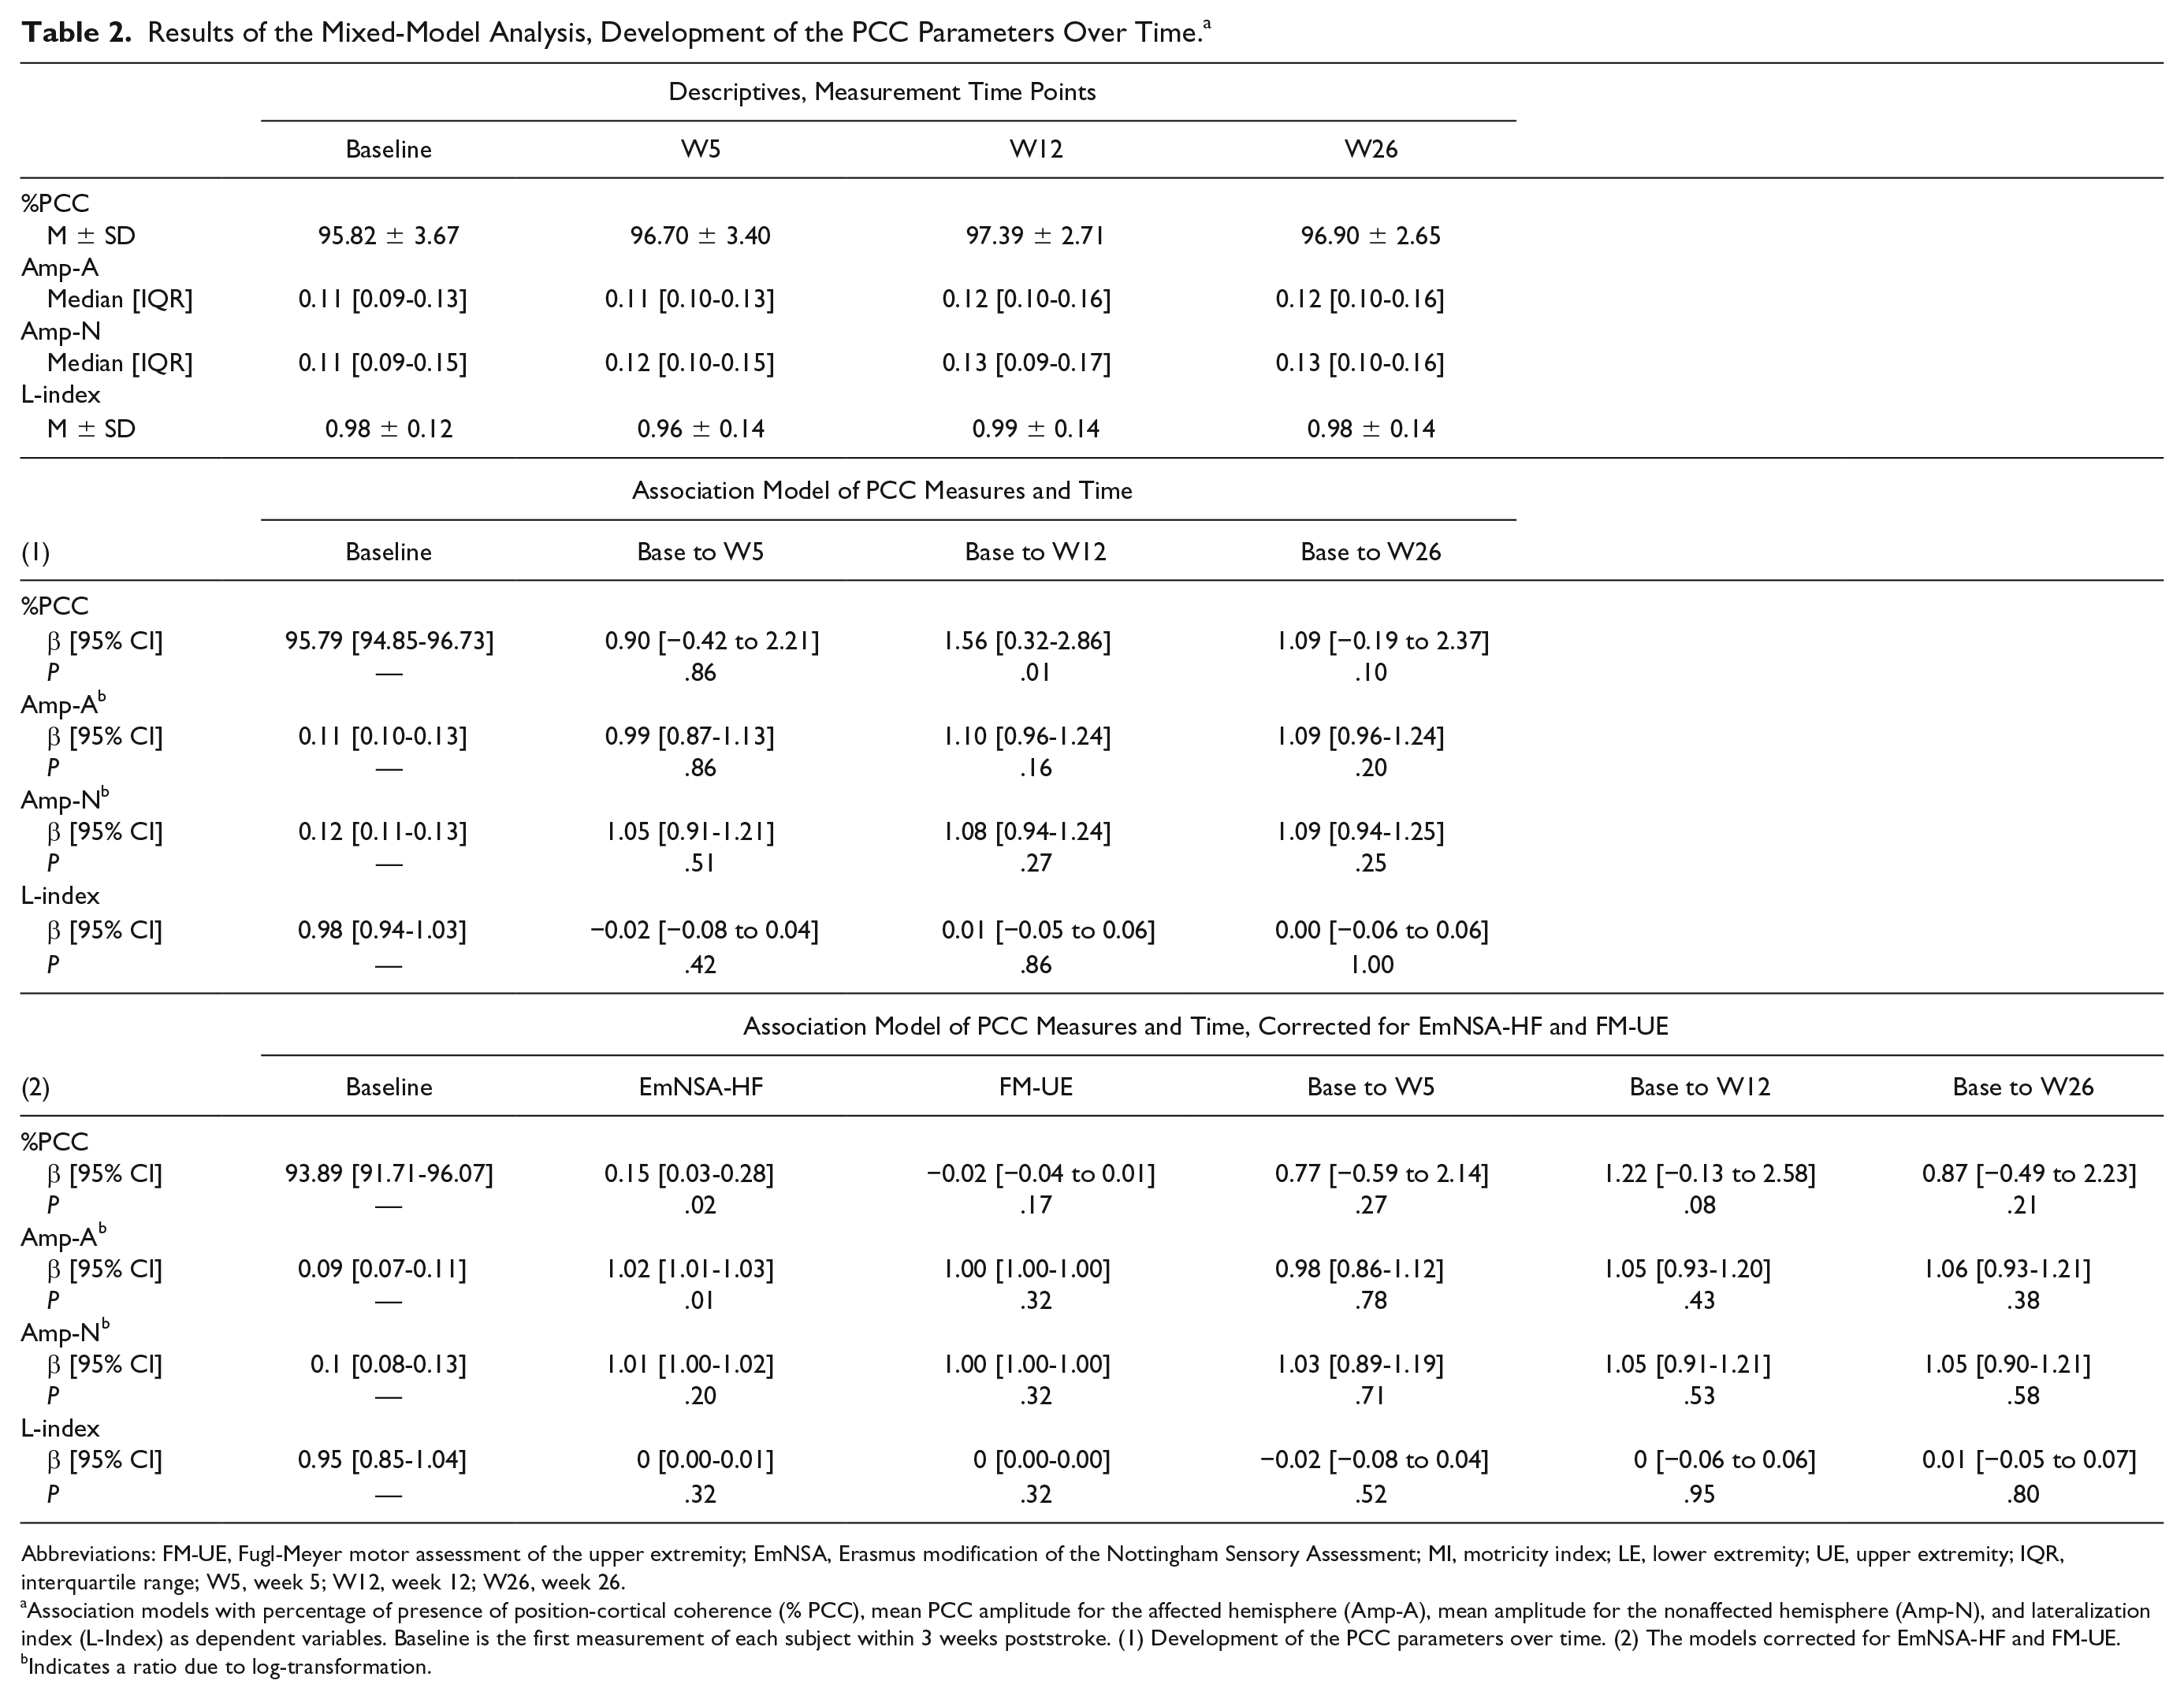
The association model for %PCC (Table 2) revealed a significantly higher %PCC at the 12-week measurement time point; mean (M) = 97.4%, standard deviation (SD) = 2.7%, as compared with baseline, M = 95.8%, SD = 3.7%, 95% confidence interval (CI) = 0.32 to 2.86, P = .01. These differences were no longer significant when the model was longitudinally corrected for EmNSA-HF and FM-UE.
Results of the Mixed-Model Analysis, Development of the PCC Parameters Over Time. a
Abbreviations: FM-UE, Fugl-Meyer motor assessment of the upper extremity; EmNSA, Erasmus modification of the Nottingham Sensory Assessment; MI, motricity index; LE, lower extremity; UE, upper extremity; IQR, interquartile range; W5, week 5; W12, week 12; W26, week 26.
Association models with percentage of presence of position-cortical coherence (% PCC), mean PCC amplitude for the affected hemisphere (Amp-A), mean amplitude for the nonaffected hemisphere (Amp-N), and lateralization index (L-Index) as dependent variables. Baseline is the first measurement of each subject within 3 weeks poststroke. (1) Development of the PCC parameters over time. (2) The models corrected for EmNSA-HF and FM-UE.
Indicates a ratio due to log-transformation.
No significant differences were found between the baseline and the other measurement time points, or between the 12- and 26-week measurements; M = 96.9%, SD = 2.7,β = −0.50, CI = −1.77 to 0.77, P = .44. Amp-A, Amp-N, and L-index did not differ significantly between measurement time points (see Table 2 and Supplementary Figure 2).
Association of PCC with EmNSA-HF and FM-UE
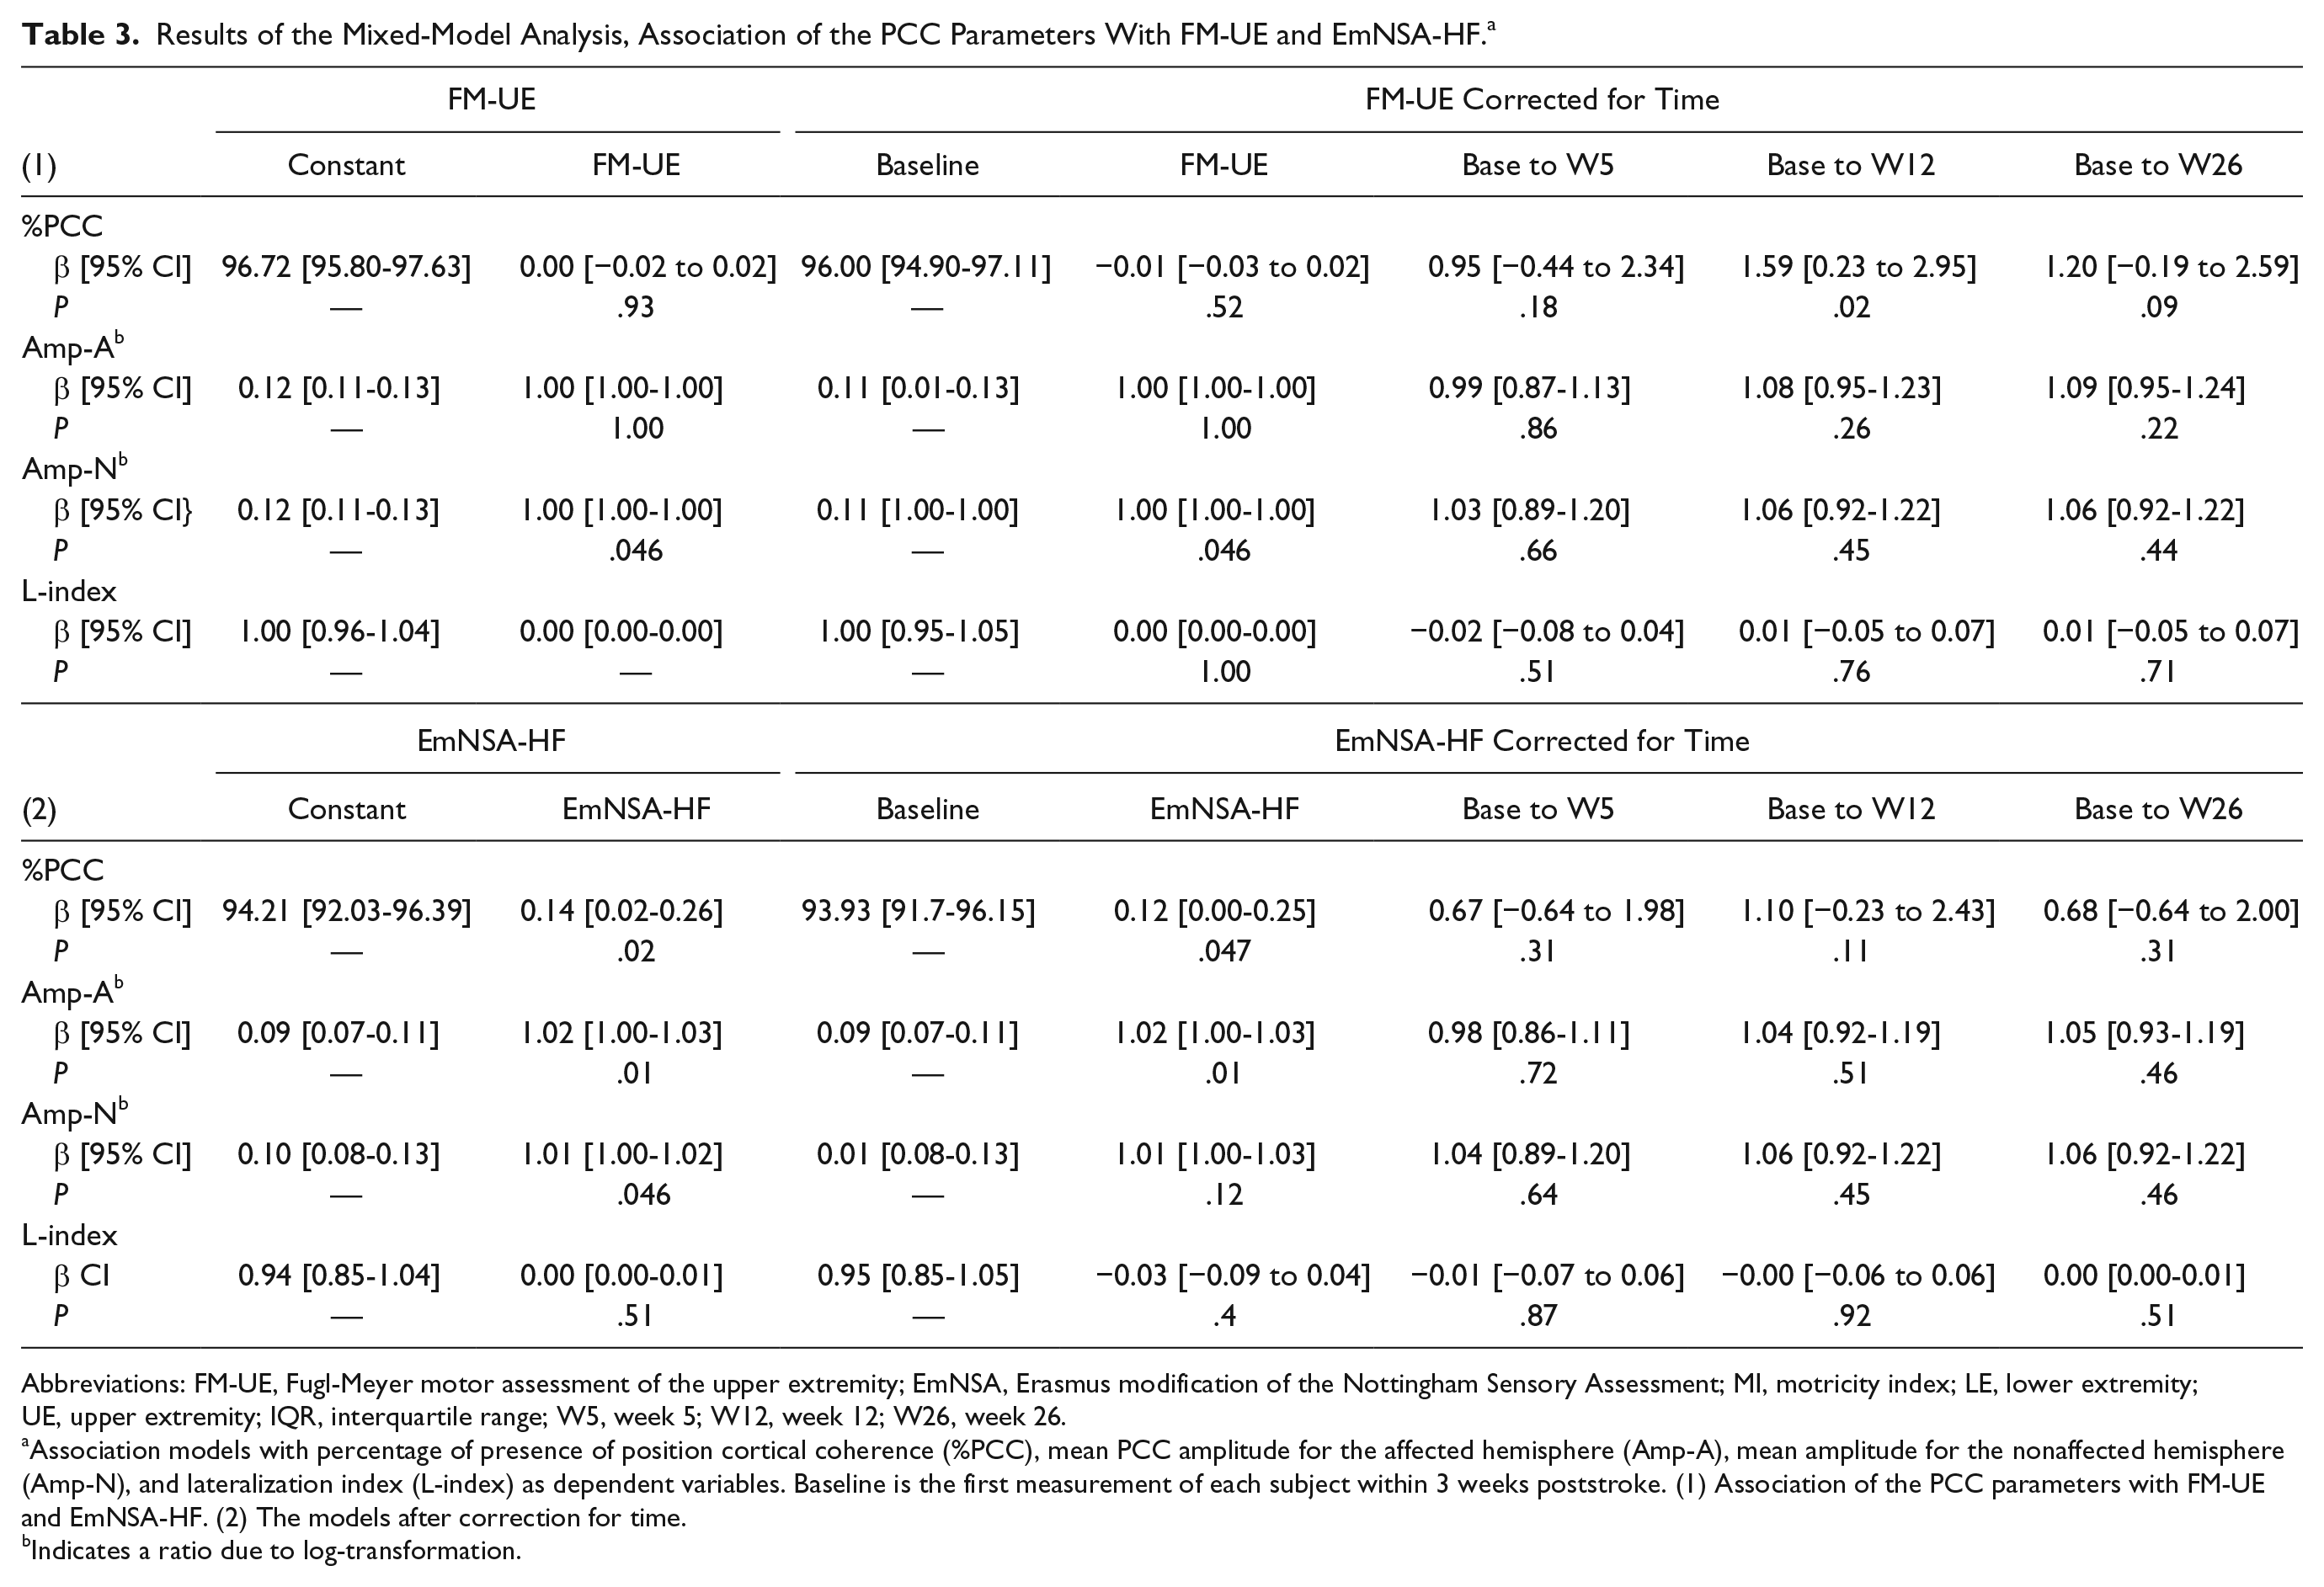
A significant positive association was found between %PCC and EmNSA-HF; β = 0.14, CI = 0.02 to 0.26, P = .02. The fixed effect estimate β for EmNSA-HF changed by more than 10%, to β = 0.12, CI = 0.00 to 0.25, P = .047, when measurement time was added to the model (see Table 3). No interaction effects were found between measurement time points and EmNSA-HF (Figure 4).
Results of the Mixed-Model Analysis, Association of the PCC Parameters With FM-UE and EmNSA-HF. a
Abbreviations: FM-UE, Fugl-Meyer motor assessment of the upper extremity; EmNSA, Erasmus modification of the Nottingham Sensory Assessment; MI, motricity index; LE, lower extremity; UE, upper extremity; IQR, interquartile range; W5, week 5; W12, week 12; W26, week 26.
Association models with percentage of presence of position cortical coherence (%PCC), mean PCC amplitude for the affected hemisphere (Amp-A), mean amplitude for the nonaffected hemisphere (Amp-N), and lateralization index (L-index) as dependent variables. Baseline is the first measurement of each subject within 3 weeks poststroke. (1) Association of the PCC parameters with FM-UE and EmNSA-HF. (2) The models after correction for time.
Indicates a ratio due to log-transformation.
A significant positive association was also found between Amp-A and EmNSA-HF; β = 1.02 (ratio due to log-transformation), CI = 1.00 to 1.03, P = .01. Including measurement time as a covariate did not change this model. No interaction effects were found between measurement time points and EmNSA-HF (Figure 4).
%PCC and Amp-A were not associated with FM-UE. While Amp-N and FM-UE were significantly associated;β = 1.00 (ratio due to log-transformation), CI = 1.00 to 1.00, P = .046. This association remained significant when measurement time was added to the model. The positive association found between Amp-N and EmNSA-HF; β = 1.01 (ratio due to log-transformation), CI = 1.00 to 1.02,P = .046, did not change when corrected for measurement time. No interaction effects were found.
No association was found between L-index and FM-UE or EmNSA-HF (Table 3 and Supplementary Figures 3 and 4).
Subgroups of Motor Recovery Patterns
Of the 44 patients, 31 showed spontaneous recovery and were classified as recoverers. Eight of these recoverers started with a FM-UE score lower than 18 and were categorized as low-baseline recoverers. The remaining 23 patients had a FM-UE score of 18 points or higher at baseline and were categorized as high-baseline recoverers. Thirteen patients were classified as non-recoverers, all of them having a FM-UE score lower than 18 points at baseline (Figure 3).
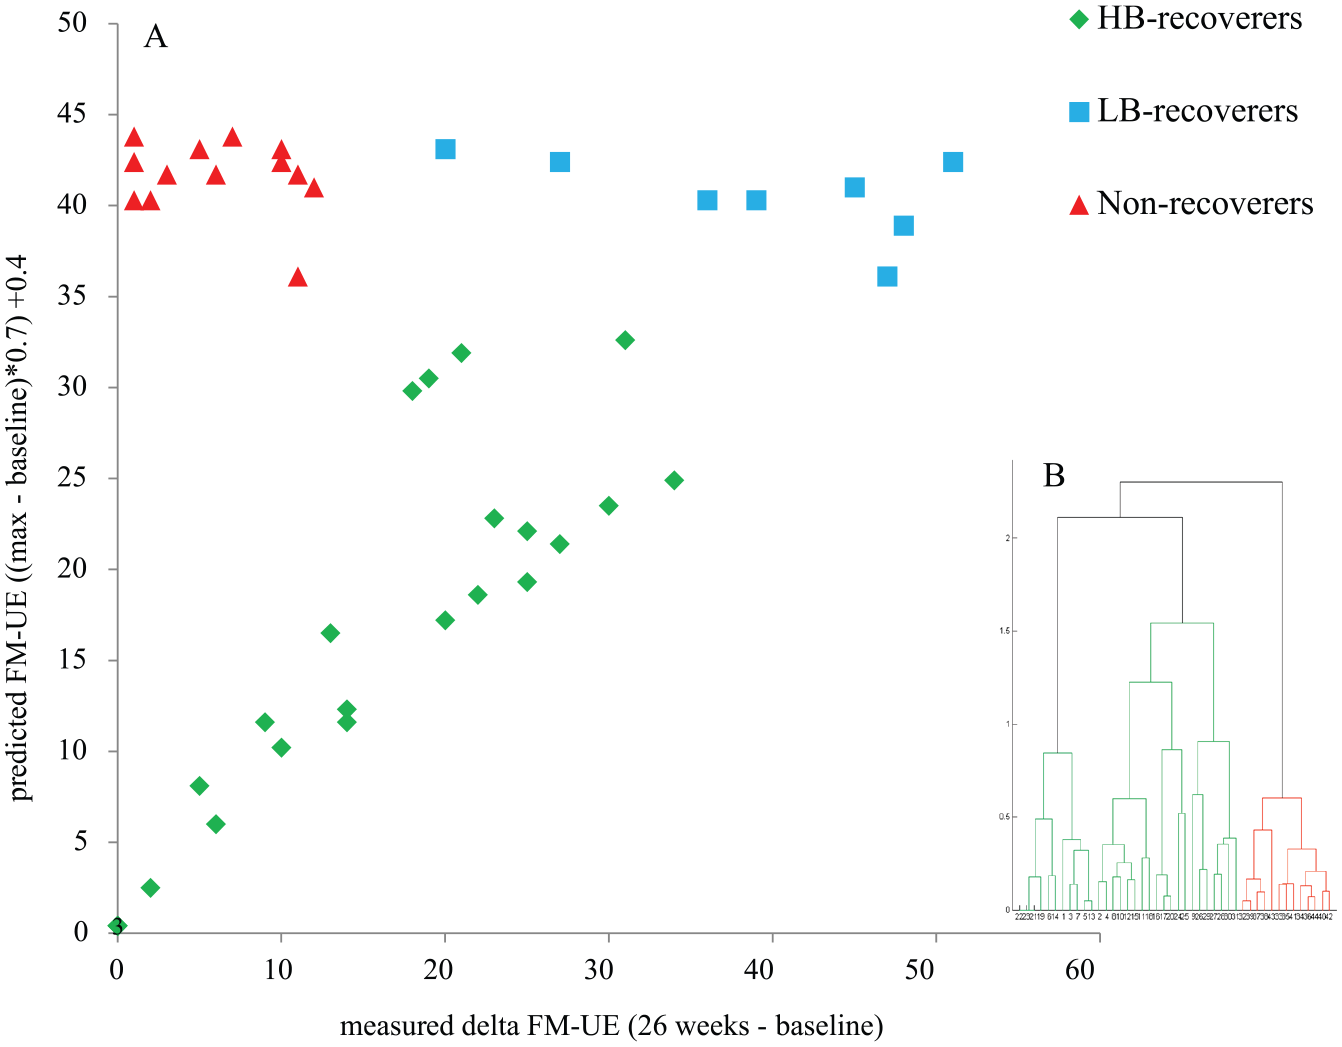
Cluster analysis to distinguish recovery groups.
Baseline Characteristics of Patient Subgroups
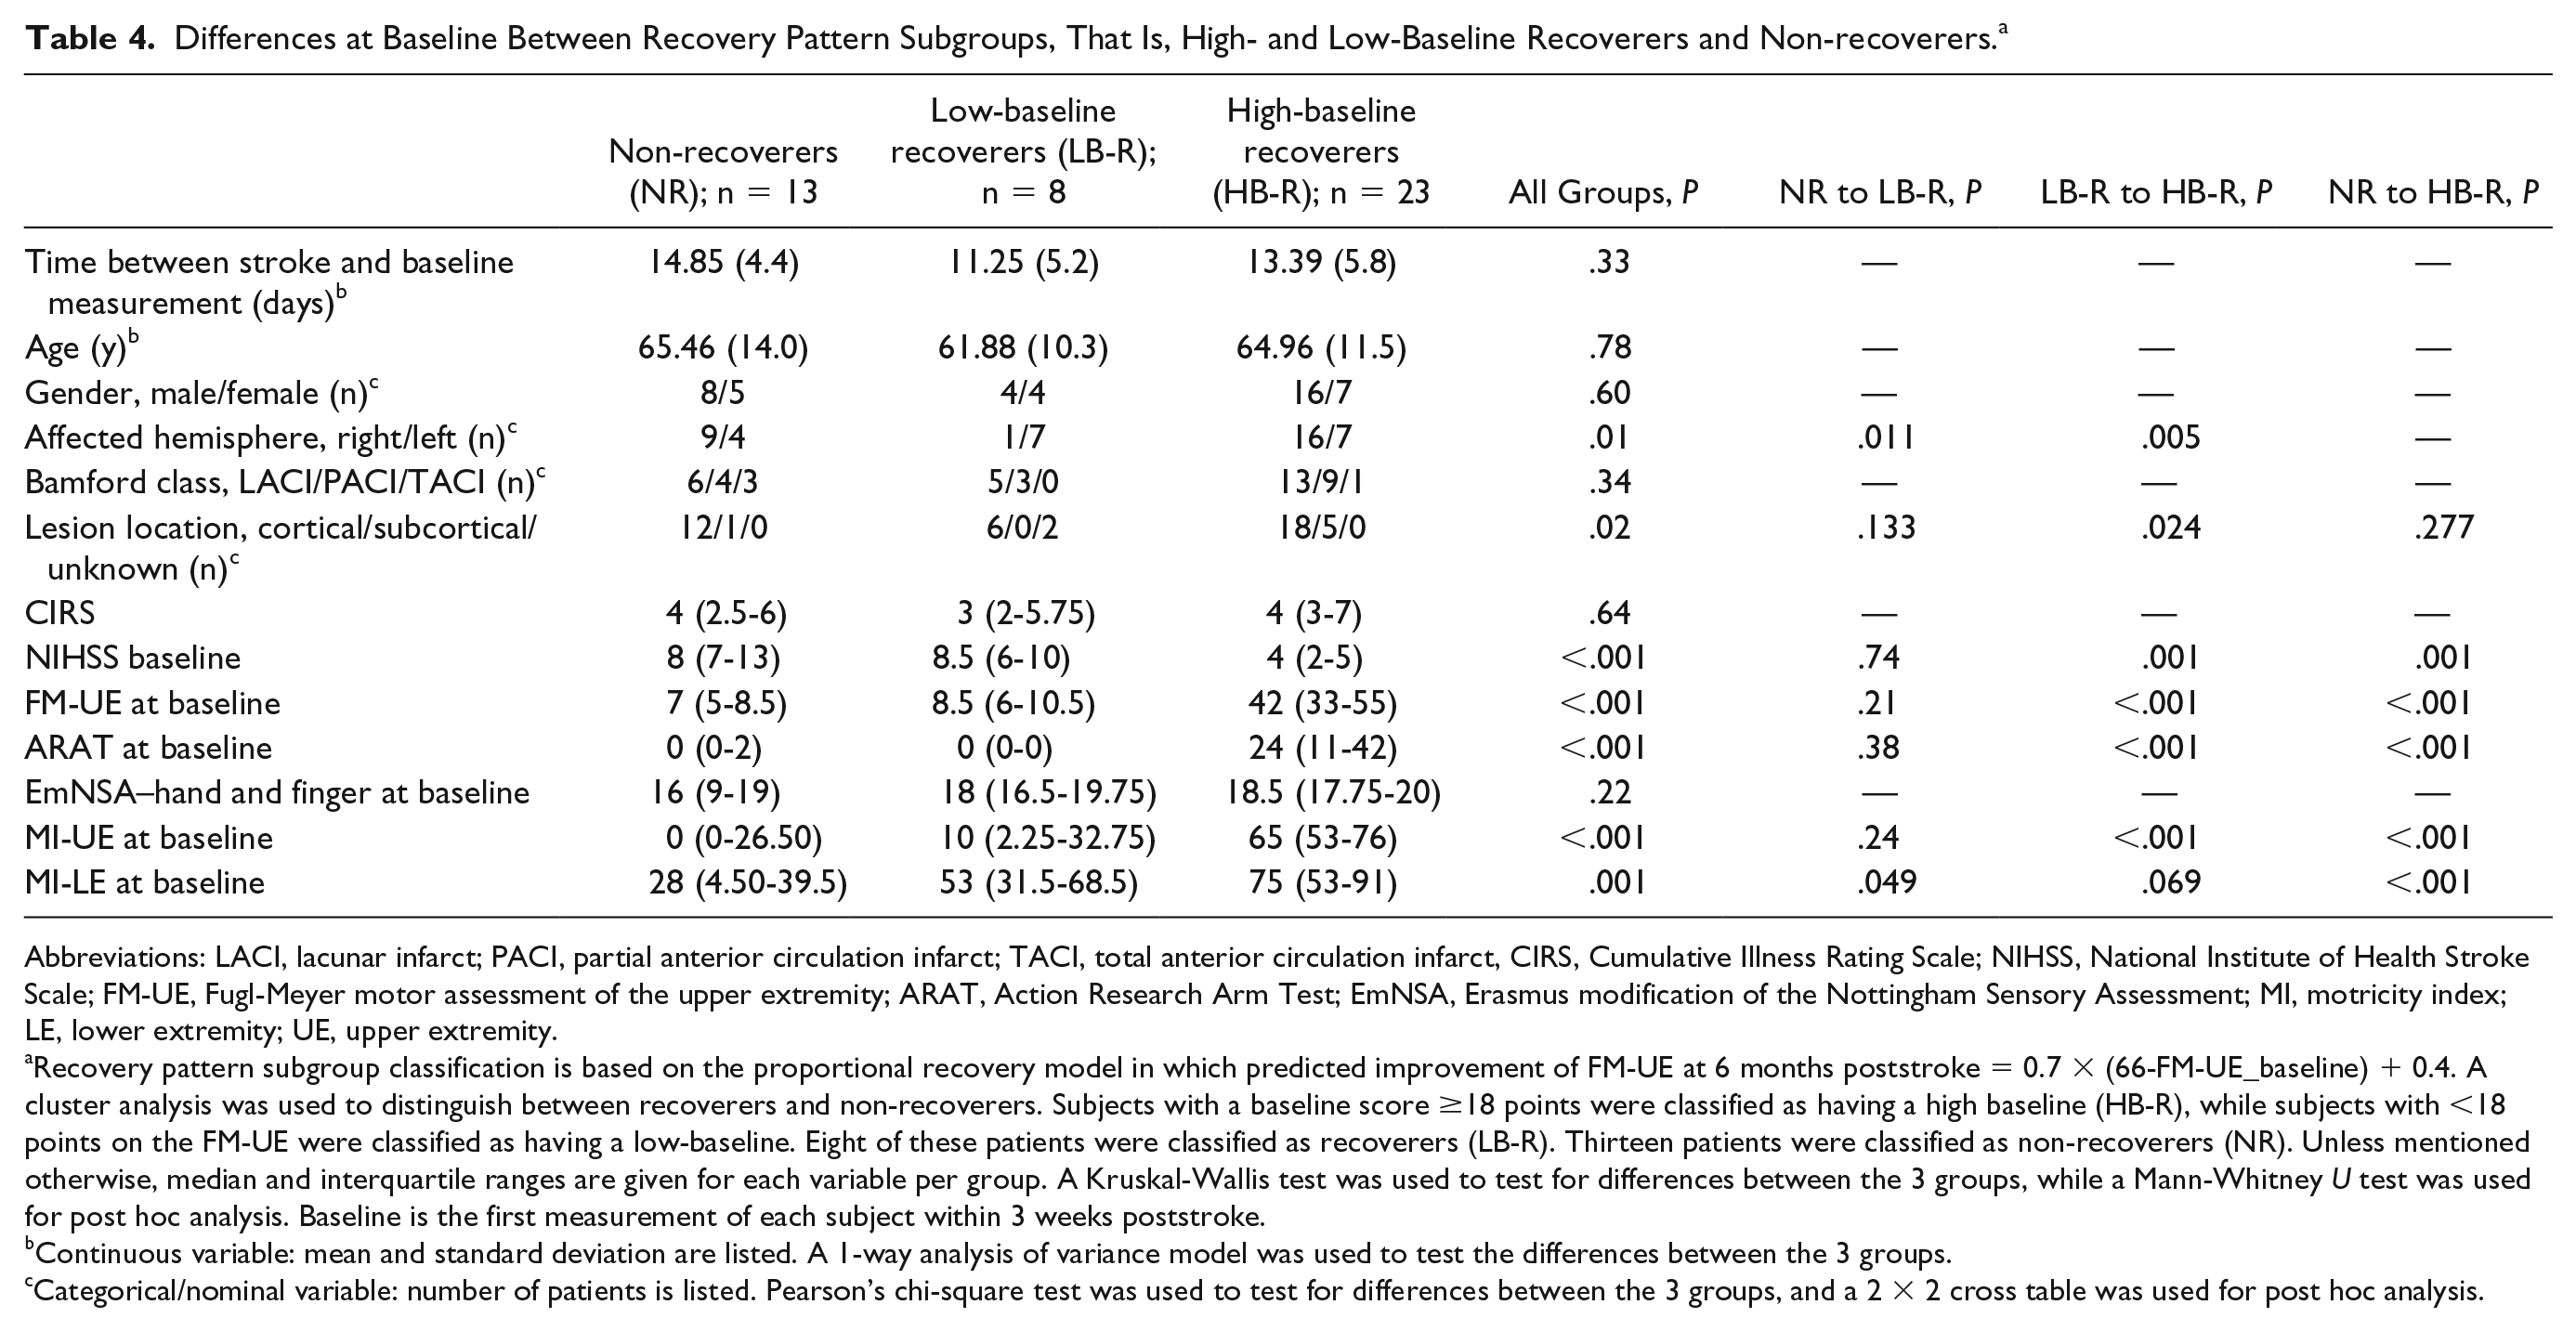
Differences between high-baseline recoverers, low-baseline recoverers and non-recoverers are presented in Table 4. Non-recoverers and low-baseline recoverers significantly differed only by their affected hemisphere; non-recoverers: 9 right- versus 4 left-sided affected; low-baseline recoverers: 1 right- versus 7 left-sided, P = .01, and on the motricity index of the lower extremity; non-recoverers: median = 28, interquartile range (IQR) = 4.5 to 39.5, low-baseline recoverers: median = 53, IQR = 31.5 to 68.5, P = .05 (Table 4).
Differences at Baseline Between Recovery Pattern Subgroups, That Is, High- and Low-Baseline Recoverers and Non-recoverers. a
Abbreviations: LACI, lacunar infarct; PACI, partial anterior circulation infarct; TACI, total anterior circulation infarct, CIRS, Cumulative Illness Rating Scale; NIHSS, National Institute of Health Stroke Scale; FM-UE, Fugl-Meyer motor assessment of the upper extremity; ARAT, Action Research Arm Test; EmNSA, Erasmus modification of the Nottingham Sensory Assessment; MI, motricity index; LE, lower extremity; UE, upper extremity.
Recovery pattern subgroup classification is based on the proportional recovery model in which predicted improvement of FM-UE at 6 months poststroke = 0.7 × (66-FM-UE_baseline) + 0.4. A cluster analysis was used to distinguish between recoverers and non-recoverers. Subjects with a baseline score ≥18 points were classified as having a high baseline (HB-R), while subjects with <18 points on the FM-UE were classified as having a low-baseline. Eight of these patients were classified as recoverers (LB-R). Thirteen patients were classified as non-recoverers (NR). Unless mentioned otherwise, median and interquartile ranges are given for each variable per group. A Kruskal-Wallis test was used to test for differences between the 3 groups, while a Mann-Whitney U test was used for post hoc analysis. Baseline is the first measurement of each subject within 3 weeks poststroke.
Continuous variable: mean and standard deviation are listed. A 1-way analysis of variance model was used to test the differences between the 3 groups.
Categorical/nominal variable: number of patients is listed. Pearson’s chi-square test was used to test for differences between the 3 groups, and a 2 × 2 cross table was used for post hoc analysis.
Association of EmNSA-HF With Motor Recovery Subgroups
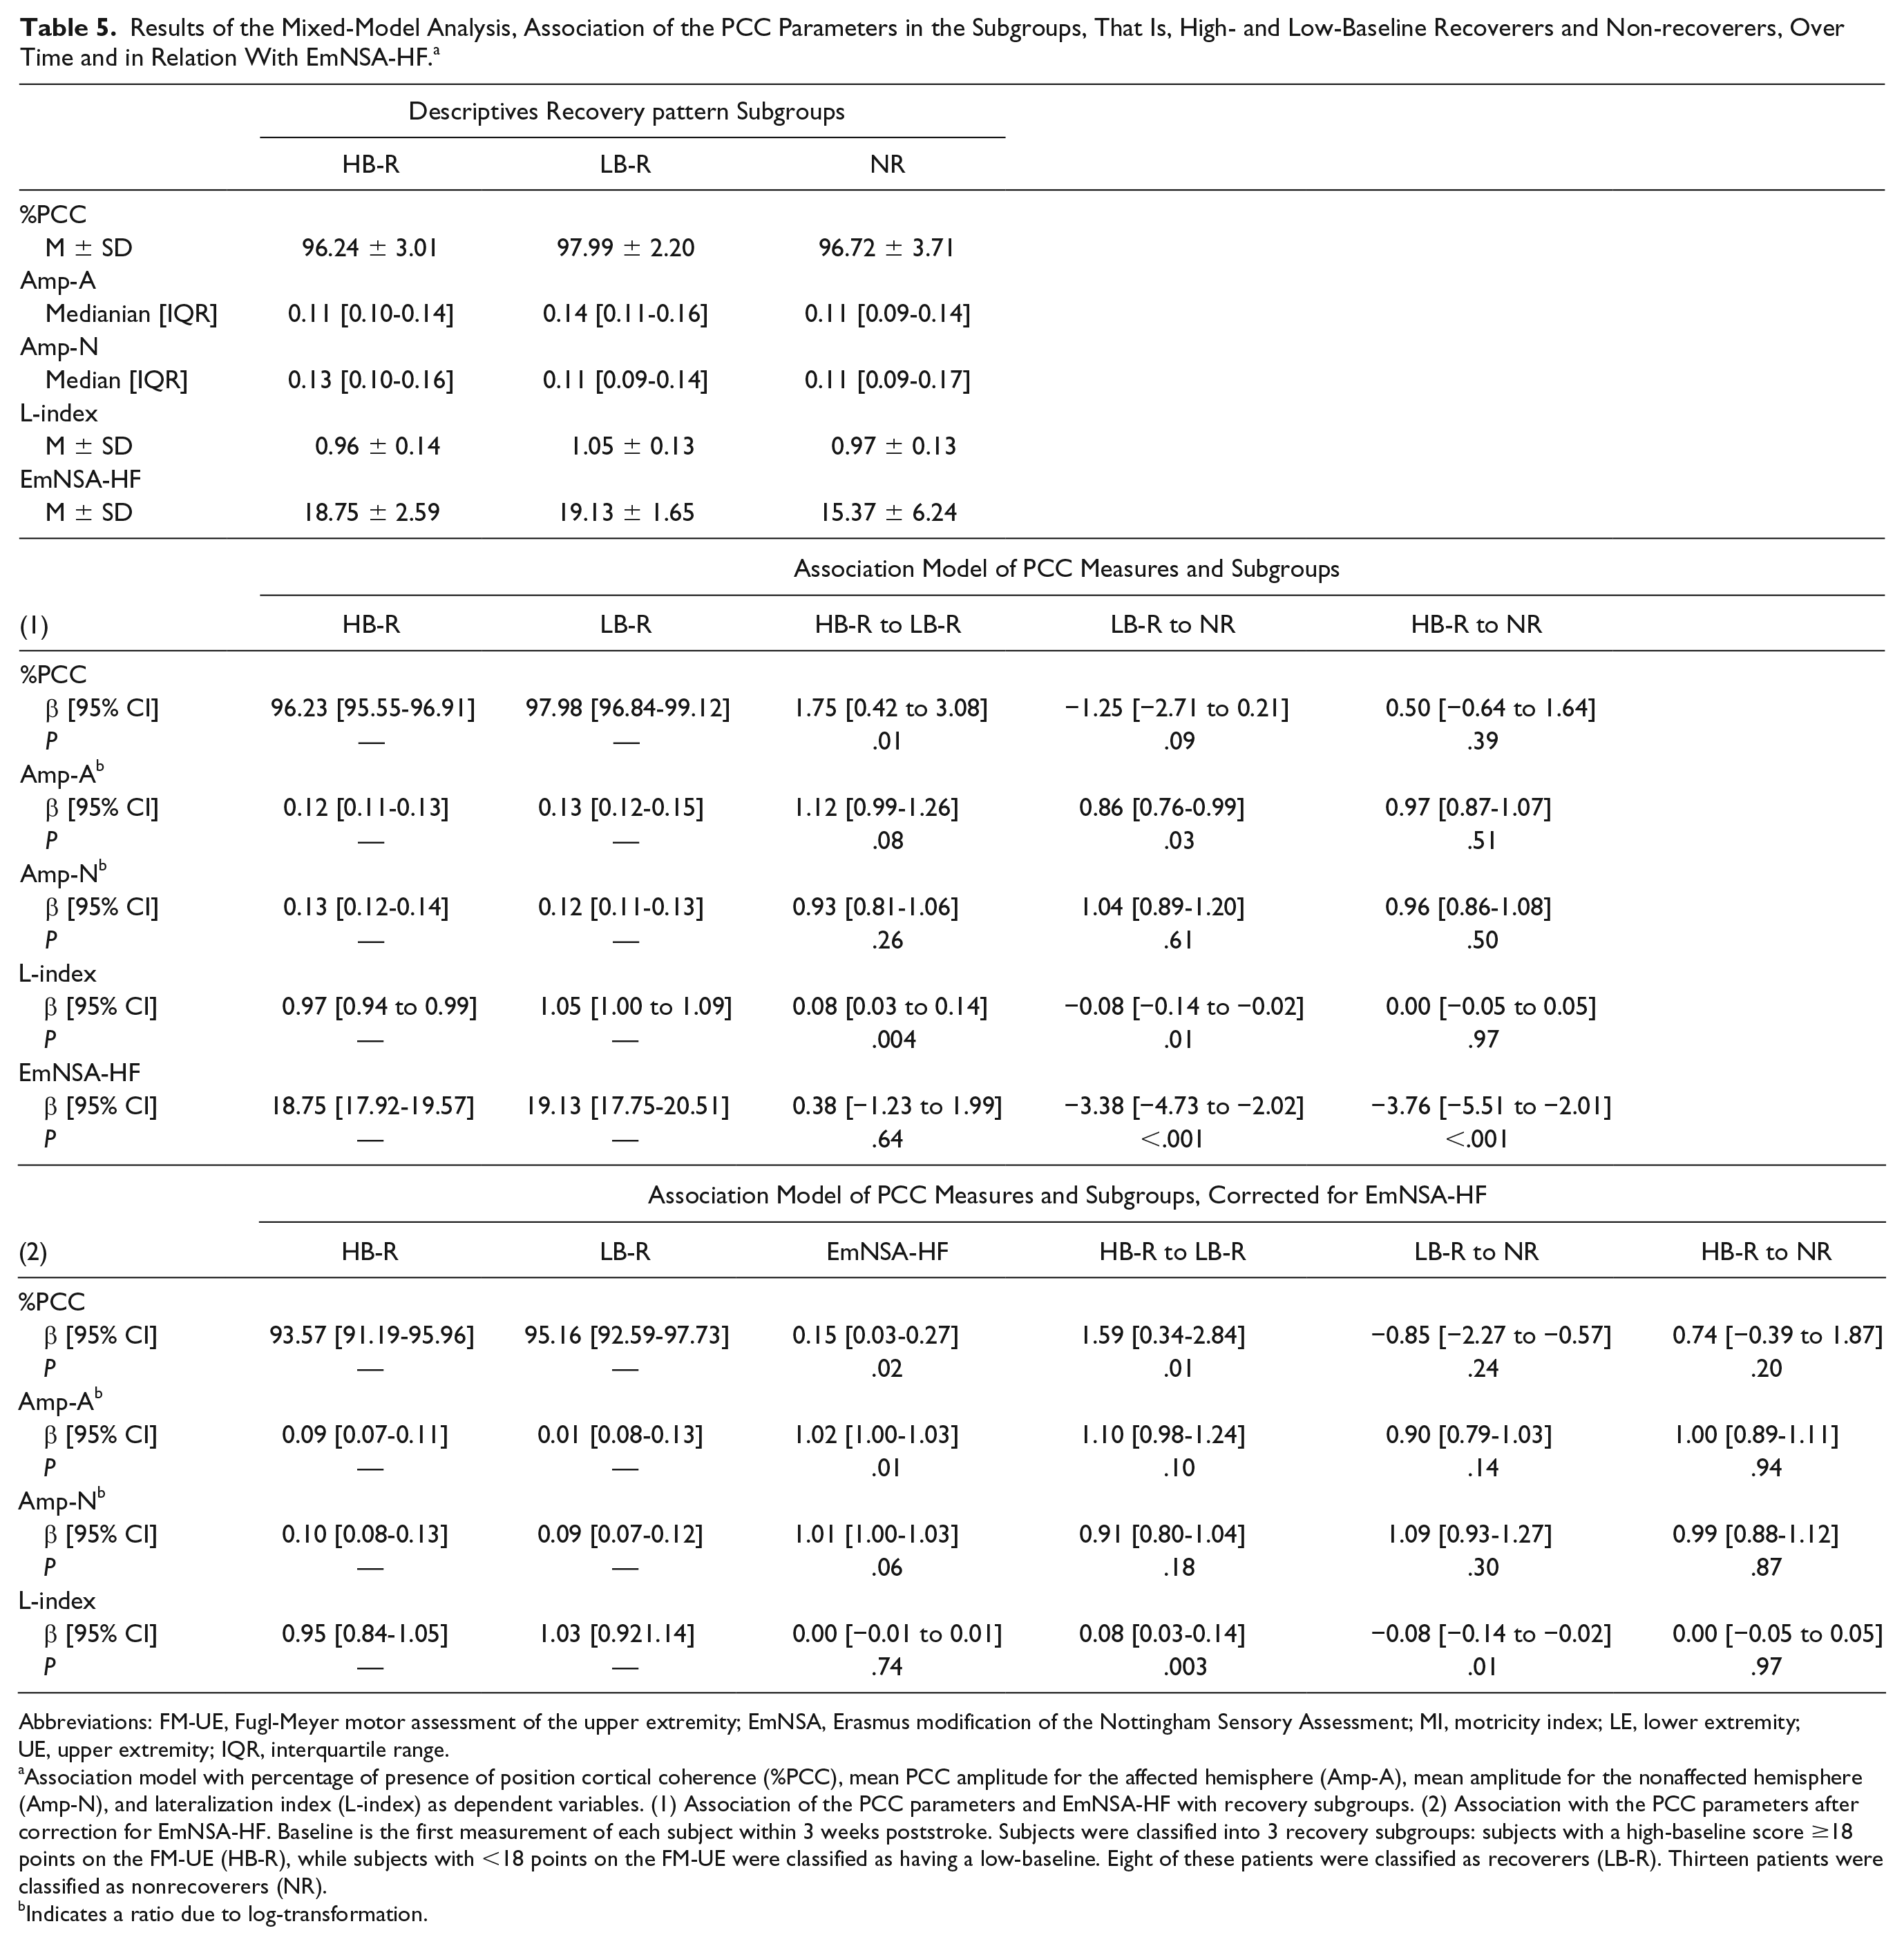
EmNSA-HF showed a significantly lower value in non-recoverers: M = 15.37, SD = 6.24 as compared with low-baseline recoverers: M = 19.13, SD = 1.65; β = −3.38, CI = −4.73 to −2.02, P < .001 and compared with high-baseline recoverers M = 18.75, SD = 2.59; β = −3.76, CI = −5.51 to −2.01, P < .001.
Association of PCC Measures With Motor Recovery Subgroups
A significantly higher %PCC was found in the low-baseline, M = 98.0, SD = 2.2, as compared with the high-baseline recoverers: M = 96.2, SD = 3.0, β = 1.75 CI = 0.42 to 3.08, P = .01. A nonsignificantly lower %PCC was found in the non-recoverers: M = 96.7, SD = 3.7, as compared with low-baseline recoverers; β = −1.25, CI = −2.71 to 0.21,P = .09. No difference was found between high-baseline recoverers and non-recoverers. EmNSA-HF as a covariate improved the model, this correction attenuated the difference between low-baseline recoverers and non-recoverers (Table 5 and Figure 4).
Results of the Mixed-Model Analysis, Association of the PCC Parameters in the Subgroups, That Is, High- and Low-Baseline Recoverers and Non-recoverers, Over Time and in Relation With EmNSA-HF. a
Abbreviations: FM-UE, Fugl-Meyer motor assessment of the upper extremity; EmNSA, Erasmus modification of the Nottingham Sensory Assessment; MI, motricity index; LE, lower extremity; UE, upper extremity; IQR, interquartile range.
Association model with percentage of presence of position cortical coherence (%PCC), mean PCC amplitude for the affected hemisphere (Amp-A), mean amplitude for the nonaffected hemisphere (Amp-N), and lateralization index (L-index) as dependent variables. (1) Association of the PCC parameters and EmNSA-HF with recovery subgroups. (2) Association with the PCC parameters after correction for EmNSA-HF. Baseline is the first measurement of each subject within 3 weeks poststroke. Subjects were classified into 3 recovery subgroups: subjects with a high-baseline score ≥18 points on the FM-UE (HB-R), while subjects with <18 points on the FM-UE were classified as having a low-baseline. Eight of these patients were classified as recoverers (LB-R). Thirteen patients were classified as nonrecoverers (NR).
Indicates a ratio due to log-transformation.
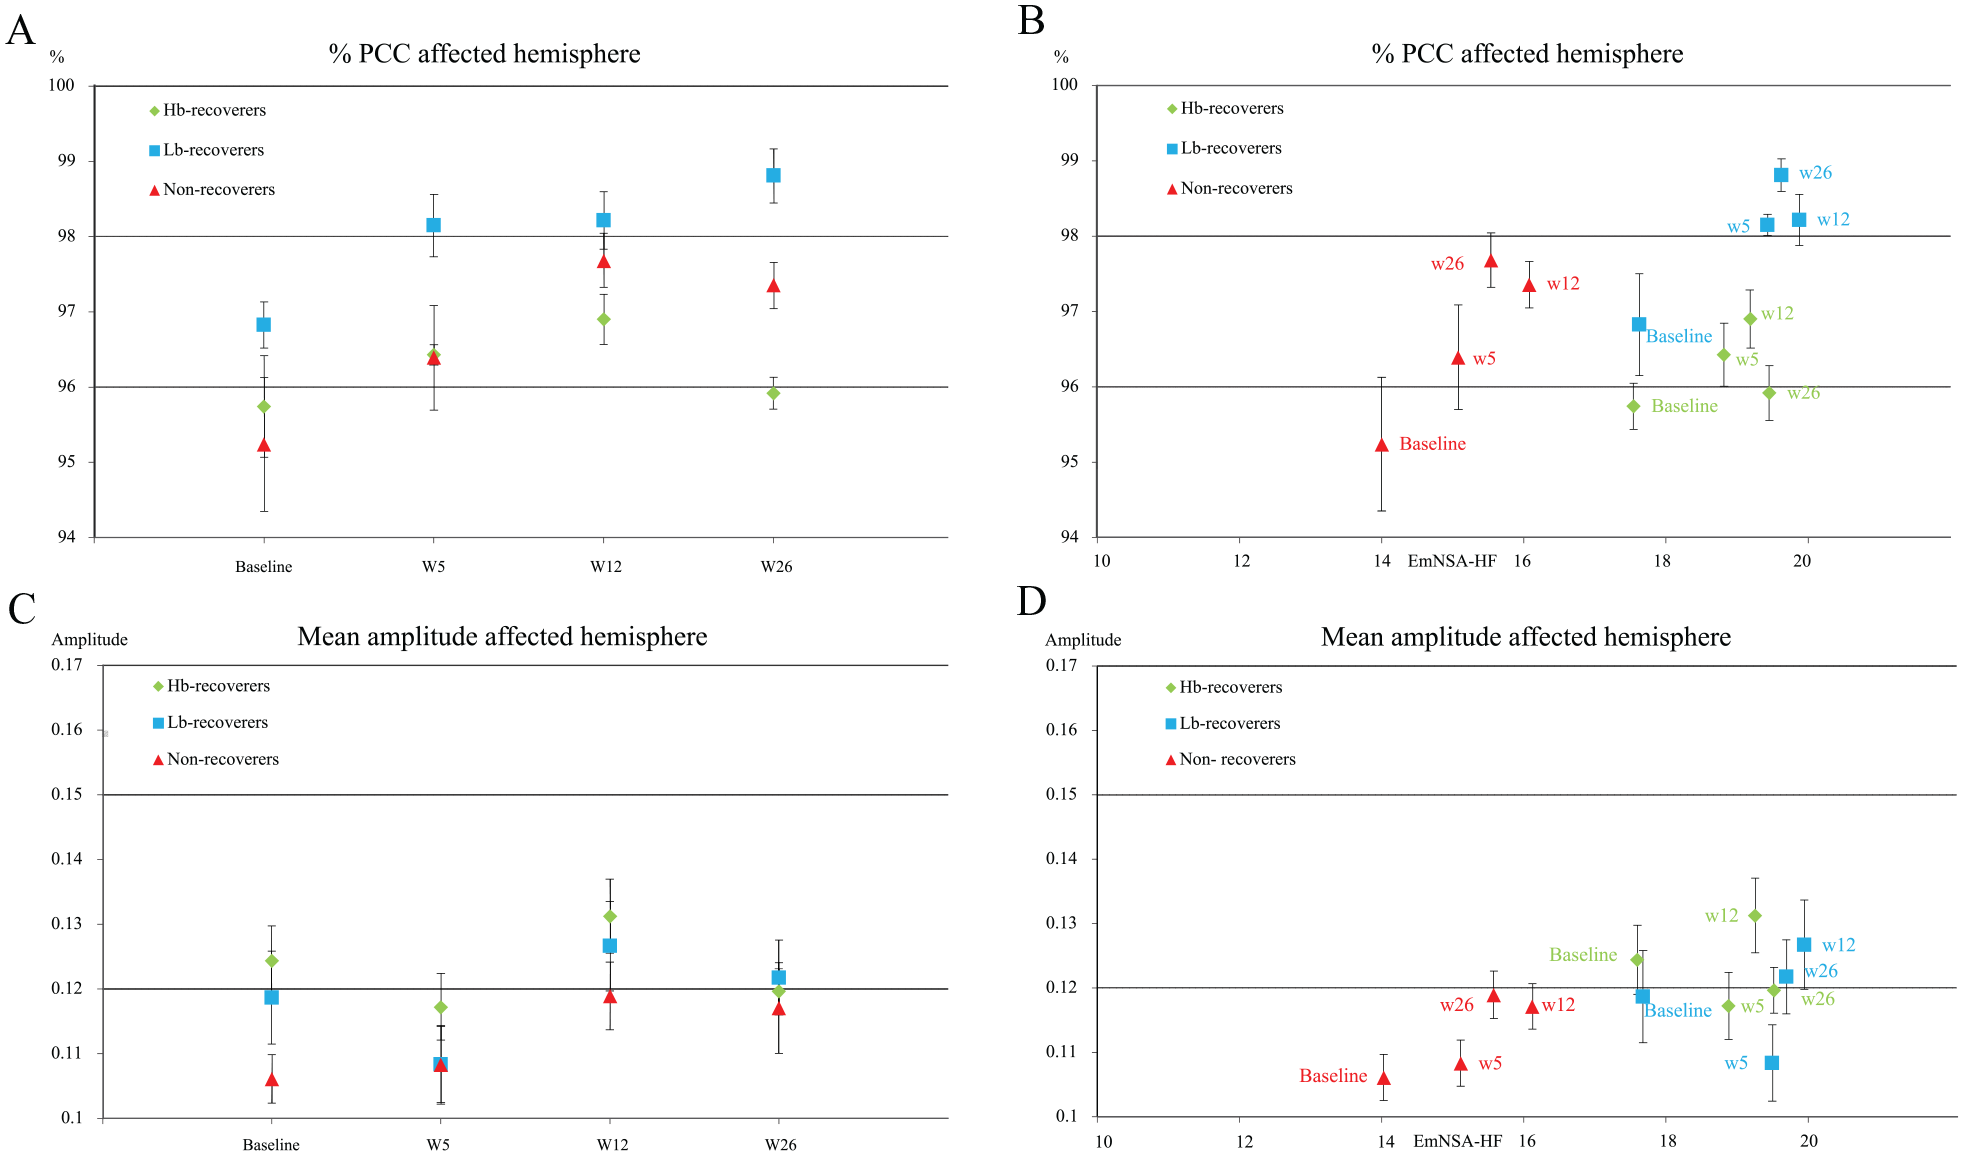
Percentage of significant PCC (%PCC) and amplitude of PCC in the affected hemisphere in the recovery groups, over time and in relation with EmNSA-HF. (Panel A) %PCC of the electrodes over the affected hemisphere over time. (Panel B) % PCC versus the EmNSA-HF. (Panel C) Mean amplitude of PCC of all electrodes overlapping the sensorimotor cortex of the affected hemisphere over time. (Panel D) Amplitude of PCC versus the EmNSA-HF.
A lower Amp-A was found in non-recoverers, median = 0.11, IQR = 0.09 to 0.14, as compared with low-baseline recoverers, median = 0.14, IQR = 0.1 to 0.2; β = 0.86 (ratio due to log-transformation), CI = 0.76 to 0.99, P = .03. A nonsignificantly higher Amp-A was found in low-baseline recoverers as compared with high-baseline recoverers: median = 0.11, IQR = 0.10 to 0.14; β = 1.12, CI = 0.99 to 1.26, P = .09.
No difference in Amp-A was found between high-baseline recoverers and non-recoverers. Measurement time as a covariate did not change the model by 10% or more (Table 5 and Figure 4). No difference in Amp-N was found between the subgroups.
A significantly lower L-index was found in non-recoverers: M = 0.97, SD = 0.13 as compared with low-baseline recoverers: M = 1.05, SD = 0.13, β = −0.08, CI = −0.14 to −0.02, P = .01, as well as among high-baseline recoverers: M = 0.96, SD = 0.14 as compared with low-baseline recoverers, β = 0.08, CI = 0.03 to 0.14, P = .003. Adding EmNSA-HF as a covariate did not influence these differences (Table 5 and Supplementary Figure 3).
Discussion
We conducted a longitudinal cohort study with repetitive measurements at fixed time points poststroke combining EEG with clinical measures of sensorimotor function of the upper limb after stroke. We found a significant difference between percentage of position cortical coherence (%PCC) at baseline and at 12 weeks poststroke, a difference that attenuated after correction for level of somatosensory and motor impairment. No significant difference was found between the 12- and 26-week measurements or between the baseline and 26-week measurements. This time window of 12 weeks poststroke is in line with mechanisms of spontaneous neurobiological recovery, which is predominant in the first 5 to 8 weeks poststroke.2,24 We therefore confirm our first hypothesis that %PCC changes over time as a reflection of spontaneous neurobiological recovery. This result also confirms the need for repetitive measurements to quantify the nonlinear time-dependent dynamics of cortical markers in the recovery of upper limb function after stroke. 25 The significant positive longitudinal relation found between %PCC and EmNSA-HF, Amp-A, and EmNSA-HF and between Amp-N and EmNSA-HF confirms the longitudinal construct validity of %PCC and Amp-A as a measure of afferent pathway integrity.
We found a significant association between motor function in terms of FM-UE score and Amp-N, while the other measures did not show this association. The present result is therefore not in line with an earlier cross-sectional study, 14 which found a significantly higher %PCC in the group of patients with FM-UE scores >18 points as compared with the more severely affected patients. The lower overall %PCC, ranging from 35% to 95% 14 compared with the 85% to 100% range found in our study may be explained by the differences in artifact removal, since we used independent component analysis and interpolated poor data channels.
We found a significant association between Amp-N and FM-UE, irrespective of the time of assessment poststroke. Interestingly, we found no difference between motor recovery subgroups (high-baseline recoverers, low-baseline recoverers, and non-recoverers). Although the L-index showed no association with FM-UE nor with EmNSA-HF, the L-index did show significant more lateralization toward the affected hemisphere in the low-baseline recoverers, while the expected and non-recoverers showed lateralization toward the nonaffected hemisphere. Unlike %PCC and Amp-A, these differences could not be explained by differences in EmNSA-HF. It is therefore unclear what exactly is represented by the L-index and Amp-N.
A total of 70.5% of the included patients in this study showed spontaneous neurobiological recovery, including all patients with a FM-UE score of 18 points or higher at baseline, which is comparable to previously studies.4,22 The longitudinal association between EmNSA-HF and the subgroups revealed a significantly higher EmNSA-HF in both low and high-baseline recoverers as compared to the non-recoverers, and no difference between the low and high-baseline recoverers.
We could not confirm our third hypothesis that PCC would be lower in non-recoverers compared with recoverers and would not differ between high- and low-baseline recoverers. The expected construct of %PCC, representing solely the integrity of afferent pathways may therefore be incomplete. A possible explanation for the lower values of %PCC in both the non-recoverers and the high-baseline recoverers could be that %PCC also reflects enhanced activity of cortical networks next to representing afferent pathway integrity. A decrease in beta-rebound, that is, an increase in cortical excitability, in response to tactile finger stimulation and passive finger movement, has been previously linked to better functional outcome.12,26 Possibly this increased cortical excitability may only be needed after stroke when motor function is severely affected, this compensatory mechanism might then be failing in the non-recoverers.
Parkkonen et al 12 used passive finger movements to evoke cortical responses, a task comparable to that is used in our study, in a cohort of 23 patients who were measured within 1 week and at 1 month and 1 year poststroke. In addition to a significant positive correlation between cortical excitability (decrease in beta-rebound measured with magnetoencephalography) and functional outcome, a decrease in cortical excitability was found over time, which correlated with functional recovery. 12 It is possible that in our study, a normalization of cortical excitability had already occurred in the high-baseline recoverers before the first measurement within 3 weeks, reflected by a lower %PCC, paralleling their functional recovery.
Nicolo et al 27 suggested that the association between coherence measures of functional connectivity and clinical improvement after stroke might reflect neurotransmitter changes, and that GABAergic processes in particular are reflected in the beta band. Our perturbation signal was largely within the beta band range, therefore PCC might reflect a similar process. Our study provides evidence that cortical excitability as well as afferent pathway integrity might be contained in %PCC. Establishing the direct link between EEG markers and synaptic processes requires further research that can bridge the gap between animal models and early poststroke studies in humans. 28
To the best of our knowledge, this study is the largest prospectively conducted cohort study on EEG and upper limb function in stroke so far. The study incurred only a few dropouts and missing serial EEG measurements. The high compliance may be attributable to the use of a measurement van allowing to collect high-quality data. No differences between the group measured in the hospital and the van for all 4 PCC parameters were found, and data quality was comparable. The measurement van could be a promising way to measure patients in their local community, which reduces burden and costs. It may be a new way to explore the longitudinal relationship between derivatives of brain plasticity, such as EEG, and clinical somatosensory and motor recovery very early poststroke. Importantly, differences in timing of assessments could be avoided as was recommended by the Stroke Recovery and Rehabilitation Roundtable task force. 29
Limitations and Future Directions
Four different outcome parameters of PCC were calculated for this study and tested in separate mixed-model analysis. No adjustment for multiple comparisons was made since most results were obtained from one model and the conclusions of the article were not based on single significant result. Values displayed in Tables 4 and 5 should be interpreted as such.
Our study included significantly more patients with a subcortical lesion in the high compared to the low-baseline recoverers, while no significant difference was found between the non-recoverers and recoverers. We recommend for future studies to make magnetic resonance imaging scans several months after stroke to provide detailed information with respect to the exact lesion volume and location, to explain individual differences in recovery. It could be informative to compare anatomical afferent pathway integrity by diffusion tensor images with functional alternation measured with EEG. 15
The presence of PCC and the Amp-A (PCC amplitude of the affected hemisphere) show generally the same pattern in the association models. The small range of 16% at baseline (from 84% to 100%), with 6 out of the 44 patients at 100% PCC, suggests a ceiling effect of %PCC. %PCC indicates whether or not coherence is detected in specific electrodes and frequency bins. As such, it may be more a dichotomous than a continuous measure. In contrast, Amp-A is more sensitive to changes and not restricted by a ceiling effect; however, it is more prone to noise than %PCC. Future studies are needed to improve the reliability of Amp-A, for example, by converting the signals from an electrode to a source level. Analyzing Amp-A on a source level, if successful, would also resolve the multiple comparison problem that generally exists when analyses are performed on an electrode level.
PCC quantifies only the linear response while Vlaar et al 30 have shown that only about 20% of the cortical response can be found on the perturbed frequencies and can therefore be quantified as linear. The perturbation signal was designed to be able to investigate the nonlinear responses, yet a linear approach was the first choice to investigate longitudinal changes of neural pathways. Nonlinear coherence measures may yield further information on the response to a wrist joint perturbation in the highly nonlinear closed-loop afferent pathway system, which would be interesting to study in patients with a stroke. 31
Other neurophysiological measures to study afferent pathway integrity poststroke were proposed such as muscle stretch evoked potentials (StrEP). 32 In a cross-sectional study, this particular marker was found to be consistent across conditions and sessions; however, it was found not to differ significantly between patients with good and poor motor recovery.14,32 While the ultimate marker for afferent pathway integrity has not yet been found, longitudinal studies are needed to evaluate possible markers in poststroke recovery that have shown good reproducibility. Potential biomarkers for afferent pathway integrity, like PCC, StrEP, median nerve stimulation and other emerging methods, should be compared and evaluated in longitudinal studies.
Patients with an initially mild to moderate impairment, classified as having a high-baseline on the FM-UE of 18 points or more, all complied with the proportional recovery model of Prabhakaran et al. 22 Note that the variability in this group is likely to be larger than the proportional recovery model suggests. 33
Of the clinical assessments, only lower extremity function, expressed in the Motricity Index, was found to differ significantly between non-recoverers and low-baseline recoverers, while the EmNSA-HF did not differ between subgroups at baseline. To show the construct validity of the %PCC and Amp-A as a measure of afferent pathway integrity, also patients with a maximal score on the EmNSA-HF (13 out of 44 patients), were included in the current dataset.
In order for %PCC or Amp-A to be of clinical use, it needs to be able to correctly predict individual recovery poststroke, which is not yet feasible at this moment. More advanced analyses, such as the nonlinear dynamics of the signal and source localization, need to be explored to better understand the biological meaning of PCC and differentiate between the information it contains on afferent pathway integrity and cortical excitability.
Conclusions
EEG-derived percentage of PCC (%PCC) showed a change over time in line with processes of spontaneous neurobiological recovery. We demonstrated the longitudinal construct validity of %PCC and Amp-A as measures of afferent pathway integrity.
However, a higher %PCC in low-baseline recoverers compared with non-recoverers and high-baseline recoverers suggests that this biomarker may also contain information on cortical excitability next to afferent pathway integrity. More efforts are needed to distinguish these processes before %PCC and Amp-A can be used as biomarkers for predicting poststroke motor recovery.
Supplemental Material
Supplementary_Material – Supplemental material for Position-Cortical Coherence as a Marker of Afferent Pathway Integrity Early Poststroke: A Prospective Cohort Study
Supplemental material, Supplementary_Material for Position-Cortical Coherence as a Marker of Afferent Pathway Integrity Early Poststroke: A Prospective Cohort Study by Sarah B. Zandvliet, Erwin E. H. van Wegen, S. Floor Campfens, Herman van der Kooij, Gert Kwakkel and Carel G. M. Meskers in Neurorehabilitation and Neural Repair
Footnotes
Acknowledgements
We would like to thank Aukje S. Andringa for her contribution in the organization of the study and collection of the data and Caroline Winters, Mique Saes, Dirk Hoevenaars, Luuk Haring and Elza van Duijnhoven for their contributions in the data collection. We also would like to thank Jos W. Twisk for his help with the statistical analysis.
Supplementary material for this article is available on the Neurorehabilitation & Neural Repair website along with the online version of the article.
Declaration of Conflicting Interests
The author(s) declared no potential conflicts of interest with respect to the research, authorship, and/or publication of this article.
Funding
The author(s) disclosed receipt of the following financial support for the research, authorship, and/or publication of this article: This study was financially supported by a fellowship granted to C.G.M. Meskers (F2011(1)-25) from the Dutch Brain Foundation (Hersenstichting), The Netherlands, and a European advanced grant (ERC-AG-ID1, FP7-IDEAS-ERC, 291339).
References
Supplementary Material
Please find the following supplemental material available below.
For Open Access articles published under a Creative Commons License, all supplemental material carries the same license as the article it is associated with.
For non-Open Access articles published, all supplemental material carries a non-exclusive license, and permission requests for re-use of supplemental material or any part of supplemental material shall be sent directly to the copyright owner as specified in the copyright notice associated with the article.