
Abstract
Background. Wearable sensors allow for direct measurement of upper limb (UL) performance in daily life. Objective. To map the trajectory of UL performance and its relationships to other factors post-stroke. Methods. Participants (n = 67) with first stroke and UL paresis were assessed at 2, 4, 6, 8, 12, 16, 20, and 24 weeks after stroke. Assessments captured UL impairment (Fugl-Meyer), capacity for activity (Action Research Arm Test), and performance of activity in daily life (accelerometer variables of use ratio and hours of paretic limb activity), along with other potential modifying factors. We modeled individual trajectories of change for each measurement level and the moderating effects on UL performance trajectories. Results. Individual trajectories were best fit with a 3-parameter logistic model, capturing the rapid growth early after stroke within the longer data collection period. Plateaus (90% of asymptote) in impairment (bootstrap mean ± SE: 32 ± 4 days post-stroke) preceded those in capacity (41 ± 4 days). Plateau in performance, as measured by the use ratio (24 ± 5 days), tended to precede plateaus in impairment and capacity. Plateau in performance, as measured by hours of paretic activity (41 ± 6 days), occurred at a similar time to that of capacity and slightly lagged impairment. Modifiers of performance trajectories were capacity, concordance, UL rehabilitation, depressive symptomatology, and cognition. Conclusions. Upper limb performance in daily life approached plateau 3 to 6 weeks post-stroke. Individuals with stroke started to achieve a stable pattern of UL use in daily life early, often before neurological impairments and functional capacity started to stabilize.
Introduction
Upper limb paresis and its resulting deficits are a major problem post-stroke. Decades of research on recovery trajectories post-stroke indicate that larger, rapid changes occur in the first few weeks, with smaller, slower changes occurring later.1-6 Changes in impairment generally precede changes in functional capacity by around one week, such that as movement control returns, individuals might regain the ability to execute functional tasks.1,6 The World Health Organization separates the activity domain (i.e., the ability to execute functional tasks) into the capacity for activity vs performance of activity in daily life. 7 Capacity (or functional capacity) is what someone can do, assessed by standardized tests in structured, clinical, or laboratory settings. Performance is what someone actually does in the unstructured, free-living environment (e.g., activities of daily living plus movements like arm swing during gait, gesturing, stretching, and scratching). Note that this use of performance is different and distinct from using performance to describe the quality of a movement or the successful completion of an action of a standardized test. Advancements in wearable movement sensors now allow for direct measure of upper limb performance in daily life. 8 The most common wearable sensors used are accelerometers, from which numerous clinically relevant variables about upper limb activity can be computed.9-11 As with other indices of activity in daily life (e.g., steps/day as a measure of physical activity), wearable sensors provide a partial but not complete 12 read out of upper limb performance in daily life. Emerging data suggest that upper limb capacity measures are not a good proxy for upper limb performance in daily life13,14 and open up new questions about trajectories of upper limb performance post-stroke.
A few studies have explored upper limb performance early after stroke13,15-17 or how it might change over time.18-20 Building on these, the purpose of the current study was to map the trajectory of upper limb performance and its relationships to impairment, capacity, and other factors over the course of stroke recovery. Biweekly and then monthly assessments were used to capture and then model precise time courses of change out to nearly 6 months post-stroke. Our hypothesis, based on work cited above, 1 was that upper limb impairments improve first, followed by improvements in the capacity for activity and then improvements in upper limb performance in daily life. We further hypothesized that higher levels of performance would be driven by higher levels of capacity in the first month, the dominant hand being affected by stroke (i.e., concordance), and younger age at stroke onset as these factors are typically linked with better outcomes.19,21-23 Given that a key purpose for referring to and participating in upper limb rehabilitation services is to improve performance in daily life, 24 knowledge gained from this study informs the content and timing of rehabilitation services. Later stabilization (plateaus) in performance would mean there is more time post-stroke for motor rehabilitation interventions to be effective, while earlier stabilization would suggest that typical impairment and capacity-focused motor interventions might need to be paired with intentional health behavioral interventions25-27 to be effective in the early weeks after stroke.
Methods
This study was a longitudinal, prospective cohort of persons with first time stroke. Participants were recruited from the stroke service of a large, urban United States hospital. First-ever stroke survivors with residual upper limb paresis were enrolled within 2 weeks of their stroke. Inclusion criteria were as follows: (1) within 2 weeks of a first-ever ischemic or hemorrhagic stroke, confirmed with neuroimaging; (2) presence of unilateral UL motor deficits within the first 24–48 hours post-stroke, as indicated by a National Institutes of Health Stroke Scale (NIHSS) 28 Arm Item score of 1–4 or documented manual muscle test grade of < 5 anywhere on the paretic UL; (3) able to follow a 2-step command, as measured by a NIHSS Command Item score of zero; and (4) anticipated return to independent or community living, as indicated by the acute stroke team. These last inclusion criteria removed potential participants from the sample who were to be discharged to and expected to stay in long-term care or hospice facilities, since these individuals are not typically referred to rehabilitation services with goals for improvement. Participants were excluded from the study if any of the following criteria were met: (1) history of previous stroke, neurological condition, or psychiatric diagnoses other than depression or anxiety; (2) presence of other comorbid conditions that may limit recovery (e.g., end-stage renal disease and stage IV cancer); (3) lived more than 90 minutes from study location; and (4) currently pregnant by self-report. The Human Research Protection Office at Washington University in St Louis, MO approved this study and all participants provided written informed consent. Enrollment in this cohort was stopped early due to the COVID-19 global pandemic in March 2020. Beyond the safety of participants, it was possible that the significant disruption of daily life could influence performance data.
Participants completed 8 assessment sessions over the first 6 months post-stroke. The assessment battery was administered by trained personnel at 2, 4, 6, 8, 12, 16, 20, and 24 weeks, with each assessment session lasting 30–60 minutes. These time points were chosen to capture anticipated rapid changes within the first 8 weeks and then slower changes out to 24 weeks. Data were collected within ±3 days for the assessments at weeks 2–8 and ±1 week for those at weeks 12–24. We have previously reported on the performance trajectories of an early portion of this cohort out to 12 weeks. 18 Participants received medical and rehabilitation services in accordance with their overall plan of care; we recorded but did not control for the amount or type of rehabilitation services delivered to participants. Assessments were administered in inpatient hospital wards, other healthcare facilities, the research laboratory, and/or participants’ homes, depending on individual participant location and travel abilities.
Study Measures
Performance of upper limb activity in daily life was quantified via bilateral, wrist-worn, tri-axial accelerometers (ActiGraph Link, Pensacola, FL). Accelerometers worn on the wrists provide quantification of upper limb movement. While the accelerometer data do not specify which activities are performed during the wearing time, variables computed from the data have been shown to be a valid and reliable measures of upper limb activity during the wearing time (i.e., performance in daily life) in both healthy adults22,29 and adults with stroke.9,30-32 Briefly, participants wore the accelerometers for 24 hours at each assessment time point. The accelerometers were donned at the end of the visit (after completion of clinical measures) and worn for the following day. Once the accelerometers were returned, data were uploaded, visually inspected, and processed using ActiLife 6 software (ActiGraph Corp, Pensacola, FL) and custom-written software, as per published protocols. 8 Data were sampled at 30 Hz, band-pass filtered between frequencies of .25 and 2.5 Hz, and down sampled into 1-second epochs for each axis. Activity counts (unit of acceleration recorded for this device and software, 1 count = .001664 gravitational units [m/s2]) were combined across the three axes to create a single vector magnitude (√x2+y2+z2) for each second of data. The threshold for considering if the upper limb was active was when the vector magnitude was ≥2 activity counts in each 1-second epoch.31,33 Seconds of activity were summed over the wearing period to arrive at activity duration variables. The use ratio (hours of paretic limb activity/hours of non-paretic limb activity) was chosen as the primary performance measure, based on its strong psychometric properties.29,31,34,35 The use ratio has a narrow distribution (mean ± SD of .95 ± .06) across the lifespan in neurologically intact individuals.12,29,36 Because it is a ratio variable, it controls for the amount of activity recorded in the accelerometers that comes from arm swing during gait. 30 Hours of paretic upper limb activity was used as a secondary measure of upper limb performance. These two variables quantify the symmetry and duration of performance of upper limb activity in daily life but not the magnitude or variability. Other accelerometer variables quantifying these additional dimensions of movement were calculated in this cohort, but are not reported here, as they are strongly correlated to these simple duration measures and had similar trajectories over time early after stroke. 18
Capacity for upper limb activity was quantified by the Action Research Arm Test (ARAT)37,38 and impairment was quantified with the upper extremity portion of the Fugl-Meyer motor assessment (UEFM), 39 both well-established, criterion-rated scales. 40 Sample demographics included age, sex, race, ethnicity, handedness, and rehabilitation service utilization. Other measures taken at 2, 12, and 24 weeks were the Center for Epidemiologic Studies Depression (CES-D) scale 41 to quantify depressive symptomatology, the Montreal Cognitive Assessment (MoCA) to quantify common vascular cognitive impairments, 42 and the Unstructured Mesulam to quantifying hemispatial neglect. 43
Statistical Analyses
Analyses were done in R version 4.0.2, employing nonlinear longitudinal multilevel modeling
44
with the nlme package.
45
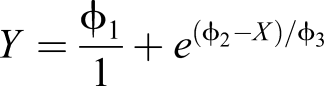
Longitudinal multilevel analysis (measures nested within people) is the preferred method for these data given it does not require the same number of assessments across participants, can account for missing data, and can minimize noise in the clinical measures.44,46 First, individual participant trajectories for the longitudinal impairment, capacity, and performance data were modeled. Various models were initially assessed (e.g., polynomial, logistic, and asymptotic regression) to determine the best approach; the logistic model was conceptually and empirically superior to the alternatives. Trajectories were best fit with a 3-parameter logistic model (see Equation), capturing the rapid growth earlier after stroke within the longer data collection period, eventuating in an asymptote. The three parameters were: ϕ1, the upper asymptote, ϕ2, the time value corresponding to the inflection point, and ϕ3 the “growth rate” or compression of the growth curve. The upper asymptote, ϕ1, is the upper value at which the curve fit eventually flattens, that is, where subsequent points in time did not change the value. The inflection point, ϕ2, is the time post-stroke when the curve transitions from an increase in the rate of rise to a decrease in the rate of rise. The last parameter, ϕ3, can be considered a scaling factor related to how quickly or slowly the curve reaches asymptote. As ϕ3 increases, the logistic curve approaches the horizontal asymptote more slowly. While the values of ϕ1 have clear and easy to understand biological relevance, the values of ϕ2, and ϕ3 are less biologically relevant
Models were fit with fixed effects (the parameters) and as many random effects as could be estimated (see Results). If models with random effects for more than one parameter did not converge to solutions, they were discarded in favor of the fixed effect model for that parameter. All models had random asymptotes (ϕ1) and some models had random inflection points (ϕ2); no models could be estimated with the remaining parameter, ϕ3, as random. Final models were chosen by selecting the model for each measure with the lowest Akaike information criteria (AIC). The AIC estimates the relative amount of information lost by the model, so the lower AIC (less information lost) the better the fit of the model to the data.
Second, hypotheses about timing of trajectories were evaluated by determining when each measure approached its plateau, operationally defined as the time when the measure achieved 90% of its upper asymptote, ϕ1. 47 The values of interest here are not direct parameters in the model but instead derived from the model effects. Since the theoretical sampling distributions of these values are unknown, case resampling bootstrapping (iterations = 2000) was used to estimate values and 95% confidence intervals. Bias-corrected and accelerated confidence intervals48,49 were chosen over other confidence interval estimates because, theoretically, the distributions could be asymmetrical and the amount of asymmetry could vary. For each bootstrap sample, fixed effects were estimated, and from these, new estimates for the plateau time were calculated as well as pairwise differences among the plateau times. Across the 2000 bootstrap samples, distributions of plateau times and pairwise differences were obtained, and from these, the confidence intervals were calculated. Statistical significance in the pairwise comparisons occurred when the 95% CI of the differences did not include zero. This is equivalent to a P value of .05. Confidence intervals that overlapped with zero but where ≥90% of the interval was above zero were labeled statistical trends.
And third, hypotheses about moderators of performance trajectories were evaluated for their influence on model parameters. The moderator analyses can be conceptualized as looking for interactions between the moderator and the model parameters. Models attempted to include moderators of each logistic parameter (ϕ1, ϕ2, and ϕ3) and were trimmed when models could not be estimated by inclusion of a particular moderator (due to lack of variability and estimation problems). Consequently, moderators of ϕ1 were always tested; occasionally moderators of ϕ2 could be included. Moderators of ϕ3 could not be included in any model due to insufficient variability. The most complex models that could be fit are reported here. Plateau analyses were conducted for the moderator models using bootstrapping methods and address whether plateau differences for levels of a moderator are significantly different. Seven variables were evaluated as moderators, one at a time, for their effect on use ratio and paretic hour trajectories. Potential moderators evaluated included: capacity (ARAT score at four weeks), concordance (when the dominant limb is the paretic limb), age, upper limb rehabilitation utilization, and CES-D, MoCA, and Mesulam scores. Impairment was not tested as a moderator of performance in its own right because it is highly correlated to capacity and would be expected to mediate its influence via capacity. The ARAT score entered was from the 4 week assessment since that was expected to occur before, but potentially close in time, to the plateau values. Upper limb rehabilitation service utilization was entered as the number of measurement periods that a participant reported receiving services. The CES-D, MoCA, and Mesulam scores were from 2 weeks post-stroke, since that was the only time point from which these values were available before anticipated plateaus (other available values were at 12 and 24 weeks).
Results
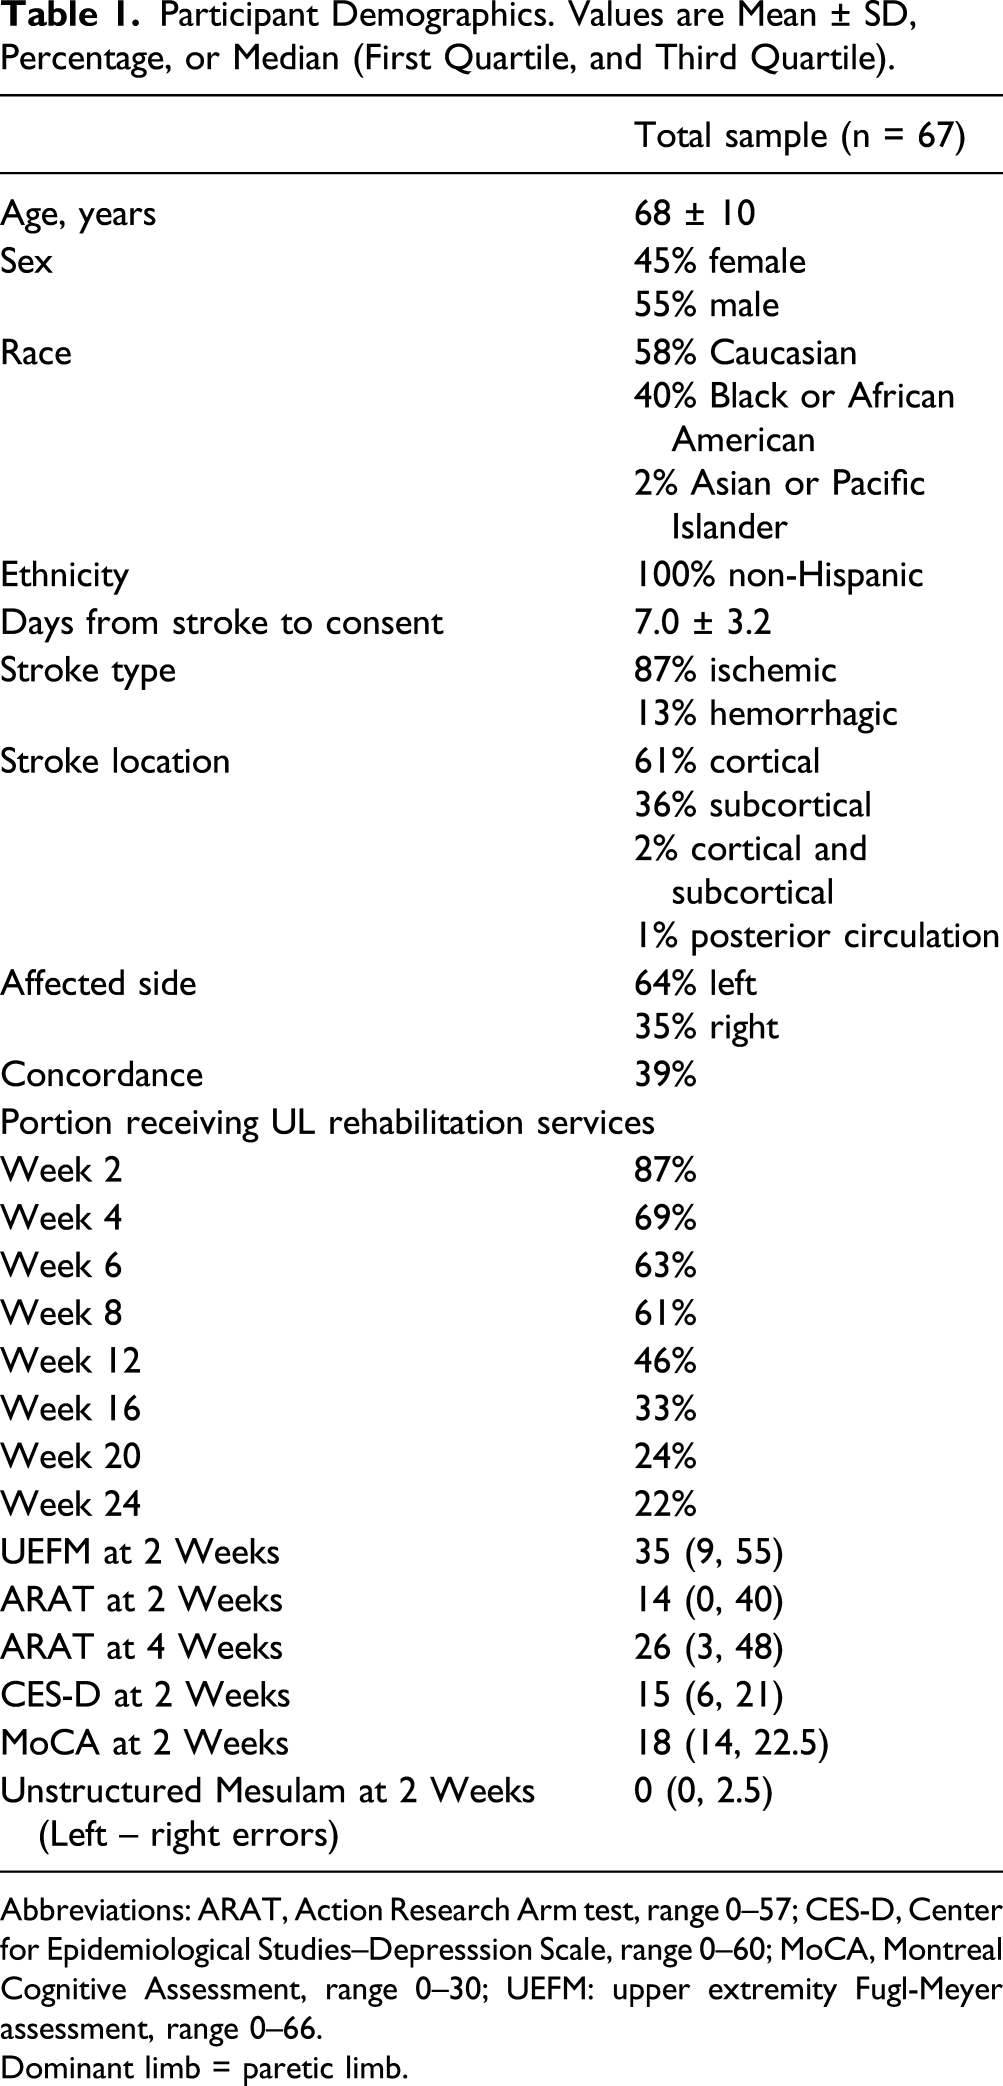
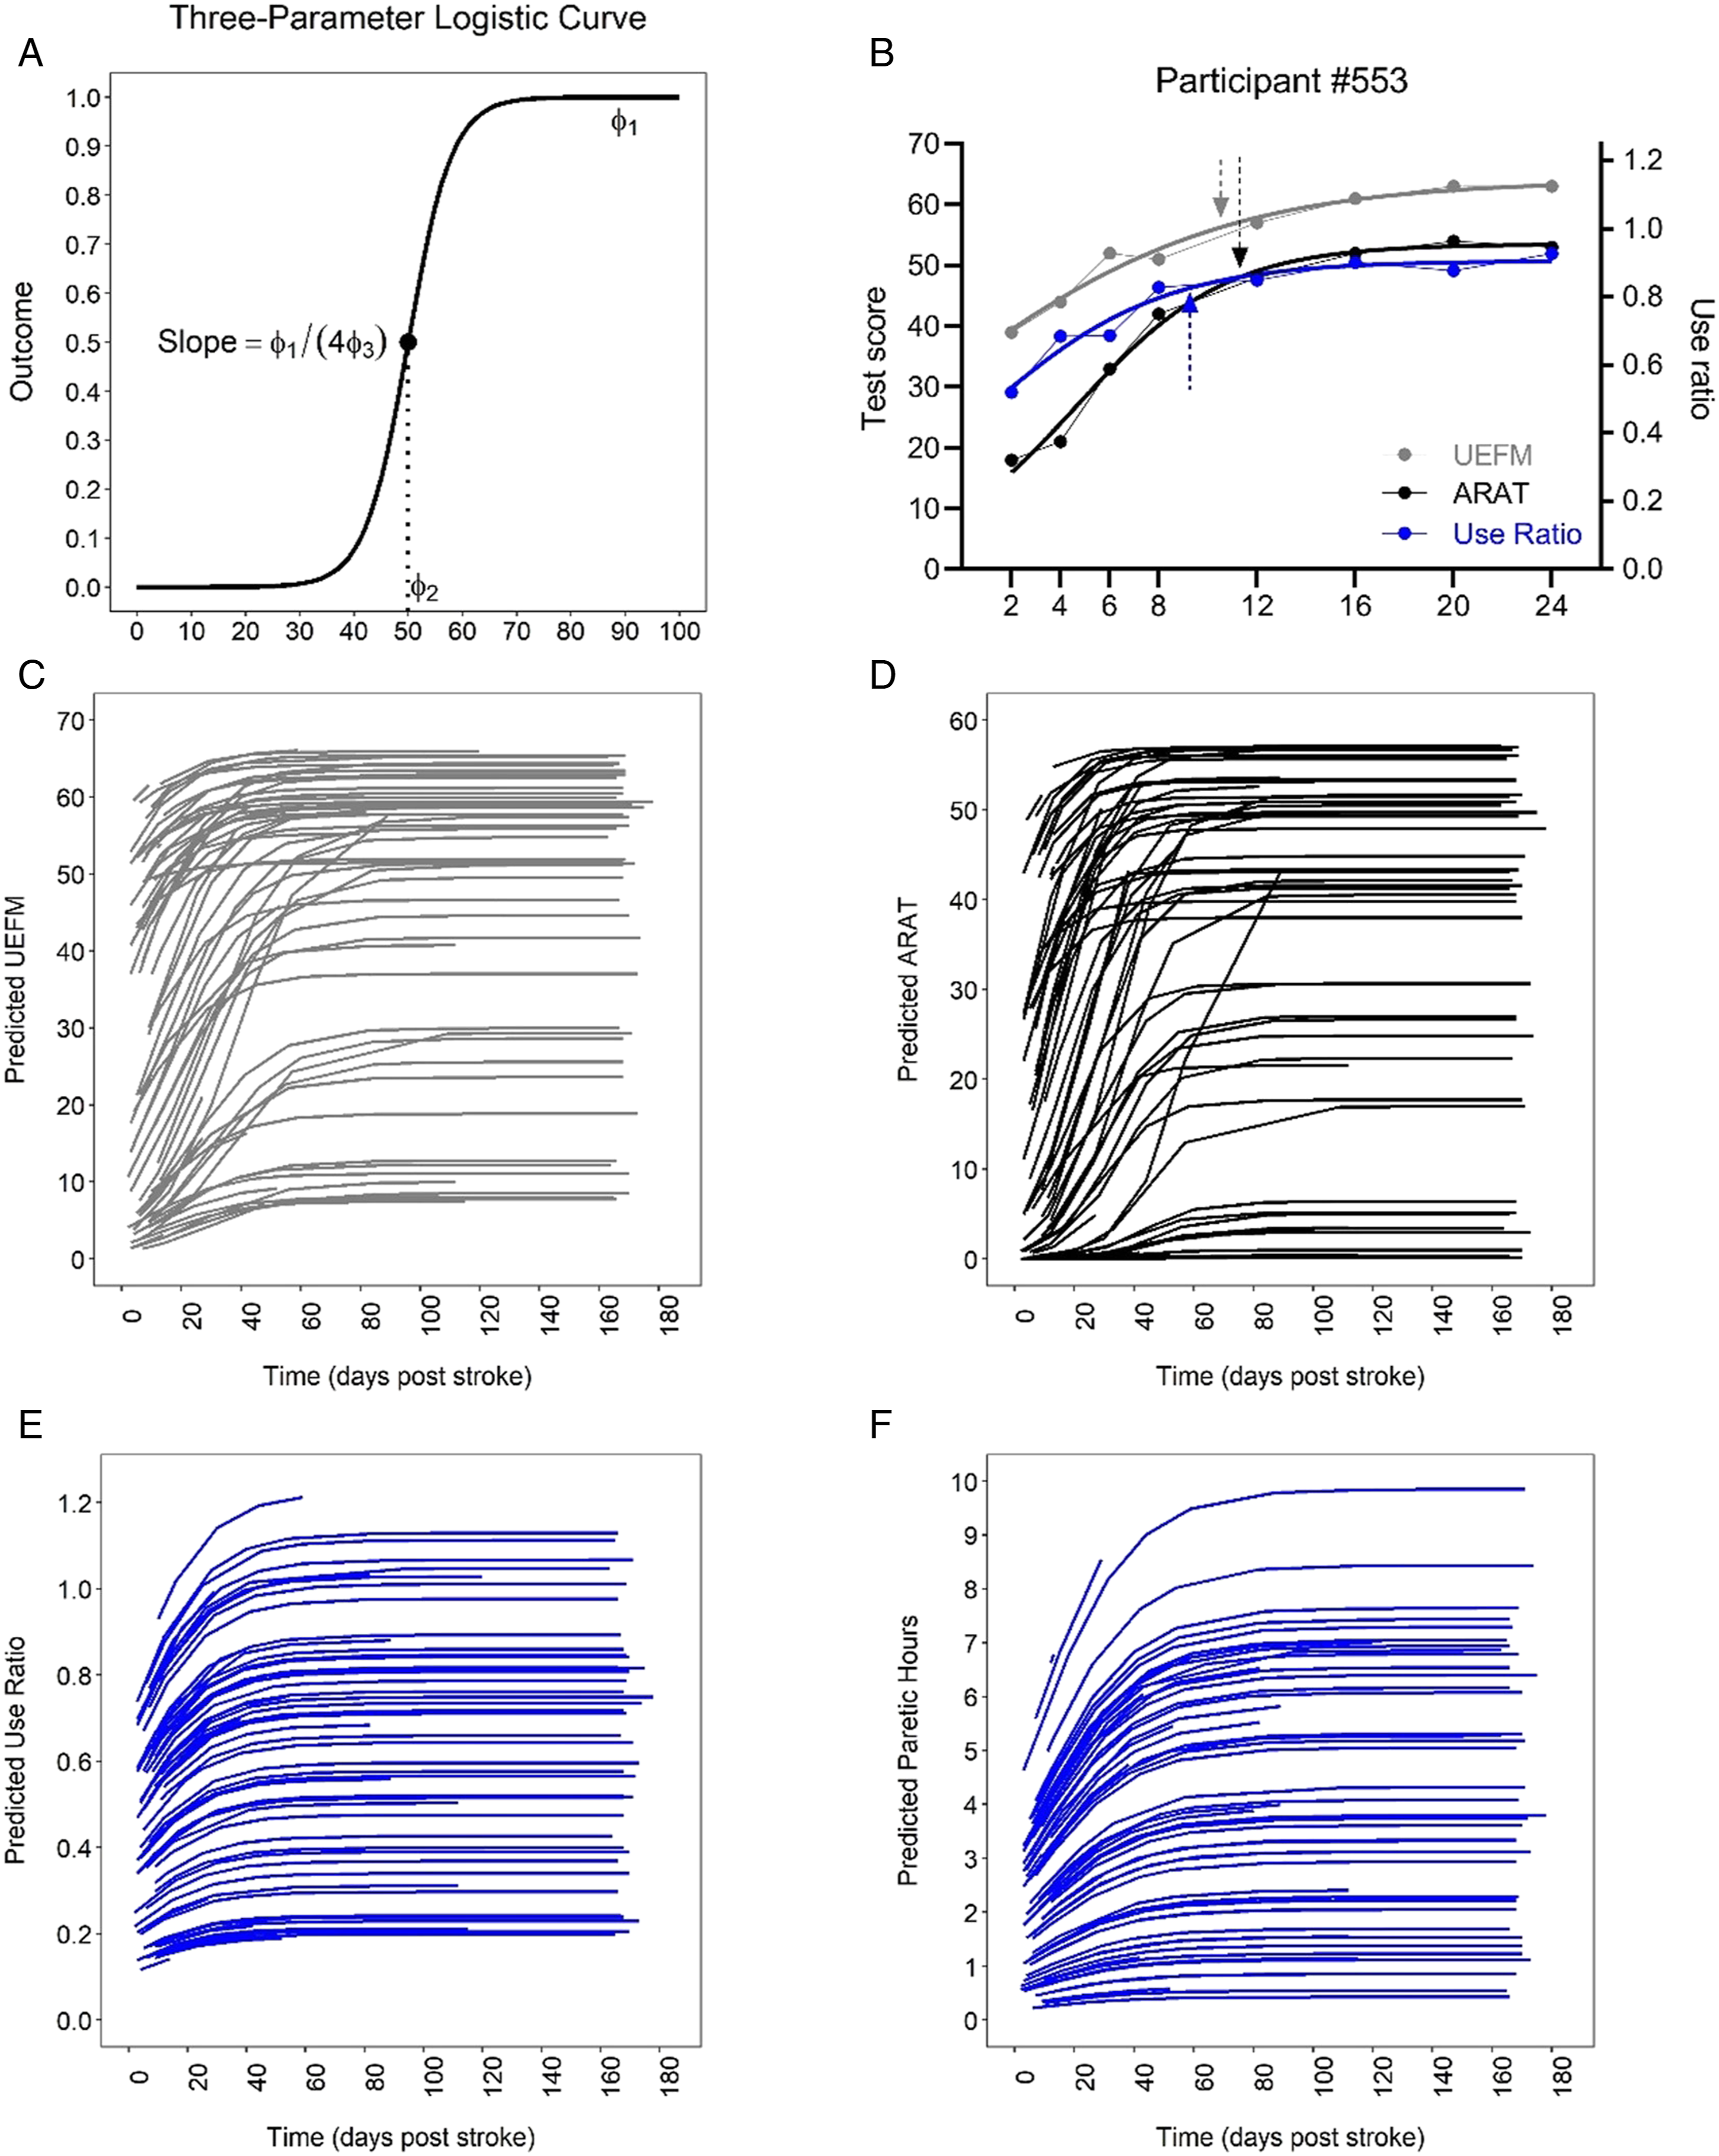
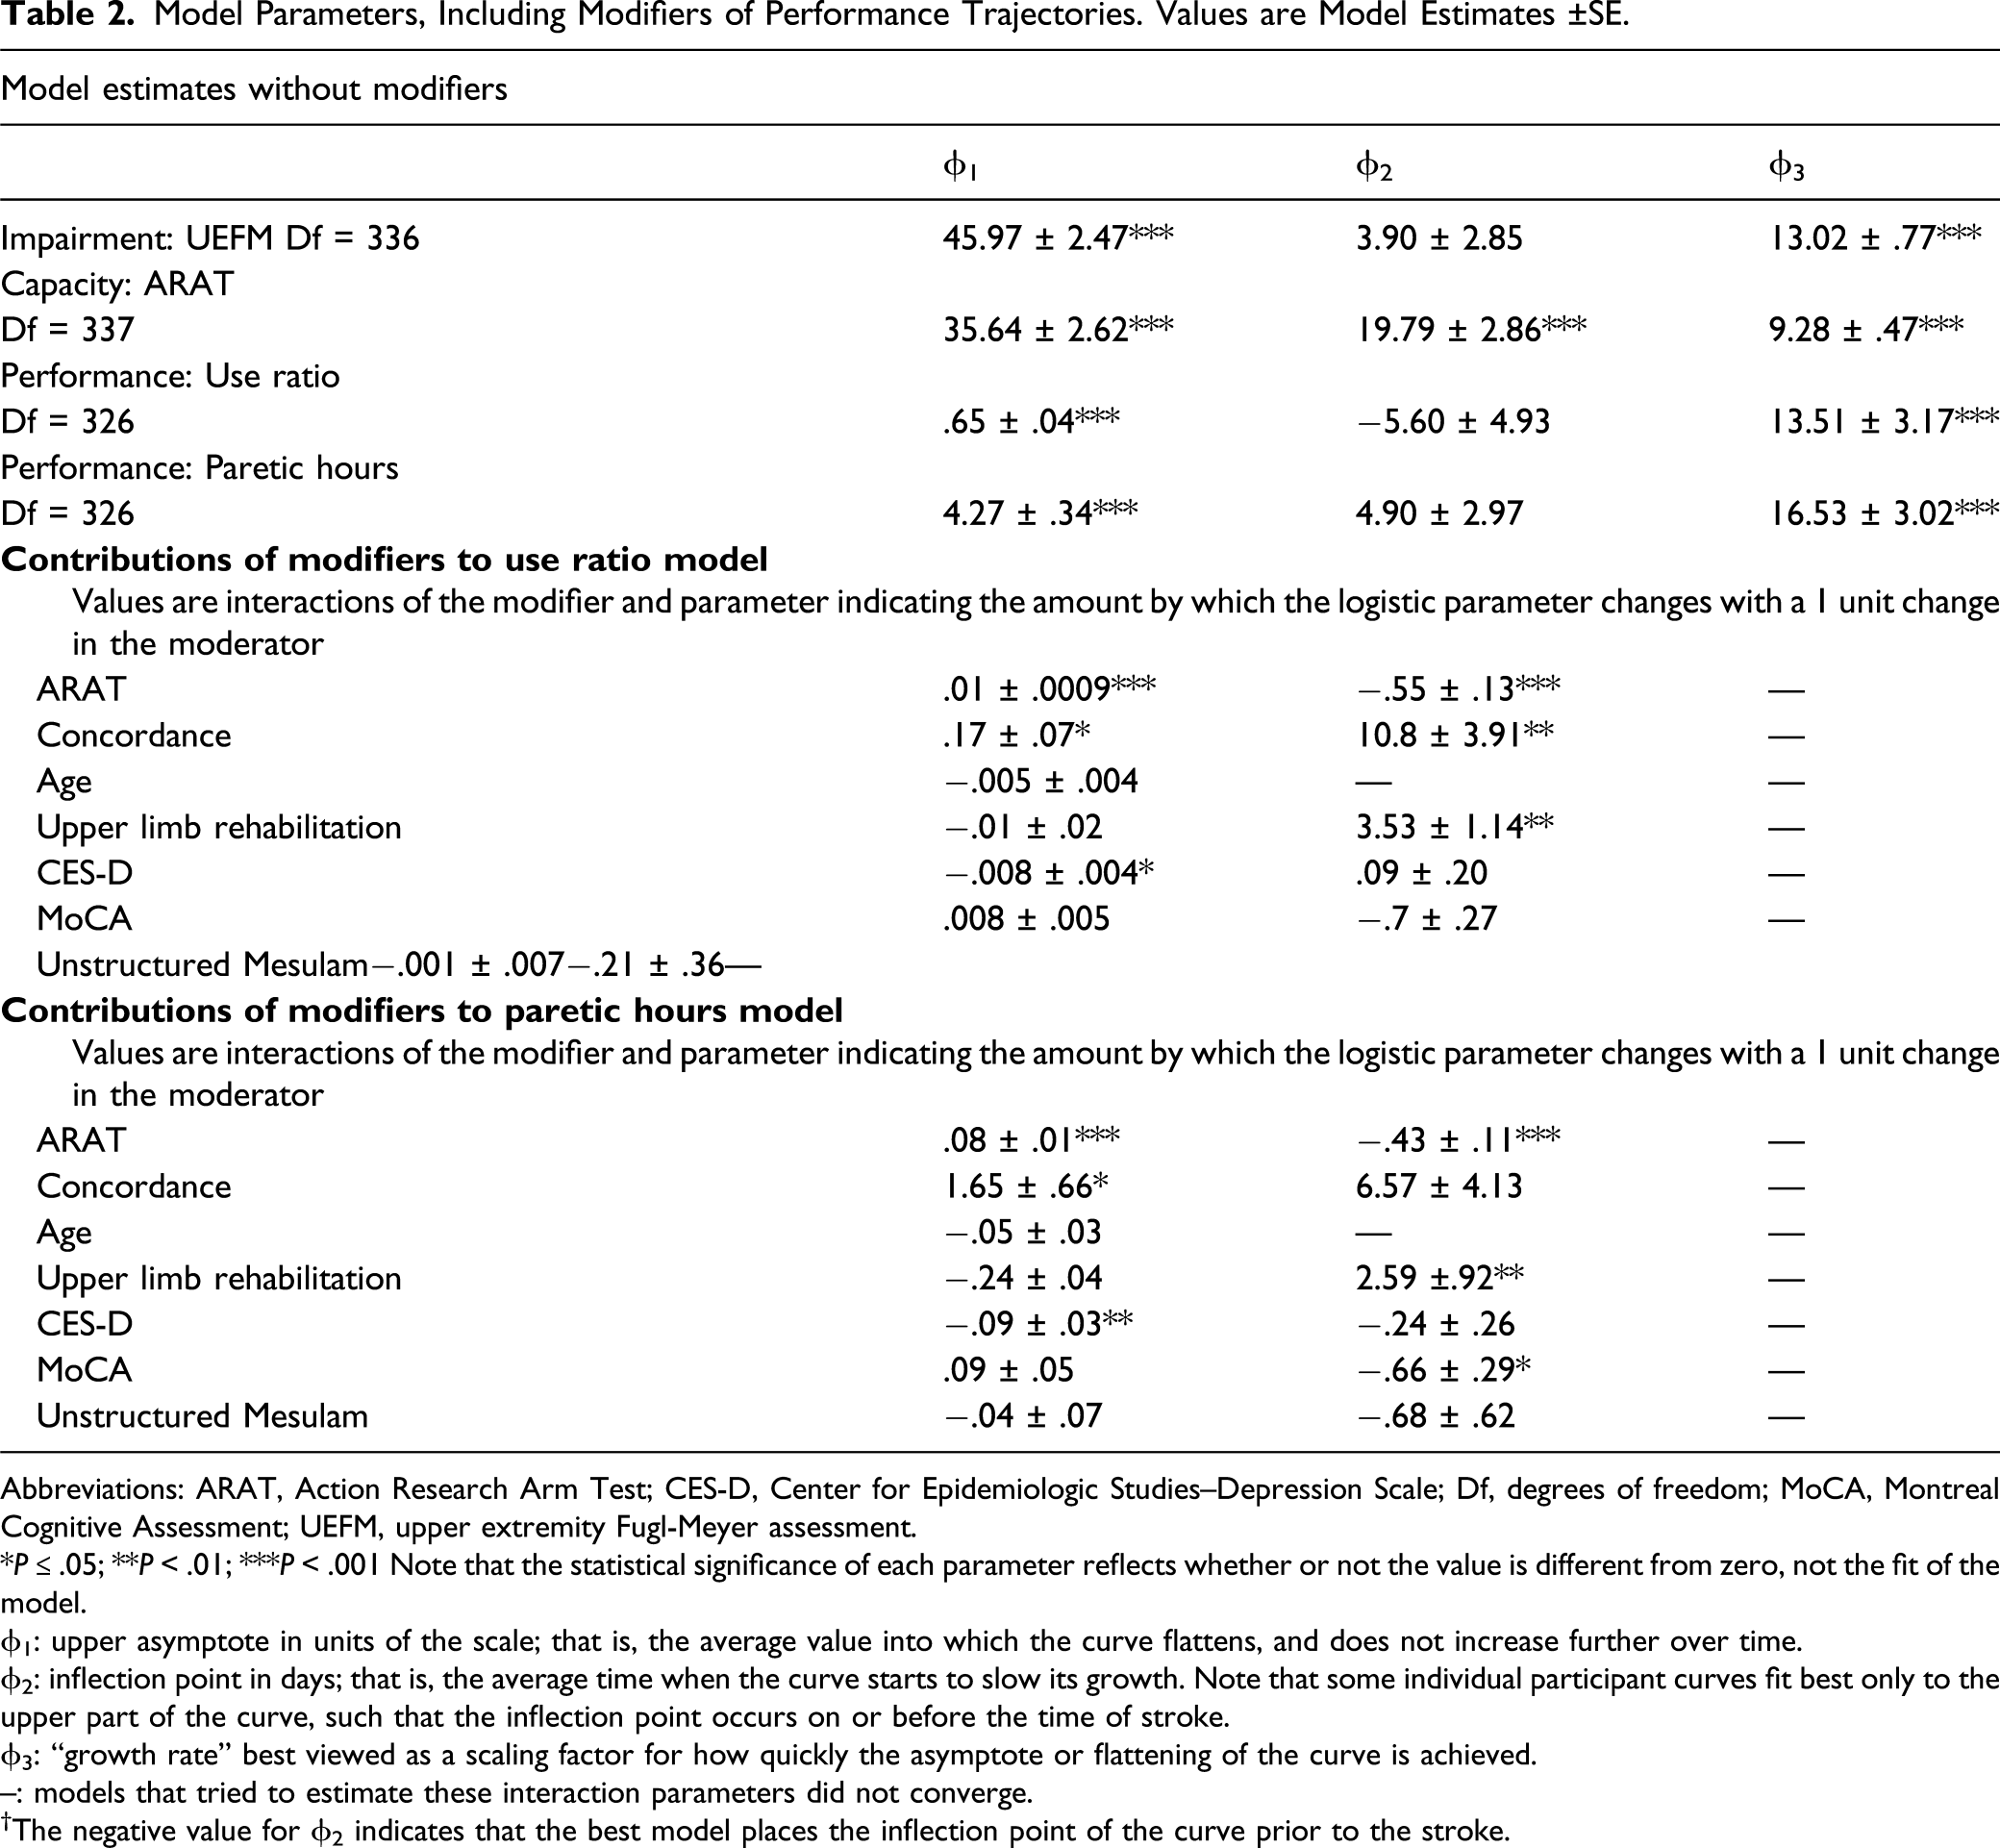
Seventy-three individuals were recruited with 67 included in the analysis. Figure 1 shows the flow diagram for this observational cohort. The percentages of the 67 participants providing data at each time point were as follows: 100% at 2 weeks, 88% at 4 weeks, 82% at 6 weeks, 79% at 8 weeks, 73% at 12 weeks, 67% at 16 weeks, 57% at 20 weeks, and 61% at 24 weeks. Participant demographics are provided in Table 1. A majority of the sample received rehabilitation services for the upper limb out to at least 8 weeks post-stroke. The 3-parameter logistic model was the best fit with the data across all measurement levels. Figure 2A shows a generic, 3-parametric logistic curve to illustrate the model and parameters. The lowest AIC values were generated by models with random effects for ϕ1 (the upper asymptote) and ϕ2 (the time of the inflection point) for the impairment and capacity data, but with random effects only for ϕ1 for the performance data. Model parameters are provided in the top part of Table 2. Figure 2B shows an individual example of model fit for each measurement, with arrows marking the time to plateau (90% of the asymptote). Figures 2C–2F show the predicted data for impairment (2C), capacity (2D), and performance measures (2E and 2F) for all subjects. As can be seen in Figures 2C–2F, the sample spanned a broad range of severity in impairment (UEFM), capacity (ARAT), and performance (use ratio and paretic hours). With respect to absolute scores on the scales, no participants had the maximum UEFM (66) or ARAT (57) scores at the 2-week time point (ave. time post-stroke = 14 ± 2 days). Six participants had UEFM scores between 61 and 65, and 7 participants had ARAT scores between 51 and 56. On the low end of the scales at the 2-week time point, 20 participants had UEFM scores between 0 and 10, while 30 participants had ARAT scores between 0 and 10. STROBE chart of participant enrollment. Participant Demographics. Values are Mean ± SD, Percentage, or Median (First Quartile, and Third Quartile). Abbreviations: ARAT, Action Research Arm test, range 0–57; CES-D, Center for Epidemiological Studies–Depresssion Scale, range 0–60; MoCA, Montreal Cognitive Assessment, range 0–30; UEFM: upper extremity Fugl-Meyer assessment, range 0–66. Dominant limb = paretic limb. (A) Generic 3-parameter logistic curve to illustrate the model and parameters. Most participant data fit the upper half of the model, as shown in the individual example in B. (B) Individual examples showing data and fit with model, gray = UEFM, black = ARAT, and blue = use ratio. The UEFM and ARAT data correspond to the left y-axis and the use ratio corresponds to the right y-axis. Arrows represent time to plateau (90% of asymptote). Predicted data from each participant for impairment (C), capacity (D), and performance (E and F). Abbreviations: ARAT, Action Research Arm Test; UEFM, upper extremity portion of the Fugl-Meyer motor assessment. Model Parameters, Including Modifiers of Performance Trajectories. Values are Model Estimates ±SE. Abbreviations: ARAT, Action Research Arm Test; CES-D, Center for Epidemiologic Studies–Depression Scale; Df, degrees of freedom; MoCA, Montreal Cognitive Assessment; UEFM, upper extremity Fugl-Meyer assessment. *P ≤ .05; **P < .01; ***P < .001 Note that the statistical significance of each parameter reflects whether or not the value is different from zero, not the fit of the model. ϕ1: upper asymptote in units of the scale; that is, the average value into which the curve flattens, and does not increase further over time. ϕ2: inflection point in days; that is, the average time when the curve starts to slow its growth. Note that some individual participant curves fit best only to the upper part of the curve, such that the inflection point occurs on or before the time of stroke. ϕ3: “growth rate” best viewed as a scaling factor for how quickly the asymptote or flattening of the curve is achieved. --: models that tried to estimate these interaction parameters did not converge. †The negative value for ϕ2 indicates that the best model places the inflection point of the curve prior to the stroke.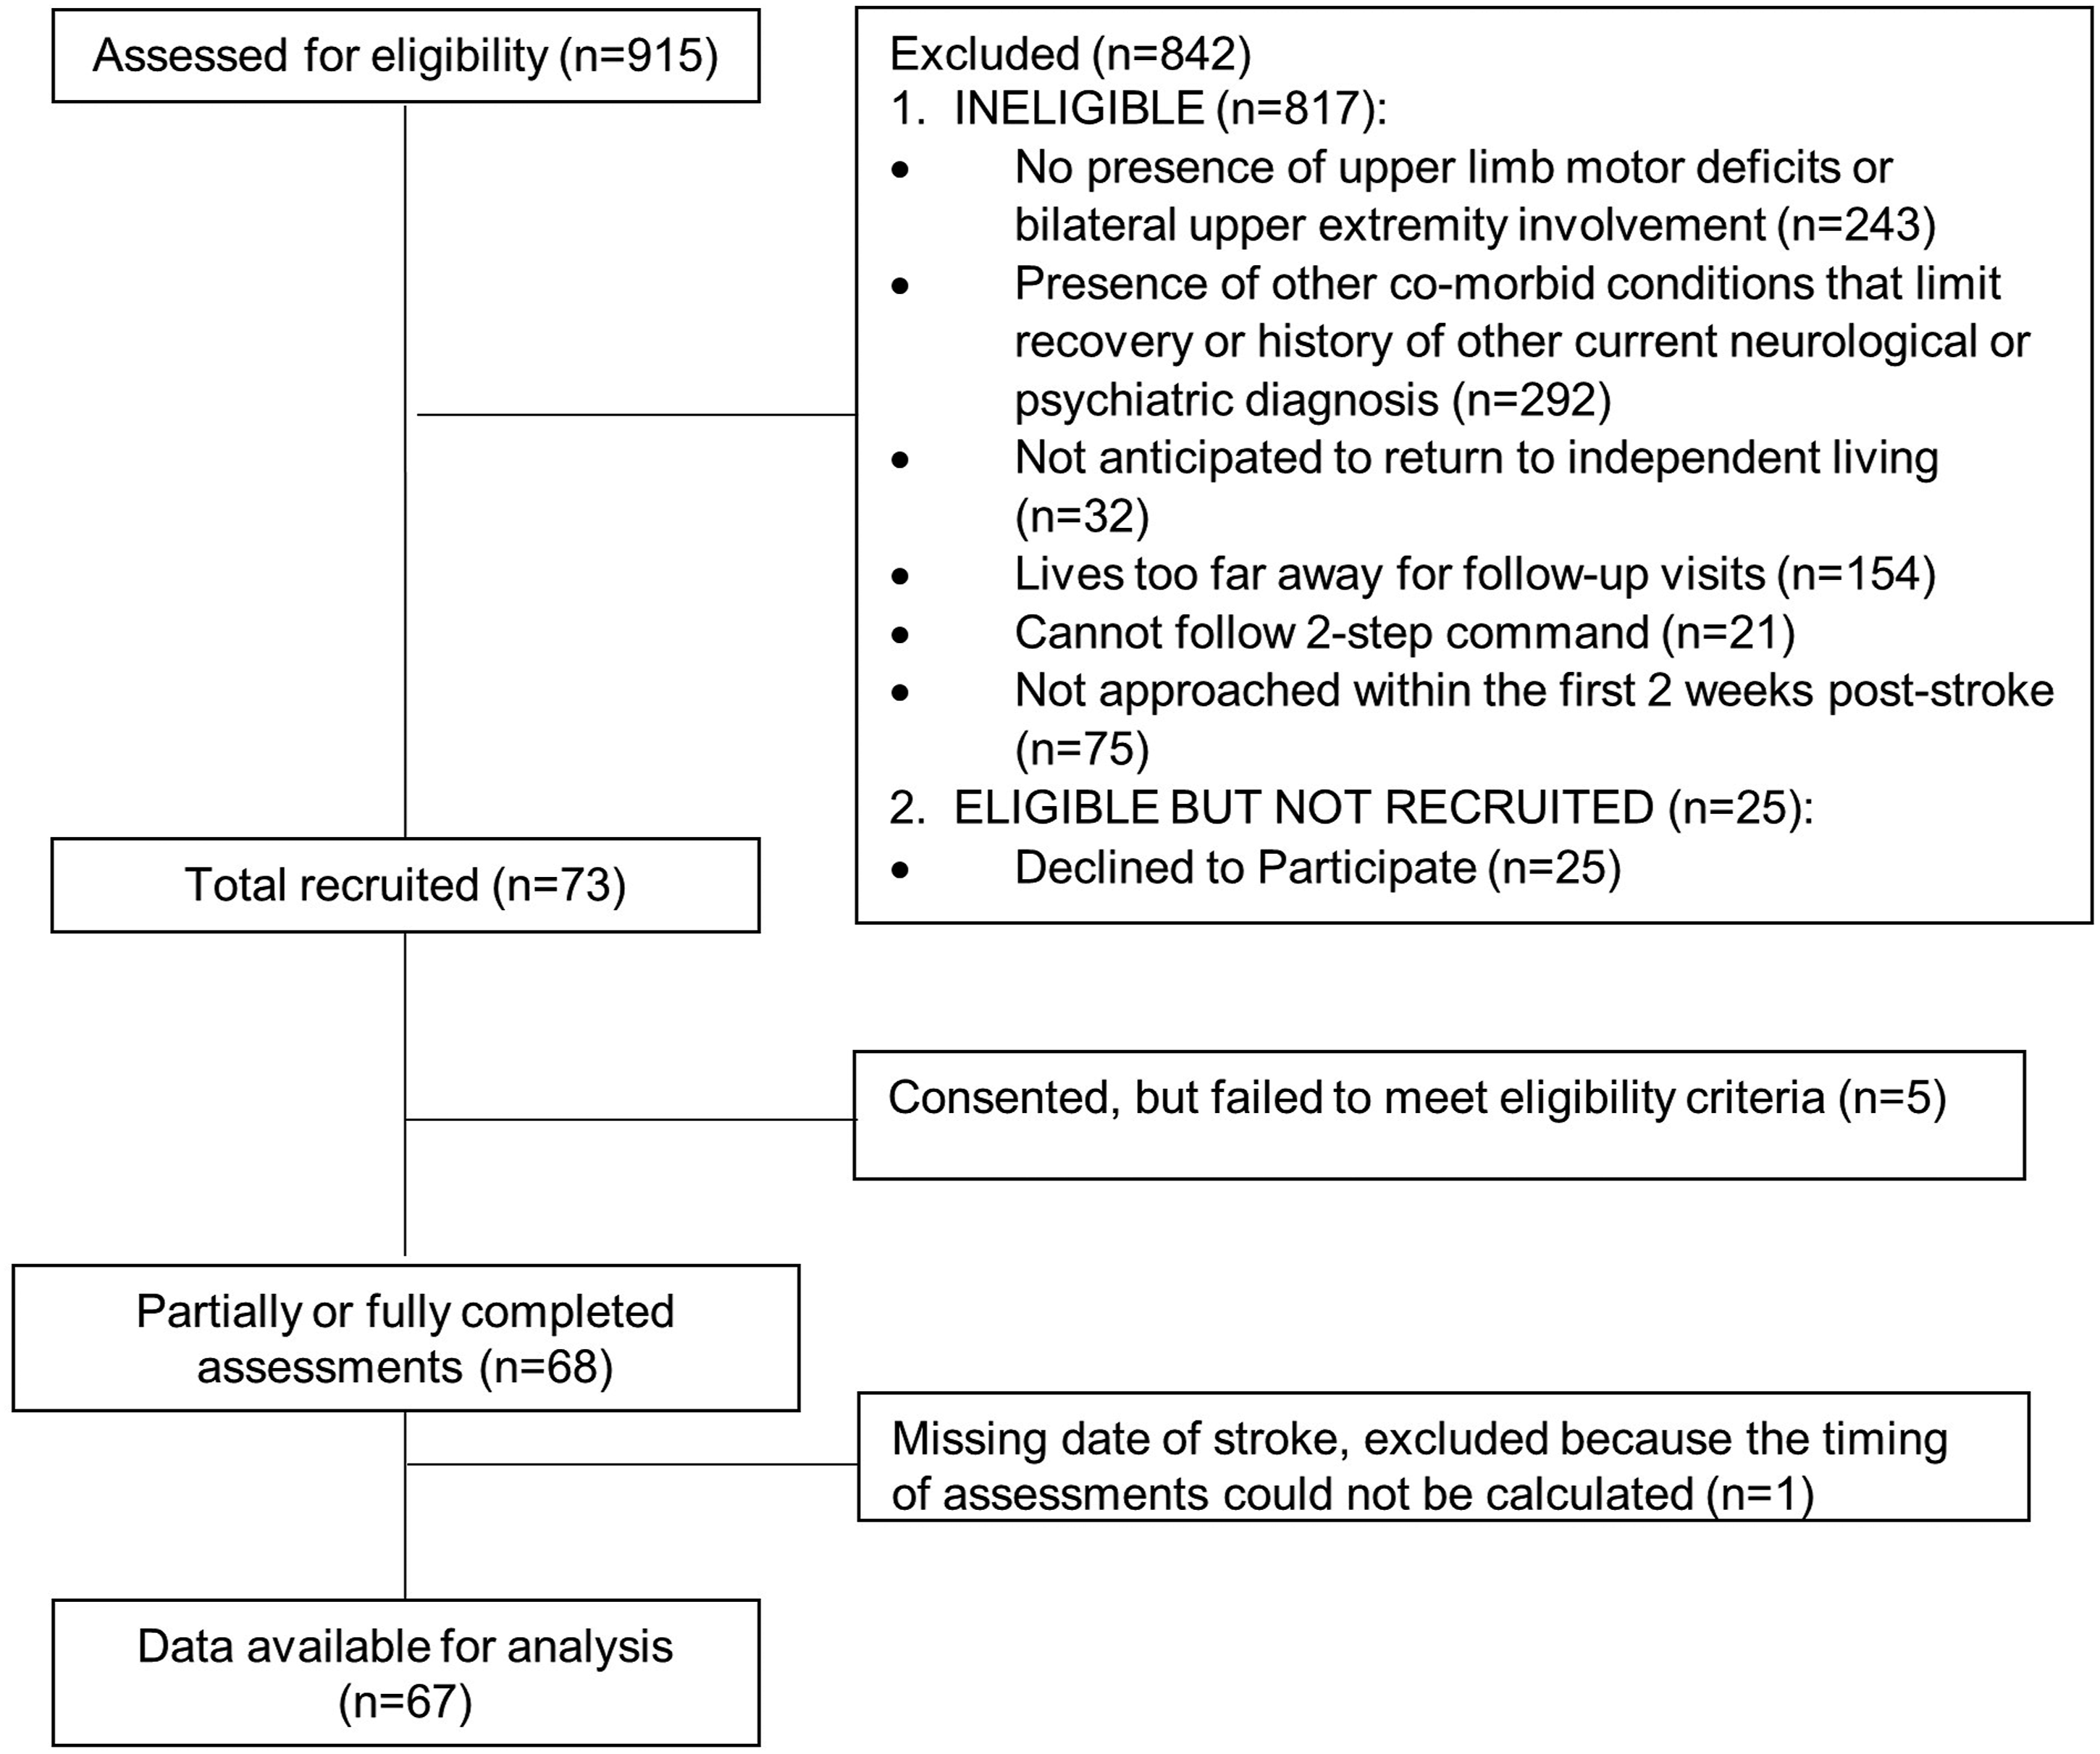
Changes in the performance trajectories slowed or stopped surprisingly early after stroke, with the use ratio reaching plateau around 3 weeks (bootstrap mean ± SE: 24 ± 5 days) and hours of paretic activity reaching plateau around 6 weeks (41 ± 6 days). Figure 3 shows the timing of plateaus for each of the measures, obtained from the bootstrapping procedures. As hypothesized, plateaus in impairment as measured by the UEFM significantly preceded those of capacity as measured by the ARAT (bootstrap paired mean difference ± SE, 95% CI: 8 ± 4, 1–16 days). Plateau in performance as measured by the use ratio trended toward preceding plateaus in impairment (8 ± 5, -3 to 17 days), while significantly preceding plateaus in capacity (16 ± 5, 7–26 days). Plateau in performance as measured by hours of paretic activity was timed similarly to the plateau in capacity (1 ± 7, -11 to 16 days). Plateau in hours of paretic activity appeared to lag plateaus in impairment, but this did not achieve significance (9 ± 7, -4 24 days). Comparison of the two performance measures indicated that the use ratio plateaued significantly prior to the paretic hours of use (17 ± 7, 2–31 days). Since final models for each measure did not have the same fixed vs random parameters, we repeated the plateau analyses requiring the same fixed (Φ2 and Φ3) and random (Φ1) parameters for each measure. The repeated analyses generated the same statistical conclusions as the one with the best-fit models. Timing of plateaus across measures obtained from bootstrapping procedures. Values are means and 95% confidence intervals.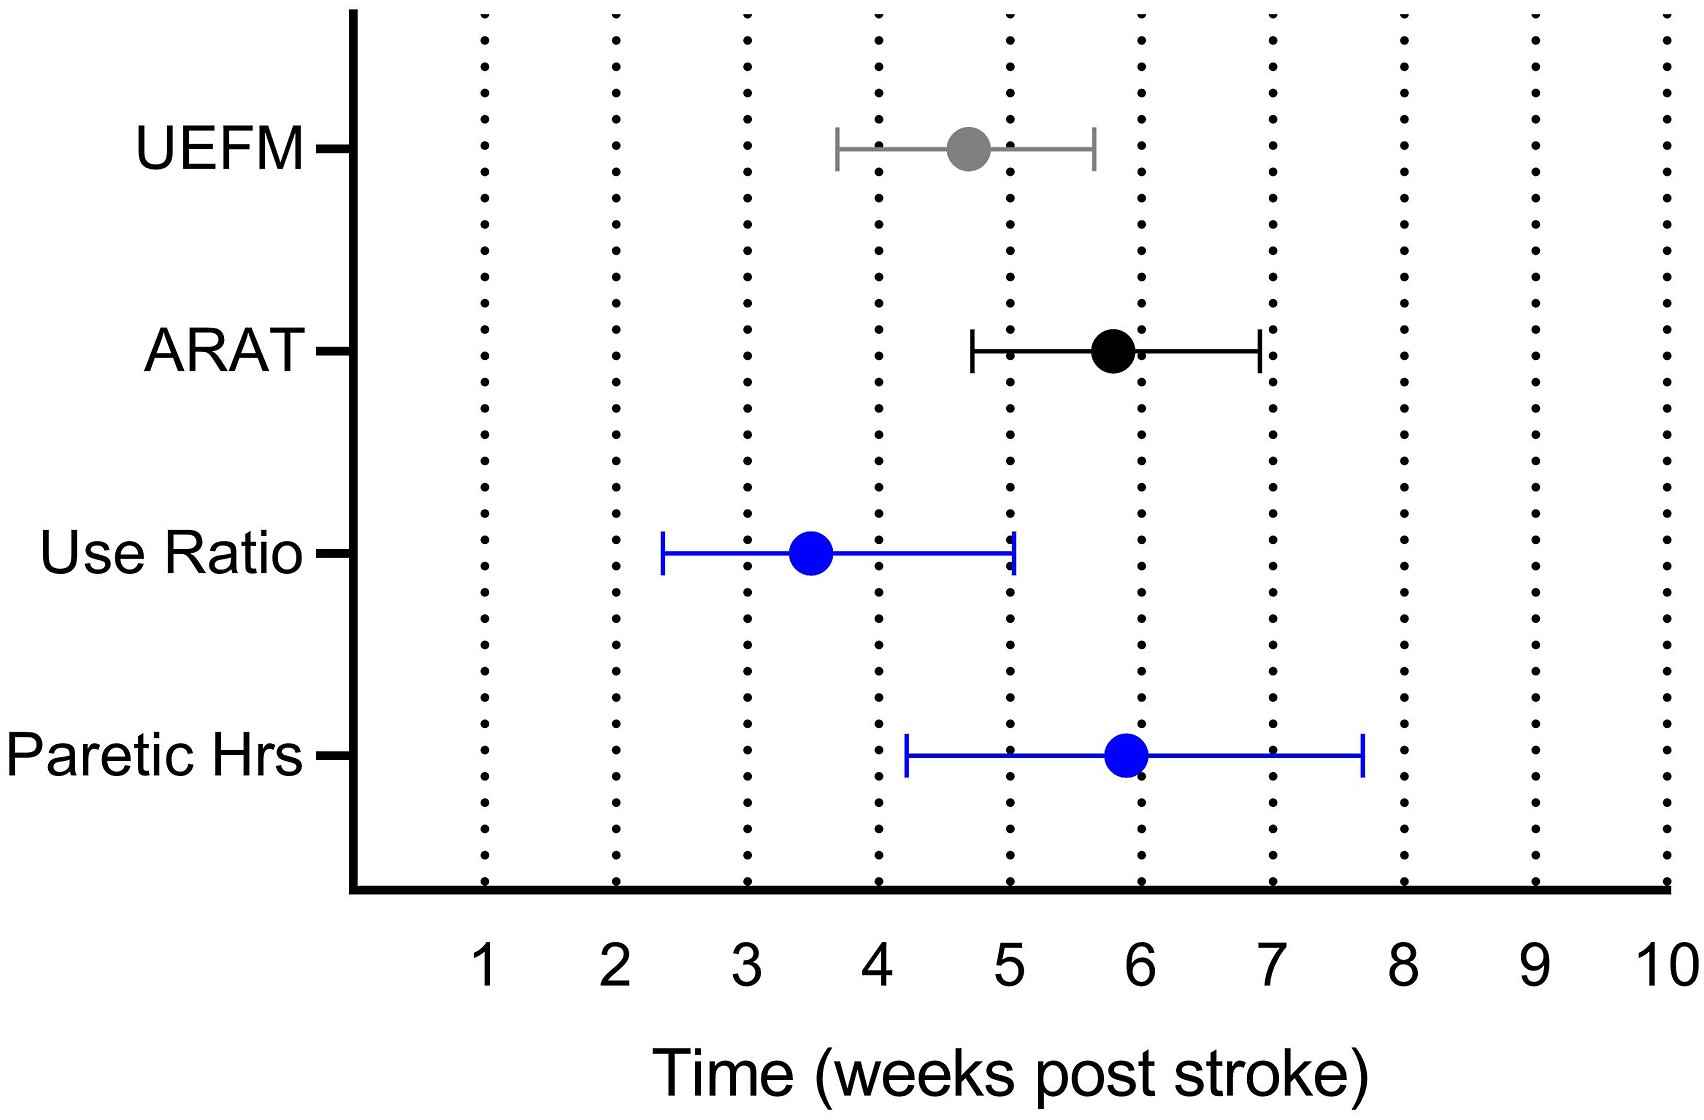
Five of the seven potential moderators influenced performance trajectories. Estimated contributions for each moderator to the use ratio and paretic hour model parameters are provided in the bottom of Table 2. These are the numerical estimates of the interaction between the moderator and the parameter. For example, for every 1 point increase in ARAT at 4 weeks, there is an associated increase of .01 for the eventual asymptote in the use ratio and an associated increase of .08 hrs (∼5 min) for the eventual asymptote in paretic hours. Likewise, when the dominant limb is the paretic limb (concordance), the eventual asymptote is increased by .17 for the use ratio and 1.65 hours for paretic hours. Figure 4 is a graphical illustration of some of the significant moderator effects. Here, predicted performance trajectories of higher (+1 SD) vs lower (−1 SD) levels of each moderator are graphed to better communicate the effect of the moderator on the performance trajectories and assist the reader in interpreting the numerical values in the bottom of Table 2. As hypothesized, better capacity was associated with quicker (sooner inflection point, ϕ2), and better performance recovery (higher asymptote, ϕ1, Figures 4A and 4B). Eventual performance achieved was better but took longer for those with a concordant dominant and paretic limb (Figures 4C and 4D). More depressive symptoms were associated with lower eventual upper limb performance but did not affect rate (Figures 4E and 4F). Less upper limb rehabilitation was associated with quicker recovery. Finally, more early cognitive deficits led to later recovery of performance measured by paretic hours but did not reach significance for the use ratio. Other factors evaluated did not moderate upper limb performance trajectories. Illustration of predicted higher (+1 SD) vs lower (−1 SD) moderator scores on performance trajectories. Data are modeled estimates at the moderator value, not cohorts of patients. (A and B) ARAT score at 4°weeks; (C and D) concordance; (E and F) CES-D score at 2°weeks. Abbreviations: ARAT, Action Research Arm Test; CES-D, Center for Epidemiologic Studies Depression.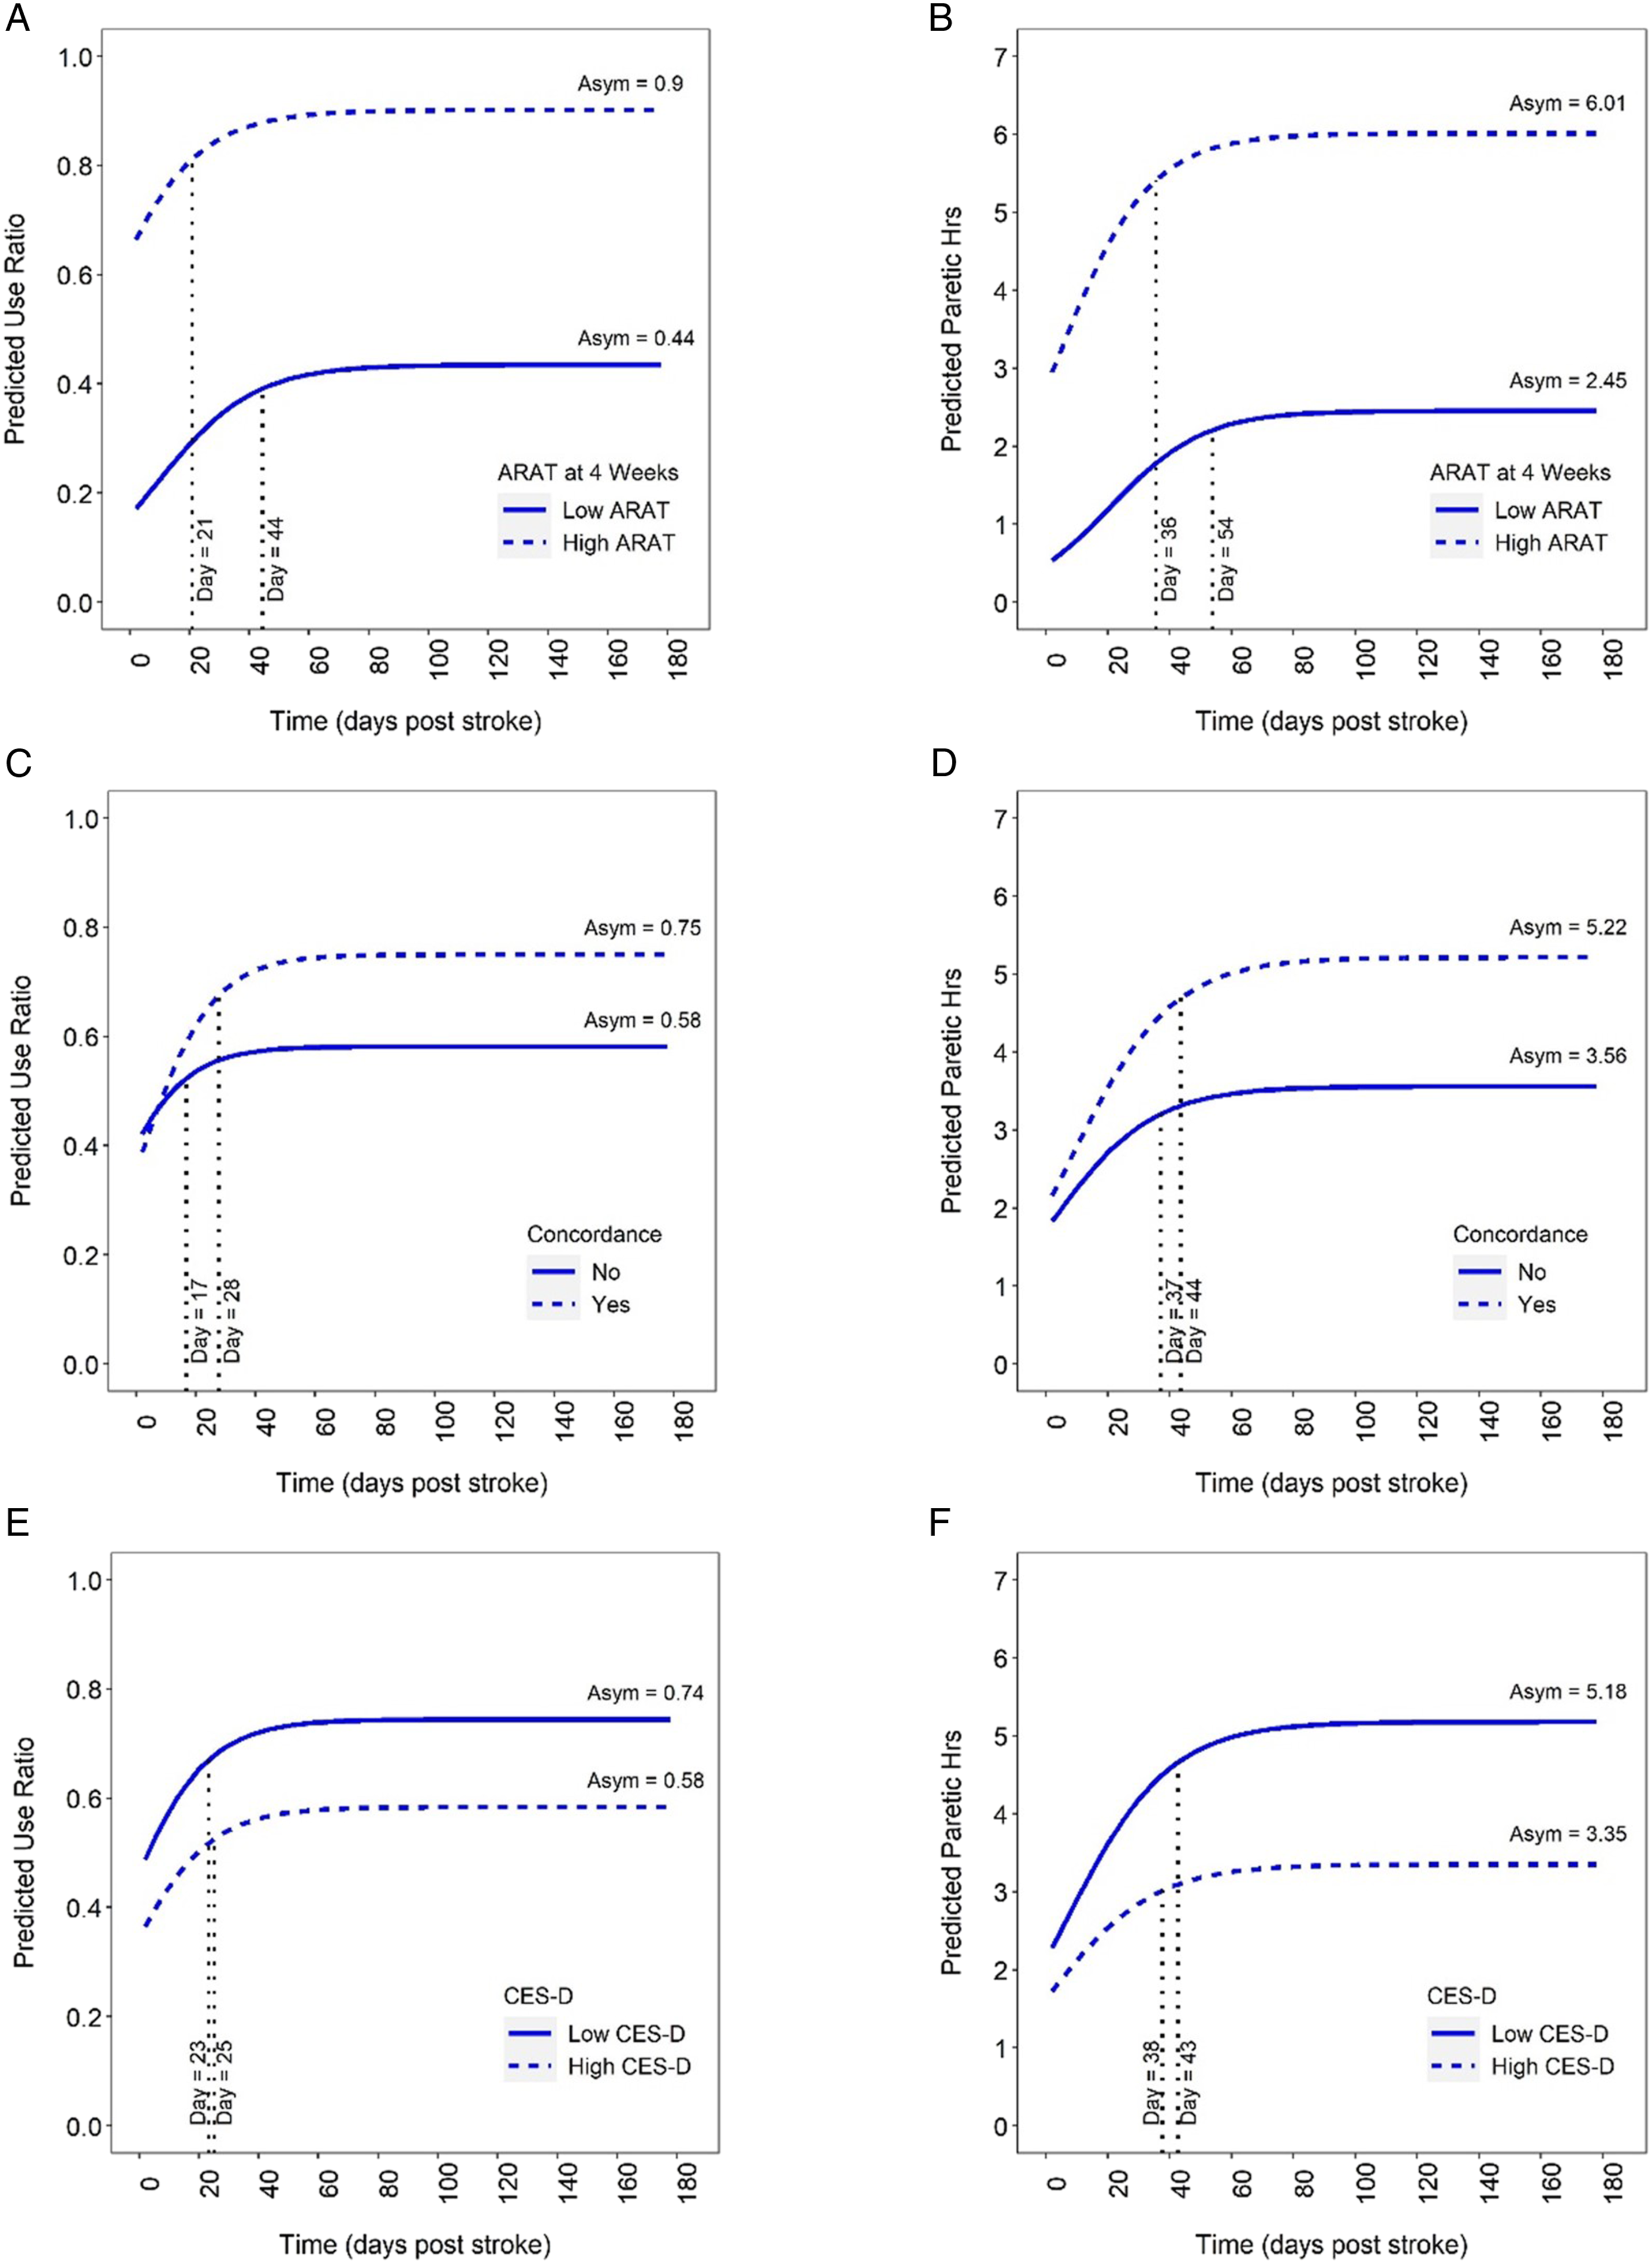
Discussion
Upper limb performance in daily life, as measured by accelerometry, started to stabilize between 3 and 6 weeks post-stroke, on average. Plateaus in performance did not lag plateaus in impairment and capacity but instead slightly preceded or occurred at the same time. Factors that were associated with better eventual performance in daily life were better capacity, concordant dominant and affected limb, less upper limb rehabilitation services, and no or minimal depressive symptomatology. Factors that were associated with faster rates of change were better capacity, discordant dominant and affected limb, less rehabilitation, and no or minimal cognitive deficits.
A major finding of this study is that individuals approach a stable pattern of upper limb performance in daily life surprisingly early after stroke. The upper limb performance trajectories mapped here are largely consistent with previous reports and build on them by extending the measurement points and including more participants, 18 filling in intermediate time points,13,19,20 and modeling individual trajectories to pinpoint individual time of plateau instead of assessing time point differences. 20 Our data indicate that upper limb performance in home and community life becomes fixed relatively early, even in the presence of ongoing upper limb rehabilitation services. Over 60% of the sample was still receiving services at eight weeks post-stroke, as shown in Table 1. One upper limb performance variable, the use ratio, plateaued sooner than the other, paretic hours of activity. While neither variable is a complete measure of upper limb performance, 12 validity of the use ratio is better established 34 and is not influenced by walking activity. 33 Trajectories of paretic hours in this study could potentially have been influenced by small increases in walking (∼45°minutes/day increase from 3–12 weeks, from Figure 3C of Regterschot et al) during this same time period. 20
A second finding of this study is that upper limb performance changes do not lag, and in the case of the use ratio, may actually precede changes in the impairment and capacity measures. Thus, motor habits in daily life may form before neurological and functional recovery stabilizes. This was opposite to our hypothesis. One explanation is that initial experiences after a disruptive event strongly reinforce future behaviors (either positively or negatively) for many months.50,51 Specific to stroke, attempting and not succeeding in using the affected limb for a particular activity leads to learned nonuse.15,52,53 Another potential explanation is the idea that individuals consider themselves in a holding pattern “waiting to get better.” 54 Anecdotally, this idea is often voiced by research participants and patients in routine care that they are “waiting for their arm/leg to improve” and then they plan to increase activity in daily life after discharge from services. Within the dataset, we did not see any evidence that capacity needs to exceed a certain threshold in order for performance to change, as suggested from modeling of self-reported performance data. 55 A clever paper modeling data from EXCITE trial participants has suggested that a person has to improve above a threshold on a capacity test (Wolf Motor Function Test) in order for improved capacity to translate into improved performance in daily life (self-report of performance on the Motor Activity Log). 55 While we did not directly test the threshold hypothesis, the earlier stabilization of the use ratio compared to stabilization of capacity and the linear moderating effect of capacity on the performance trajectories do not support this idea. There may also be differences in self-reported vs sensor-based trajectories of upper limb performance, since measurements of one vs the other can be inconsistent. 56
Five factors modified upper limb performance trajectories after stroke. Consistent with previous reports of moderate, positive correlations between the two levels of measurement (for review see 35 ), better upper limb capacity was associated with faster rates of improvement and better eventual upper limb performance. When the dominant limb was the affected limb, eventual overall performance was better but it took longer to reach plateau. This finding, along with the early plateaus in performance suggest that perhaps individuals are willing to persist longer in regaining daily use of the dominant vs non-dominant limb, especially in a world built for right-handers. The negative moderating effect of rehabilitation services likely reflects that service utilization here is a proxy for severity of motor problems. People with mild motor problems recover quickly and no longer need services, while those with more severe problems continue to engage in rehabilitation. There was only a small amount of variance in reported service delivery before and during the time of plateau (i.e., high percentages in Table 1 for weeks 2–6). It is also worth noting that upper limb performance is not assessed in routine clinical care 34 (our study did not provide data back to the clinicians or patients), and clinical interventions are typically focused on impairment and/or capacity but not performance, despite recent recommendations. 27 Our findings that higher levels of depressive symptomology and cognitive deficits reduce and slow recovery of upper limb performance, respectively, reinforce the importance of assessing these domains and targeting them for treatment. 57 Looking forward, these data open up the testable hypothesis that treatment to improve depression and/or cognition might also improve upper limb performance in daily life.
Three key limitations need to be considered in interpreting these data. First, the sample size was small and recruited from one large, academic, mid-western, United States hospital. Data from additional participants and additional sites are needed to assess the generalizability of our findings. Second, the measures of upper limb performance (like those of impairment and capacity) are far from perfect. 12 The measures capture global upper limb movement quantity and do not fully capture movement quality 11 nor distal movements that might occur independently of wrist and other upper limb movements. 58 We have reported here on measures of movement duration and symmetry of movement duration but have found strong correlations and similar time course of changes between these measures and measures of magnitude and variability. Given the challenges at all levels of measurement, these results can be considered an initial picture about the relative timing of the impairment, capacity, and performance of the upper limb. And third, it is a challenge to interpret the clinical relevance of some of the statically significant modifiers found here. The two most relevant modifying effects may be capacity and concordance, since they had a reasonable impact on the performance variables. Other modifying variables, such as depressive symptomatology may not matter unless someone is severely affected on the CES-D.
Conclusions
Upper limb performance in daily life as measured by wearable motion sensors approached plateau within 3 to 6 weeks post-stroke, at the same time or just before plateaus in impairment and capacity. Our results need to be validated in a larger sample, preferably across countries and healthcare systems in order to evaluate how trajectories are influenced by neurobiology, human behaviors, and access to and content of rehabilitation services. These data suggest that now is the time to add direct measures of upper limb performance into clinical practice and potentially change or augment intervention strategies to include a focus on behavior in daily life. 27
Footnotes
Acknowledgments
We thank Christine Gordon for her assistance with data collection and the many participants who came in repeatedly for their assessments.
Declaration of Conflicting Interests
The author(s) declared no potential conflicts of interest with respect to the research, authorship, and/or publication of this article.
Funding
The author(s) disclosed receipt of the following financial support for the research, authorship, and/or publication of this article: This study is supported by Kennedy Shriver National Institute of Child Health and Human Development (R01 HD068290, T32 HD007434, TL1 TR002344).