
Abstract
Background
Persistent motor deficits are very common in poststroke survivors and often lead to disability. Current clinical measures for profiling motor impairment and assessing poststroke recovery are largely subjective and lack precision.
Objective
A multimodal neuroimaging approach was developed based on concurrent functional near-infrared spectroscopy (fNIRS) and electroencephalography (EEG) to identify biomarkers associated with motor function recovery and document the poststroke cortical reorganization.
Methods
EEG and fNIRS data were simultaneously recorded from 9 healthy controls and 18 stroke patients during a hand-clenching task. A novel fNIRS-informed EEG source imaging approach was developed to estimate cortical activity and functional connectivity. Subsequently, graph theory analysis was performed to identify network features for monitoring and predicting motor function recovery during a 4-week intervention.
Results
The task-evoked strength at ipsilesional primary somatosensory cortex was significantly lower in stroke patients compared with healthy controls (P < .001). In addition, across the 4-week rehabilitation intervention, the strength at ipsilesional premotor cortex (PMC) (R = 0.895, P = .006) and the connectivity between bilateral primary motor cortices (M1) (R = 0.9, P = .007) increased in parallel with the improvement of motor function. Furthermore, a higher baseline strength at ipsilesional PMC was associated with a better motor function recovery (R = 0.768, P = .007), while a higher baseline connectivity between ipsilesional supplementary motor cortex (SMA)–M1 implied a worse motor function recovery (R = −0.745, P = .009).
Conclusion
The proposed multimodal EEG/fNIRS technique demonstrates a preliminary potential for monitoring and predicting poststroke motor recovery. We expect such findings can be further validated in future study.
Keywords
Introduction
Stroke is the major cause of motor impairment, leading to motor deficits at acute stage and most stroke survivors are left with residual motor deficits throughout their life. 1 Over the past decades, effort has been taken to understand the neural mechanisms of motor recovery following stroke and enhance the efficacy of rehabilitation therapy. Emerging evidences have shown that cortical reorganization accompanies the restoration of motor function after stroke,2,3 yet how well poststroke rehabilitation can benefit from this functional alteration has not been completely determined. Therefore, it is important to identify biomarkers that could precisely characterize the pattern of motor recovery and maximize the therapeutic effect during poststroke therapy.
Cortical reorganization during poststroke therapy is generally associated with altered regional excitability as well as aberrant connection between relevant function areas.3-6 Advanced noninvasive neuroimaging techniques, including electroencephalogram (EEG) and functional magnetic resonance imaging (fMRI), have been widely applied to explore the dynamic alteration of cortical excitability and connectivity after stroke and shown great potential for understanding the relationship between dysfunctional brain network and motor deficit.7-10 For example, resting-state fMRI studies have shown that interhemispheric connectivity between bilateral primary motor cortex is positively correlated with the motor improvement of stroke patients and can predict better upper limb motor gains across longitudinal rehabilitation.5,11-13 Additionally, Cheng et al 7 explored the task-evoked brain network property using graph theory analysis during a motor task and found that network-derived indices are capable of predicting motor function restoration. In contrast to fMRI, EEG presents a number of advantages over fMRI for exploring the stroke-linked neuronal activity: It is highly portable, inexpensive, and features a very high temporal resolution. 14 By applying connectivity analyses to EEG signals, the modulations of regional connectivity following stroke have been identified in previous studies.9,10 Overall, these findings suggest that measures of cortical motor excitability and connectivity may serve as good biomarkers for characterizing the cortical reorganization after stroke.
However, one challenge of EEG is the volume conduction problem; a single electrode on the scalp picks up activity from multitude sources (cortical activity, subcortical activity, external noise, etc), which results in a difficulty in accurately localizing the source activity and spuriously affects phase-synchronization indices used in EEG connectivity analyses.15,16 EEG source localization has therefore been developed to overcome the limitation of surface EEG in characterizing the brain activity. 17 Typically, this approach relies on the surface EEG signals and the anatomical structure and physiological properties of the brain to estimate sources within the brain, which allows us to more accurately localize the regions associated with specific function.18,19 A common challenge for EEG source localization is the ill-posed “inverse problem”; the number of sources that give rise to EEG signals vastly outnumbers the available measurements, making it impossible to localize the measured scalp EEG activity to the actual current-generating source within the brain with absolute certainty.20,21 Therefore, attempts have been made to overcome this challenge by combining EEG data with the results from other neuroimaging modalities, such as fMRI. Prior studies have shown that, using high spatial prior information acquired by fMRI, people are able to estimate brain activity with high spatiotemporal resolution in both computer simulations and real experiments involving visual and motor tasks.22-25 However, fMRI is typically limited by the high sensitivity to motion artifacts, poor portability, and high costs, rendering it less appropriate for investigating brain activity related to human motor control in realistic situations (eg, in sitting or standing positions). 26
One alternative solution for overcoming this limitation is to use functional near-infrared spectroscopy (fNIRS) as a supplement to EEG source localization. Briefly, fNIRS is a portable optical imaging technique that measures the concentration change of the oxygenated (HbO) and deoxygenated hemoglobin (HbR) related to activity of neurons in the brain.27,28 Importantly, it has been proved that fNIRS and fMRI share a similar physiological principle, 29 while fNIRS has the advantage to monitor cerebral hemodynamic changes with high portability and strong robustness to motion artifact.30,31 In addition, our previous study has demonstrated the possibility of utilizing the fNIRS constrained-EEG source localization to investigate the dynamic cortical connectivity associated with Alzheimer’s disease. 32 Together, these evidences support that connectivity analysis based on integrated fNIRS-EEG source localization could be applied to characterize the stroke-linked cortical reorganization for the assessment of poststroke motor recovery.
With this in mind, this study presented a novel fNIRS-informed EEG source imaging algorithm to characterize the cortical reorganization induced by stroke. Specifically, fNIRS and EEG data were simultaneously collected from healthy controls and stroke patients during a motor task. Spatial priors related to the motor task were extracted from the fNIRS signals to enhance the performance of the EEG source imaging, from which the time-courses of cortical activity were reconstructed and used for the functional connectivity (FC) analysis for all subjects. We hypothesized that brain network within motor regions would be associated with individual motor function. It was expected that network-based biomarkers were able to assess and predict motor improvement after rehabilitation intervention.
Materials and Methods
Participants
Eighteen stroke patients with hemiparesis (11 males, 7 females; age 47.78 ± 11.06 years) were recruited from Guangdong Provincial Work Injury Rehabilitation Center, and 9 age-matched, healthy subjects (6 males, 3 females; age 44.44 ± 16.63 years) were recruited as a control group in this study. All participants are right-handed, age-matched, and gender-matched. The experimental protocol was approved by the ethics committee of the Guangdong Provincial Work Injury Rehabilitation Center (AF/SC-07/2016.30). Participants gave written informed consent according to the Declaration of Helsinki.
The inclusion criteria for stroke patients were as follows: (1) stroke that occurred 1 to 6 months prior to the first assessment, (2) age between 18 and 70 years, and (3) able to follow instructions and to consent (Mini Mental State Examination score >27). The exclusion criteria included (1) deficits in communication or attention that would interfere with the experiment participation, (2) contraindication to MRI scanning, and (3) other diseases that would substantially affect the function of upper extremity.
Intervention Protocol
All patients underwent a 4-week conventional rehabilitation intervention in the hospital. The intervention included standard physical training (walking, sitting and standing balance, movement switching), occupational therapy (eating, drinking and swallowing, dressing, bathing, cooking, reading and writing, and using the toilet), and massage for 6 hours per day, 5 days per week. Prior to the beginning of intervention, all patients underwent a baseline assessment of upper extremity function by Fugl-Meyer Assessment rating scale (FM-UL, normal = 66) and participated in a concurrent EEG-fNIRS recording (preintervention). At the end of the rehabilitation intervention, 8 patients were not able to complete the entire rehabilitation intervention and thus were ineligible to participate in the postintervention experiment. Three patients were excluded for further analysis due to noisy signals. Thus, 7 of the 18 patients participated in the second concurrent EEG-fNIRS recording and assessment of motor function (postintervention). All motor function assessments were performed by an experienced therapist from the Department of Rehabilitation Medicine in the participating hospital.
Experiment Protocol and Data Acquisition
During the experiment, Subjects received visual instruction through a monitor placed in front of them. A motor execution (ME) paradigm consisted of 40 randomized trials of left- and right-hand clench task (20 trials for each hand) was adopted. Each trial started with a 8-second ME task, indicated by an short video showing a left/right open-close hand, followed by 17 seconds of a resting period, indicated by a “+” symbol in a black background (Figure 1A). During the ME period, subjects were asked to naturally squeeze a sponge ball with the corresponding hand. Patients were required to try their best to squeeze the rubber without causing any shaking of their bodies when performing hand clenching using their affected hands. Specifically, in this study, we used whole-hand clenching task as cortical activity change is considered to be much stronger and more reliable to localize in individual subjects with whole-hand movements compared with commonly used task such as finger tapping. 33 Also, the whole-hand clenching task is easier to be regularly executed by stroke patients resulting in stable task performance.
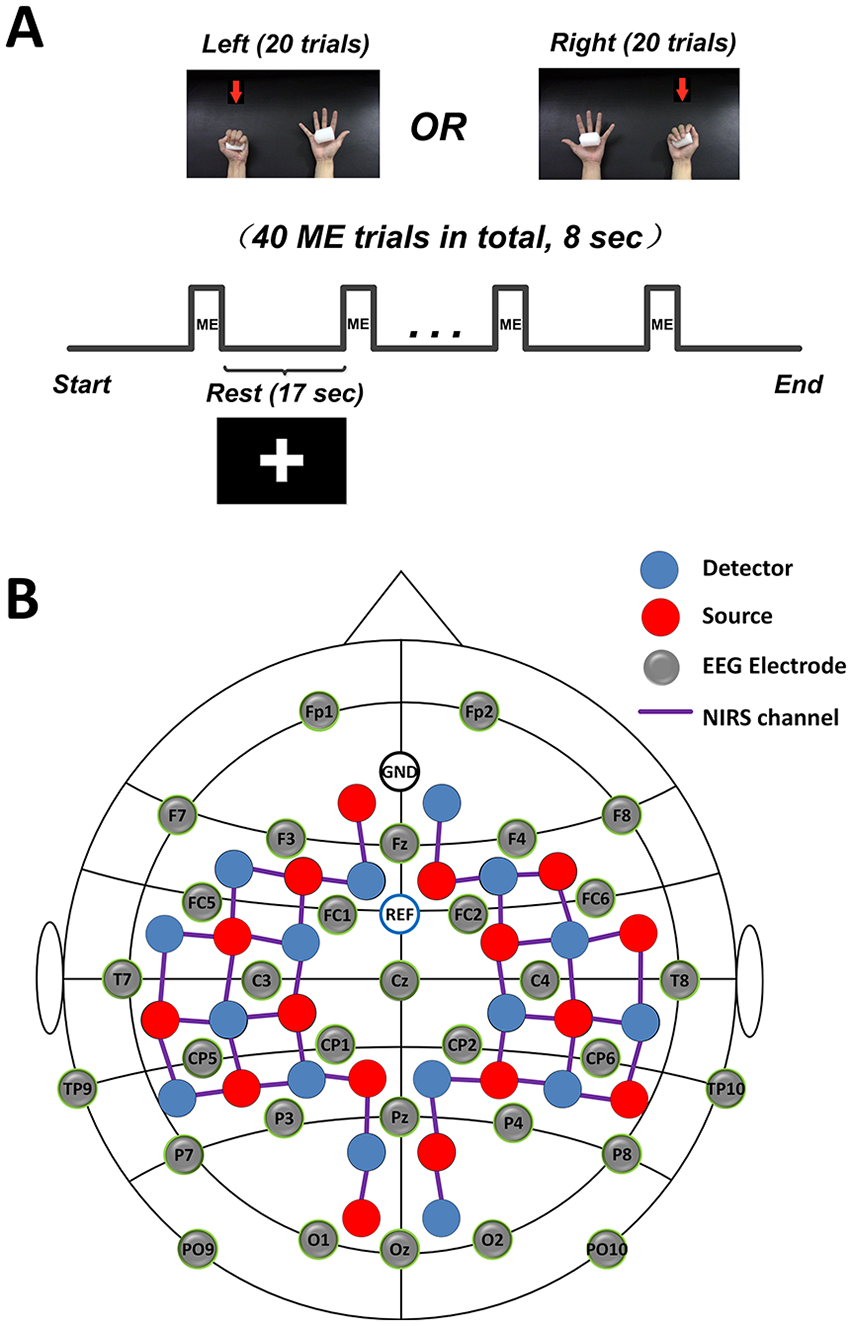
Experimental design. (A) The experimental motor execution task used in the study. “+” symbol indicated the resting period. (B) The channel locations of electroencephalography (EEG) and functional near-infrared spectroscopy (fNIRS). ME, motor execution.
A concurrent EEG and fNIRS measurement setup was employed to collect the EEG signal and hemodynamic response signal (Figure 1B). Specifically, 32 EEG electrodes were placed on the scalp, and EEG signals were measured using an EEG recording system (Brain Products GmbH) at 500 Hz sampling rate. At the same time, a total of 40 fNIRS channels were positioned over the main brain regions, including the motor cortex, frontal cortex, temporal cortex and occipital cortex. fNIRS signals were recorded simultaneously using a continuous-wave NIRS imaging system (NIRScout, NIRx Medizintechnik GmbH) at 3.91 Hz sampling rate.
Data Preprocessing
The raw EEG signals were first filtered by a notch filter at 50 Hz to remove powerline noise and then a fourth-order Butterworth bandpass filter (0.5-45 Hz). Eye movement artifact was then removed using independent component analysis. Data were re-referenced by subtracting the average of all channels from each channel. After that, EEG data were segmented to multiple trials that began 2000 ms before the task onset and ended 8000 ms after, and baseline correction was performed for each trial. Finally, we manually inspected and excluded any trial with artifact.
For the fNIRS signals, a fourth-order Butterworth bandpass filter (0.01-0.5 Hz) was applied first to eliminate artifacts such as cardiac interference (0.8 Hz). After that, motion artifacts were removed from the fNIRS signals using a wavelet-based method. 34 The concentration changes of the HbO and HbR were then computed according to the modified Beer-Lambert law 27 . The obtained signals were manually inspected for every channel, wherein noisy trials were excluded from further analysis. Similar to the method in our previous study, 32 the general linear model was employed to obtain the activated channels significantly induced by each hand movement, which would be used as spatial priors for the EEG source imaging.
fNIRS-Informed EEG Source Imaging
In this study, a template brain model obtained from the MNI305 space was used as a common brain model for all subjects in this study. A high-density cortical layer and a brain-skull-scalp layer were generated on the brain model using the Freesurfer analysis suite (publicly available at http://surfer.nmr.mgh.harvard.edu/). We then constructed a 3-layer model using the boundary element method, 35 wherein the high-density cortical layer was used as the source space with 16 000 vertices at each hemisphere. After that, a lead-field matrix G was computed via forward calculation using the cortical source space, the 3-layer boundary element method model and the 32 EEG channels coregistered to the model.
Following the method described in previous studies,36,37 for each subject, the activated fNIRS channels were projected and interpolated from the scalp layer onto the cortical layer, resulting in a cortical activation map for each hand movement as spatial priors. In addition, the DKT40 atlas was adopted in this study to define 68 functional regions of interest (ROIs), 38 which were used for the subsequent brain network analysis.
A hierarchical Bayesian-based algorithm recently developed by our group 22 was employed to perform fNIRS-informed EEG source imaging. A time-course of cortical activity for each brain ROI was reconstructed and extracted from each region, yielding 68 regional current source estimates for each subject.
Functional Connectivity and Graph Theory Analysis
To accurately characterize the brain plasticity after stroke, in this study we employed weighted phase lag index (wPLI) to assess the FC between brain regions and graph theory analysis to identify aberrant regional excitability caused by stroke.
The phase lag index (PLI) has been widely used to quantify the interaction between any brain ROI pair by calculating the difference the phase between 2 time-series signals. 39 Briefly, given the time series of 2 ROIs, the PLI is defined as
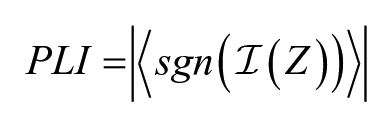
where
Different from PLI, wPLI extends the concept of PLI by weighting phase differences based on the magnitude of their lag to suppress the volume conduction problem in EEG source analysis. 16 The wPLI is computed as
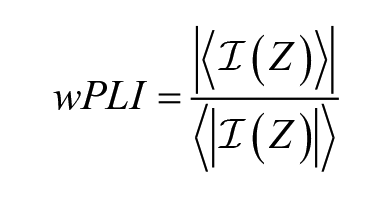
It should be noted that
In this study, the reconstructed time series of each brain ROI was first filtered into different frequency bands, including theta (4-8 Hz), low alpha (8-10 Hz), high alpha (10-13 Hz), and beta (13-30 Hz). The wPLI between the time series of any ROI pair was then computed for each frequency band.
Graph theory was employed in this study to identify brain region with abnormal excitability after stroke. Specifically, we defined each ROI as a “node” and the wPLI between 2 nodes as the “edge” in a graph. 40 As such, based on the wPLI interaction matrix, a weighted undirected graph can be constructed for each frequency band and each subject. 32 Furthermore, a graph metric, termed as node strength, was applied to assess the excitability of each brain region. Specifically, the strength of a particular ROI is defined as the sum of weights of all edges connected to this ROI, which indicates the importance of ROI in the network. 40 In this study, we computed the strength of each ROI at all predefined frequency bands.
Multiple Linear Regression and Statistical Analysis
To identify the association between the FC indices and motor function of subjects, we performed bivariate analysis and multiple linear regression analysis in this study. Specifically, we focused on the strength of 8 key brain regions that are essentially involved in motor control system, including the primary motor cortex (M1), premotor cortex (PMC), primary somatosensory cortex (S1), and supplementary motor area (SMA) on both hemispheres. In addition, the connectivity between all 8 regions, including 4 symmetrical connection between 2 hemispheres, 3 connections between M1 and other brain regions in the ipsilesional hemisphere, and 3 connections between M1 and other brain regions in the contralesional hemisphere, were also evaluated by testing the corresponding wPLI values. Overall, there were 32 regional excitability indices (assessed by strength, 8 regions × 4 bands) and 40 connectivity indices (assessed by wPLI, 10 connections × 4 bands) to be analyzed. Note that the left hemisphere was defined as a lesion side based on the motor deficit of the patient group (Table 1), and the corresponding right-hand clenching task was analyzed. FC indices from patients with a lesion in the right hemisphere were flipped across the midline for subsequent analyses. 10
The Demographic Information and Clinical Characteristics of All Subjects.
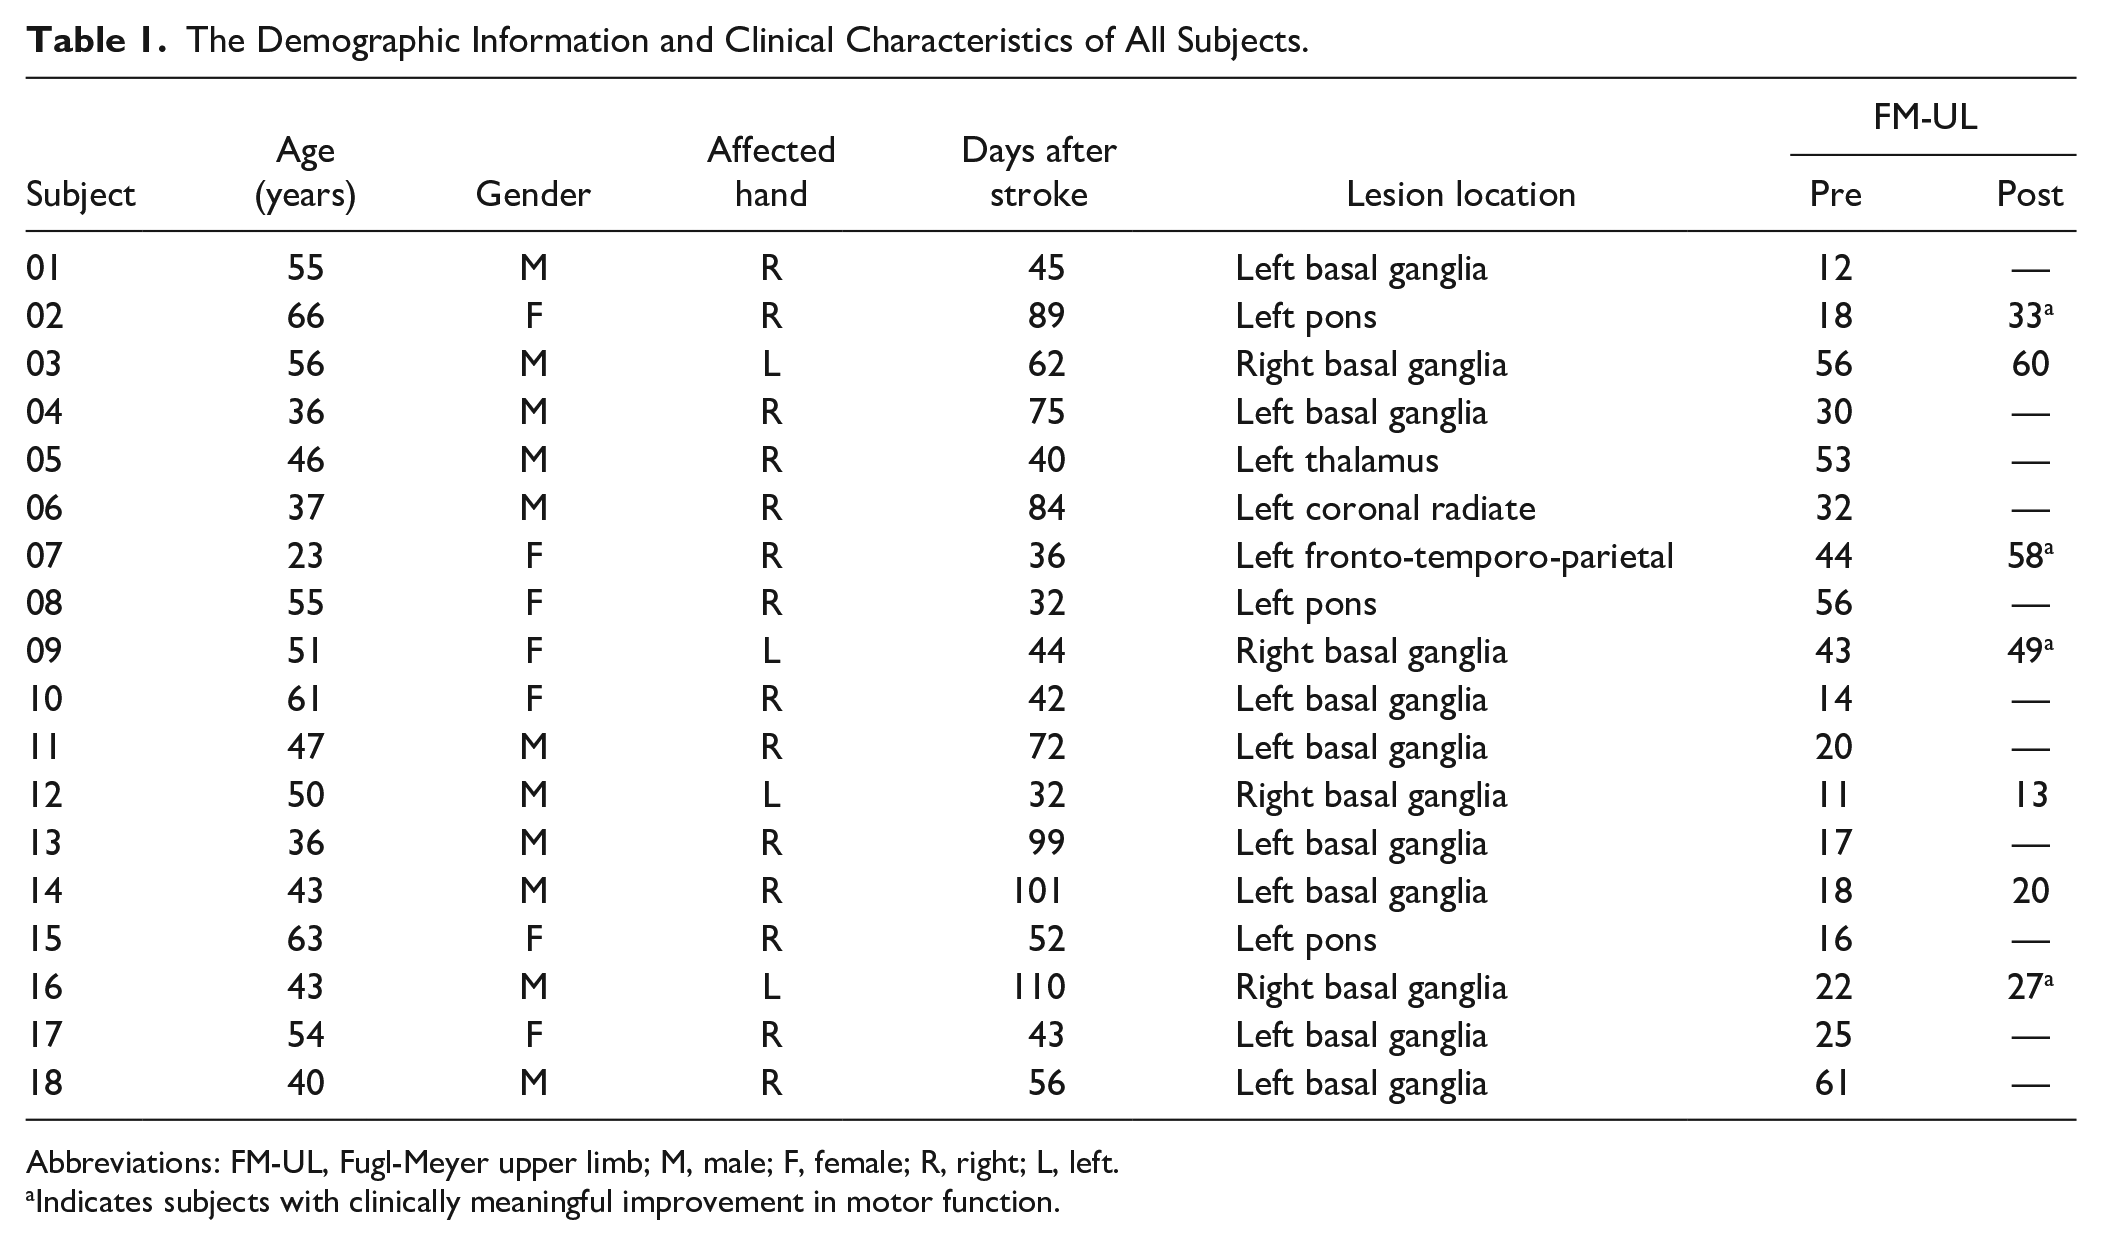
Abbreviations: FM-UL, Fugl-Meyer upper limb; M, male; F, female; R, right; L, left.
Indicates subjects with clinically meaningful improvement in motor function.
We first investigated whether there was a significant difference in the FC indices between healthy controls and stroke patients using Wilcoxon rank sum test. Multiple linear regression was employed to document the linear relationship between the selected FC indices and the degree of motor impairment (FM-UL scores). Specifically, in the regression model, the independent variables were the selected FC indices among target regions, while the dependent variable was the FM-UL scores of all subjects.
The second analysis was to examine how the changes in FC (ΔFC) performed as a biomarker of improvement in motor function (ΔFM-UL) over the 4-week intervention in patients. The ΔFC of all 7 patients underwent 2 assessments were defined as the independent variables in the linear regression model, while the changes of FM-UL scores between pre- and postintervention (ΔFM-UL) were defined as the dependent variable.
Another analysis was to assess how well the baseline FC (preintervention) can predict the motor function gains (ΔFM-UL) after the 4-week intervention. We defined the baseline FC indices obtained from all 7 patients as the independent variables and the improvement of motor function (ΔFM-UL) after rehabilitation as the dependent variable.
Importantly, prior to each individual multiple linear regression analysis, bivariate analysis was performed to test the correlation between each independent variable and dependent variable using Pearson’s correlation. Similar to a previous study, 10 a threshold relative to the absolute value of the maximal correlation coefficient (>0.8 Rmax) was required for the corresponding independent variables to be included in the regression model.
Results
Demographic and Clinical Behavioral Data
Table 1 summarizes the demographic information and clinical behavioral scores of all patient subjects, including age, gender, site of the lesion, time of poststroke, and clinical assessment scores. Statistical analysis showed that there were no significant differences between healthy controls and stroke patients in terms of age (P = .526, t test) and gender (P = .609, chi-square test). In addition, a significant improvement in the motor function (assessed by FM-UL scores) after the 4-week rehabilitation intervention was observed from 7 patients who participated in the second evaluation (post- vs preintervention, P = .017). However, improvements of FM-UL in 3 patients may not be considered as clinically meaningful based on the minimal clinically important difference (MCID = 4.58) of FM-UL. 41
Difference in Functional Connectivity Between Healthy and Patient Groups
The Wilcoxon rank sum test revealed that the baseline (preintervention) strength of ipsilesional S1 at theta band was significantly lower in stroke patients (n = 18) compared with healthy controls (n = 9) (Pcorrected < .001, Figure 2A). We further examined the relationship between the significant FC index and the FM-UL scores of all patients. The linear regression analysis indicated that, when considering both pre- and postintervention, there was only a mild positive but not significant correlation between the theta strength at the affected S1 and the degree of motor impairment of patients (R = 0.254, P = .221), as shown in Figure 2B.
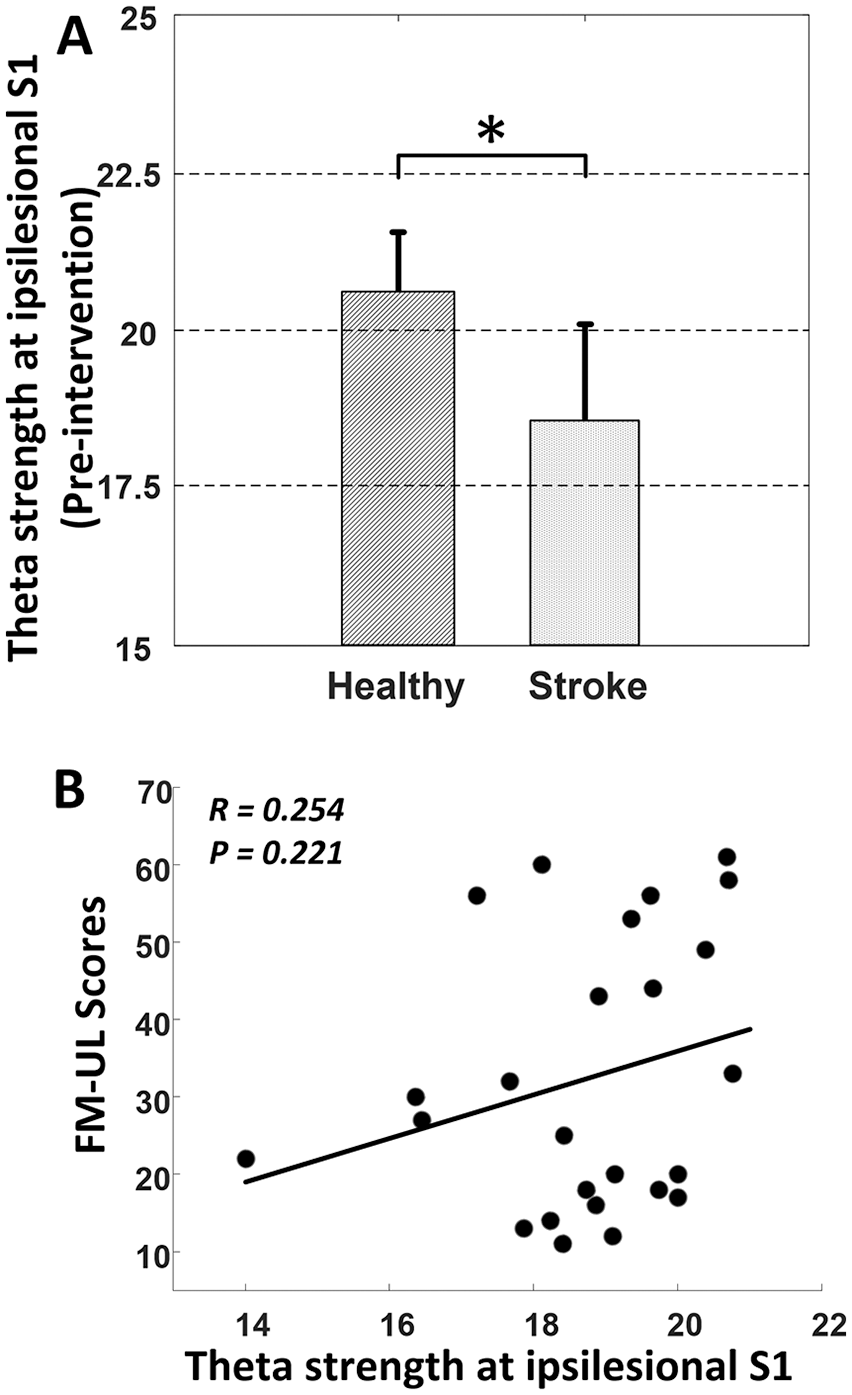
(A) Significant difference in theta strength (mean ± SD) at ipsilesional S1 between healthy and patients at preintervention (P < .001). (B) Positive but not significant correlation between the strength of ipsilesional S1 at theta band and the degree of motor impairment of all patients. FM-UL, Fugl-Meyer upper limb; S1, primary somatosensory cortex.
Correlation Between Changes of Functional Connectivity and Improvement of Motor Impairment
A separate linear regression analysis was performed to evaluate the sensitivity of the change of FC (ΔFC) in monitoring the recovery of motor function (ΔFM-UL) in all 7 patients who participated in the post-intervention evaluation. Results showed that there was a significantly positive correlation between the change in the high alpha connectivity of bilateral M1 areas and the improvement of motor impairment after the 4-week rehabilitation (R = 0.900, P = .007, Figure 3A). We also found that the change in the task-evoked strength at ipsilesional PMC was positively correlated with the improvement of motor impairment at beta band (R = 0.895, P = .006, Figure 3B).
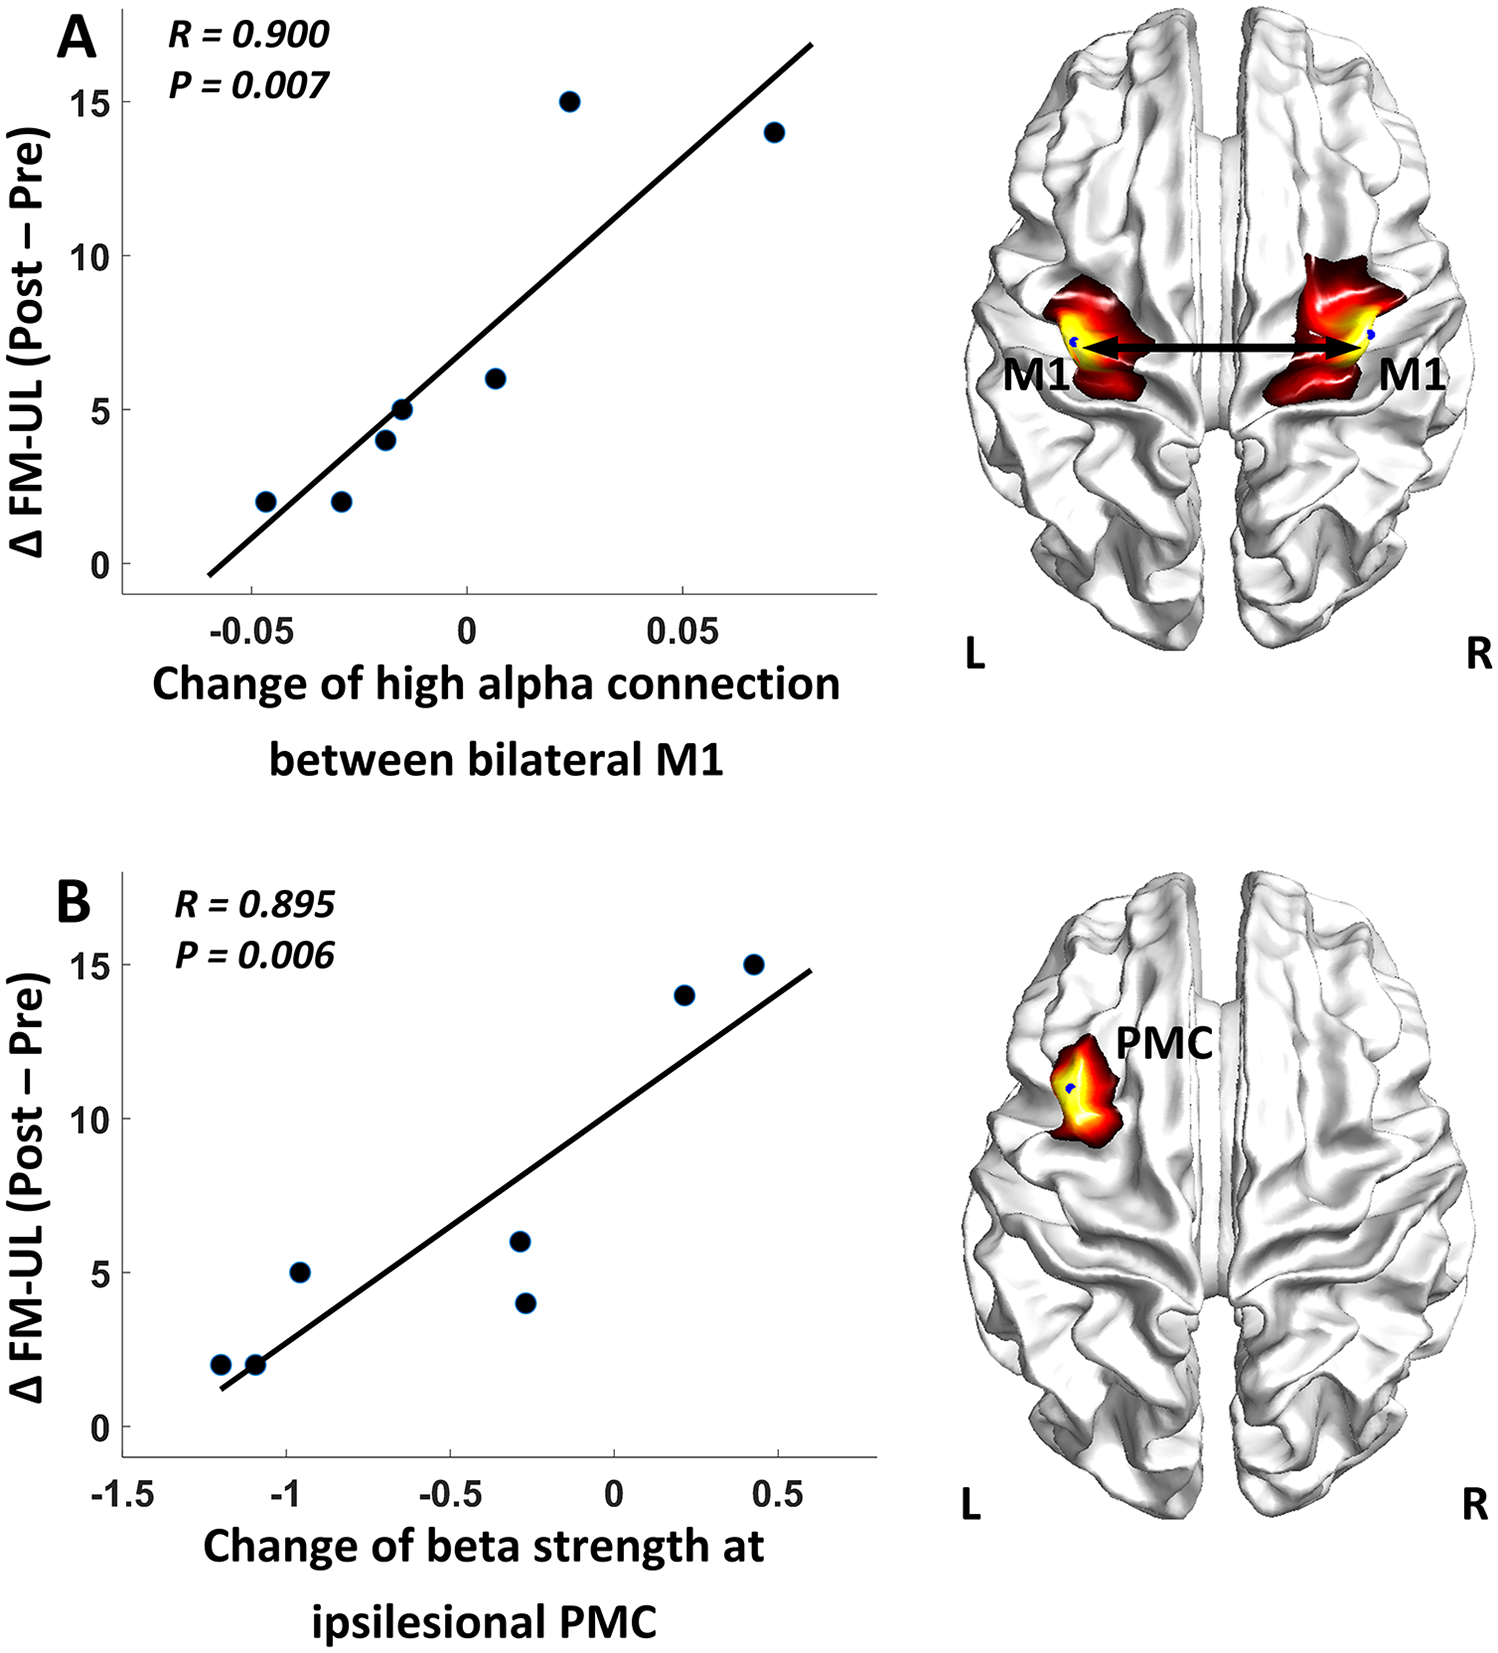
Correlation between the motor gains and changes of functional connectivity indices: (A) change of connectivity between bilateral M1 and (B) change of the strength at ipsilesional PMC. FM-UL, Fugl-Meyer upper limb; M1, primary motor cortex; PMC, premotor cortex.
Baseline Functional Connectivity Predicts Motor Improvement After Intervention
To assess the feasibility of using FC indices as biomarkers to predict the motor gains after rehabilitation intervention, a linear regression model was fitted to correlate the baseline (preintervention) FC indices with the motor gains (ΔFM-UL) after the rehabilitation. The results showed that the higher baseline SMA-M1 connectivity at the affected hemisphere related to the worse motor gains after the training (R = −0.745, P = .009, Figure 4A), while greater motor gains were also predicted by higher baseline strength of the ipsilesional PMC at low alpha band (R = 0.768, P = .007, Figure 4B).
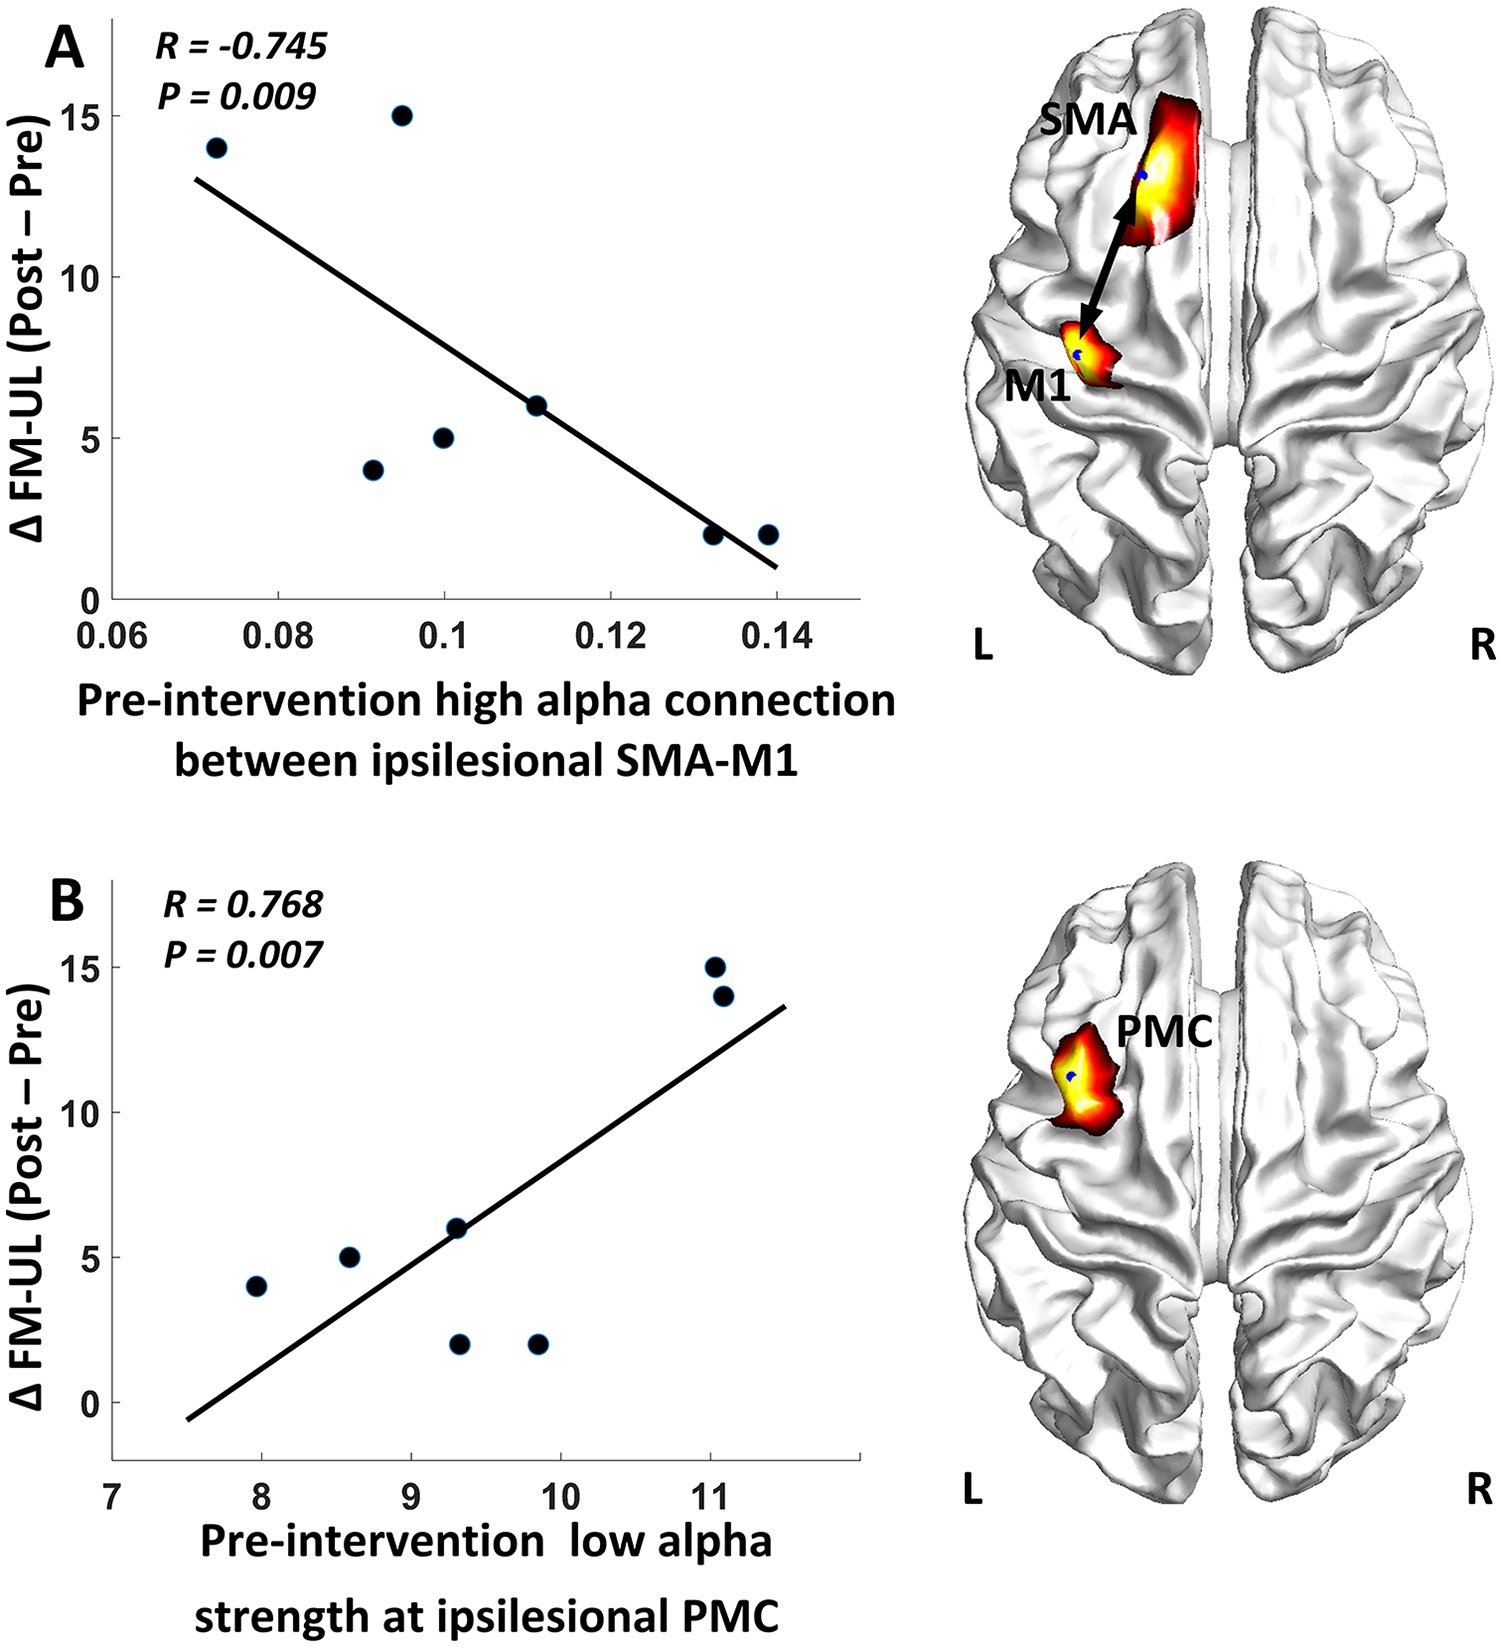
Correlation between the motor gains and the baseline (preintervention) functional connectivity measures: (A) baseline connectivity between ipsilesional SMA-M1 and (B) baseline strength at ipsilesional PMC. FM-UL, Fugl-Meyer upper limb; M1, primary motor cortex; SMA, supplementary motor area; PMC, premotor cortex.
To evaluate the effectiveness of using behavioral measures (baseline FM-UL, age, days after stroke) at baseline to predict recovery outcome, Pearson’s correlation between each behavioral measure at baseline and the patient’s motor improvement after intervention (∆FM-UL) was computed. Result revealed that none of these measures have significant correlation with the motor improvement (PFMA_base-∆FMA = .752, PAge-∆FMA = .870, PDays-∆FMA = .866), indicating the poor prediction ability of these behavioral measures.
Discussion
Routine clinical examination lacks direct evidence that reflects the functional recovery of motor-related regions in the brain. Therefore, it is of great importance to explore useful biomarkers for insightful assessments of changes in brain motor function across a period of therapy and an effective management of a rehabilitation program. Numerous lines of evidence have demonstrated that stroke lesion at both cortical and subcortical area could induce brain plasticity on the cortical level, such as altered interhemispheric connectivity between bilateral motor cortex (particularly M1) and abnormal regional activation, 42 which opens new opportunities for us to explore the network aspects of brain function and brain plasticity associated with poststroke recovery. In this study we presented an fNIRS-informed EEG source imaging approach to investigate the brain network alterations caused by stroke during a hand-clenching task. The findings validated the feasibility of using the novel fNIRS-informed EEG source imaging approach to characterize the altered cortical excitability and connectivity caused by stroke, as well as to derive biomarkers for the assessment and prediction of motor function recovery in poststroke rehabilitation.
Recent findings have suggested that there is a close association between the cortical excitability and upper extremity function in stroke patients.10,43 In the current study, using the cortical activation strength as an excitability measure, the ipsilesional PMC was identified as key region associated with the motor recovery. Specifically, the increment of beta strength at ipsilesional PMC was highly correlated with the motor function improvement across the 4-week intervention (R = 0.895, Figure 3B). Furthermore, the baseline (preintervention) strength of this region at low alpha band was also highly correlated with the motor improvement (R = 0.768, Figure 4B), accounting for a majority of the rehabilitation outcome after stroke. These results are consistent with evidences reported in previous studies that better motor recovery is associated with increased task-evoked activation in ipsilesional PMC.44-46 Similar findings were also reported in recent studies involved in resting state connectivity analysis. 10 Functionally, the role of PMC is critical in motor control and learning as it receives direct inputs from the dorsolateral prefrontal cortex and posterior parietal cortex, processes this information, and projects the output to M1 for movement execution. 46 In particular, emerging evidences have indicated that PMC is a vital part in hand movements, wherein mirror neurons within the PMC may play a potentially significant role in motor learning such as observational learning and imitation learning. 47 As poststroke recovery during intervention generally accompanies motor control and learning processing, the increased activation in ipsilesional PMC observed in our study should be reasonable. Furthermore, the predominant pattern of cortical reorganization following stroke rehabilitation, which mainly involved the increased activation of ipsilesional PMC, is also well documented in a variety of studies.2,46 Taken together, these evidences support the findings in our study that the baseline and the change of activation strength at ipsilesional PMC were highly responsible for the major improvement of motor function across the intervention, demonstrating its important role in the poststroke motor recovery.
Motor recovery is associated with the cortical reorganization that redistributes regional interactions throughout the whole motor network rather than a single region. Therefore, in this study, in addition to the investigation of the association between cortical excitability and motor function, we also attempted to identify biomarkers associated with cortical connectivity that can be used to characterize motor recovery after stroke. Interestingly, in this study, we found that greater motor improvement after the intervention was predicted by lower baseline ipsilesional SMA-M1 connectivity (Figure 4A), which could convey meaningful information. It has been demonstrated that, regardless of cortical or subcortical stroke, motor recovery could manifest brain plasticity at primary and secondary motor cortices, including M1, PMC, and SMA. 48 According to previous studies, both M1 and secondary motor areas such as SMA have direct connections to the entire corticospinal tract (CST) that significantly correlated with the motor impairment after stroke. 49 It is possible that such a pathway from SMA to the spinal cord may at least strengthen to the motor recovery during poststroke training. More specifically, the more disconnected between SMA and M1, the stronger the SMA can be recruited to compensate for the SMA-M1 deficiency. As such, it is possible that, when the functional connection between ipsilesional SMA and M1is heavily affected due to brain lesion, secondary motor areas such as SMA may contribute to poststroke recovery by a stronger direct projection to the CST and partially taking over the functionality from the ipsilesional area, leading to better recovery of motor function after intervention (Figure 4A). However, it remains underdetermined whether the functional connectivity between SMA and CST is s more beneficial to the poststroke recovery when connection between SMA and M1 is heavily affected after stroke. More evidence should be given to validate this hypothesis and the feasibility of employing such biomarkers to predict the motor recovery outcome before enrolling in an intervention program.
Another finding in the current study is that the change in the bilateral M1 connection at high alpha rhythm was positively correlated with the motor gains across the 4-week intervention (Figure 3A). Surprisingly, a larger increment of bilateral M1 connection was significantly associated with greater motor gains, whereas decreased bilateral M1 connectivity was also correlated with mild motor gains after the intervention (Figure 3A). In fact, according to findings in our study and previous studies, the role of this particular connection during poststroke motor recovery remains unknown. While some studies have found increased functional connectivity between bilateral M1 regions after intervention,13,50 contradictory or nonsignificant results were also reported. 10 This discrepancy could be attributed to multiple reasons. For example, the clinical characteristics of patients recruited in these studies may vary sharply in terms of time after stroke onset, stroke type, and stroke severity, which might induce a large variance in the bilateral M1 connectivity results. In addition, the contribution of the contralesional M1 to the motor recovery remains controversial. While activated contralesional M1 was reported to be more evidently correlated with a poorer outcome in the long-term stroke patients, 51 recent studies have also argued that increased activation of contralesional M1 after stroke may be beneficial in some aspects of effectively recovered motor behavior.52,53 Taken these together, more evidences will be needed to determine the role of bilateral M1 connectivity in assessing the motor function recovery during poststroke rehabilitation. Beyond this uncertainty of bilateral M1 connectivity, one particularly noteworthy finding in our study is that we were able to identify such discrepancy in explaining the motor recovery outcome (Figure 3A), demonstrating the high sensitivity of the proposed brain network analysis strategy and its potential value in investigating the brain plasticity after stroke.
While we found a significant difference in theta strength at the ipsilesional S1 between stroke and healthy group at preintervention, this difference seemed to be relatively small and there was no significant linear correlation between this FC index and the FM-UL scores of patients (Figure 2). In support of this finding, previous studies have demonstrated that significant FC indices found between healthy and patient groups were not deemed to act as effective biomarkers to characterize the motor function in the patient group.4,50 This could be caused by the large variation within the patient group. Specifically, patients recruited in this study stay within a relatively wide range of stroke phase (32-110 days since stroke) covering the acute and subacute phase of stroke. In addition, there is also large variation in the initiate motor impairment of patients that ranges from 11 to 61. Thus, it is not surprised to observe a nonsignificant correlation between the theta strength at ipsilesional S1 and the FM-UL scores of patients, and the identified alteration at ipsilesional S1 should be confirmed on future study with more homogeneous cohort. In fact, instead of simply focusing on the difference between healthy and patient groups, biomarkers associated with cortical excitability and connectivity among the patient group are more attractive and are expected to be capable of characterizing the motor recovery pattern of patients during rehabilitation intervention.43,54 As such, in current study, we not only presented consistent and strong correlations between the identified FC indices and motor gains (Figure 3) but also demonstrated the great potential of these biomarkers in predicting the motor recovery spanning the 4 weeks of intervention (Figure 4), which provided reliable and sensitive biomarkers for the investigation of cortical reorganization after stroke.
The current study has some limitations that raise consideration. First, the sample size is relatively small in this study. Also, the clinical characteristics of patients are rather heterogeneous, such as lesion size, location, initiate motor impairment (11-61), stroke phase (acute/subacute) and stroke subtype (cortical/subcortical). These variables could have certain effects on characterizing the behavioral and neurological outcomes. In addition, patients recruited for only two visits may not be sufficient to draw a clear trajectory for the longitudinal cortical reorganization following stroke. Furthermore, both clinical rating scores, neurophysiological and neuroimaging biomarkers of corticomotor structure and function have shown promising values for predicting poststroke motor recovery. Following this, a flexible model that utilizes a complimentary combination of biomarkers should then be sought to provide more clinically comprehensive information when planning the personalized rehabilitation of a patient in the future. Finally, the EEG source imaging performed in this study relied on a general brain template, which might induce mild bias when estimating the cortical activity. It is expected that in future work MRI could be used to collect the anatomical information for each subject to optimize the proposed approach.
Conclusions
In this study, we presented a high spatiotemporal fNIRS-informed EEG source imaging framework to characterize the alterations of cortical excitability and function connectivity following stroke. In summary, the results of functional connectivity and graph-based analyses suggested that the bilateral M1 connection and task-evoked strength of ipsilesional PMC have significant potential in assessing the motor recovery outcome across a 4-week intervention. In addition, we also found that the ipsilesional SMA-M1 connection and the task-evoked strength of ipsilesional PMC at the pre-intervention stage, were highly capable of predicting the motor recovery outcome. Therefore, the biomarkers derived from the proposed method may hold great potential in post-stroke rehabilitation assessment and expanding our understanding of cortical reorganization after stroke.
Footnotes
Acknowledgements
The authors would like to thank Chunli Zhao from South China University of Technology for the assistance in data collection.
Declaration of Conflicting Interests
The author(s) declared no potential conflicts of interest with respect to the research, authorship, and/or publication of this article.
Funding
The author(s) received no financial support for the research, authorship, and/or publication of this article.