
Abstract
Background. Motor recovery after stroke is of great clinical interest. Besides magnetic resonance imaging functional connectivity, electroencephalographic synchrony is also an available biomarker. However, the clinical relevance of electroencephalographic synchrony in hemiparesis has not been fully understood. Objective. We aimed to demonstrate the usefulness of the phase synchrony index (PSI) by showing associations between the PSI and poststroke outcome in patients with hemiparesis. Methods. This observational study included 40 participants with cortical ischemic stroke (aged 69.8 ± 13.8 years) and 22 healthy controls (aged 66.9 ± 6.5 years). Nineteen-channel electroencephalography was recorded at 36.9 ± 11.8 days poststroke. Upper extremity Fugl-Meyer scores were assessed at the time of admission/before discharge (FM-UE1/FM-UE2; 32.6 ± 12.3/121.0 ± 44.7 days poststroke). Then, correlations between the PSIs and FM-UE1 as well as impairment reduction after rehabilitation (FM-UEgain) were analyzed. Results. The interhemispheric PSI (alpha band) between the primary motor areas (M1s) was lower in patients than in controls and was selectively correlated with FM-UE1 (P = .001). In contrast, the PSI (theta band) centered on the contralesional M1 was higher in patients than in controls and was selectively correlated with FM-UEgain (P = .003). These correlations remained significant after adjusting for confounding factors (age, time poststroke, National Institute of Health Stroke Scale, and lesion volume). Furthermore, the latter correlation was significant in severely impaired patients (FM-UE1 ≤ 10). Conclusions. This study showed that the PSIs were selectively correlated with motor impairment and recovery. Therefore, the PSIs may be potential biomarkers in persons with a hemispheric infarction.
Introduction
Hemiparesis is a common poststroke impairment, and the prediction of motor recovery has been of great interest to researchers and clinicians.1,2 According to the consensus-based core recommendation from the Stroke Recovery and Rehabilitation Roundtable, 2 corticospinal tract (CST) injury biomarkers indexed by diffusion tensor imaging, lesion overlap, or transcranial magnetic stimulation are recommended for use in clinical trials.3-5 In addition, functional magnetic resonance imaging (fMRI) and electroencephalography (EEG) markers may be promising biomarkers. 2 Quinlan et al demonstrated that it is best to predict motor recovery using both CST injury (lesion overlap) and functional connectivity (FC) between the primary motor areas (M1). 6 Although lesion overlap can be quantified based on routine MRI, 7 fMRI8,9 is not available at all medical facilities. Notably, neural network status can also be evaluated using EEG synchrony because FC is defined as the temporal correlation of physiological events.10,11 In fact, the blood oxygen level–dependent signal has been shown to temporally correlate with the EEG signal.12-14 Thus, abnormalities in large-scale EEG synchrony have been observed in various brain disorders, such as schizophrenia, autism spectrum disorders,15,16 and stroke.17,18 Moreover, EEG is sensitive to the balance of cortical excitatory/inhibitory (glutaminergic/GABAergic) activity that associates with neural plasticity.2,19,20 However, the clinical relevance of EEG synchrony in poststroke motor impairment and recovery21-23 is not fully understood.2,4
The association between interhemispheric FC of the M1 and the motor score is commonly demonstrated in fMRI studies,9,24,25 but only one study has found a correlation between interhemispheric EEG synchrony of the M1 and motor score. 17 In contrast, longitudinal studies indicate that EEG synchrony related to the ipsilesional M1 is significantly correlated with the motor recovery.22,23 Interestingly, EEG synchrony related to the contralesional M1 only shows a trend toward a correlation with recovery, 22 although neurophysiological studies have demonstrated correlations between contralesional M1 activity and poststroke outcome.26-28 Thus, the role of interhemispheric EEG synchrony of the M1 in motor impairment as well as the contralesional M1 in recovery have not been fully elucidated. Furthermore, correlation analyses have been performed by assessing the coherence computed from signals with high-density electrodes (128- or 256-channel) in previous studies. However, EEG recordings with the widespread international 10-20 system are more clinically feasible. Our recent study found that the large-scale interhemispheric phase synchrony index (PSI) 29 from a 19-channel EEG was associated with the scores of Functional Independence Measure (FIM), which evaluates the activities of daily living, 26 and National Institutes of Health Stroke Scale (NIHSS), which assesses general neurological deficits, 30 in poststroke patients. 17 Theoretically, the PSI is free from amplitude changes and can be used to evaluate phase synchrony robustly.31-33
This observational study examined whether a novel method that combines the PSI with a 19-channel EEG could be used to assess patients with hemiparesis. We investigated the associations between the various interhemispheric/intrahemispheric PSIs and motor impairment (upper extremity Fugl-Meyer Assessment score at the time of admission [FM-UE1]) cross-sectionally, as well as motor recovery (impairment reduction after rehabilitation [FM-UEgain]) longitudinally.
Methods
The authors declare that all supporting data are available with the article and its online supplement.
Participants
The experimental protocols were approved by the Institutional Review Boards of Morinomiya Hospital (Approval No. 094) and RIKEN (Approval No. Wako3 25-3 [6]). All participants or their surrogates signed written informed consent forms.
Patients were recruited from a group of inpatients admitted to the Kaifukuki (convalescent) rehabilitation 34 ward at Morinomiya Hospital. The inclusion criteria were as follows: (1) age ≥18 years; (2) first-episode stroke determined by medical history and MRI to be unilateral, cortical ischemic stroke; (3) presence of hemiparesis at the time of admission; and (4) interval of >2 weeks since the onset of stroke. The exclusion criteria were as follows: (1) dependence prior to stroke, as indicated by a modified Rankin Scale ≥2; (2) medical history of epilepsy, psychiatric disorders, or other neurological disorders; (3) presence of stroke lesions in the brainstem or cerebellum; and (4) skull defects. Age- and sex-matched volunteers with no history of psychiatric or neurological disorders were also recruited and included in a control group. Finally, 40 patients and 22 control participants were enrolled in the study.
Treatment and Clinical Assessments
All patients received standard physical and occupational therapy daily for 60 minutes each during the inpatient period in the same manner as other inpatients in our hospital.35,36 The motor impairment was measured using the upper extremity Fugl-Meyer Assessment score (FM-UE; range: 0-66). 37 FM-UEgain was calculated by subtracting FM-UE1 from FM-UE before discharge (FM-UE2).3,38 NIHSS score 30 (range: 0-42) and FIM score 39 (range: 18-126) were also assessed. In our previous reports, these scores showed correlations with the large-scale interhemispheric PSI. 17 All clinical assessments were performed by trained investigators who were blinded to the patients’ PSIs.
EEG Recordings
Scalp EEG was recorded at the time of admission using a NeuroFax EEG 1224 system (Nihon Kohden Co). Data were collected from 19 Ag/AgCl electrodes (international 10-20 system) with online bandpass filtering between 0.53 and 120 Hz (sampling rate: 500 Hz). The ground electrode was placed at the center of the forehead, and participants remained in the supine position during recording. Five minutes of resting-state measurement was added to the routine EEG. Participants were asked to relax in a resting-state and alternately to open and close their eyes for 30 seconds, for a total of 10 times. Data collected during the eyes-closed condition (approximately 2.5 minutes) were used for computation.
EEG Data Processing and Phase Synchrony Analysis
EEG voltages were referenced against the average of the right and left earlobe signals. After offline bandpass filtering (0.3-50 Hz), each data point from the total recording interval was marked for the later rejection procedure if the EEG voltage exceeded ±200 µV (fixed epoch window was not used). Then, the complex Morlet wavelet transform was applied to the signals to compute the instantaneous phase. Next, instantaneous phase data points were rejected if the cutoff interval of the wavelet overlapped the rejection markers. In the instantaneous phase computation process, nco was set to 4, indicating that the cutoff interval length of the Gaussian window contains “nco” cycles. 31 The cutoff interval was set to 6 sigma of the Gaussian window, with the central frequencies ranging from 1 to 45 Hz (1 Hz step). Instantaneous PSI values were computed at each frequency for all possible electrode pairs and were defined by the following equation:
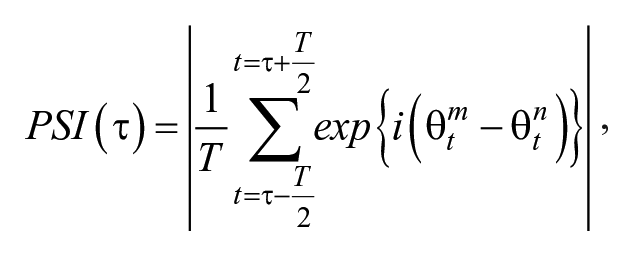
where i denotes the imaginary unit, and θ t m and θ t n represent, respectively, the instantaneous phases of the mth and nth channels at the time point, t. T, which is the number of samples, corresponds to the interval length 8 times as long as the cycle of the center frequency of the complex Morlet wavelet. PSI was computed with a 2-ms sliding window and averaged over the remaining intervals. The instantaneous PSI (τ) can be considered the consistency of phase differences between 2 EEG signals from electrodes in a given time interval around the time point. PSI ranges from 0 (no synchrony) to 1 (perfect synchrony). The instantaneous PSI was averaged over 5 eyes-closed recording periods to obtain a stable estimation. Then, the PSIs were averaged within 6 frequency bands: δ (1-3 Hz), θ (4-7 Hz), α (8-13 Hz), β1 (14-19 Hz), β2 (20-30 Hz), and γ (31-45 Hz). The average power of each electrode was also computed as follows:
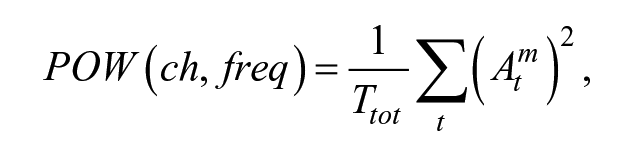
where Atm represents instantaneous amplitudes of the mth channel at the time-point t and Ttot indicates the total number of time samples.
The C3C4-PSI was defined as the PSI between the C3 and C4 electrodes (Figure 1A). Similarly, the P3P4-PSI was the PSI between P3 and P4 electrodes. Motor-parietal PSI (CP-PSI) was the C3P3-PSI or the C4P4-PSI. The C3C4-Pow was calculated by subtracting power of ipsilesional C3/4 from contralesional C3/4 electrodes. The PSIs between the C3/C4 electrodes and the remaining 7 electrodes in the same hemisphere (left: C3Fp1, C3F3, C3F7, C3T3, C3T5, C3P3, and C3O1; right: C4Fp2, C4F4, C4F8, C4T4, C4T6, C4P4, and C4O2; Figure 1B) were averaged and designated as the intrahemispheric PSIs centered on C3/C4 (IntrahC-PSIs) to evaluate the intrahemispheric PSI centered on the M1. In patients with the right hemispheric lesions, the left IntrahC-PSI was adopted as the contralesional IntrahC-PSI and vice versa. In the control group, the IntrahC-PSI was computed by averaging the right and left IntrahC-PSIs. The large-scale interhemispheric PSI were calculated as the spatial average of local PSIs across all interhemispheric electrode pairs. 17 The PSIs were computed using the program developed with MATLAB (MathWorks Inc).
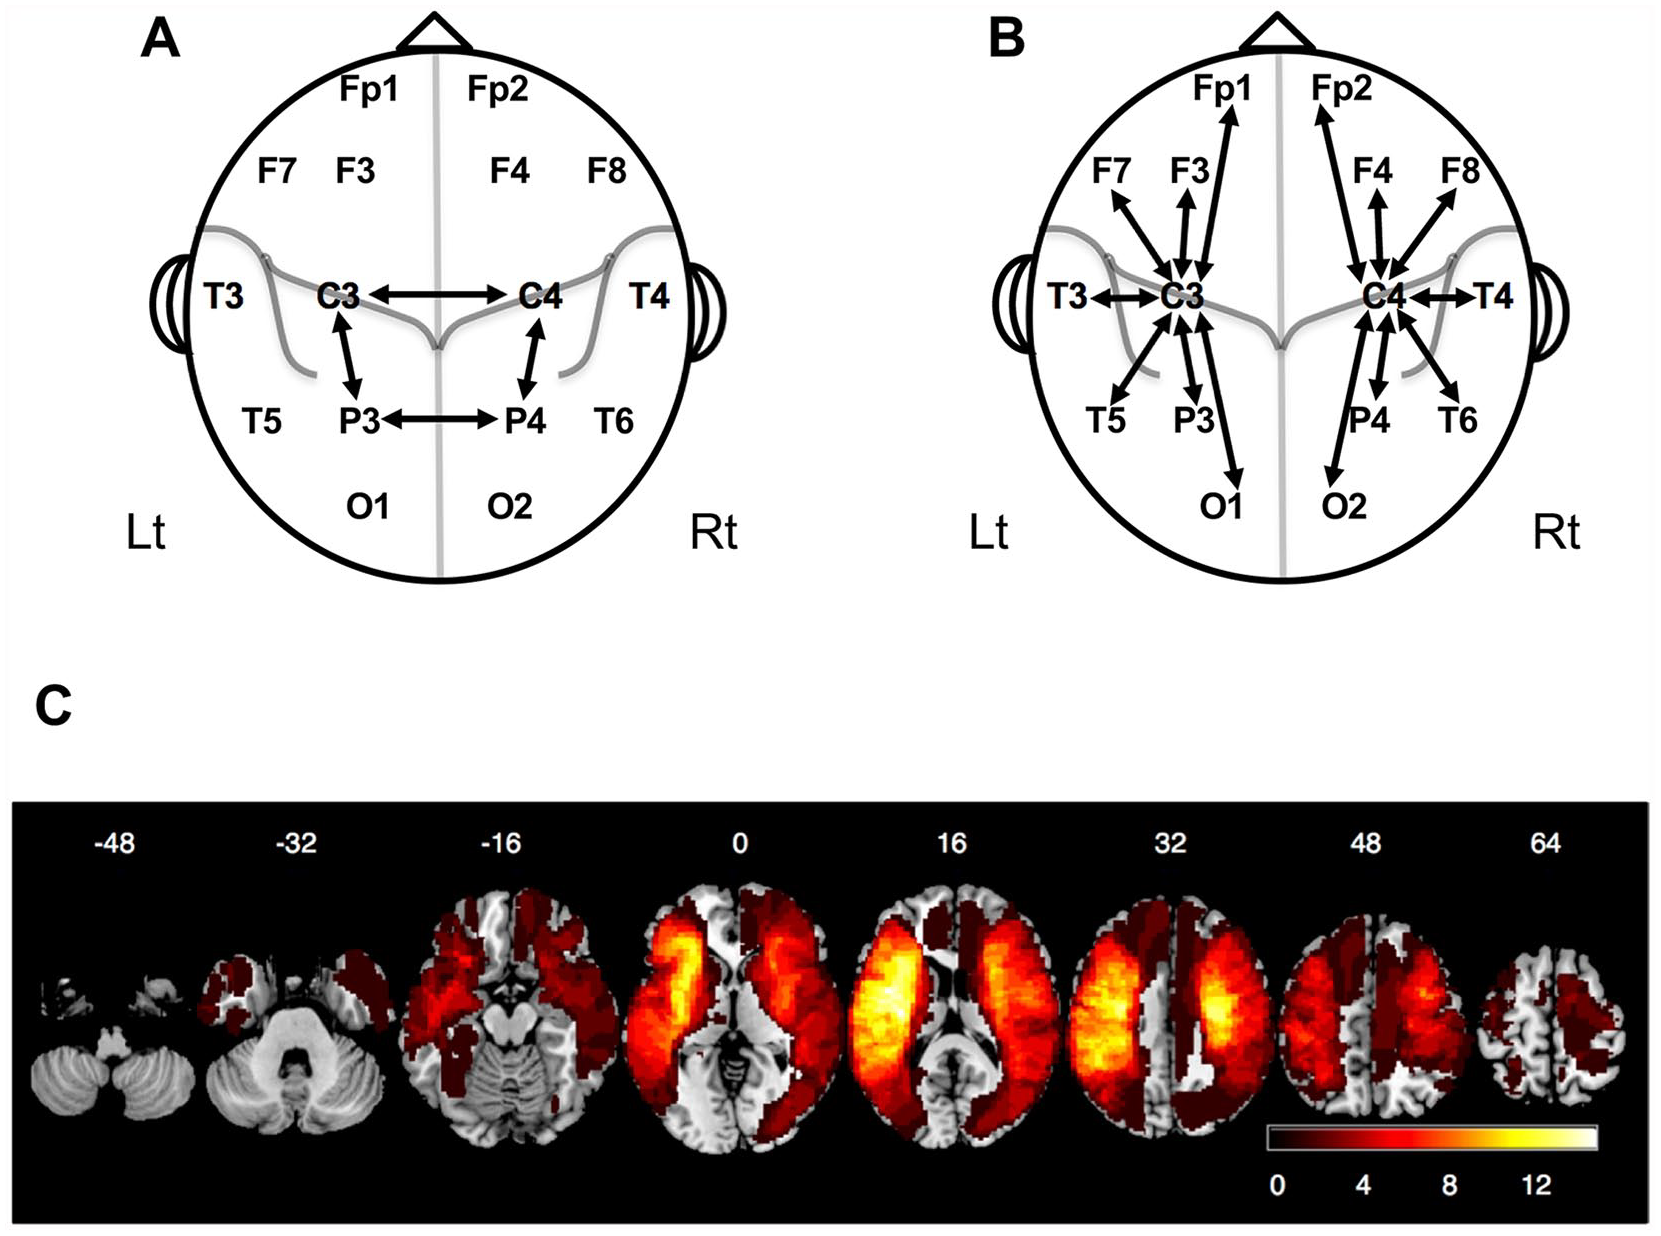
Electrode pairs for the calculation of the PSIs and a map of the distribution of stroke lesions. (A) Electrode pairs used for the calculation of the C3C4-PSI, P3P4-PSI and ipsilesional/contralesional motor-parietal PSI in the cross-sectional study. (B) Electrode pairs used for the calculation of the intrahemispheric PSI in the longitudinal study. (C) A map of the distribution of stroke lesions in 40 patients enrolled in this study. The colors represent the number of patients with lesions.
MRI Acquisition and Lesion Analysis
T2-weighted images (turbo spin-echo: repetition time = 4400 ms, echo time = 100 ms, flip angle = 90°, slice thickness/gap = 5.0/1.0 mm, reconstructed voxel size = 0.45 × 0.45 × 5.00 mm3) and 3-dimensional T1-weighted images (turbo field-echo: repetition time = 9.6 ms, echo time = 4.6 ms, flip angle = 10°, reconstructed voxel size = 0.94 × 0.94 × 1.00 mm3) were obtained from all patients with a 1.5 T scanner (Achieva, Philips Medical Systems). Stroke lesion volume (LV) was manually drawn on the T2-weighted images, and these images were spatially normalized to the Montreal Neurological Institute stereotaxic space using the Clinical Toolbox 40 in SPM8 (Wellcome Trust Center for Neuroimaging). 41 The CST injury was indexed by lesion overlap. 2 Similar to a previous study, 7 the CST-LV was quantified by calculating the overlap in the stereotaxic space between the probabilistic CST template thresholds at 5% in the JHU White-Matter Tractography Atlas in the FMRIB Software Library, 42 and each patient’s stroke lesion.
Statistical Analysis
The Shapiro-Wilk test was used to test the normality of variables. The Wilcoxon signed-rank test and Mann-Whitney U test were used to compare nonparametric variables. The Spearman’s rank correlation coefficient, ρ), was used for all correlation analyses. Bonferroni correction (level = 6) was applied for the analysis of 6 frequency bands. Results of correlation analyses were validated using the jackknife resampling 43 ; data from each patient were iteratively removed, and correlation coefficients of remaining n − 1 patients were computed to estimate the bias of statistical values. 44 A nonparametric Spearman’s rank order partial correlation analysis 45 was performed to test the significance of the correlation after adjusting for the effects of confounding factors (control variables). In the multivariate regression analysis, FM-UE1 and CST-LV were converted into rank values because they deviated from the normal distribution. Regression models were compared using adjusted R 2 and Akaike information criterion (AIC). In the threshold analysis, the contralesional IntrahC-PSI cutoff value to classify patients whose recovery exceeded a clinically important difference 46 (FM-UEgain ≥5) was evaluated. A receiver operating characteristic curve was generated, and the sensitivity, specificity, positive predictive value, and negative predictive value were calculated.
Statistical significance was defined as P < .05 (2-tailed). Jackknife resampling was performed using MATLAB, and all other statistical analyses were performed using the IBM SPSS software (IBM Corp).
Results
Characteristics of Participants
Table 1 shows the demographic and clinical characteristics of the participants. Detailed data are shown in the Supplemental Materials (Tables I to IX and Figure 1). Average occupational therapy time between serial FM measurements was 88.4 ± 40.0 hours. The mean interval between EEG recording and FM-UE1 measurement was 4.3 ± 4.2 days. FM-UE2 was significantly higher than FM-UE1 (W = 561, P < .001). No significant correlation was found between rehabilitation duration and FM-UEgain (ρ = 0.25, P = .12). Most patients (88%) had lesions in the territory of the middle cerebral artery (Figure 1C). Data from 5 patients (identification numbers: 1, 2, 4, 5, 6) overlapped with our previous report. 17
Demographical and Clinical Characteristics of Participants a .
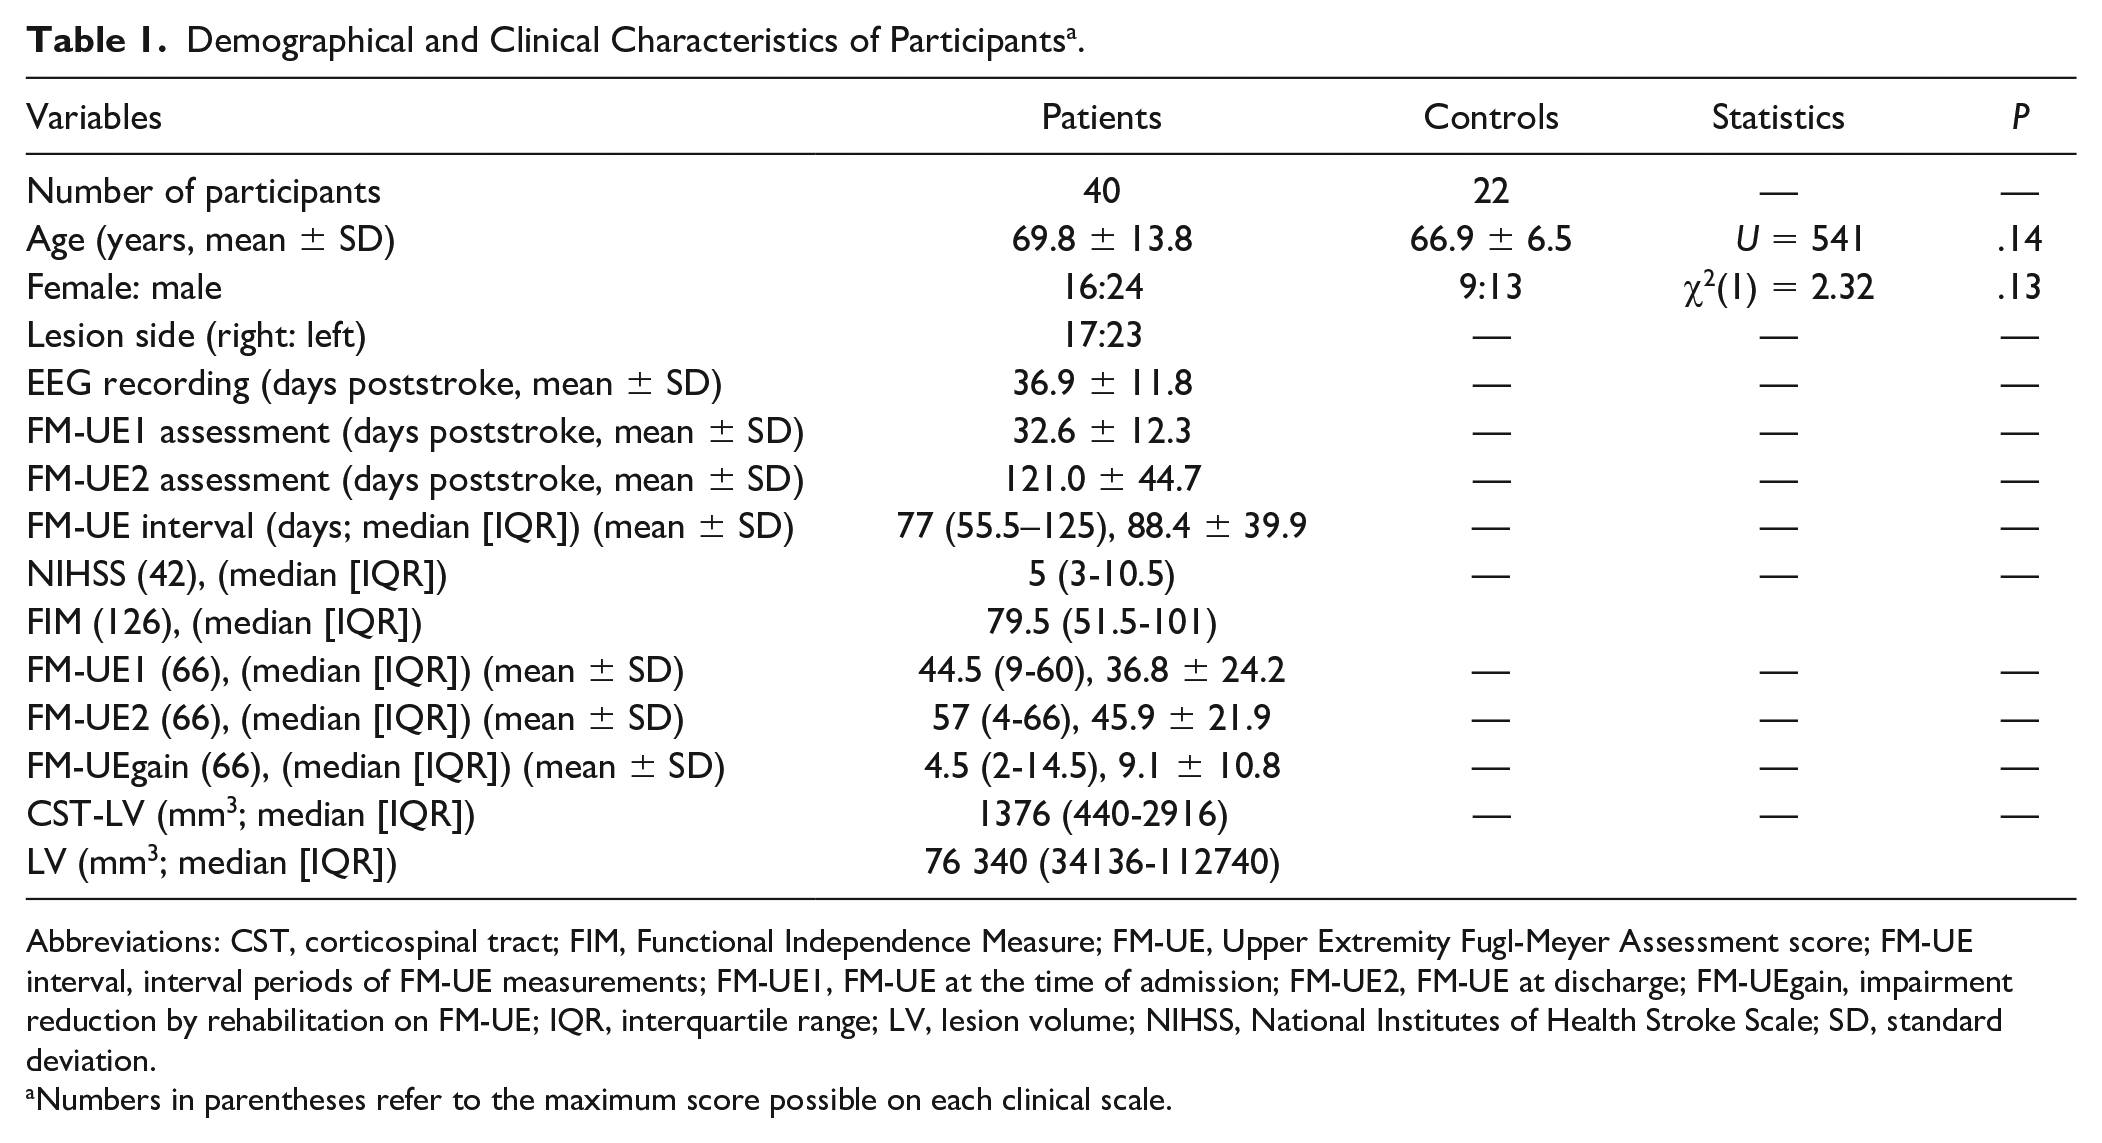
Abbreviations: CST, corticospinal tract; FIM, Functional Independence Measure; FM-UE, Upper Extremity Fugl-Meyer Assessment score; FM-UE interval, interval periods of FM-UE measurements; FM-UE1, FM-UE at the time of admission; FM-UE2, FM-UE at discharge; FM-UEgain, impairment reduction by rehabilitation on FM-UE; IQR, interquartile range; LV, lesion volume; NIHSS, National Institutes of Health Stroke Scale; SD, standard deviation.
Numbers in parentheses refer to the maximum score possible on each clinical scale.
Association Between Upper Extremity Fugl-Meyer Assessment Scores at the Time of Admission and the C3C4-PSI
First, we evaluated whether there was an association between C3C4-PSI and FM-UE1. The C3C4-PSI values of patients were significantly lower than those of controls in the α and β1 bands (α: U = 196, P = .002; β1: U = 230, P = .012 [Bonferroni-corrected]; Figure 2A; Supplemental Table X).
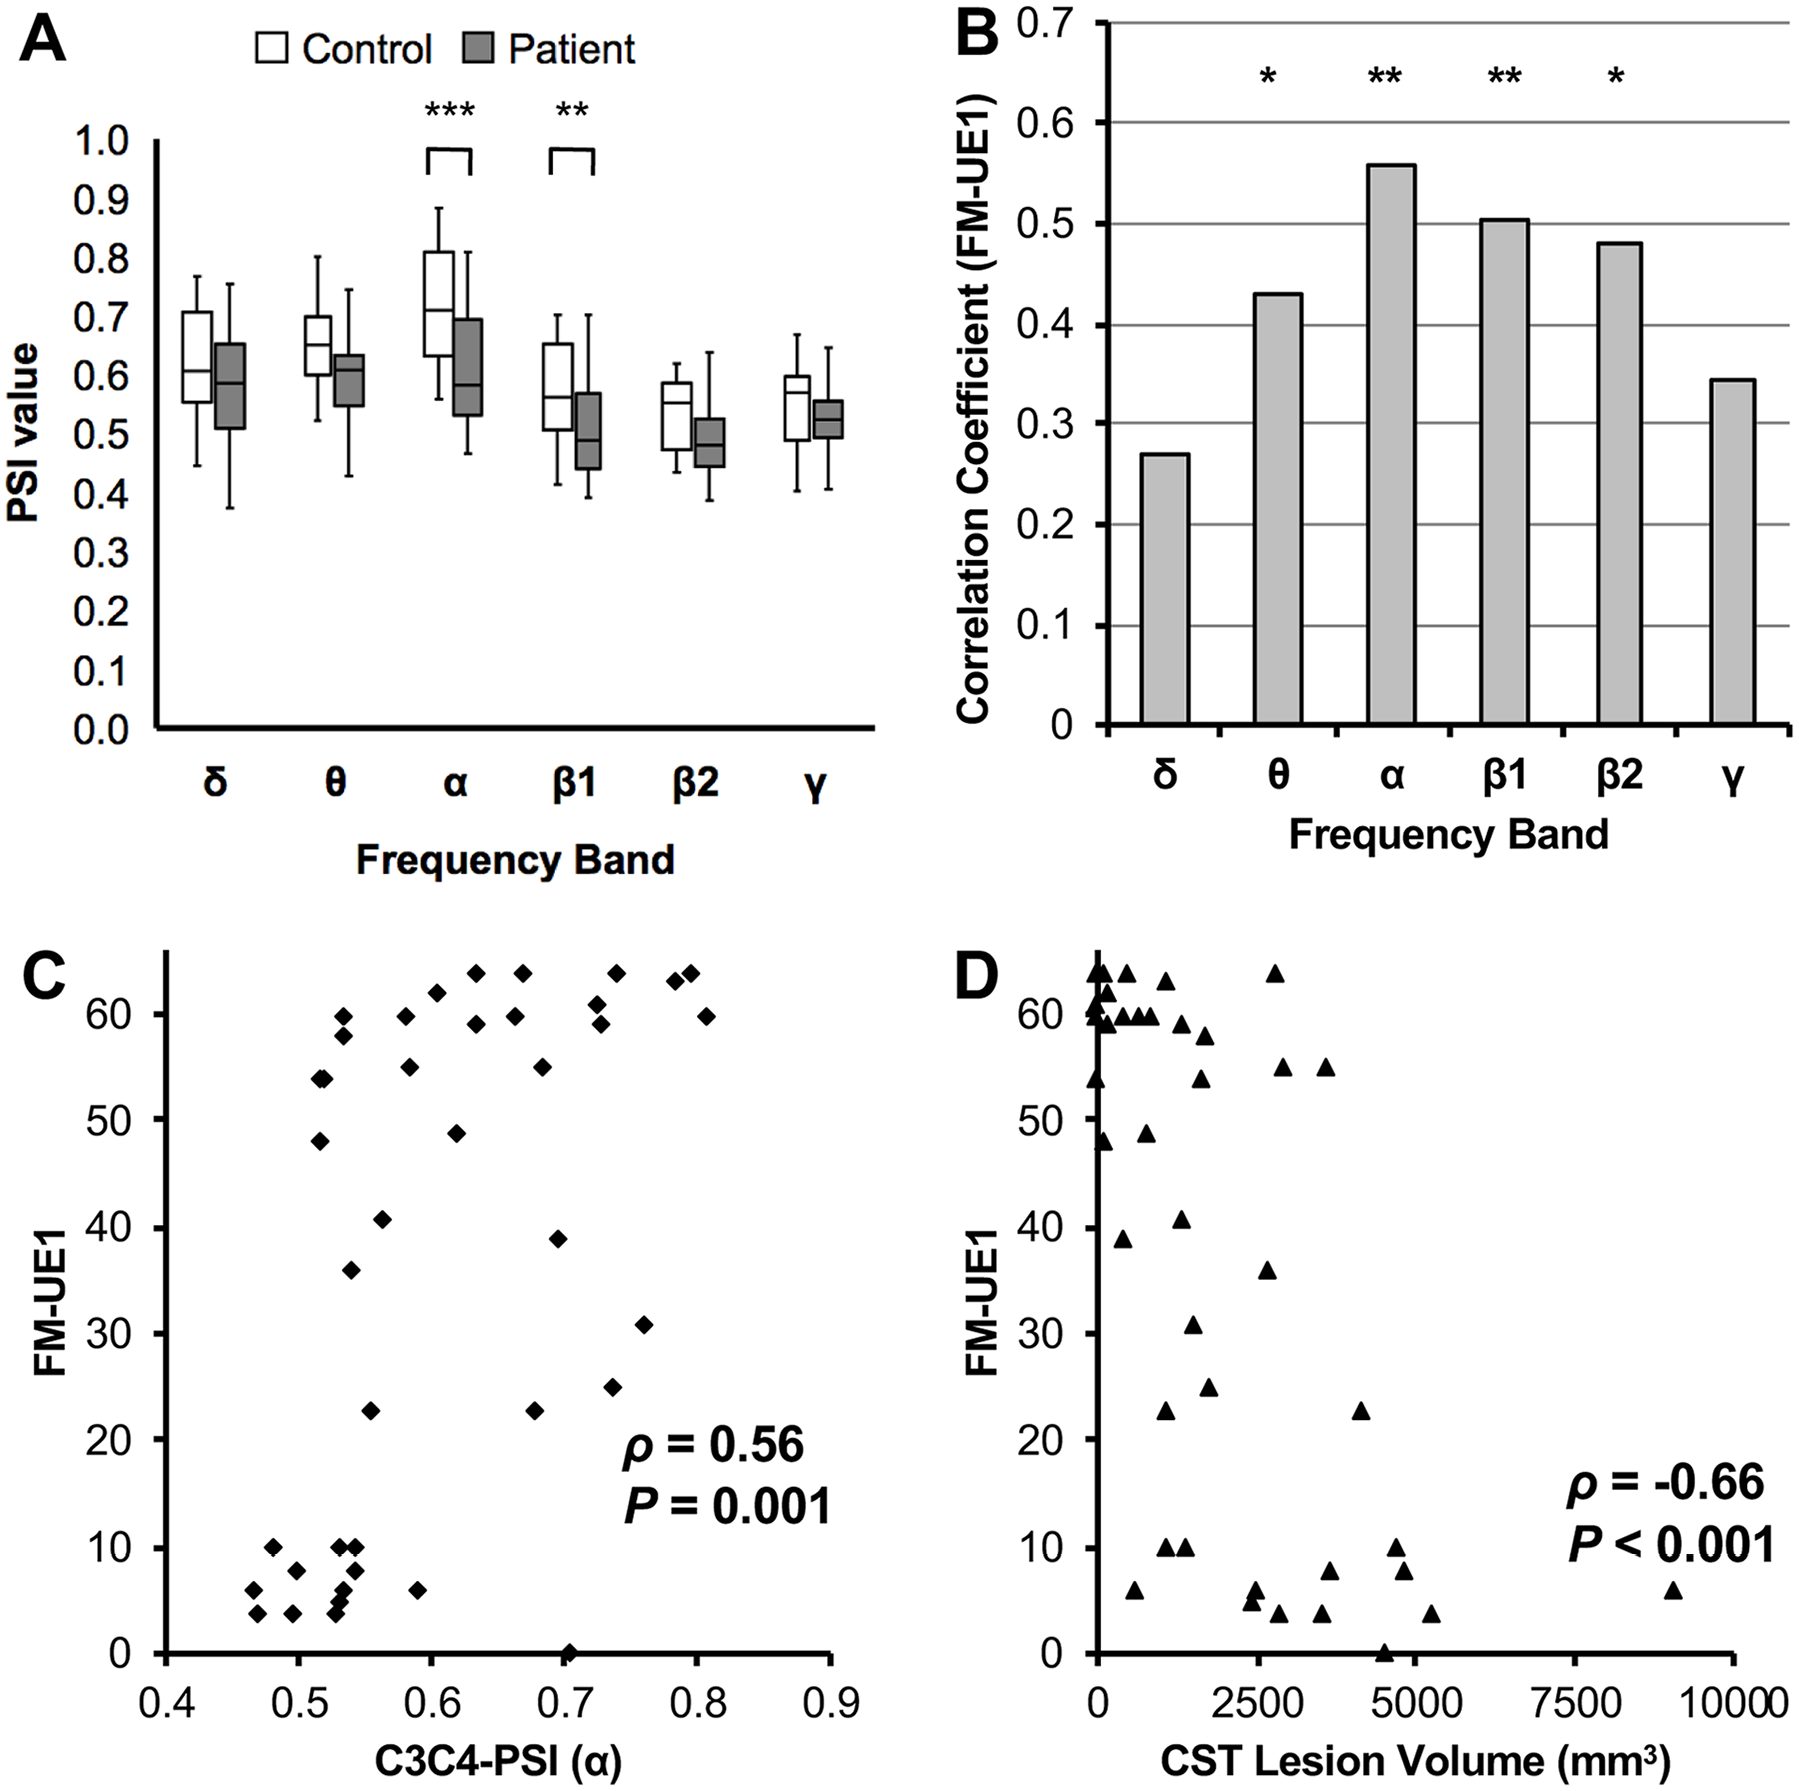
Association between FM-UE1 and the C3C4-PSI. (A) A box-and-whisker plot of the C3C4-PSI values of stroke patients and controls (Mann-Whitney U test; **P < .01, ***P < .001). (B) A bar graph of the correlation coefficients for the C3C4-PSI and FM-UE1 (Spearman; *P < .05, **P < .01). (C) Scatter plot of FM-UE1 versus the C3C4-PSI. (D) Scatter plot of FM-UE1 versus the CST lesion volume.
The C3C4-PSI was significantly positively correlated with FM-UE1 in the θ, α, β1, and β2 bands (θ: ρ = 0.43, P = .035; α: ρ = 0.56, P = .001; β1: ρ = 0.50, P = .005; β2: ρ = 0.48, P = .010 [Bonferroni-corrected]; Figure 2B). The largest correlation coefficient was observed in the α band, in which the C3C4-PSI values of patients were significantly lower than those of controls. Results of jackknife resampling supported this significant correlation (ρ = 0.56, bias = −0.011, standard error = 0.0032). The scatter plot (Figure 2C) shows the positive correlation between FM-UE1 and the C3C4-PSI (α). Detailed results are shown in the Supplemental Table XI.
Second, we performed additional analyses for further evaluation of the C3C4-PSI. No significant correlations were found between the C3C4-PSI and FM-UEgain/NIHSS score. The CST-LV was significantly negatively correlated with FM-UE1 (ρ = −0.66, P < .001; Figure 2D). In the partial correlation analysis, the C3C4-PSI was significantly correlated with FM-UE1 (ρ = 0.52, P = .012 [Bonferroni-corrected]; control variables: FM-UEgain, age, time poststroke, NIHSS score, CST-LV, and LV). However, the C3C4-PSI was not correlated with CST-LV (ρ = 0.26, P = .87 [Bonferroni-corrected]; control variables: FM-UEgain, FM-UE1, age, time poststroke, NIHSS score, and LV). Multivariate regression analysis revealed that the combination of CST-LV and the C3C4-PSI predicted the FM-UE1 better than either alone: the adjusted R2 increased from 0.29/0.42 (C3C4-PSI/CST-LV) to 0.56 (Supplemental Table XII) and the AIC decreased from 246.18/176.75 (C3C4-PSI/CST-LV) to 166.52.
Third, we also evaluated the EEG amplitude between M1s. The C3C4-Pow was significantly negatively correlated with FM-UE1 in the α, β1, and β2 bands (α: ρ = −0.53, P = .002; β1: ρ = −0.60, P < .001; β2: ρ = −0.59, P < .001 [Bonferroni-corrected]; Supplemental Figure 2). However, the C3C4-Pow was confounded with the CST-LV and NIHSS score. After partial correlation analysis, the C3C4-Pow was not significantly correlated with FM-UE1 (control variables: FM-UEgain, age, time post-stroke, NIHSS score, CST-LV, and LV).
Finally, we evaluated associations between other PSIs and FM-UE1. Concerning the PSIs related to the parietal lobes, ipsilesional/contralesional motor-parietal PSIs (CP-PSIs) were not correlated with FM-UE1. However, the parietal-parietal PSI (P3P4-PSI) was significantly correlated with FM-UE1 in the α band (ρ = .44, P = .028 [Bonferroni-corrected]; Supplemental Figure 3). In the partial correlation analysis, the P3P4-PSI was significantly correlated with FM-UE1 (ρ = 0.48, P = .024 [Bonferroni-corrected]; control variables: FM-UEgain, age, time poststroke, NIHSS score, CST-LV, and LV). Concerning the large-scale PSI, the large-scale interhemispheric PSI was not correlated with FM-UE1 after partial correlation analysis (ρ = 0.32, P = .26 [Bonferroni-corrected]; control variable: FIM score).
Association Between Impairment Reduction After Rehabilitation and the Intrahemispheric PSI Centered on the M1
First, we evaluated whether there was an association between the contralesional IntrahC-PSI and FM-UEgain. The contralesional IntrahC-PSI values of patients were significantly higher than those of the controls in the δ and θ bands (δ: U = 123, P < .001; θ: U = 173, P < .001 [Bonferroni-corrected]; Figure 3A; Supplemental Table X).
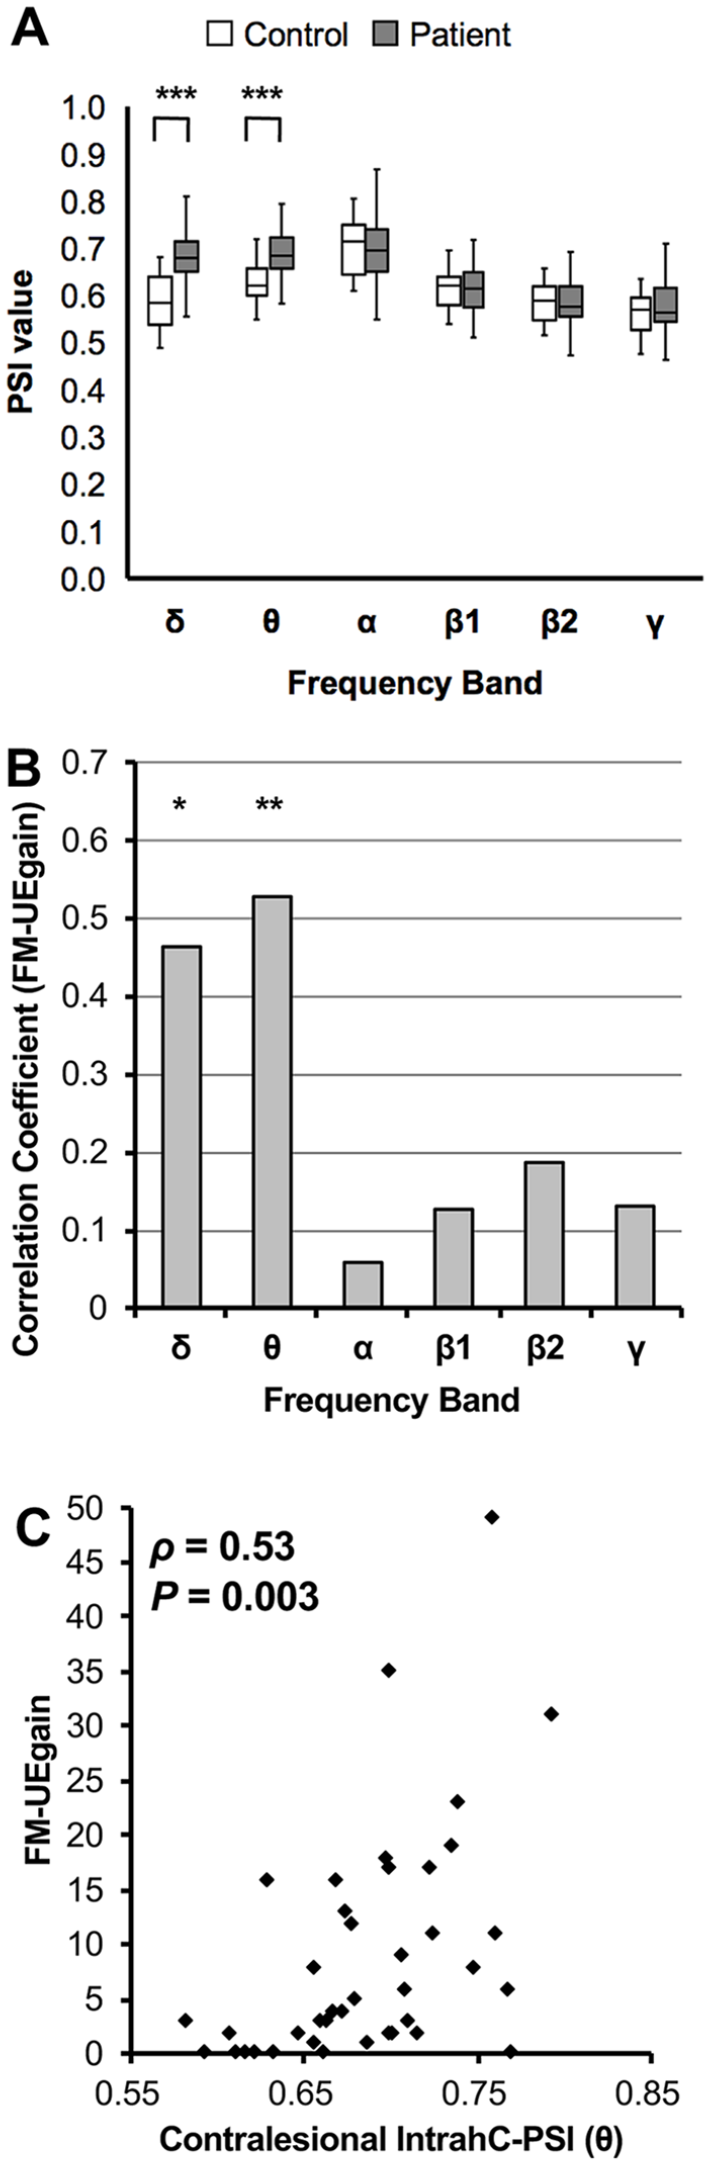
Association between FM-UEgain and the contralesional IntrahC-PSI. (A) A box-and-whisker plot of the contralesional IntrahC-PSI values of stroke patients and controls (Mann-Whitney U test; ***P < .001). (B) A bar graph of the correlation coefficients between the contralesional IntrahC-PSI and FM-UEgain (Spearman; *P < .05, **P < .01). (C) Scatter plot of FM-UEgain versus contralesional IntrahC-PSI.
The contralesional IntrahC-PSI was significantly positively correlated with FM-UEgain in the δ and θ bands (δ: ρ = 0.47, P = .015; θ: ρ = 0.53, P = .003 [Bonferroni-corrected]; Figure 3B). The largest correlation coefficient was observed in the θ band, in which the PSI values of patients were significantly higher than those of controls. Results of jackknife resampling supported this significant correlation (ρ = 0.53, bias = −0.0098, standard error = 0.0036). The scatter plot (Figure 3C) shows the positive correlation between FM-UEgain and the contralesional IntrahC-PSI (θ). In this plot, 3 patients with high FM-UEgain (score: 49, 35, and 31) might have led to false correlations. However, the overall correlation remained significant even after removal of these patients (δ: ρ = 0.47, P = .018; θ: ρ = 0.48, P = .017 [Bonferroni-corrected]). Detailed results are shown in Supplemental Table XIII.
Second, we performed additional analyses for further evaluation of the contralesional IntrahC-PSI. No significant correlations were observed between the contralesional IntrahC-PSIs and the FM-UE1/NIHSS scores. In the partial correlation analysis, the contralesional IntrahC-PSI was significantly correlated with FM-UEgain (ρ = 0.51, P = .012 [Bonferroni-corrected]; control variables: FM-UE1, age, rehabilitation duration, NIHSS score, CST-LV, and LV).
Third, we evaluated the potential of the contralesional IntrahC-PSI to act as a marker of motor recovery. The threshold analysis to classify patients whose recovery exceeded a clinically important difference revealed that the cutoff value (contralesional IntrahC-PSI [θ] ≥ 0.667) had a sensitivity of 90%, specificity of 65%, positive predictive value of 72%, negative predictive value of 87%, and area under curve of 0.81 (Supplemental Figure 4).
Fourth, we also evaluated the PSI of the ipsilesional hemisphere. The values of the ipsilesional IntrahC-PSI were not significantly different between the patients and controls (Figure 4A). Although a trend was observed in the α band (ρ = −0.35, P = .16 [Bonferroni-corrected]; Figure 4B), the ipsilesional IntrahC-PSI was not correlated with FM-UEgain. Figure 4C shows the selectivity of the correlations between the interhemispheric/intrahemispheric PSIs and FM-UE1/FM-UEgain/NIHSS score. Supplemental Figure 5 also shows results by color coding on the brain overlay.
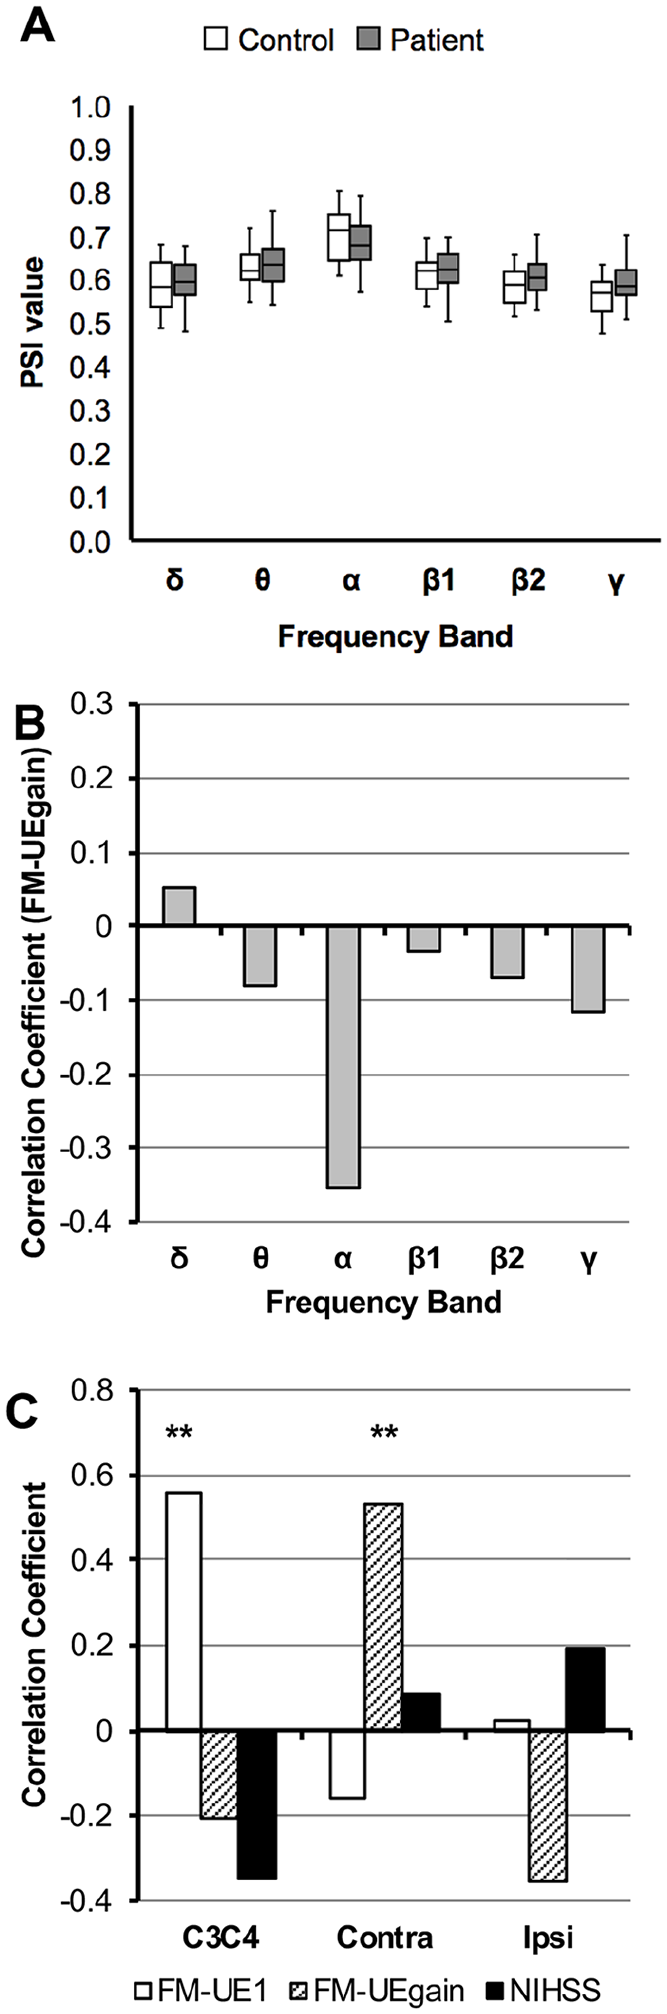
Association between FM-UEgain and the ipsilesional IntrahC-PSI, and summary of correlation analyses. (A) A box-and-whisker plot of the ipsilesional IntrahC-PSI values of stroke patients and controls (Mann-Whitney U test). (B) A bar graph of the correlation coefficients between the ipsilesional IntrahC-PSI and FM-UEgain. (C) A bar graph of the correlation coefficients between the C3C4-PSI (α), contralesional IntrahC-PSI (θ), or the ipsilesional IntrahC-PSI (α) and the clinical scales (FM-UE1, FM-UEgain, and NIHSS score) (Spearman; **P < .01).
Finally, we performed subgroup analyses focused on the severely impaired patients (FM-UE1 ≤ 10; the cutoff level was determined according to a previous study 7 ). Figure 5A shows the scatter plot of FM-UEgain versus the maximum possible recovery scores (66-FM-UE1) in terms of the proportional recovery rule.3,5,47 In this rule, recovery can be predicted by initial motor scores (fitters). However, some patients did not have the predicted recovery (nonfitters). In 27 (67%) patients with FM-UE1 >10, FM-UEgain was significantly correlated with the maximum possible recovery scores (ρ = 0.87, P < .001; fitters). However, in the remaining 13 (33%) patients with FM-UE1 ≤ 10, FM-UEgain was not correlated with the maximum possible recovery score (ρ = −0.16, P = .60; nonfitters) or the CST-LV (ρ = −0.24, P = .43; Figure 5B). However, FM-UEgain was significantly correlated with the contralesional IntrahC-PSI (θ; ρ = 0.62, P = .024; Figure 5C). Moreover, in fitters, FM-UEgain was significantly correlated with contralesional IntrahC-PSI (θ; ρ = 0.44, P = .021) but not with C3C4/P3P4/large-scale interhemispheric/ipsi-IntrahC-PSIs (θ; Supplemental Table XIV).
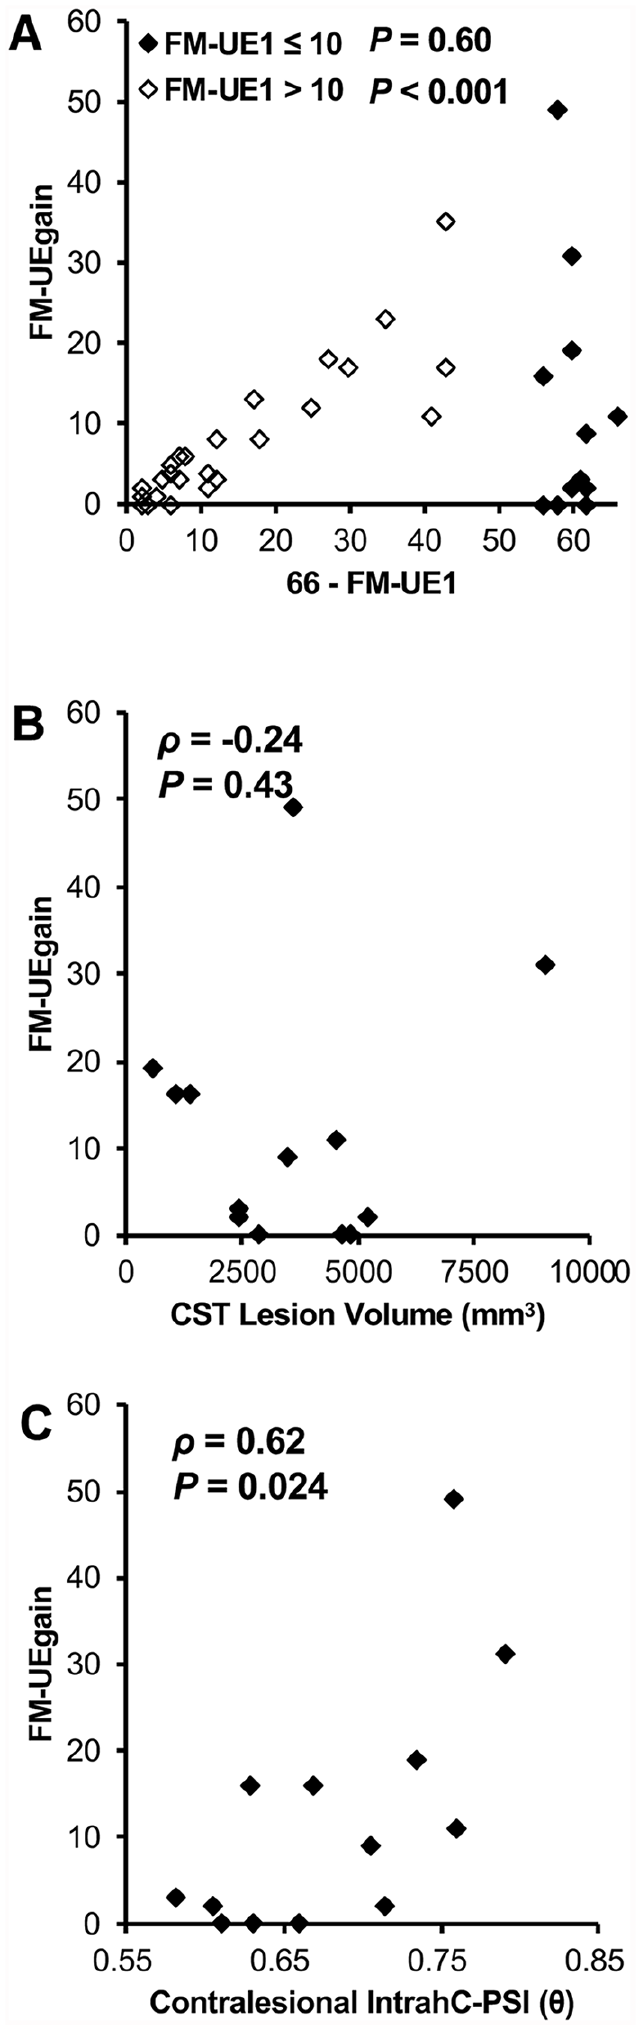
Results of subgroup analyses focused on patients with severe impairment at the time of admission. (A) A scatter plot of FM-UEgain versus the maximum possible recovery (66-FM-UE1). Patients with mild to moderate impairment (FM-UE1 > 10; n = 27) are indicated with open diamond symbols. Patients with severe impairment at the time of admission (FM-UE1 ≤ 10; n = 13) are indicated with filled diamond symbols. (B) Scatter plot of FM-UEgain versus the CST lesion volume in patients with FM-UE1 ≤ 10. (C) Scatter plot of FM-UEgain versus the contralesional IntrahC-PSI (θ) in patients with FM-UE1 ≤ 10.
Discussion
In the current study, we showed that the C3C4-PSI (α) was correlated with motor impairment about 1 month after stroke onset. In addition, the contralesional IntrahC-PSI (θ) was indicative of the potential for motor recovery. Notably, the 19-channel EEG recording condition was clinically feasible and resting-state EEG could be performed in severely impaired patients who had difficulty in moving upper extremity.
Relationship Between Motor Impairment and Interhemispheric PSI Values of the Primary Motor Areas
We previously found that the large-scale interhemispheric PSI was correlated with the FIM score, which assesses activities of daily living, 17 but not with the Fugl-Meyer Assessment score, which assesses motor impairment (result was reproduced in this cohort). In this study, we showed that the interhemispheric PSI of the M1 (C3C4-PSI) in the α band was selectively correlated with FM-UE1 (motor impairment) but not with NIHSS scores (general neurological deficit). Notably, CST-LV was strongly correlated with FM-UE1 (Figure 2D). In fact, the C3C4-Pow was also correlated with FM-UE1 but the correlation was not significant after partial correlation analysis, showing the effect of CST-LV on C3C4-Pow. In contrast, the C3C4-PSI was significantly correlated with FM-UE1 after partial correlation analysis. Although motor impairment was better predicted by stroke lesion than FC, 25 the combination of the C3C4-PSI and CST-LV improved the prediction of FM-UE1.
As noted in the Introduction, the association between the interhemispheric FC of the M1 and motor score is demonstrated in fMRI studies.9,24,25 Because EEG synchrony also represents FC,10,11 our results may be based on a common biological model: decreased interhemispheric homotopic FC associates with behavioral impairment. 25 Interestingly, the P3P4-PSI was also correlated with FM-UE1. Thus, the interparietal PSI may reflect somato-motor network FC. 25 Compared with fMRI, EEG can offer multiple synchrony results for different frequency bands. In the current study, we showed that the PSI values of patients with stroke (1) were significantly lower than those of controls (α and β1) and (2) significantly correlated with FM-UE1 (Figure 2A and B). Decreased PSI values were observed only in particular frequency bands, suggesting that these correlations do not occur solely due to brain damage. In addition, we previously revealed that the spurious synchrony caused by volume conduction would increase the PSI value and hinder the detection of correlations.17,18 Furthermore, a previous study found a correlation between interhemispheric EEG synchrony of the M1 and motor scores in patients with subacute stroke; the imaginary component of coherency (α) that eliminated the effect of volume conduction was used. 21 They also showed decreased EEG synchrony did not result from brain damage but from network disruption. In fact, some parts of the stroke lesions did not show a decrease in EEG synchrony. Furthermore, changes in EEG synchrony were also observed even in distant brain areas. 21 The α rhythm is the main component of resting-state EEG and may be implicated in the maintenance of information flow.48,49 Thus, stroke-induced disruption of α band synchrony may be associated with neurological deficit. 20
In contrast, no correlation has been observed between the interhemispheric coherence (β) of the M1 and the FM-UE in chronic stroke. 23 In our previous study, the C3C4-PSI (α) was not significantly correlated with the Fugl-Meyer Assessment score in a mixed population (subacute and chronic stroke). 17 These results suggest that the time after stroke may be important. Longitudinal MRI studies have demonstrated that asymmetry of FC 50 /structural plasticity 51 of the M1 reach a peak at 1 month after stroke. In the current study, EEG was performed at 36.9 ± 12.3 days poststroke, which was around the time when the adaptive reorganization reached its peak. Taken together, our results suggest that interhemispheric synchrony of the M1 reflects motor impairment in subacute stroke.
Relationship Between Motor Recovery and the Contralesional Intrahemispheric PSI Centered on the Primary Motor Area
Previous studies have demonstrated associations between EEG synchrony centered on the ipsilesional M1 and motor recovery.22,23 Neurophysiological importance of the contralesional M1 has been suggested by the other studies,26-28 but EEG synchrony centered on the contralesional M1 is associated with a smaller degree of motor recovery than the ipsilesional M1. 18 This previous EEG study assessed the synchrony between the contralesional M1 and the rest of the brain (ie, both interhemispheric and intrahemispheric synchrony). However, a study with fMRI demonstrated that interhemispheric FC and intrahemispheric FC play different roles. 25 In addition, ipsilesional intrahemispheric coherence was found to correlate with recovery. 23 Therefore, we focused on contralesional intrahemispheric synchrony. The contralesional IntrahC-PSI (θ) was selectively correlated with FM-UEgain but not with NIHSS score. Thus, it is not plausible that contralesional IntrahC-PSI merely reflects attention or alertness. Furthermore, the contralesional IntrahC-PSI was significantly correlated with FM-UEgain after adjusting for possible confounding factors. Results of threshold analysis showed that the contralesional IntrahC-PSI could predict motor recovery with high sensitivity and moderate specificity.
Notably, results of the ipsilesional IntrahC-PSI were inconsistent with previous studies in which EEG synchrony of the ipsilesional M1 showed correlations with clinical scale scores.22,23 The ipsilesional IntrahC-PSI values in patients were not lower than those in the controls (Figure 4A), suggesting inflation of the PSI value by noise: spurious synchrony due to volume conduction effects. In our previous report, the ipsilesional large-scale PSI was not correlated with FIM score. 18 These results suggest that the noise could not be negligible, especially when all electrodes of interest were located within the ipsilesional hemisphere.
Until recently, activation of the contralesional hemisphere had been thought to hinder recovery through interhemispheric inhibition. 52 However, this interaction could vary depending on the time after stroke, lesion location, and measurement conditions.26,53,54 In fact, a supportive role of the contralesional hemisphere has been suggested, at least in the subacute stage.27,55 In the current study, the contralesional IntrahC-PSIs (δ and θ) were significantly higher in patients than in controls. This frequency-selective elevation is a novel finding. It has been found that contralesional θ band synchrony is associated with language recovery, 22 and θ band synchrony may reflect activation of the glutamate receptor, which promotes plasticity. 56 Furthermore, in a longitudinal fMRI study, upregulation of activity in the contralesional hemisphere in the subacute stage was positively correlated with aphasia recovery. 57 Thus, our results coincide with these earlier studies, which showed correlations between contralesional hemispheric activity and poststroke recovery.
According to the subgroup analyses, FM-UE1 and CST-LV were not useful in nonfitters (Figure 5A to C). Although nonfitters did not follow the proportional recovery rule,3-5,47 the contralesional IntrahC-PSI could selectively account for the behavior of both nonfitters and fitters. Because the IntrahC-PSI could be applied to both groups, our results offer new insights into the neural mechanism of motor recovery. 38
Limitations
The current study has some limitations. First, low electrode density is disadvantageous due to limited spatial resolution. Second, all patients had experienced cortical ischemic stroke; patients with hemorrhagic stroke or with subcortical lesions were not included. Although patients with a subcortical lesion may also have similar results, further validation studies are needed. Third, because this study was an observational study, rehabilitation duration was variable. However, longer rehabilitation duration did not necessarily lead to higher FM-UEgain. Fourth, the impairment of patients in acute stage could not be assessed due to the unavailability of data because all patients were transferred from other acute care hospitals. Fifth, a large number of covariates were included in the statistical analysis in relation to the number of patients. Sixth, at present, causality of the PSIs on motor recovery has not been clarified. Future study will be needed to determine the role of the PSI. Finally, due to the health care system in Japan, the timing of the EEG measurement was rather late after onset and the rehabilitation duration was longer than in most countries, so that our finding may not apply to studies that are outside of the time windows. However, as PSI is expected to provide clinically relevant information of post-acute recovery, it might be of interest to investigate how therapeutic interventions such as constraint-induced movement therapy and robot-assisted therapy affect PSI in future studies.
Conclusions
The current study indicates the usefulness of the PSI for the evaluation of poststroke motor impairment and recovery. Importantly, our method can be readily adapted for routine clinical use. Therefore, the PSIs may be biomarkers of motor impairment and recovery in patients with a hemispheric infarction.
Supplemental Material
Supplemental_Figure_R4 – Supplemental material for Electroencephalographic Phase Synchrony Index as a Biomarker of Poststroke Motor Impairment and Recovery
Supplemental material, Supplemental_Figure_R4 for Electroencephalographic Phase Synchrony Index as a Biomarker of Poststroke Motor Impairment and Recovery by Teiji Kawano, Noriaki Hattori, Yutaka Uno, Megumi Hatakenaka, Hajime Yagura, Hiroaki Fujimoto, Tomomi Yoshioka, Michiko Nagasako, Hironori Otomune, Keiichi Kitajo and Ichiro Miyai in Neurorehabilitation and Neural Repair
Supplemental Material
Supplemental_Table_R4 – Supplemental material for Electroencephalographic Phase Synchrony Index as a Biomarker of Poststroke Motor Impairment and Recovery
Supplemental material, Supplemental_Table_R4 for Electroencephalographic Phase Synchrony Index as a Biomarker of Poststroke Motor Impairment and Recovery by Teiji Kawano, Noriaki Hattori, Yutaka Uno, Megumi Hatakenaka, Hajime Yagura, Hiroaki Fujimoto, Tomomi Yoshioka, Michiko Nagasako, Hironori Otomune, Keiichi Kitajo and Ichiro Miyai in Neurorehabilitation and Neural Repair
Footnotes
Acknowledgements
We thank Dr Eiji Nakatani (Division of Statistical Analysis, Research Support Center, Shizuoka General Hospital, Shizuoka, Japan) for advice on statistical analysis.
Declaration of Conflicting Interests
The author(s) declared the following potential conflicts of interest with respect to the research, authorship, and/or publication of this article: YU has a patent JPA2015-166281 pending to RIKEN. KK has a patent JP6142354 issued to RIKEN, a patent US14/770,047 pending to RIKEN, and a patent JPA2015-166281 pending to RIKEN. The other authors declare that they have no conflicts of interest to disclose.
Funding
The author(s) disclosed receipt of the following financial support for the research, authorship, and/or publication of this article: This work was supported by the Toyota Motor Corporation. NH was supported by JSPS KAKENHI, Grant Number JP26350602.
References
Supplementary Material
Please find the following supplemental material available below.
For Open Access articles published under a Creative Commons License, all supplemental material carries the same license as the article it is associated with.
For non-Open Access articles published, all supplemental material carries a non-exclusive license, and permission requests for re-use of supplemental material or any part of supplemental material shall be sent directly to the copyright owner as specified in the copyright notice associated with the article.