
Abstract
Background
Restricted attentional resource and central processing in patients with Parkinson’s disease (PD) may reduce the benefit of visual feedback in a dual task.
Objectives
Using brain event-related potentials (ERPs), this study aims to investigate the neural mechanisms of posture visual feedback and supraposture visual feedback during performing of a posture-motor dual task.
Methods
Eighteen patients with PD and 18 healthy controls stood on a mobile platform (postural task) and executed a manual force-matching task (suprapostural task) concurrently with provided visual feedback of platform movement (posture-feedback condition) or force output (force-feedback condition). The platform movement, force-matching performance, and ERPs (P1, N1, and P2 waves) were recorded.
Results
Both PD and control groups had superior force accuracy in the force-feedback condition. Decreased postural sway by posture-feedback was observed in healthy controls but not in PD. Force-feedback led to a greater frontal area N1 peak in PD group but smaller N1 peaks in control group. In addition, force-feedback led to smaller P2 peaks of the frontal and sensorimotor areas among PD patients but greater P2 peaks of the sensorimotor and parietal-occipital areas among healthy controls. However, P1 modulations was present only in healthy controls.
Conclusions
Force-feedback had positive effect on force accuracy in both PD and healthy individuals; however, the beneficial effect of posture-feedback on posture balance is not observed in PD. These findings are the first to suggest that PD could recruit more attentional resources in dual-task preparation to enhance suprapostural accuracy and avoid degrading postural stability by supraposture visual feedback.
Introduction
The basal ganglia dysfunction in Parkinson’s disease (PD) leads to difficulty performing motor tasks and maintaining postural balance. 1 Postural control is deteriorated especially in dual-task conditions, which compared to single-task conditions require more attentional resources to maintain postural balance and perform another task (suprapostural task) concurrently. 2 Postural-suprapostural tasks are common in daily life, such as standing on a stool (postural task) and changing a light bulb (suprapostural task).
Real-time visual feedback can make the relevant information (eg, kinetic information) of movements more accessible. 3 For this reason, it could enhance motor performance in healthy adults and patients with PD in activities such as force production or manual tracking.4,5 Besides providing an external focus of attention, visual feedback could facilitate motor learning in PD by acting as a movement cueing and providing information about how the movement is performed. 6 However, although the positive effect of visual feedback on posture is found in healthy adults,7-10 some researchers proposed that visual feedback of postural tasks might lead to greater arousal, resulting in a higher cognitive (attentional) load of postural control. 11 Since the attentional resource is more limited in patients with PD than healthy adults, higher attentional load of posture may exceed the available resource capacity in PD, especially in dual-task conditions, in which both postural task and suprapostural task compete for the limited attentional resource. 12 Thus, consensus remains elusive regarding how posture is controlled when patients with PD are presented with visual feedback from their actual postural performance. In particular, knowledge is limited about how the visual feedback of posture and supraposture affect dual-task control in PD.
Based on attentional capacity model or resource-competition theory for dual-task control, the required resources for postural and suprapostural tasks are the critical factor in the performance of a dual task.13,14 Event-related potentials (ERPs) are often used to assess neurocognitive processes affecting the preparation in dual-task paradigms. 15 When standing under challenging posture (eg, one-leg stance or stand on a mobile platform) and performing a force-matching precision-grip task by thumb and index finger as suprapostural task, the amplitudes of N1 (80-150 ms) and P2 (150-240 ms) waves tune to the attentional resource devoted to postural and suprapostural tasks, respectively.16-19 Greater N1 amplitude in the frontal or sensorimotor area indicated that individuals focused major attention to posture or had higher arousal due to postural challenge.16-19 In addition, the N1 potential was suggested to reflect cortical processing of sensory information and higher order cognitive process under the conditions with postural threat or perturbation.20-22 Greater postural threat or perturbation induced larger N1 amplitudes indicating that larger N1 amplitude was associated with increased attentional or cognitive resource for postural control.20-22 On the other hand, the amplitude of P2 decreased when more attention is paid to visual information of task targets. 23 Decreased P2 amplitude is also observed in the fronto-central-parietal area with increased attention to visuomotor processing of suprapostural force-matching. 16 The P1 component (70-110 ms) could be acting as a sensory gain amplifier of attended inputs in the early stage of visual processing for increasing neural persistence of perceptual processes and neural recruitment. 19
Based on the limited neural resources and impaired dual-task control associated with PD, an adequate understanding of visual feedback effects on dual tasks is important for developing optimal dual-task therapy strategies for patients with PD. In light of amplitude modulation of ERPs, we designed this study to evaluate different visual feedback effects (posture visual feedback vs supraposture visual feedback) and its related attentional resource allocation on a dual-task paradigm in patients with PD and healthy controls. Our first hypothesis was that visual feedback effects on dual-task performance would be population dependent. We hypothesized that the healthy adults could get beneficial effects on postural stability and suprapostural accuracy from posture visual feedback and supraposture visual feedback, respectively; however, posture visual feedback could not improve postural stability for patients with PD in a dual-task condition due to an overloaded attention. Our second hypothesis was that the resource allocation, in terms of modulation of the P1, N1, and P2 amplitudes, would vary with the effects of visual feedback and PD. In particular, we hypothesized that the posture visual feedback resulted in worse dual-task control with greater N1 amplitude (higher attention or arousal of postural control) in patients with PD. The results highlight the structural, functional, and behavioral associations of these factors in PD and identify a promising visual feedback strategy for them in performing postural dual tasks.
Methods
Participants
Eighteen patients with PD (mean age: 64.7 ± 7.1 years) and 18 age-matched healthy control subjects (mean age: 64.6 ± 5.7 years) were recruited for the study. The inclusion criteria for patients with PD were (1) diagnosis of idiopathic PD according to the United Kingdom PD Society Brain Bank clinical diagnostic criteria, 24 (2) onset age >40 years old, and (3) able to stand without assistance. Patients with a history of brain surgery, other diseases and conditions that could influence balance ability, or a Mini-Mental State Examination score (MMSE) ≤26 points were excluded. The inclusion criteria for healthy controls were the following: no previous neuromuscular or cardiopulmonary disorders, no medication that might influence balance or cognition, and MMSE score >26 points. All participants were right-handed with normal or corrected-to-normal vision. Table 1 presents participants’ demographic and clinical characteristics. All procedures in the experiment were approved by the National Taiwan University Hospital Research Ethics Committee, and all participants gave written informed consent.
Patient Demographics and Characteristics a .
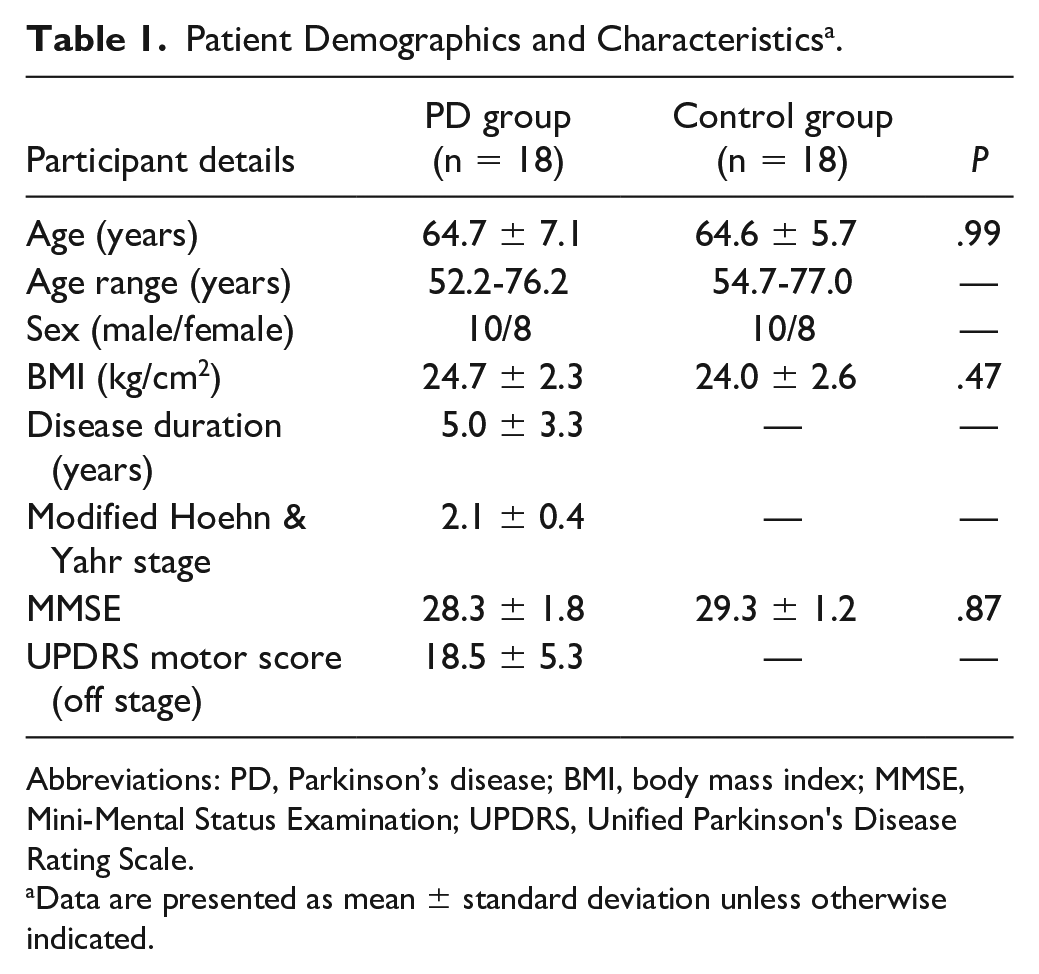
Abbreviations: PD, Parkinson’s disease; BMI, body mass index; MMSE, Mini-Mental Status Examination; UPDRS, Unified Parkinson's Disease Rating Scale.
Data are presented as mean ± standard deviation unless otherwise indicated.
Experimental Apparatus and Data Recording
Participants were instructed to stand on a mobile platform (length 58 cm × width 50 cm × height 26 cm) that could rotate forward-backward in pitch direction with 50° in each direction (the postural task) and to concurrently perform a motor task of force-matching precision grip (the suprapostural task). All examinations of patients with PD were performed in the morning, at least 12 hours from their antiparkinsonian medications (medication-off test).
For the postural task, participants were asked to maintain the horizontal position of the mobile platform for 60 seconds. An inclinometer (FAS-A; MicroStrain) was mounted at the center of the mobile platform to measure the platform’s tilting angle. Participants stood on the platform in a shoulder-width stance. For the suprapostural task, they executed a force-matching task using their right index finger and thumb without moving the wrist joint or arm. The level of force output was recorded using a pinch force sensor (LMD300; FUTEK Advanced Sensor Technology Inc) connected to a strain gauge amplifier (CSG110; FUTEK Advanced Sensor Technology Inc) via a thin and flexible wire, so that the force apparatus could not support the participant’s stance.
Prior to starting the main experiment, we recorded the maximum voluntary contraction (MVC) force of the precision grip, setting 50% of this force as the target force. During the experiment, participants were instructed to perform a quick precision grip to match the target force upon hearing the executive auditory tones (500 Hz, 100 ms in duration), followed by a warning beep (800 Hz, 100 ms in duration). Each trial consisted of 13 warning-executive signal pairs. The first 3 preparatory warning-executive pairs, separated by a 1-second interval, were not used for analysis. To minimize prediction effects on force-matching execution, for warning-executive pairs 4 to 13, a warning tone was randomly presented at an interval of 1.5, 1.65, 1.8, 1.95, or 2.1 seconds before the executive tone. There was a 2.5-second interval between the end of the executive tone and the beginning of the next warning tone. All signals were displayed on a 22-inch monitor positioned at eye level 0.6 m from participants. We used LabVIEW software (National Instruments) to generate auditory tones and display behavior consequences of the force-matching and platform sway as online visual feedback. For the behavior feedback, 50° of actual rotation movement of the mobile-platform corresponded to 10 cm of movement of the postural sway displayed on the screen; 50% of actual MVC force of the precision grip corresponded to 10 cm of movement of the precision grip force displayed on the screen.
Scalp voltage fluctuations were recorded using a NuAmps amplifier (NeuroScan Inc) with 30 different electroencephalogram (EEG) channels (Fp1/2, Fz, F3/4, F7/8, FT7/8, FCz, FC3/4, Cz, C3/4, CPz, CP3/4, Pz, P3/4, T3/4, T5/6, TP7/8, Oz, and O1/2). The electrodes were placed based on ten-twenty electrode system of the International Federation to ensure that electrodes were aligned to the specified brain regions.25,26 The ground electrode was placed along the midline ahead of Fz. Electrodes placed above the arch of the left eyebrow and below the eye were used to monitor eye movements and blinks. The impedances of all electrodes were below 5 kΩ and referenced to linked mastoids on both sides. The EEG data were band-pass filtered at 0.1 to 100 Hz. All behavioral data and EEG data were synchronized and digitized at a sampling rate of 1 kHz.
Experimental Conditions
The present study included 2 experimental sets (posture-feedback set and force-feedback set) for 2 different visual feedback conditions. Each set included 3 testing conditions: a dual-task condition, a single posture condition, and a single force-matching condition. To reduce the possibility of a fatigue effect, the 2 sets held 3 days apart. The order of the 2 experimental sets was counterbalanced between participants in each group (Supplementary Figure 1).
In the experimental set of posture-feedback, the monitor showed the mobile-platform movement and force output for the first 10 seconds (included the first 3 force-matching actions). Then, the display of force output was removed (Supplementary Figure 2A). For the dual-task condition, participants were instructed to keep the platform tilting angle output as close as possible to the target line and generate a force peak as close as possible to the target line (no task priority). For the single postural task, participants maintained the mobile platform in a horizontal position with posture visual feedback provided when holding the force-grip apparatus but did not exert any gripping force. For the single force-matching task, the participants executed the force-matching task without force visual feedback while standing on a static surface.
In the experimental set of force-feedback, the monitor showed both mobile-platform movement and force output for the first 10 seconds, and then the display of mobile-platform movement was removed (Supplementary Figure 2B). For the dual-task condition, the task instruction was identical with the dual-task condition of posture-feedback set. For the single postural task, the participants maintained the mobile platform in a horizontal position without posture visual feedback when holding the force-grip apparatus but did not exert any gripping force. For the single force-matching task, the participants executed the force-matching task with force visual feedback provided while standing on a static surface. Within each experimental set, each participant was tested in a random order across experimental conditions. Eight trials were conducted for each experimental condition. To familiarize participants with the experimental conditions, one training trial was performed prior to the actual tests.
Data Analysis
Behavior Data
The behavior parameters of the force-matching task were assessed using the force error. The force error was defined as
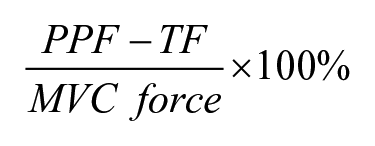
(PPF: peak precision grip force, TF: target force) from the force-matching actions 4 to 13 in each trial.
For assessment of postural parameters, the inclinometer data were low-pass filtered at 6 Hz. We selected the data from seconds 11 to 60 for calculation of the postural sway and for the recurrence quantification analysis (RQA) of the posture fluctuations. The magnitude of postural sway was determined by the root mean square error of the mismatches between the target angle (0° position) and titling angle. We also used RQA to quantify the complexity of postural sway time series.27,28 For detailed RQA information, please refer to Supplementary Appendix. Determinism (%DET) in the RQA measures the proportion of recurrent points forming diagonal line structures of detrended inclinometer data and was used to quantify the predictability of the postural dynamic system. A greater %DET represents more deterministic postural sway on the mobile platform and indicates less complexity of postural sway, implying less automaticity or flexibility of postural control.27,28
ERP Parameterization
The DC offset of each EEG channel was applied in the off-line analysis. The conditioned EEG data were low-pass filtered (40 Hz/48 dB roll-off) and segmented into epochs of 700 ms (−100 ms to 600 ms), which were time-locked to the onset of the executive signal. Each epoch was visually inspected, and any artifact (eg, the excessive drift, eye movements, blinks) was removed using NeuroScan 4.3 software (NeuroScan Inc). Only epochs with proper responses were averaged (at least 65 ERP epochs for each experimental condition) following baseline correction at the pre-stimulus interval. Three ERP components (P1: 70-110 ms, N1: 100-170 ms, and P2: 170-270 ms) associated with the postural-suprapostural tasks were observed (Supplementary Figure 3).
After averaging epochs in each electrode, we applied global field power (GFP) to the ERPs of the frontal (Fz, F3, F4, FCz, FC3, FC4), sensorimotor (Cz, C3, C4, CPz, CP3, CP4), and parietal-occipital (Pz, P3, P4, Oz, O1, O2) areas. Corresponding to the spatial standard error of ERP waveforms in the regions of interests at each time point, GFP represents an integration of cortical activities to compensate for the number of inferences from multiple comparisons of ERP features among electrodes.29,30 The GFP peaks of the P1, N1, and P2 components were determined only under the 2 dual-task conditions because we were especially interested in the modulation of attention allocation between postural task and suprapostural task by different visual feedbacks.
Statistical Analysis
A 2 × 2 mixed analysis of variance (ANOVA) was used to examine the effect of task condition (single-task vs dual-task) between PD and control groups on behavior performance variables (postural sway, postural %DET, and force error). For the dual-task conditions, the effects of visual feedback (posture-feedback vs force-feedback) and group (PD vs control) on behavior performance variables and ERP amplitudes (peak magnitudes of P1, N1, and P2 in GFP waveform) were examined using a 2 × 2 mixed ANOVA. Post hoc tests were performed for significant interaction effects. The level of significance was set at P < .05. For post hoc testing, we used the Simes test to avoid the over-correction associated with the Bonferroni test. 31 The type 1 error rate using the Simes test was proven to be exactly 0.05 when the elementary hypotheses were independent. Signal processing and statistical analyses were completed using MATLAB v. R2012a (MathWorks) and SPSS v. 21 (SPSS Inc). All data are presented as the mean ± standard error.
Results
Behavior Performance
The comparisons of postural sway, postural %DET, and force error between single-task and dual-task conditions in PD and control groups were presented in Table 2.
Effects of Task Condition (Single-Task vs Dual-Task) on Postural Sway, Postural %DET, and Force Error for the PD and Control Groups a .
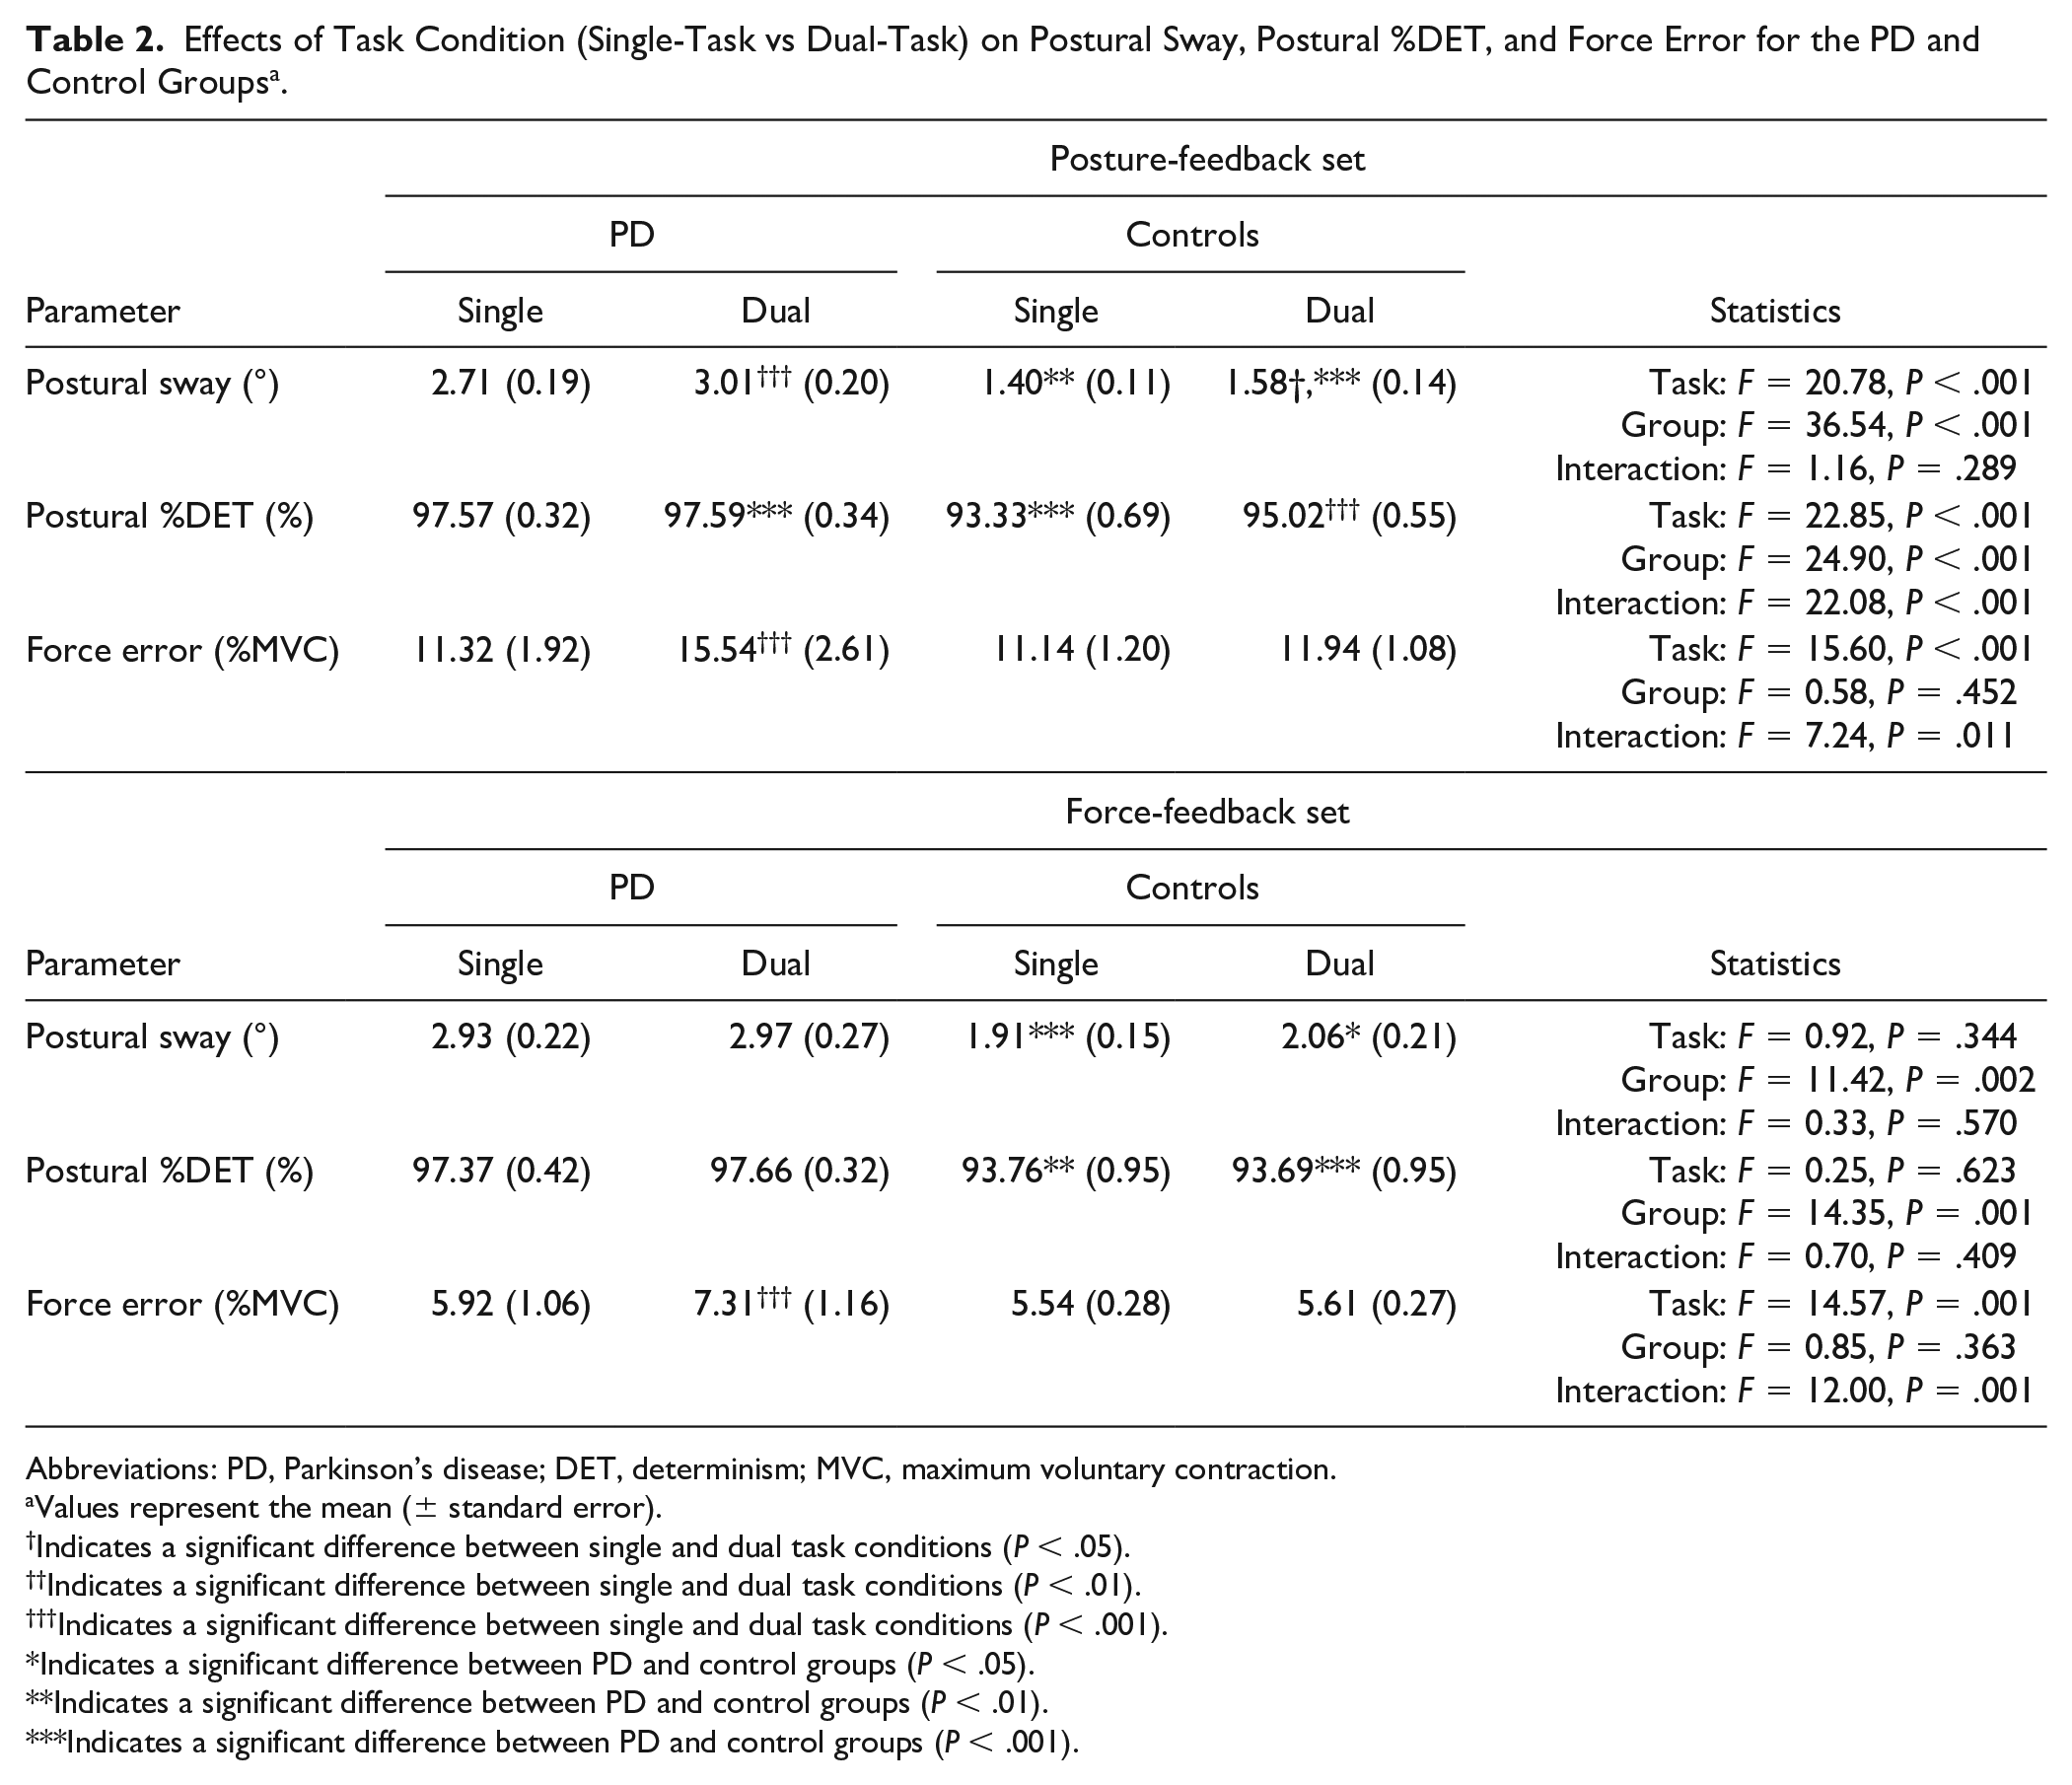
Abbreviations: PD, Parkinson’s disease; DET, determinism; MVC, maximum voluntary contraction.
Values represent the mean (± standard error).
Indicates a significant difference between single and dual task conditions (P < .05).
Indicates a significant difference between single and dual task conditions (P < .01).
Indicates a significant difference between single and dual task conditions (P < .001).
Indicates a significant difference between PD and control groups (P < .05).
Indicates a significant difference between PD and control groups (P < .01).
Indicates a significant difference between PD and control groups (P < .001).
The mean values of postural sway and postural %DET of the 2 groups under the 2 dual-task conditions are depicted in Figure 1A and B. The ANOVA results revealed that group main effect and the interaction effect between visual feedback and group affected the size of postural sway (visual feedback: F1,34 = 3.75, P = .061; group: F1,34 = 18.78, P < .001; interaction: F1,34 = 4.93, P = .033). The control group had greater postural sway during the force-feedback condition than the posture-feedback condition (P = .006), whereas visual feedback did not affect postural sway in the PD group (P = .842). Postural sway was greater in the PD group than among controls in both the posture-feedback and force-feedback conditions. Postural %DET was affected by main effects of visual feedback (F1,34 = 4.21, P = .048) and group (F1,34 = 17.35, P < .001), and their interaction effect (F1,34 = 5.18, P = .029). Post hoc analysis showed that the control group had smaller postural %DET in the force-feedback condition than in the posture-feedback condition (P = .004), whereas visual feedback did not affect postural %DET in the PD group (P = .874). The PD group also had larger postural %DET than the control group in both the posture-feedback and force-feedback conditions.
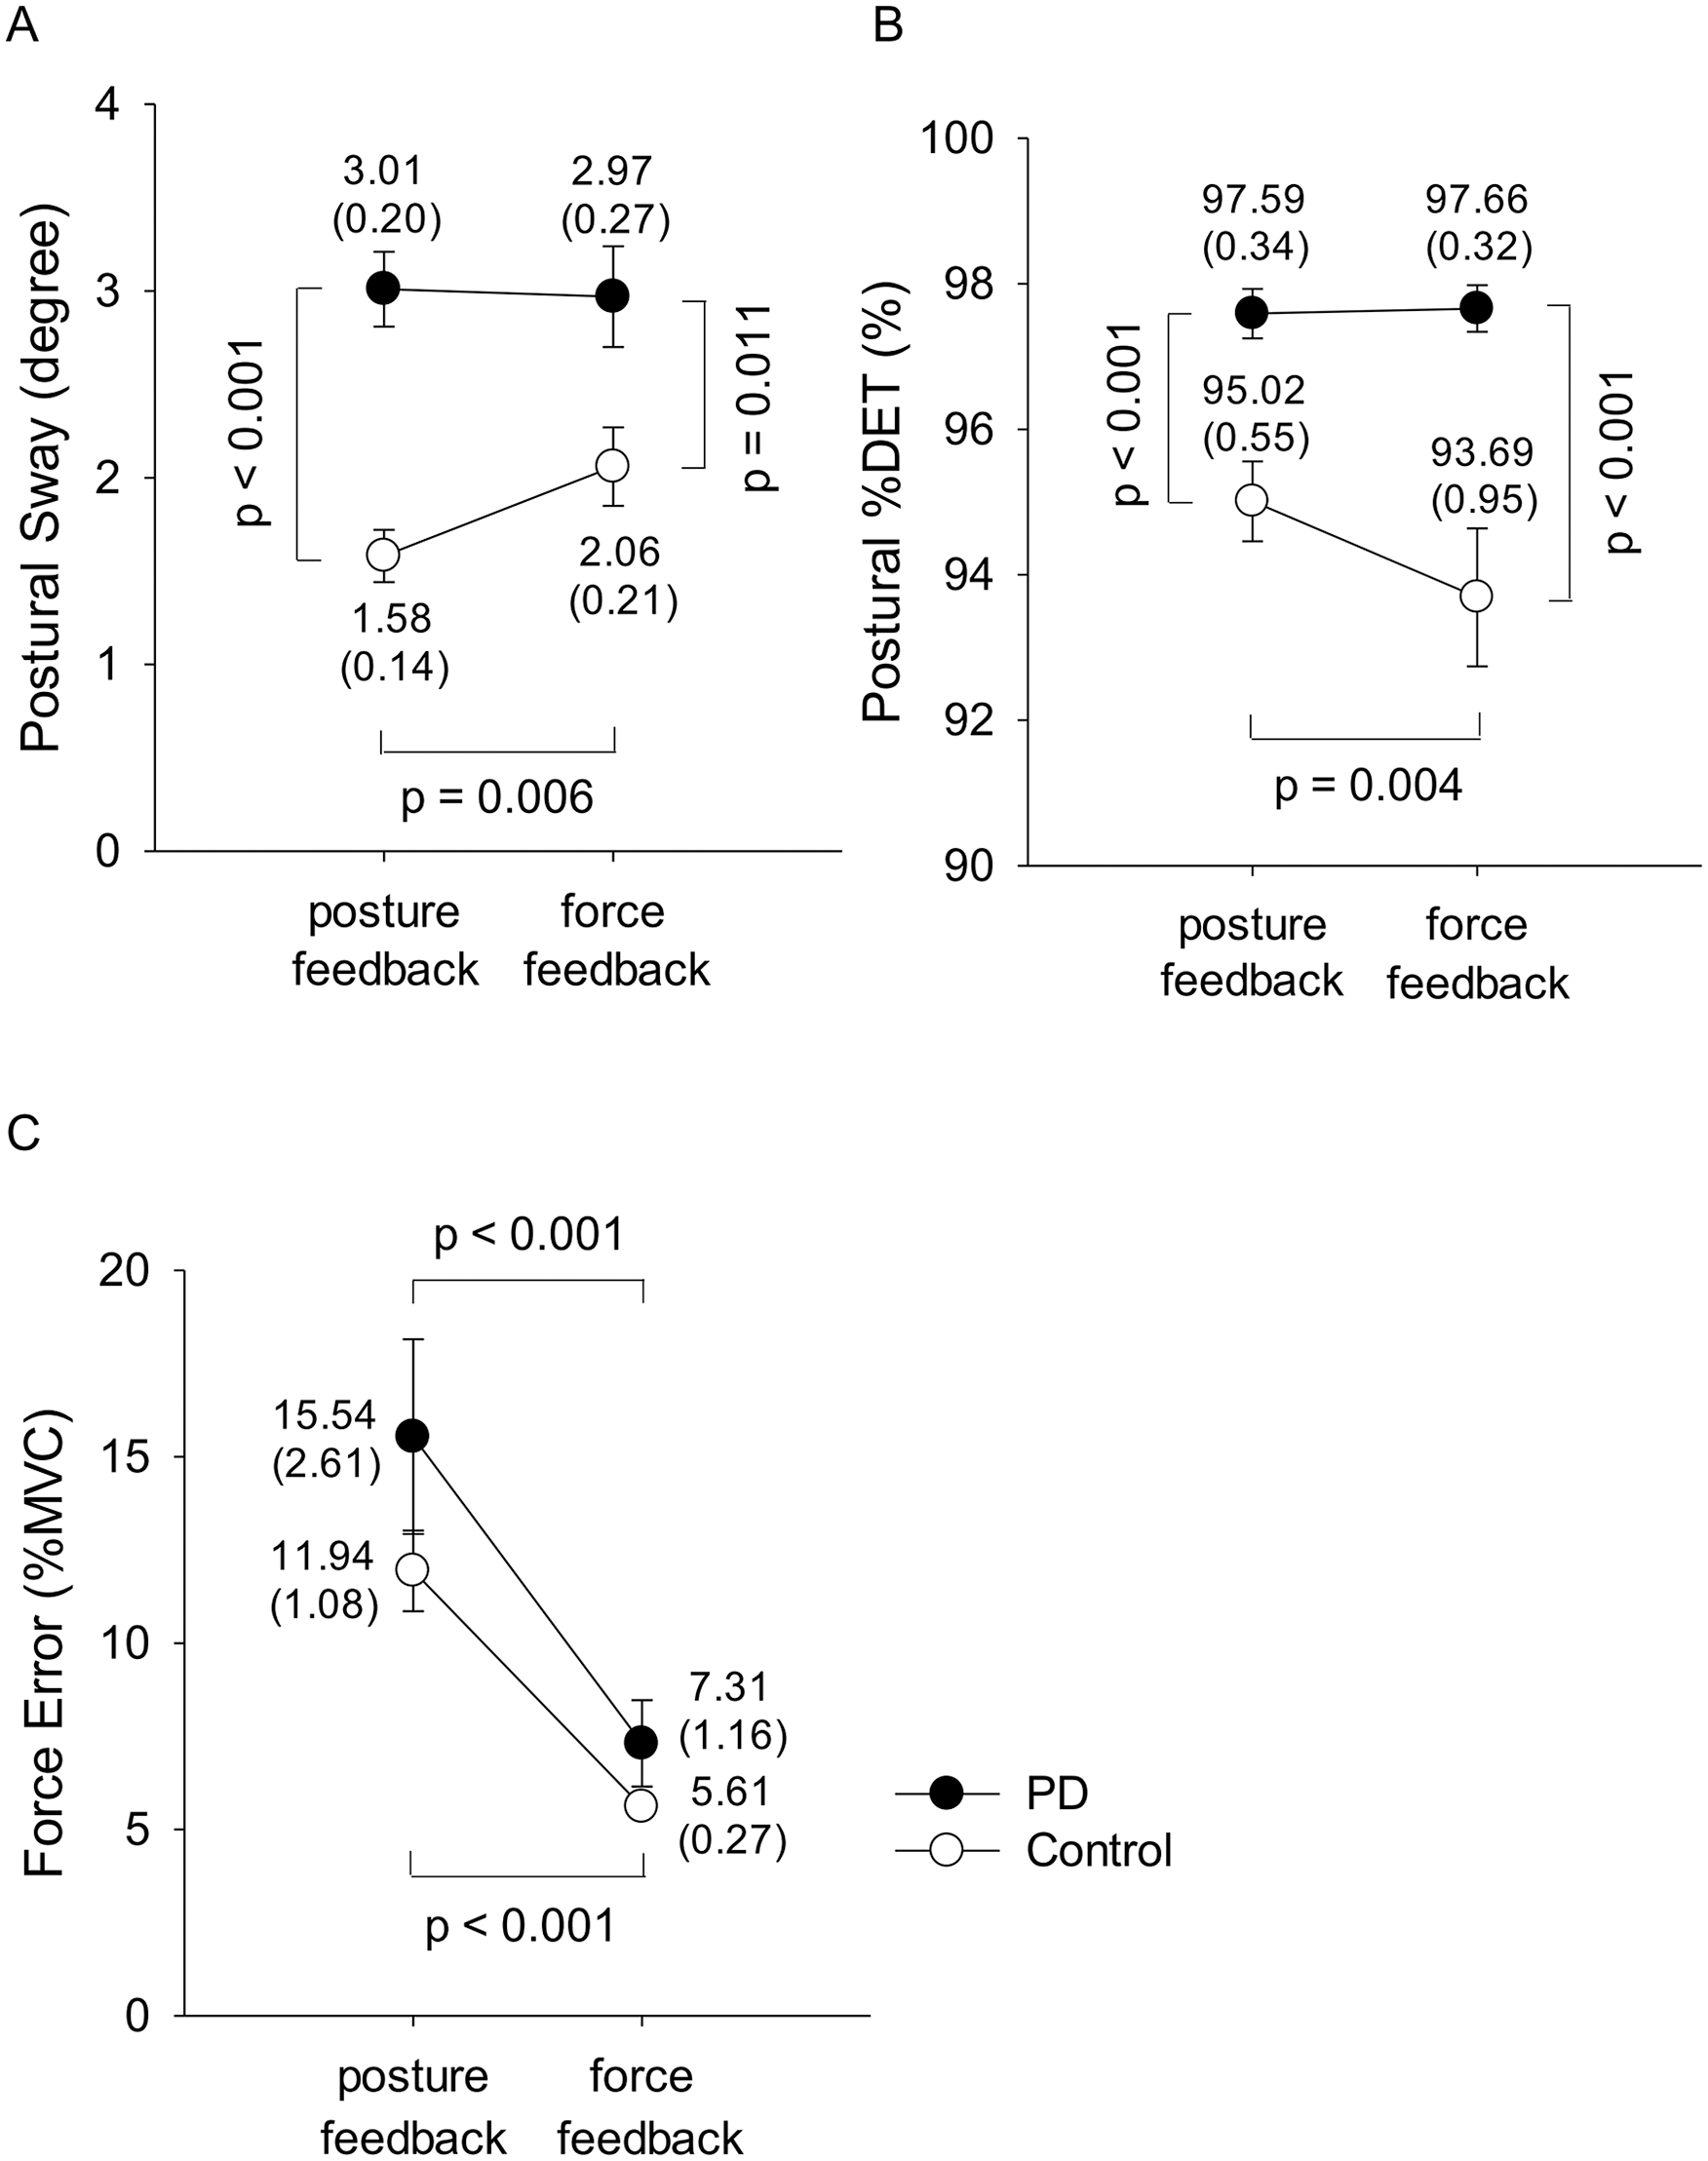
Effects of visual feedback on behavior performance for the PD and control groups: (A) postural sway, (B) postural %DET, (C) force error.
The mean values of the force error under the 2 dual-task conditions are shown in Figure 1C. The ANOVA results revealed that only the main effect of visual feedback affected force error (visual feedback: F1,34 = 45.59, P < .001; group: F1,34 = 1.98, P = .168; interaction: F1,34 = 0.77, P = .386). Both PD (P < .001) and control (P < .001) groups exhibited larger force error in the posture-feedback condition than in the force-feedback condition.
ERP Component Amplitude
Figure 2 summarizes the visual feedback modulation of the GFP P1 peaks for the PD and control groups. All P1 peaks in the frontal, sensorimotor, and parietal-occipital areas were significant affected by the main effect of visual feedback (frontal: F1,34 = 7.83, P = .008; sensorimotor: F1,34 = 27.13, P < .001; parietal-occipital: F1,34 = 14.86, P < .001). They also varied with the interaction effect (frontal: F1,34 = 5.10, P = .030; sensorimotor: F1,34 = 7.55, P = .010; parietal-occipital: F1,34 = 4.94, P = .033) but not by group effect (frontal: F1,34 = 1.12, P = .297; sensorimotor: F1,34 = 0.76, P = .389; parietal-occipital: F1,34 = 0.33, P = .572). The P1 peaks in the force-feedback condition were greater than those in the posture-feedback condition for the control group in frontal (P = .001), sensorimotor (P < .001), and parietal-occipital (P < .001) areas. In contrast, it was unaffected by visual feedback among patients with PD (frontal: P = .705; sensorimotor: P = .091; parietal-occipital: P = .256).
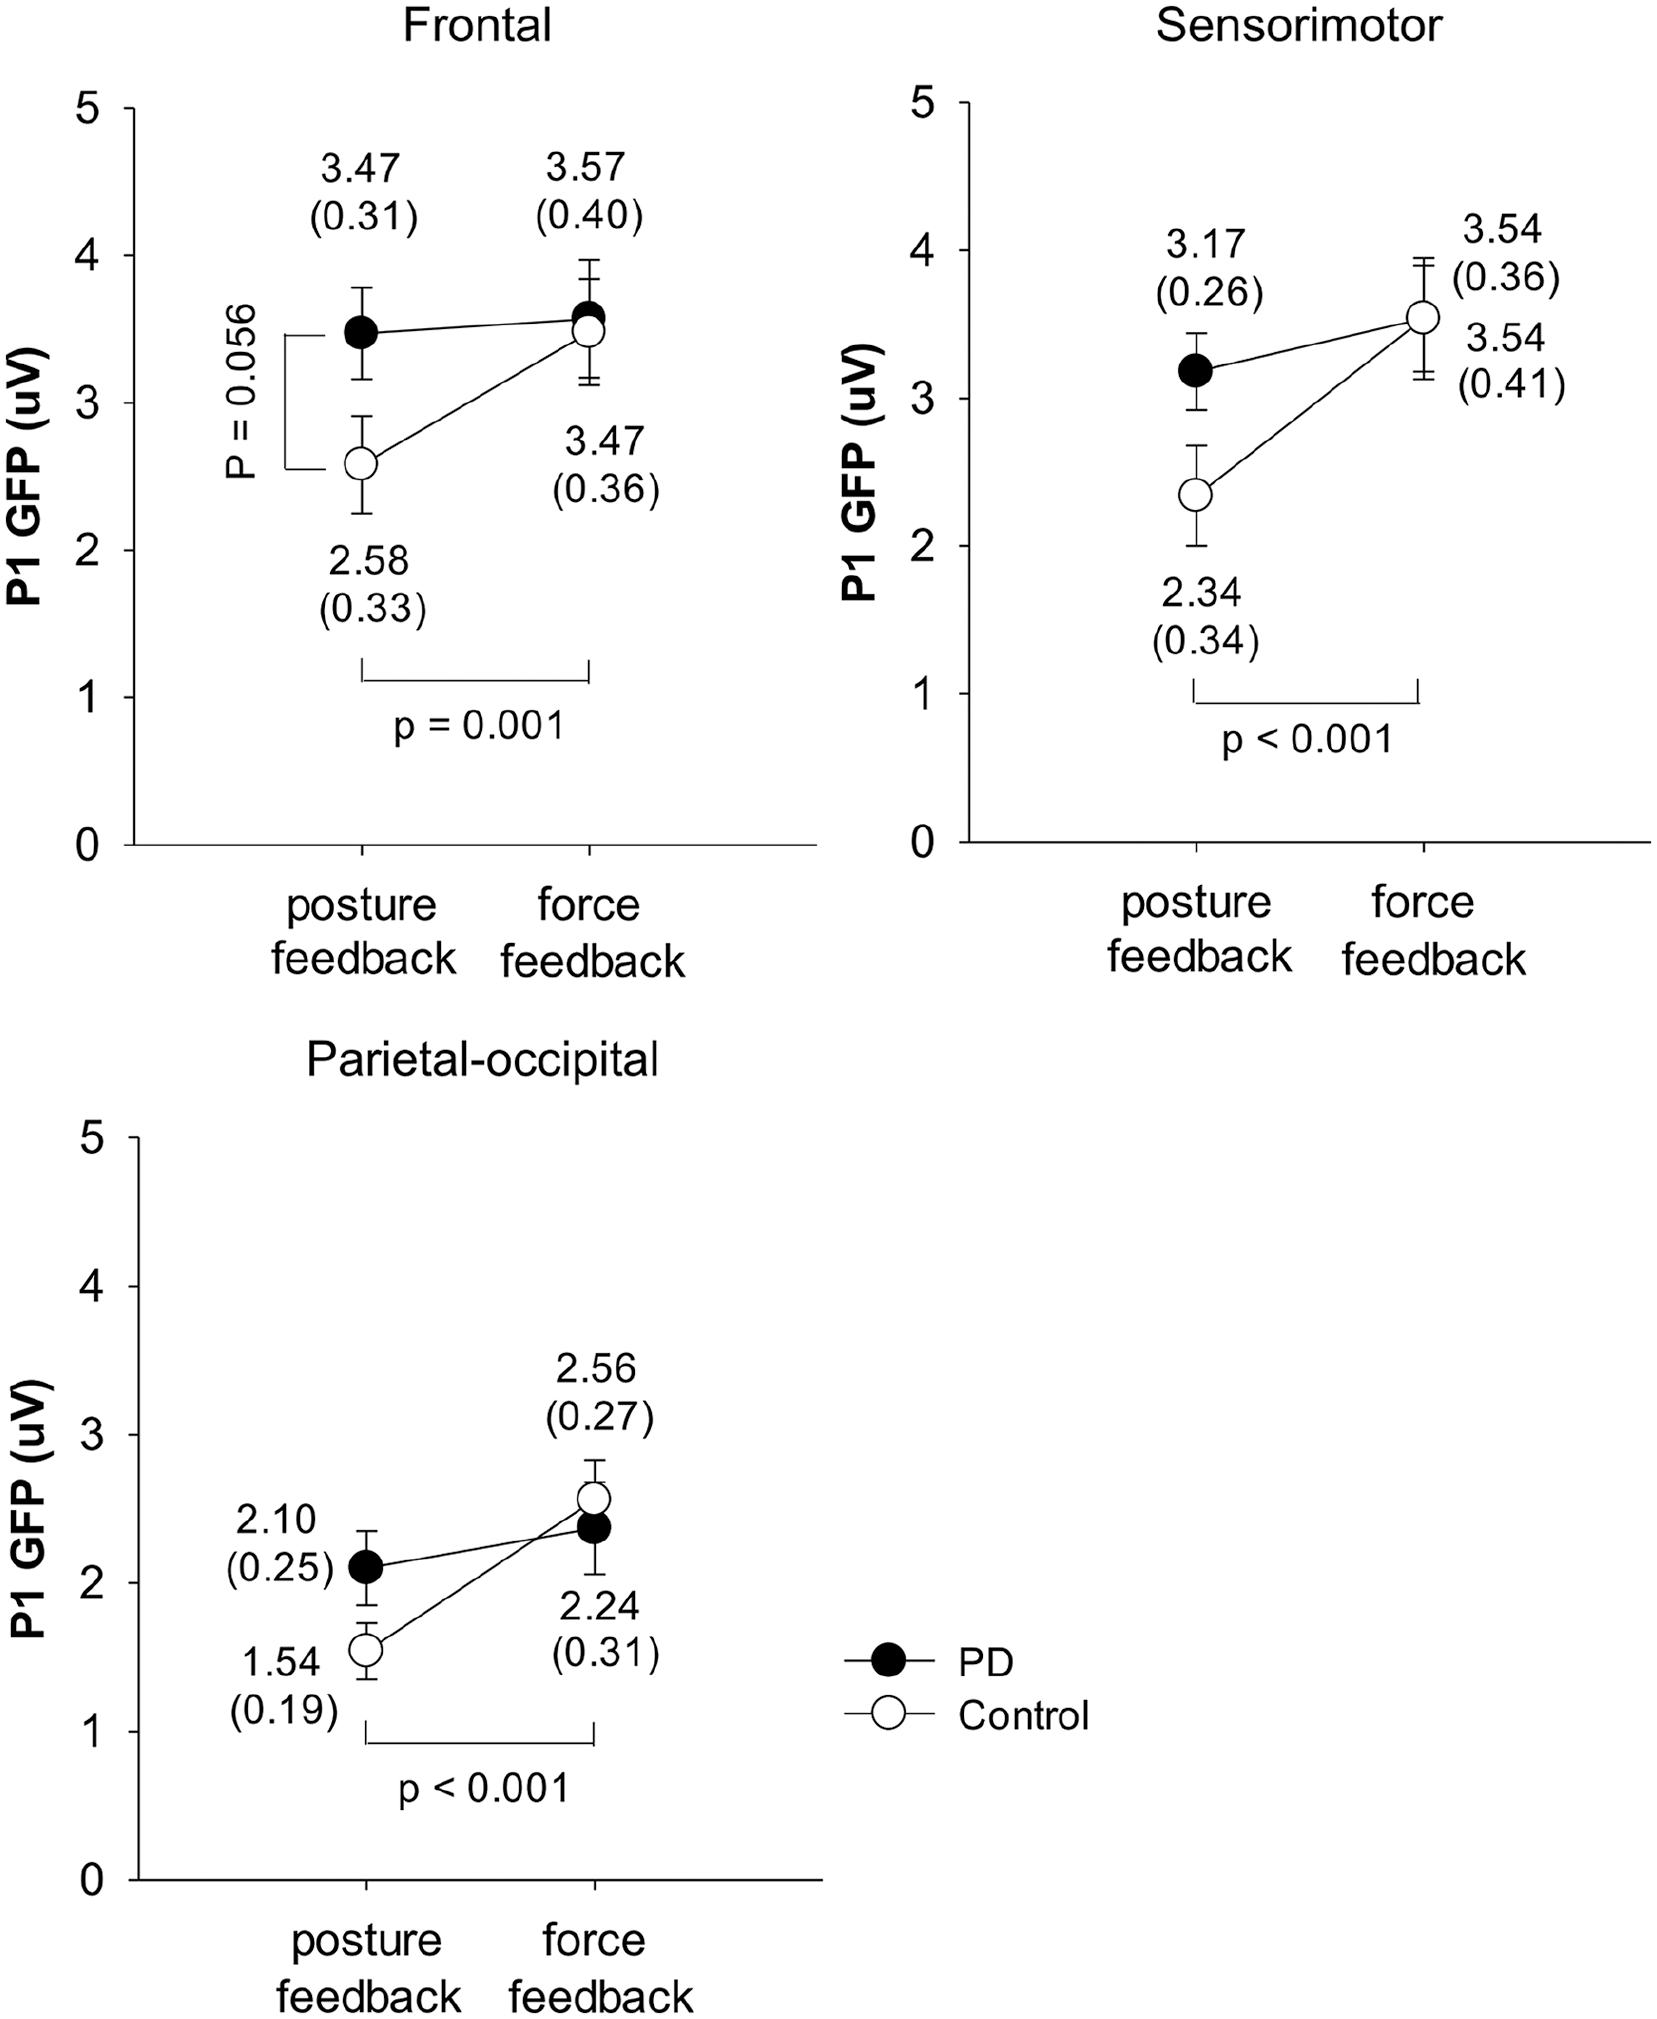
Effects of visual feedbacks on the GFP P1 peaks in the frontal, sensorimotor, and parietal-occipital areas for the PD and control groups.
Figure 3 shows the mean GFP N1 peaks of the different visual feedback conditions. The N1 peaks in the frontal area indicated a significant interaction between visual feedback and group (F1,34 = 17.96, P < .001), even though the main effects of visual feedback and group were insignificant (visual feedback: F1,34 = 0.04, P = .852; group: F1,34 = 2.27, P = .142). When compared with the posture-feedback condition, the force-feedback condition was associated with a greater N1 peak in the frontal area of the PD group (P = .004) but with a smaller N1 peak in the frontal area of the control group (P = .007). Furthermore, the control group had a greater frontal N1 peak than the PD group in the posture-feedback condition (P = .024). On the other hand, visual feedback affected the GFP N1 peak in the sensorimotor area (F1,34 = 8.89, P = .005) with a significant interaction between visual feedback and group (F1,34 = 17.78, P < .001), but no influence of group effect (F1,34 = 1.43, P = .240). The control group had a smaller N1 peak in the sensorimotor area under the force-feedback condition compared to the posture-feedback condition (P < .001). In contrast, visual feedback did not affect the N1 peak in the sensorimotor area of the PD group (P = .389). Similar to the sensorimotor area, visual feedback did affect the N1 peak in the parietal-occipital area (F1,34 = 4.94, P = .033), with a significant interaction between visual feedback and group (F1,34 = 4.49, P = .041), but on influence of group effect (F1,34 = 1.29, P = .265). The N1 peak in the parietal-occipital area was smaller under the force-feedback condition than under the posture-feedback condition (P = .004) of the control group, but was unaffected by visual feedback in the PD group (P = .943).
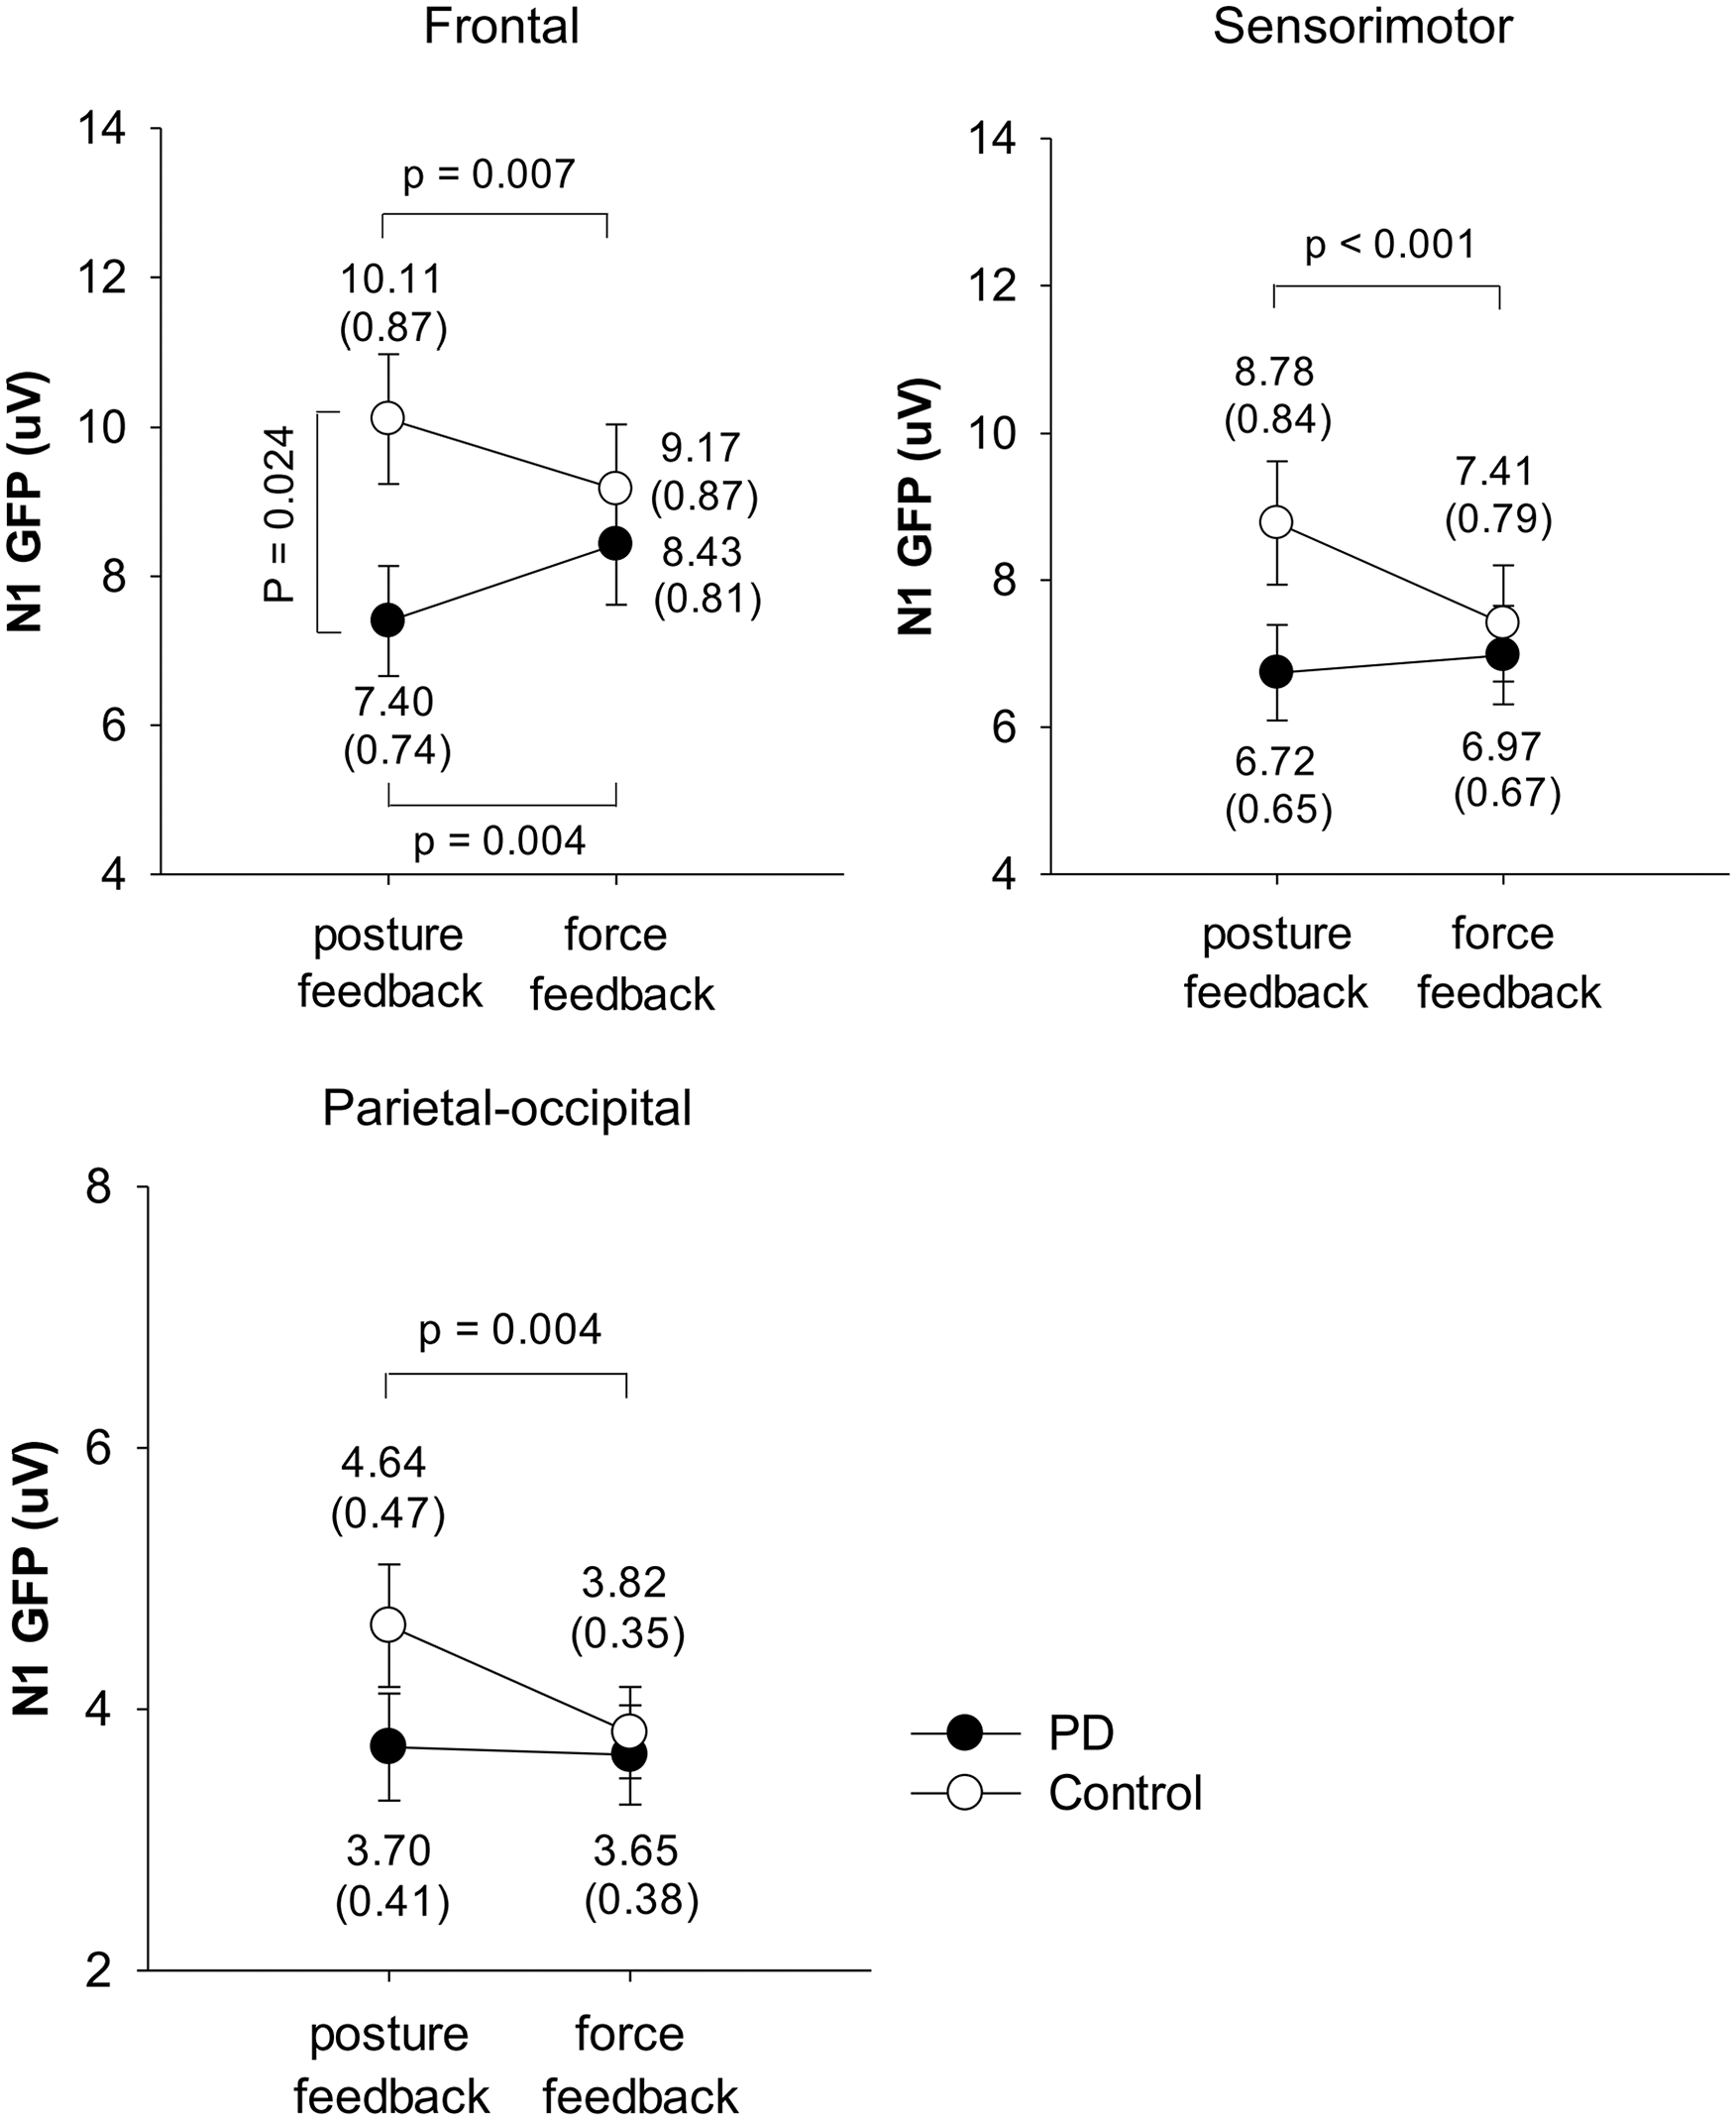
Effects of visual feedbacks on the GFP N1 peaks in the frontal, sensorimotor, and parietal-occipital areas for the PD and control groups.
Figure 4 shows the visual feedback modulation of the GFP P2 peaks for the PD and control groups. For the frontal area, the ANOVA results suggested a significant interaction effect (F1,34 = 7.56, P = .010) on the P2 peak, without significant main effects of visual feedback (F1,34 = 1.67, P = .205) and group (F1,34 = 0.86, P = .362). Post hoc analysis revealed that the posture-feedback condition was associated with a larger P2 peak in the frontal area for the PD group (P = .007) but not for the control group (P = .311). For the sensorimotor area, the ANOVA results also suggested a significant interaction effect (F1,34 = 20.43, P < .001) on the P2 peak, without significant main effects of visual feedback (F1,34 = 0.03, P = .856) and group (F1,34 = 0.68, P = .414). Post hoc analysis indicated that the PD group had smaller P2 peaks in the sensorimotor area under the force-feedback condition compared to the posture-feedback condition (P = .002). In contrast, the control group had greater P2 peaks in the sensorimotor area under the force-feedback condition compared to the posture-feedback condition (P = .004). For the parietal-occipital area, the main effect of visual feedback affected the P2 peak (F1,34 = 6.96, P = .013), with a significant interaction effect (F1,34 = 8.35, P = .007), even though the group effect was insignificant (F1,34 = 0.08, P = .779). Post hoc analysis showed that the P2 peak in the parietal-occipital area under the force-feedback condition was greater than under the posture-feedback condition for the control group (P < .001). In contrast, visual feedback did not affect the P2 peak in the parietal-occipital area of the PD group (P = .859).
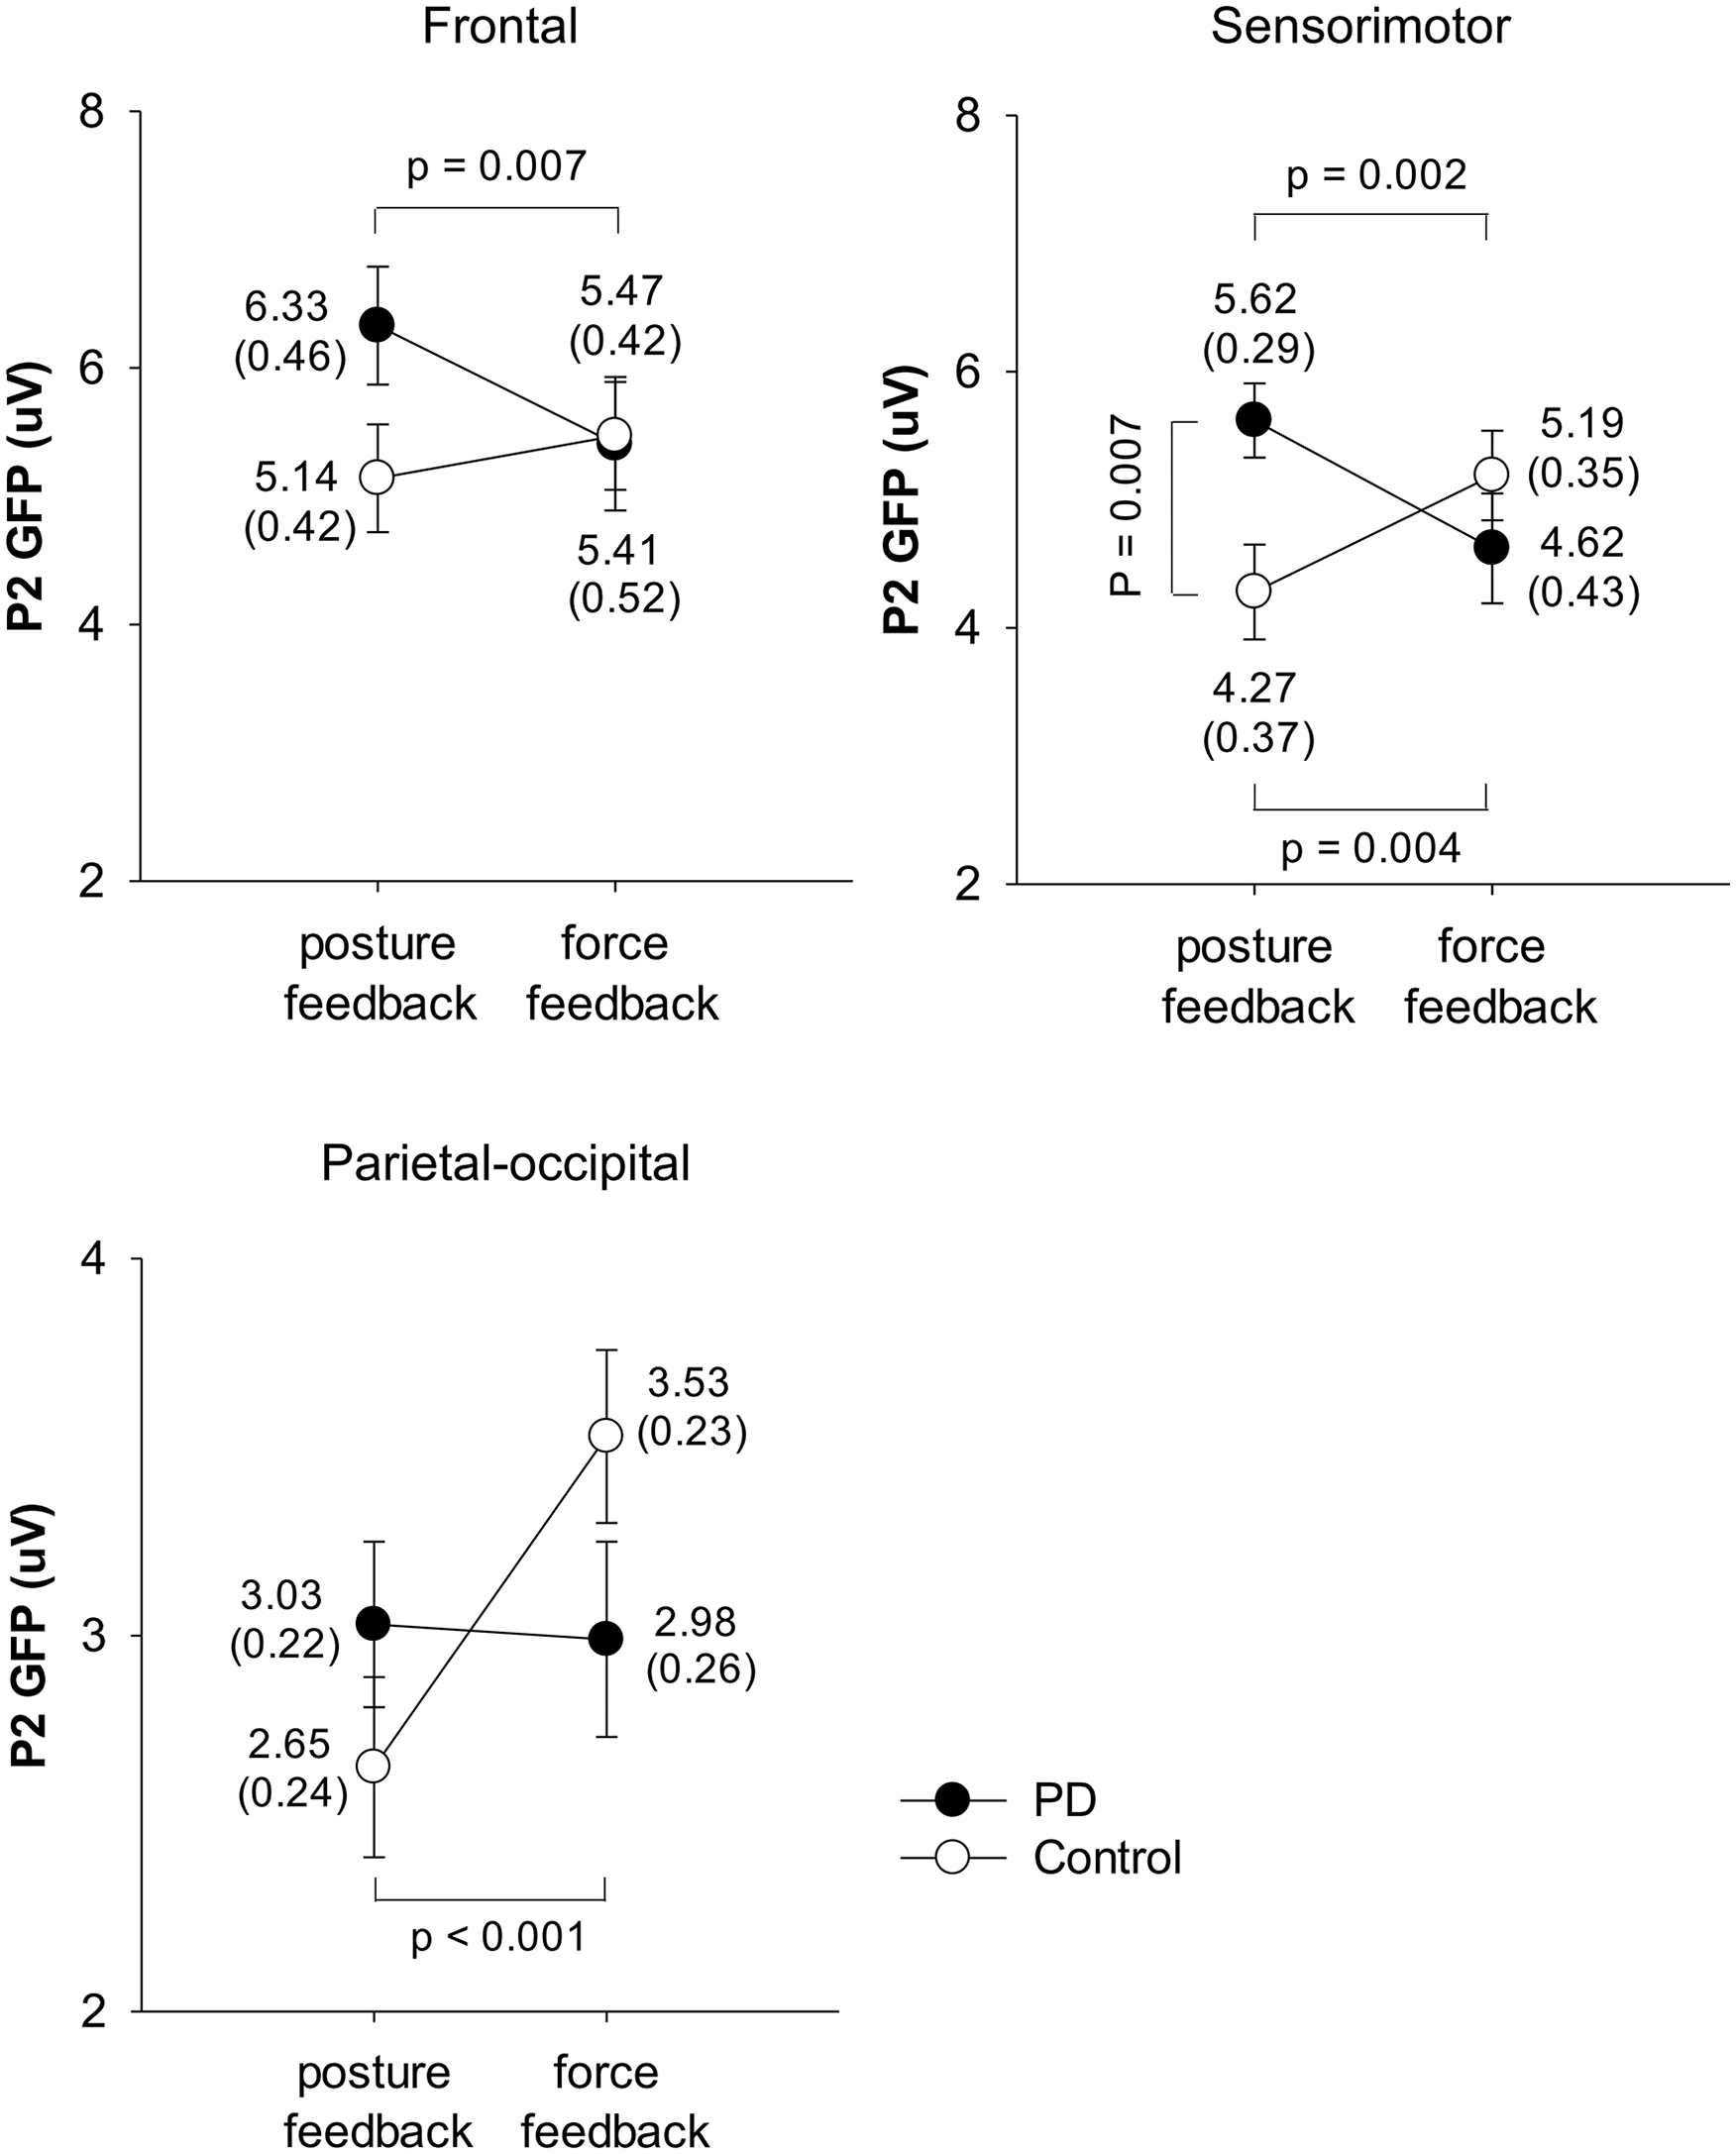
Effects of visual feedbacks on the GFP P2 peaks in the frontal, sensorimotor, and parietal-occipital areas for the PD and control groups.
Discussion
The present study demonstrated that under dual-task conditions, the postural performance of healthy controls is affected by visual feedback (posture-feedback vs force-feedback), whereas the postural performance of PD group does not vary with visual feedback. Specifically, the posture visual feedback led to less amplitude and greater deterministic of postural sway in the healthy controls, but those outcomes were not observed in the PD group. In addition, both PD and control groups had better force accuracy with the force visual feedback. The findings of behavior performance indicated a group-dependent effect of visual feedback on postural control, with a beneficial effect of posture visual feedback on postural sway seen only among healthy controls. Furthermore, the underlying neural mechanism of postural control and force-matching control in posture-feedback and force-feedback conditions was distinct between the groups.
Posture Control and N1 Modulation
According to our results, the postural effects of visual feedback differed with groups. With posture visual feedback, healthy controls had less postural sway, greater postural %DET, and larger N1 peak across the frontal, sensorimotor, and parietal-occipital areas. We previously showed that N1 amplitude is posture-dependent and that greater N1 amplitude represents enhanced attention to postural control.16,19 The healthy controls thus stabilized posture by recruiting more attentional resources to correct the mismatch from the horizontal level in the posture-feedback condition, supporting an increase in conscious control of postural balance by visual feedback.9,32 However, postural flexibility would deteriorate, as represented by increased postural %DET.27,28 The phenomenon of deteriorated postural flexibility by posture visual feedback was also supported by the postural %DET findings between the single-task and dual-task conditions. When comparing the single-task condition and dual-task condition, the greater postural %DET under the dual-task condition was only observed in the posture-feedback set, and the postural %DET did not change in the force-feedback set (Table 2). In contrast, the visual feedback effects showed in healthy control group was not observed in the PD group for either behavior or brain activation.
In patients with PD, the finding of N1 modulation by posture visual feedback was different from our hypothesis. Under the dual-task conditions, we found that posture visual feedback led to a smaller N1 peak in the frontal area with unchanged postural performances compared to the force-feedback condition in the PD group. These results indicate that patients with PD cannot use the visual information about mobile-platform movement as effectively as healthy adults. We suggest that the real unmagnified display of the mobile-platform movement might be insufficient to allow PD patients to decrease postural sway during standing on the platform because they need greater magnification of visual information about the mobile-platform movement. Increasing the scale display of the posture could decrease the thresholds of visual detection of postural displacements and lead to steeper decreases in postural sway.7,33-35 Previous studies have also shown that because of sensory integration deficits, compared to young adults, older adults, or those who had a stroke have difficulty improving their balance using real, unmagnified visual feedback.36,37 Moreover, a deficits function of integrating visual information for postural control resulting from basal ganglia dysfunction would also limit patients with PD to use visual feedback to correct posture. 38
Of note, the insufficiency of posture visual feedback for postural control among patients with PD could be supported by the reduced N1 peak in the frontal area. This region has been reported in a functional near-infrared spectroscopy study as a critical area for postural modulation during standing on a tilt board. 39 In the present study, with posture visual feedback, the healthy controls devoted more attentional resources to postural control (greater N1 peak)16-19 for coping with the mismatch between the postural target and mobile-platform movement, resulting in less postural sway. In contrast, instead of increasing attentional resources to postural control in the posture-feedback condition, patients with PD recruited additional resources for maintaining postural balance following withdraw of the visual feedback about posture (force-feedback condition). Hence, the ungraded postural stability in the force-feedback condition among the PD group result from enhanced attentional resource recruitment for postural control.
Suprapostural Control and P1 and P2 Modulation
Despite the force-matching accuracy benefited from force visual feedback being detected in both PD and control groups, the underlying neural mechanism was distinct between them. Based on previous studies, modulation of P2 amplitude is associated with attentional demand of a suprapostural motor task.16-18 Smaller P2 amplitude in the sensorimotor area indicates dedication of more resources to executing a suprapostural motor task.16,19 In this study, with superior force-matching accuracy in the force-feedback condition compared to the posture-feedback condition, the P2 peaks decreased in the sensorimotor and frontal areas among members of the PD group. The P2 peaks increased, however, in the sensorimotor and parietal-occipital areas of the control group. The reduced P2 peaks under the force-feedback condition indicated that patients with PD recruited more neural resources to plan and scale force output according to the mismatch between force target and force output of previous force-matching actions; 40 the result was smaller force-matching error in the force-feedback condition. In contrast, visual feedback of force output seems to be an efficient strategy for facilitating force control among healthy controls, with superior force-matching accuracy associated with less devotion of attentional resources.
The P1 modulation was observed only in the healthy controls, with greater P1 among the frontal, sensorimotor, and parietal-occipital areas in the force-feedback condition compared to the posture-feedback condition. The P1 wave in attention-demanding experiments appears to be linked to sensory gain amplification of attended inputs in the early stage of visual processing.41,42 In the current study, the reduction in attentional resource requirements for force-matching control in the healthy controls under the force-feedback condition might result from enhanced sensory gain amplification through visual information about force output. This association implies that supraposture visual feedback could facilitate superior neural economy for suprapostural motor control in healthy adults. However, the modulation function of sensory gating might deteriorate in patients with PD because of impaired function of the basal ganglia. 43 For this reason, these participants had to use more resources for the suprapostural motor task to compensate for functional deficits of the basal ganglia. 12
Methodological Concerns
In this study, we asked participants to perform their best for both the postural and suprapostural tasks. The limitation of this method would be that participants might set different priorities for these tasks. Especially, patients with PD might tend to prioritize the suprapostural task inappropriately in dual-task situations.44,45 However, the ERP findings revealed that the PD group recruited more attentional resources for both tasks simultaneously in the force-feedback condition, indicating participants did not devote their attentional resources to one specific task or give up on any task.
Conclusion
Postural feedback in the dual-task paradigm was beneficial for improving postural stability among healthy adults but provided limited information for patients with PD. The patients with PD had better dual-task performance with provision of supraposture visual feedback compared to posture visual feedback. In contrast to the concept of limited attentional capacity, our findings imply that the attentional resources of the patients with PD are relatively intact. With appropriate visual feedback, such as supraposture visual feedback, patients with PD could enhance suprapostural accuracy and keep postural balance through increasing the recruitment of attentional resources. Optimal dual-task intervention for patients with PD should not only foster balance training but also promote cortical resource recruitment by appropriate visual feedback.
Supplemental Material
Supplementary_Appendix – Supplemental material for Attentional Resource Associated With Visual Feedback on a Postural Dual Task in Parkinson’s Disease
Supplemental material, Supplementary_Appendix for Attentional Resource Associated With Visual Feedback on a Postural Dual Task in Parkinson’s Disease by Shu-Han Yu, Ruey-Meei Wu and Cheng-Ya Huang in Neurorehabilitation and Neural Repair
Supplemental Material
Supplementary_Fig_1 – Supplemental material for Attentional Resource Associated With Visual Feedback on a Postural Dual Task in Parkinson’s Disease
Supplemental material, Supplementary_Fig_1 for Attentional Resource Associated With Visual Feedback on a Postural Dual Task in Parkinson’s Disease by Shu-Han Yu, Ruey-Meei Wu and Cheng-Ya Huang in Neurorehabilitation and Neural Repair
Supplemental Material
Supplementary_Fig_2 – Supplemental material for Attentional Resource Associated With Visual Feedback on a Postural Dual Task in Parkinson’s Disease
Supplemental material, Supplementary_Fig_2 for Attentional Resource Associated With Visual Feedback on a Postural Dual Task in Parkinson’s Disease by Shu-Han Yu, Ruey-Meei Wu and Cheng-Ya Huang in Neurorehabilitation and Neural Repair
Supplemental Material
Supplementary_Fig_3 – Supplemental material for Attentional Resource Associated With Visual Feedback on a Postural Dual Task in Parkinson’s Disease
Supplemental material, Supplementary_Fig_3 for Attentional Resource Associated With Visual Feedback on a Postural Dual Task in Parkinson’s Disease by Shu-Han Yu, Ruey-Meei Wu and Cheng-Ya Huang in Neurorehabilitation and Neural Repair
Footnotes
Acknowledgements
The authors would like to thank the staff of the Centre for Parkinson and Movement Disorder at National Taiwan University Hospital for their kind assistance in recruitment of participants.
Trial Registration
Clinical Trial Registration No. NCT02539446.
Declaration of Conflicting Interests
The author(s) declared no potential conflicts of interest with respect to the research, authorship, and/or publication of this article.
Funding
The author(s) disclosed receipt of the following financial support for the research, and/or publication of this article: This work was supported by a grant from the Ministry of Science and Technology, ROC Taiwan (Grant No. MOST 106-2314-B-002-045-MY2).