
Abstract
Background and objective. Spontaneous neurological recovery after stroke is a poorly understood process. The aim of the present article was to test the proportional recovery model for the upper extremity poststroke and to identify clinical characteristics of patients who do not fit this model. Methods. A change in the Fugl-Meyer Assessment Upper Extremity score (FMA-UE) measured within 72 hours and at 6 months poststroke served to define motor recovery. Recovery on FMA-UE was predicted using the proportional recovery model: ΔFMA-UEpredicted = 0.7·(66 − FMA-UEinitial) + 0.4. Hierarchical cluster analysis on 211 patients was used to separate nonfitters (outliers) from fitters, and differences between these groups were studied using clinical determinants measured within 72 hours poststroke. Subsequent logistic regression analysis served to predict patients who may not fit the model. Results. The majority of patients (~70%; n = 146) showed a fixed proportional upper extremity motor recovery of about 78%; 65 patients had substantially less improvement than predicted. These nonfitters had more severe neurological impairments within 72 hours poststroke (P values <.01). Logistic regression analysis revealed that absence of finger extension, presence of facial palsy, more severe lower extremity paresis, and more severe type of stroke as defined by the Bamford classification were significant predictors of not fitting the proportional recovery model. Conclusions. These results confirm in an independent sample that stroke patients with mild to moderate initial impairments show an almost fixed proportional upper extremity motor recovery. Patients who will most likely not achieve the predicted amount of recovery were identified using clinical determinants measured within 72 hours poststroke.
Keywords
Introduction
Spontaneous neurological recovery is a central, yet neglected topic in stroke rehabilitation. It is a prime confounder in understanding the real impact of new early applied rehabilitative interventions in addition to usual care.1,2 Longitudinal regression analysis of change scores suggests that most of the improvements in motor function are predominantly defined in the first 10 to 12 weeks poststroke.2-4 Recovery in terms of Fugl-Meyer Assessment (FMA) scores reflecting movement synergies is often considered indicative of “restitution”5,6 or “true neurological recovery” in the first months poststroke. 7
Prabhakaran et al 8 suggested that the amount of spontaneous motor recovery of the paretic upper extremity is relatively fixed and accounts for approximately 70% of patients’ maximal potential recovery. Accordingly, patients with severe initial upper extremity impairment may have greater change scores on the FMA than patients with mild initial upper extremity impairment. 9 Detailed analysis revealed that 7 out of 41 patients displayed significantly less motor recovery after 3 or 6 months than predicted. 8 Unfortunately, this small sample did not allow for identifying clinical factors characterizing these poor recoverers. These factors would be useful within clinical practice to improve prediction and provide focused and personalized rehabilitation. The first objective of the present study was, therefore, to test the model for proportional motor recovery of the paretic upper extremity 8 in an independent sample of patients after a first-ever ischemic stroke when measured within 72 hours poststroke. The second objective was to identify the clinical characteristics of those patients who do not show the predicted amount of motor recovery.
Materials and Methods
Recruitment
From March 2007 till July 2010, patients were recruited for the prospective cohort study entitled Early Prediction of functional Outcome after Stroke (EPOS).10;11 All patients received solely usual care according to evidence-based stroke guidelines for physical therapists. 12 The ethics committees of all participating hospitals approved the study. Patients were included when they met the following criteria: (1) first-ever ischemic anterior circulation stroke, including anterior or middle cerebral artery stroke; (2) premorbid Barthel Index of ≥19; (3) at least 18 years of age; (4) no severe deficits of communication or memory; (5) hemiparesis within 72 hours after stroke onset; and (6) written informed consent. Additionally, for the present study, only patients with a FMA Upper Extremity (FMA-UE) score <66 points within 72 hours poststroke were eligible for analysis.
Measurements
Patients’ baseline characteristics were assessed within 72 hours poststroke. These included age, sex, treatment with recombinant tissue plasminogen activator (rt-PA), hemisphere of stroke, time between stroke and first assessment, comorbidities (Cumulative Illness Rating Scale 13 ), severity of stroke (Bamford Classification 14 ), neurological examination (National Institutes of Health Stroke Scale, NIHSS 15 ), upper and lower extremity motor function using the Motricity Index, 16 and FMA. 17
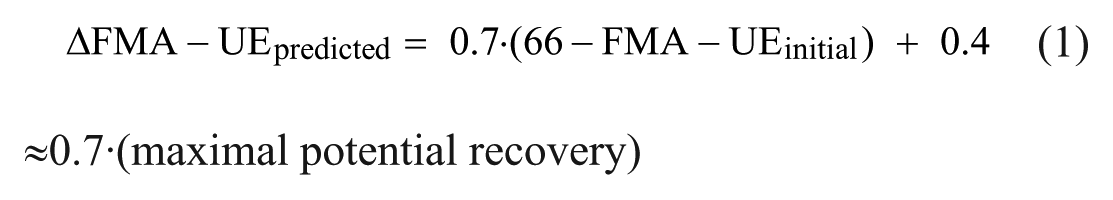
Initial upper extremity impairment (within 72 hours after stroke) and motor function at 6 months poststroke were assessed by the FMA-UE, 17 a sensitive, reliable, and valid measure of recovery at the impairment level.18-20 The difference between the initial and 6-month FMA-UE scores (ΔFMA-UEobserved = FMA-UE6 months − FMA-UEinitial) was used to estimate motor recovery. In the proportional recovery model (Equation 1) developed by Prabhakaran et al 8 to predict recovery stroke patients are expected to achieve approximately 70% of the difference between their initial FMA-UE score and the maximum attainable score at 6 months poststroke, according to the following equation:
Statistics
Groups were classified using a hierarchical clustering 21 based on average pairwise Mahalanobis distances (Matlab’s Statistics toolbox, version 8.1, Matlab version 2013a, Mathworks Inc, Natwick, MA). Note that the Mahalanobis distance is closely related to Pearson’s correlation measure, rendering its use for the current data set justifiable. A fixed cutoff served to separate clusters. The resulting goodness of fit was determined via the cophenetic correlation coefficient between the cophenetic distance obtained from the dendrogram and the Euclidean distance within the original (unmodeled) data, and the Spearman correlation coefficient between Mahalanobis and cophenetic distances.
Comparisons between the fitters and nonfitters were made using baseline characteristics measured within 72 hours poststroke. The assumption of normality was tested by visual inspection of the histogram and box plot, and by the Kolmogorov-Smirnoff test to confirm visual plot analysis. The Levene’s test was used to test for homogeneity of variance. Thereafter, categorical data were assessed using Pearson’s χ2 test, parametric data using the independent t test, and nonparametric data using the Mann-Whitney U test (2-tailed significance level of .05).
Bivariable logistic regression analysis was used as preselection for the multivariable logistic regression analysis with a dichotome outcome (0 = fitters and 1 = nonfitters). Candidate determinants were selected on the basis of previous studies.10,22 Subsequent dichotomization into 0 or 1 was based on clinical grounds and/or previous literature, with 1 indicating a poor score on the test—that is, more severe neurological deficit or greater motor impairment. Odds ratios and confidence intervals (95% CIs) were calculated, and candidate determinants were selected when P < .10 (Wald test). Consecutive collinearity diagnostics using 2-way contingency tables was applied between candidate determinants. If the ϕ correlation coefficient was ≥0.8, we chose to exclude the determinant with the lower Wald statistic from further analysis.
The probabilities of not fitting the recovery model were derived from multivariable logistic regression analysis using a backward stepwise approach (entry criteria: P ≤ .05; removal criteria: P ≥ .10). A forward stepwise approach was used to test the stability of the model because of the large number of determinants relative to the number of patients within the study (entry criterion: P ≤ .05; removal criterion: P ≥ .10). The Hosmer-Lemeshow test and the c-statistic (ie, area under the receiver operating characteristic curve) were used to quantify the goodness of fit of the logistic regression model. Finally, sensitivity, specificity, positive predictive value (PPV), and negative predictive value (NPV), including the corresponding 95% CIs, were calculated using 2-way contingency tables. All statistical assessments were performed using SPSS (version 20).
Results
A group of 211 patients with a first-ever ischemic hemispheric stroke were eligible for analysis, out of a total of 275 patients in the EPOS study (see flow chart in Figure 1). Figure 2A shows the predicted versus the observed ΔFMA-UE scores. Hierarchical clustering yielded 2 clusters containing N1 = 146 and N2 = 65 samples, respectively, using c = 2.194 as cutoff. This clustering came with a goodness of fit of 85%. The cophenetic correlation coefficient 23 and the Spearman correlation coefficient between the Mahalanobis and cophenetic distances were 0.95 and 0.76, respectively. The resulting dendrogram is depicted in Figure 2B.
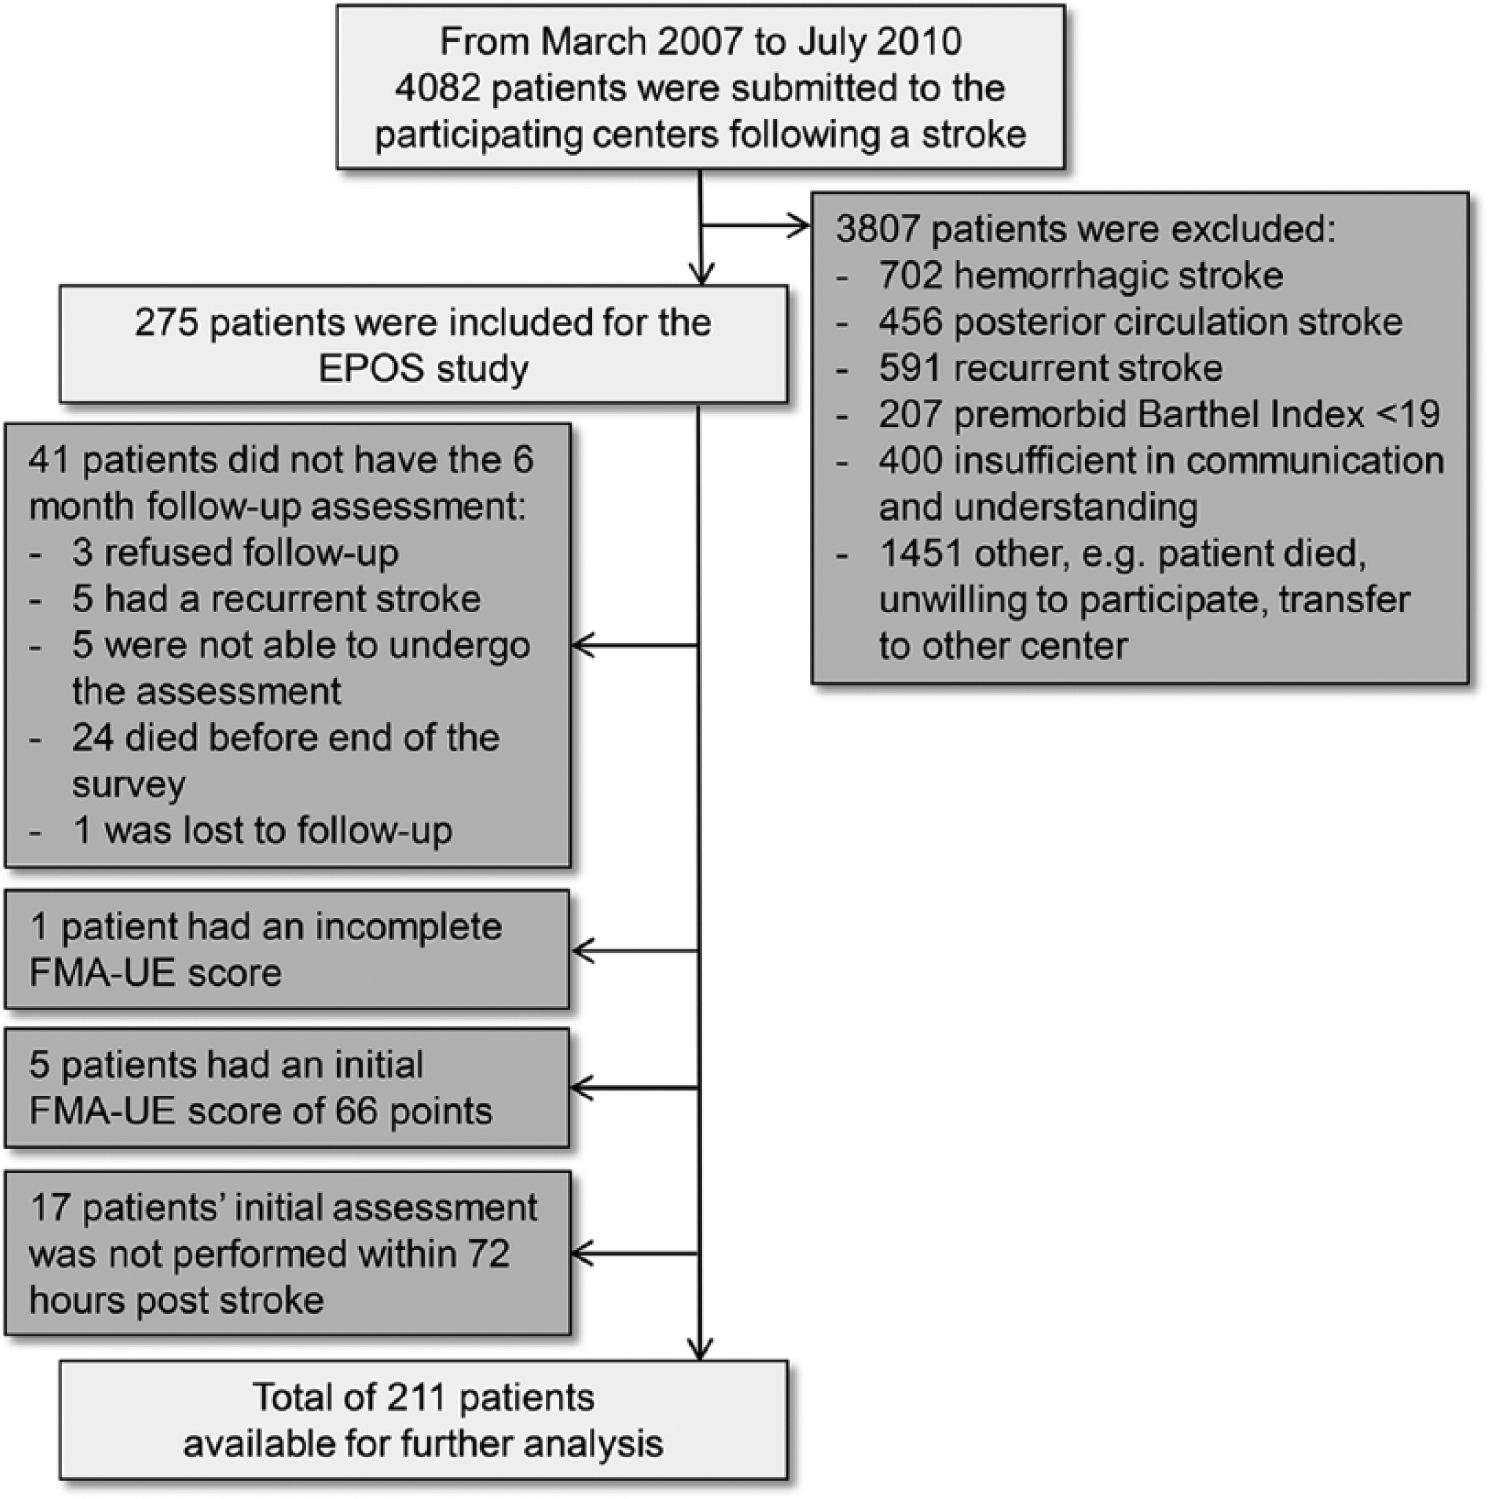
Patient exclusion flowchart.
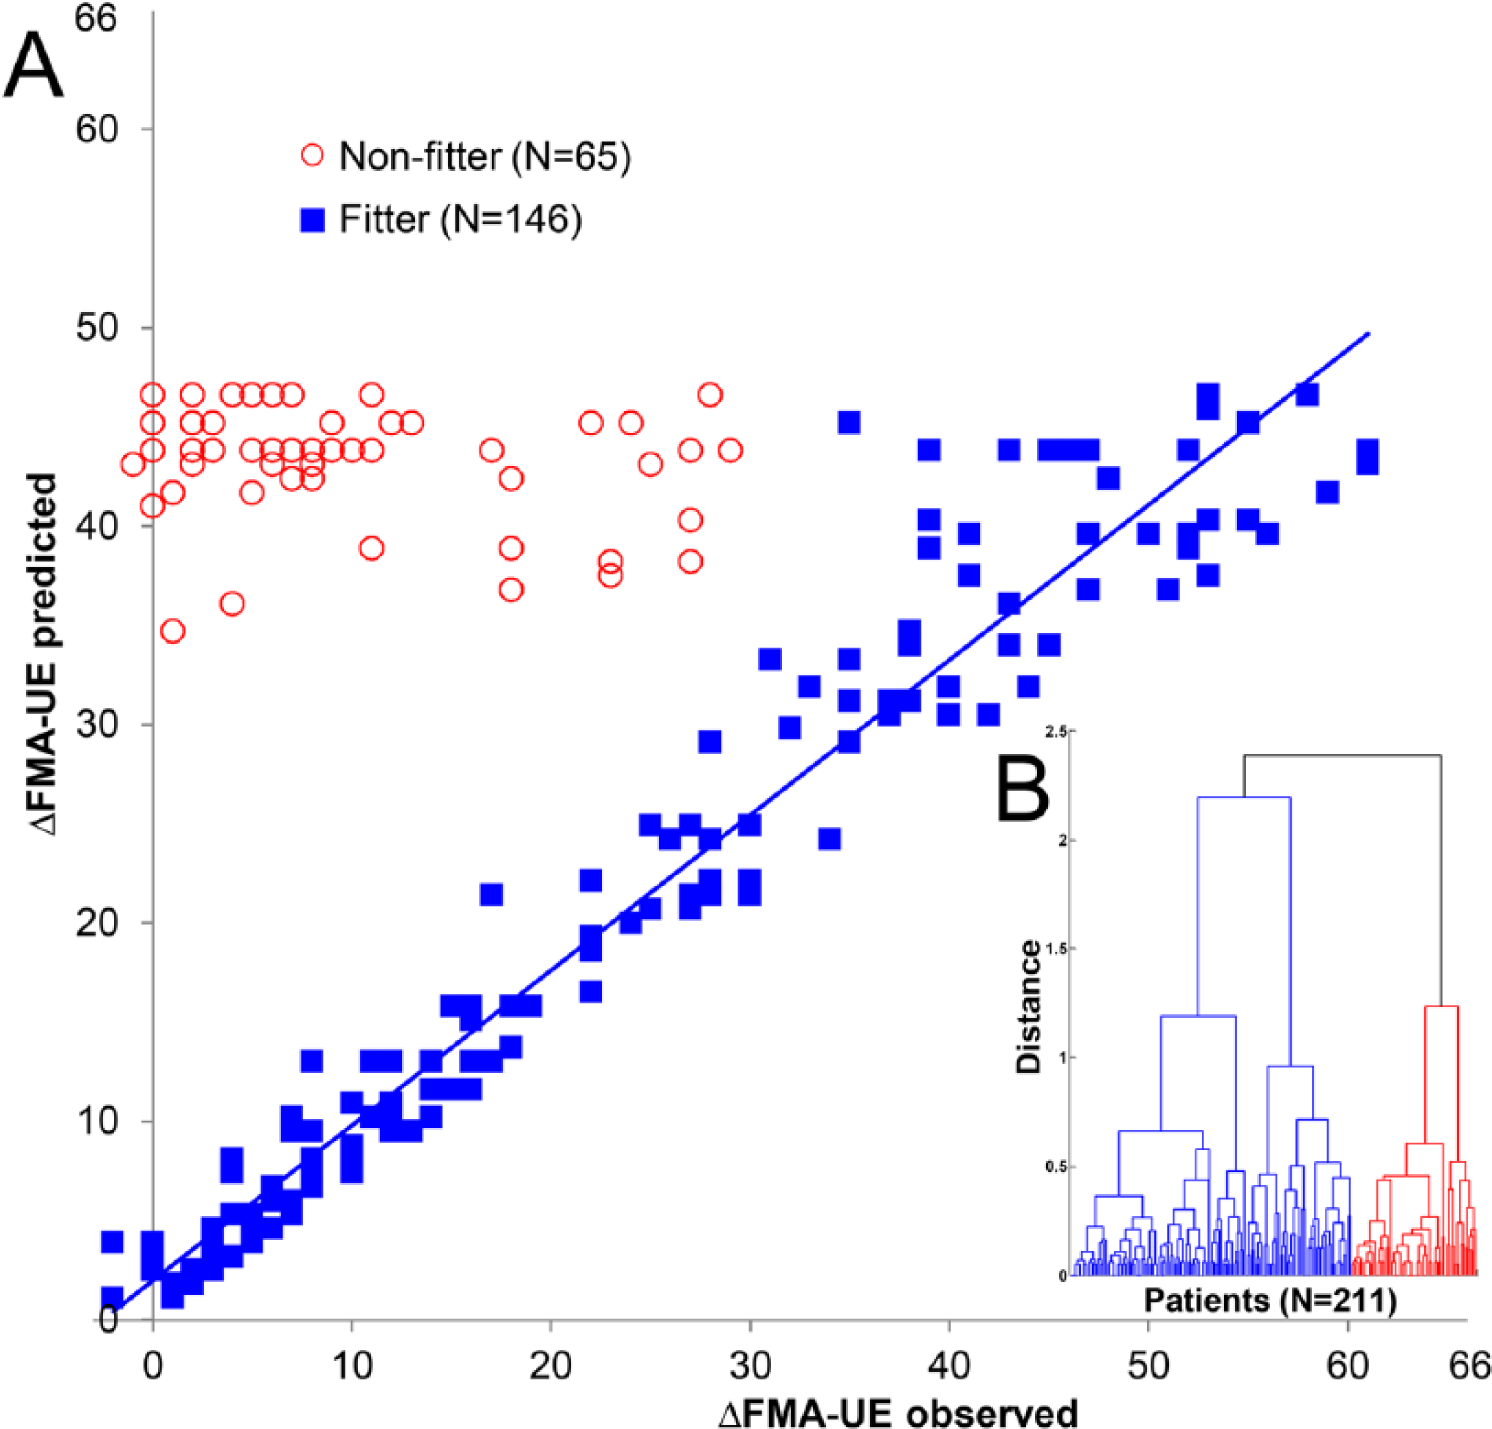
Proportional motor improvement in the upper extremity: predicted versus observed ΔFMA-UE. (A) ■Represents the fitters (n = 146) and ○the subgroup of patients who did not fit the model—that is, nonfitters (n = 65). The blue line represents the least-squares regression line of the fitters: ΔFMA-UEpredicted = 1.99 + 0.78⋅ΔFMA-UEobserved (R = 0.97; R2 = 0.94). (B) Dendrogram for hierarchical clustering using Mahalanobis distances. Goodness of fit = 85%; cophenetic correlation coefficient = 0.95; Spearman correlation between Mahalanobis and cophenetic distance = 0.76; distance-based cutoff = 2.194.
Within the subgroup of nonfitters (n = 65), the baseline FMA-UE ranged from 0 to 17 points, and the observed median ΔFMA-UE (7.00; interquartile range [IQR] = 2.00-15.00) was approximately 84% lower than the predicted ΔFMA-UE (43.80; IQR = 42.40-45.20; P < .001). The fitters, on the other hand, had a 3-point higher observed median ΔFMA-UE than predicted (observed = 20.50, IQR = 7.00-39.25; predicted = 17.55, IQR = 7.40-34.00; P < .001). Baseline FMA-UE of the fitters ranged from 0 to 65 points. The proportional motor recovery of the paretic upper extremity was 78.2% (±31.6%) in the group of fitters (ΔFMA-UEobserved = 78%·(66 − FMA-UEinitial).
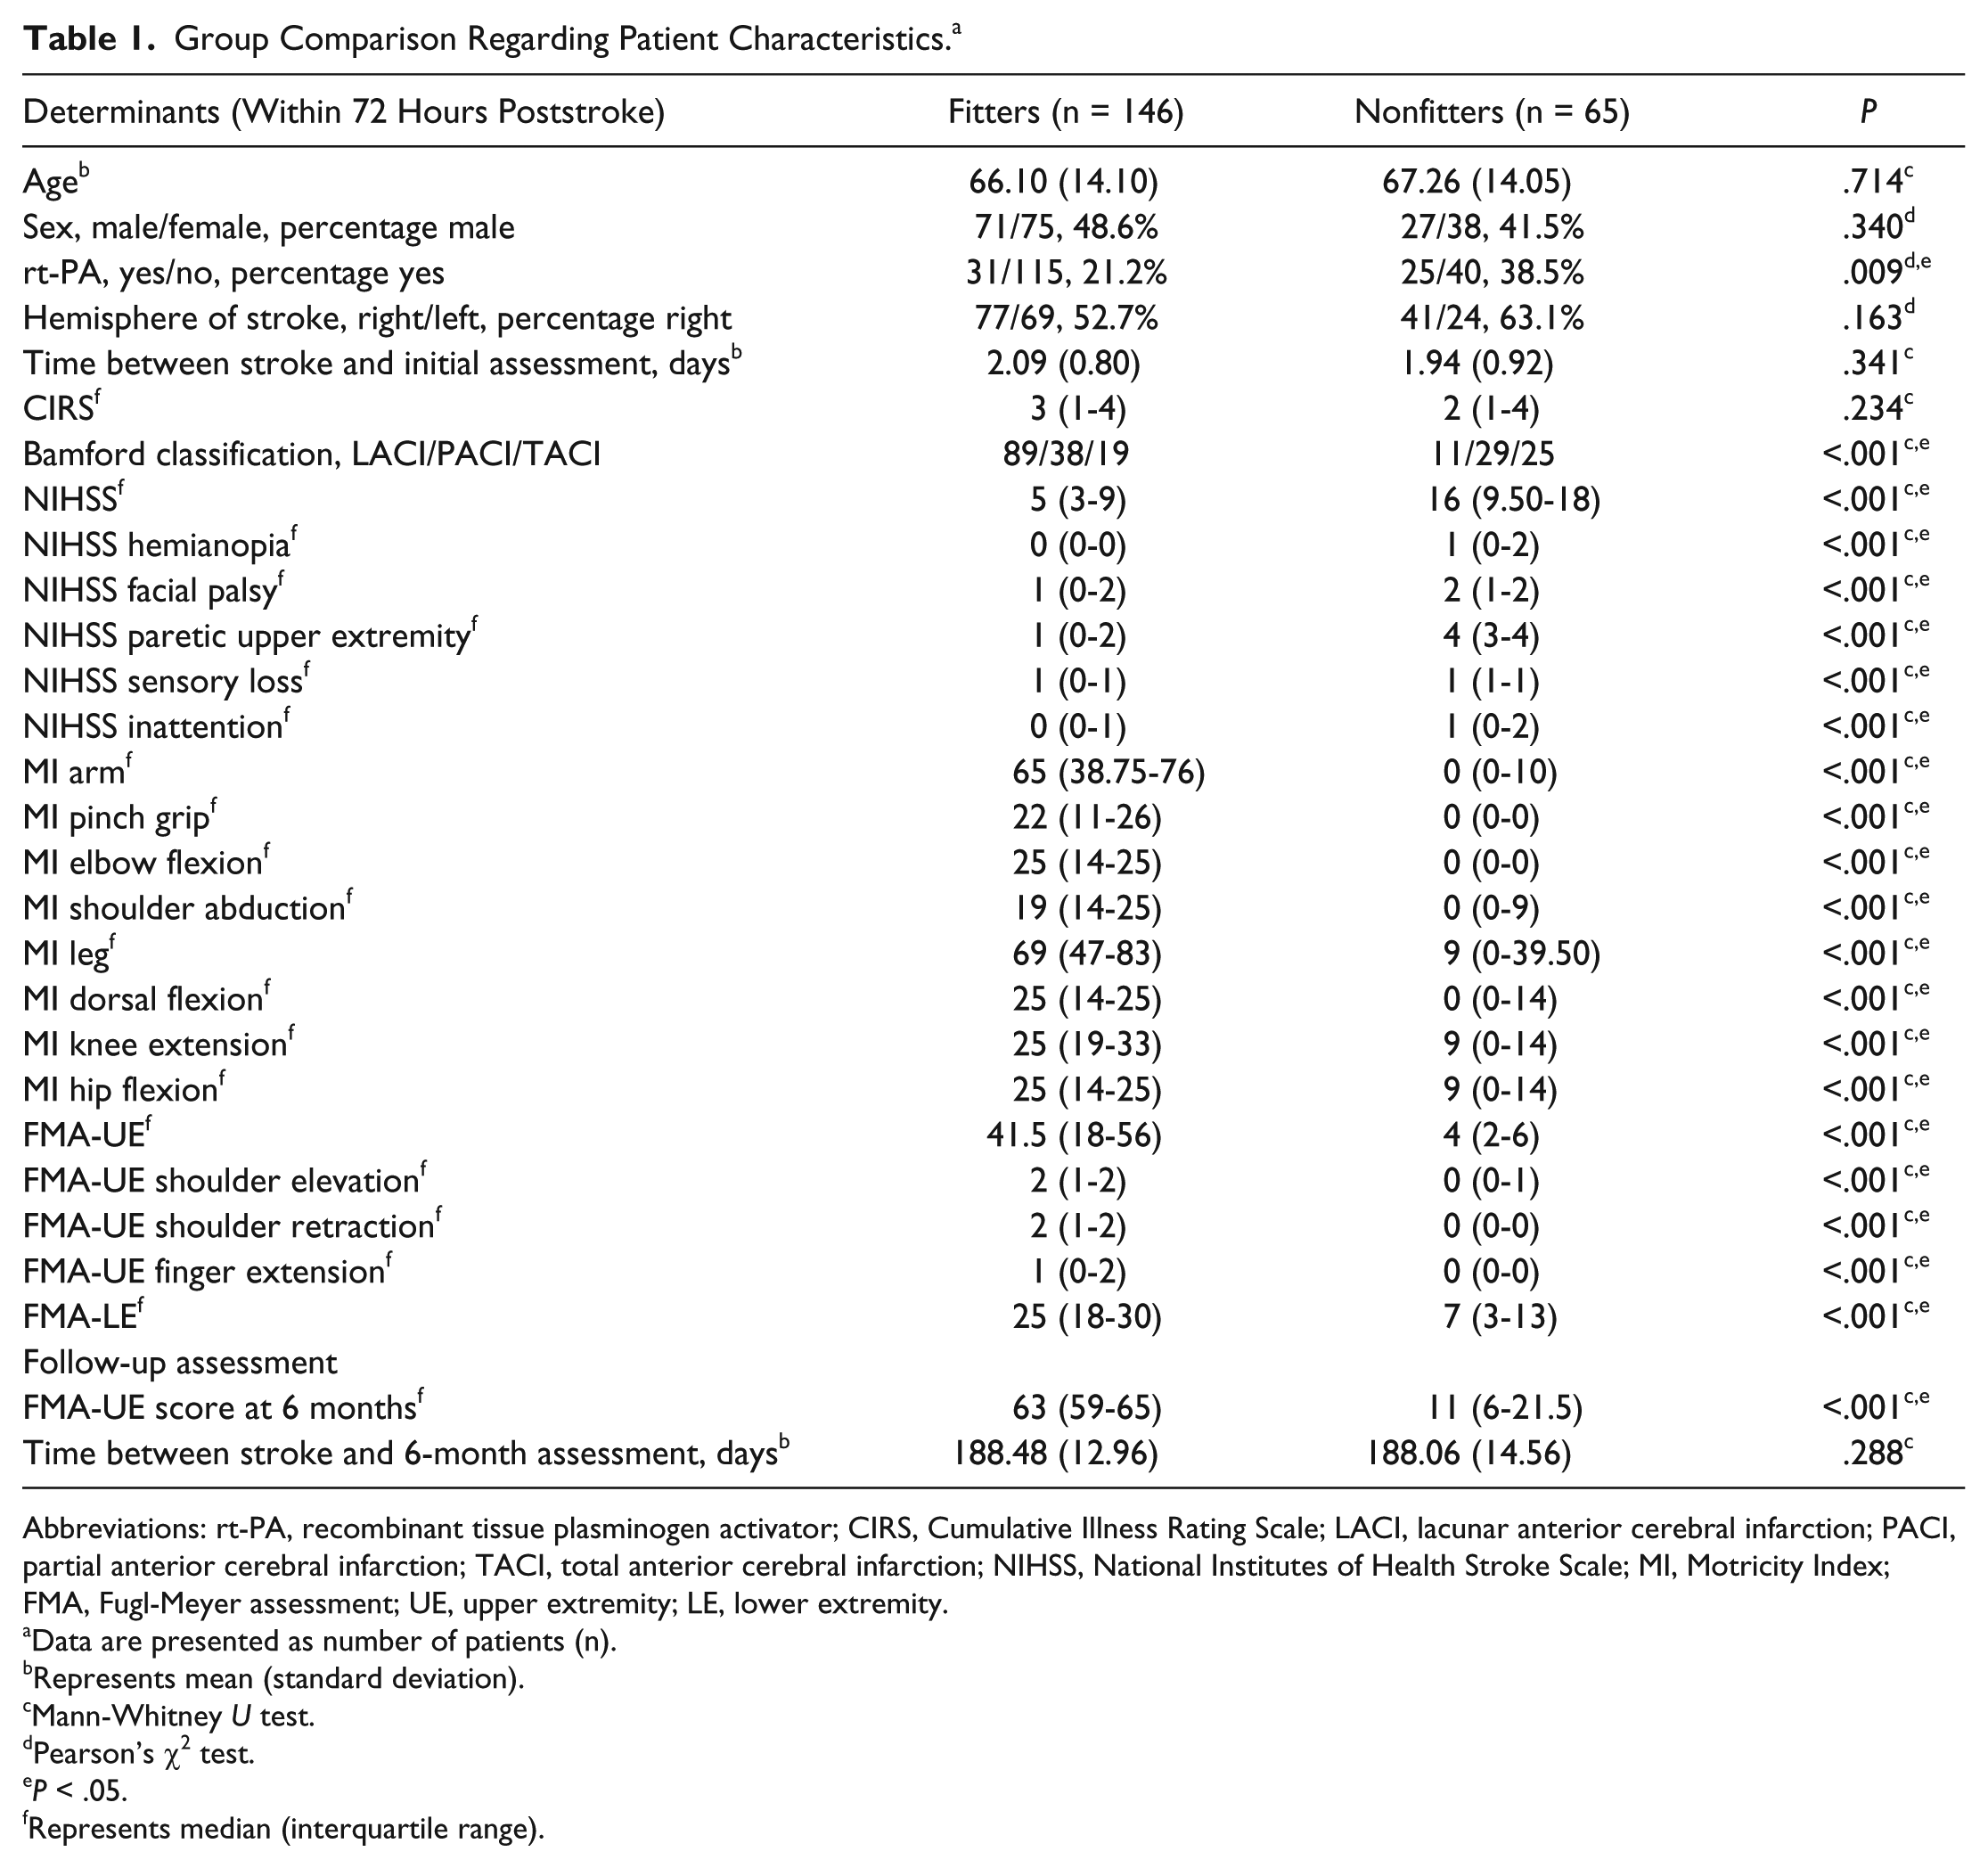
Within 72 hours poststroke, the nonfitters had significantly lower upper and lower extremity motor function scores, displayed more neurological deficits as measured with the NIHSS, were more often treated with rt-PA, and more often had total or partial anterior cerebral infarctions than lacunar anterior cerebral infarctions, in comparison with the fitters (P values <.01; Table 1). No statistically significant differences at baseline were found between the nonfitters and fitters regarding age, sex, hemisphere of stroke, time between stroke and initial assessment, or comorbidities. At 6 months poststroke, nonfitters had significantly lower upper extremity motor function scores (P < .01) in comparison to the fitters. The time between stroke onset and the follow-up assessment did not differ significantly between groups.
Group Comparison Regarding Patient Characteristics. a
Abbreviations: rt-PA, recombinant tissue plasminogen activator; CIRS, Cumulative Illness Rating Scale; LACI, lacunar anterior cerebral infarction; PACI, partial anterior cerebral infarction; TACI, total anterior cerebral infarction; NIHSS, National Institutes of Health Stroke Scale; MI, Motricity Index; FMA, Fugl-Meyer assessment; UE, upper extremity; LE, lower extremity.
Data are presented as number of patients (n).
Represents mean (standard deviation).
Mann-Whitney U test.
Pearson’s χ2 test.
P < .05.
Represents median (interquartile range).
Table 2 summarizes the results of the bivariable logistic regression analyses. Strong collinearity was found between elbow flexion and shoulder abduction (ϕ = 0.89; P < .001), and consequently, shoulder abduction was excluded from further analysis. Backward stepwise logistic regression analysis showed that patients who displayed (1) no finger extension (FMA-UE), (2) presence of facial palsy (NIHSS), (3) severe impairment of lower extremity motor function (FMA Lower Extremity), and (4) total or partial anterior cerebral infarction (Bamford classification) within 72 hours poststroke were likely not to show the predicted proportional motor recovery (Tables 3 and 4). The sensitivity of the model was 0.80 (95% CI = 0.68-0.89), and the specificity was 0.89 (95% CI = 0.83-0.94), whereas the PPV and NPV were, respectively, 0.76 (95% CI = 0.65-0.86) and 0.91 (95% CI = 0.85-0.95). These results were confirmed by forward stepwise analysis.
Candidate Determinants Measured Within 72 Hours Poststroke Associated With Not Fitting the Maximal Potential Recovery Model. a
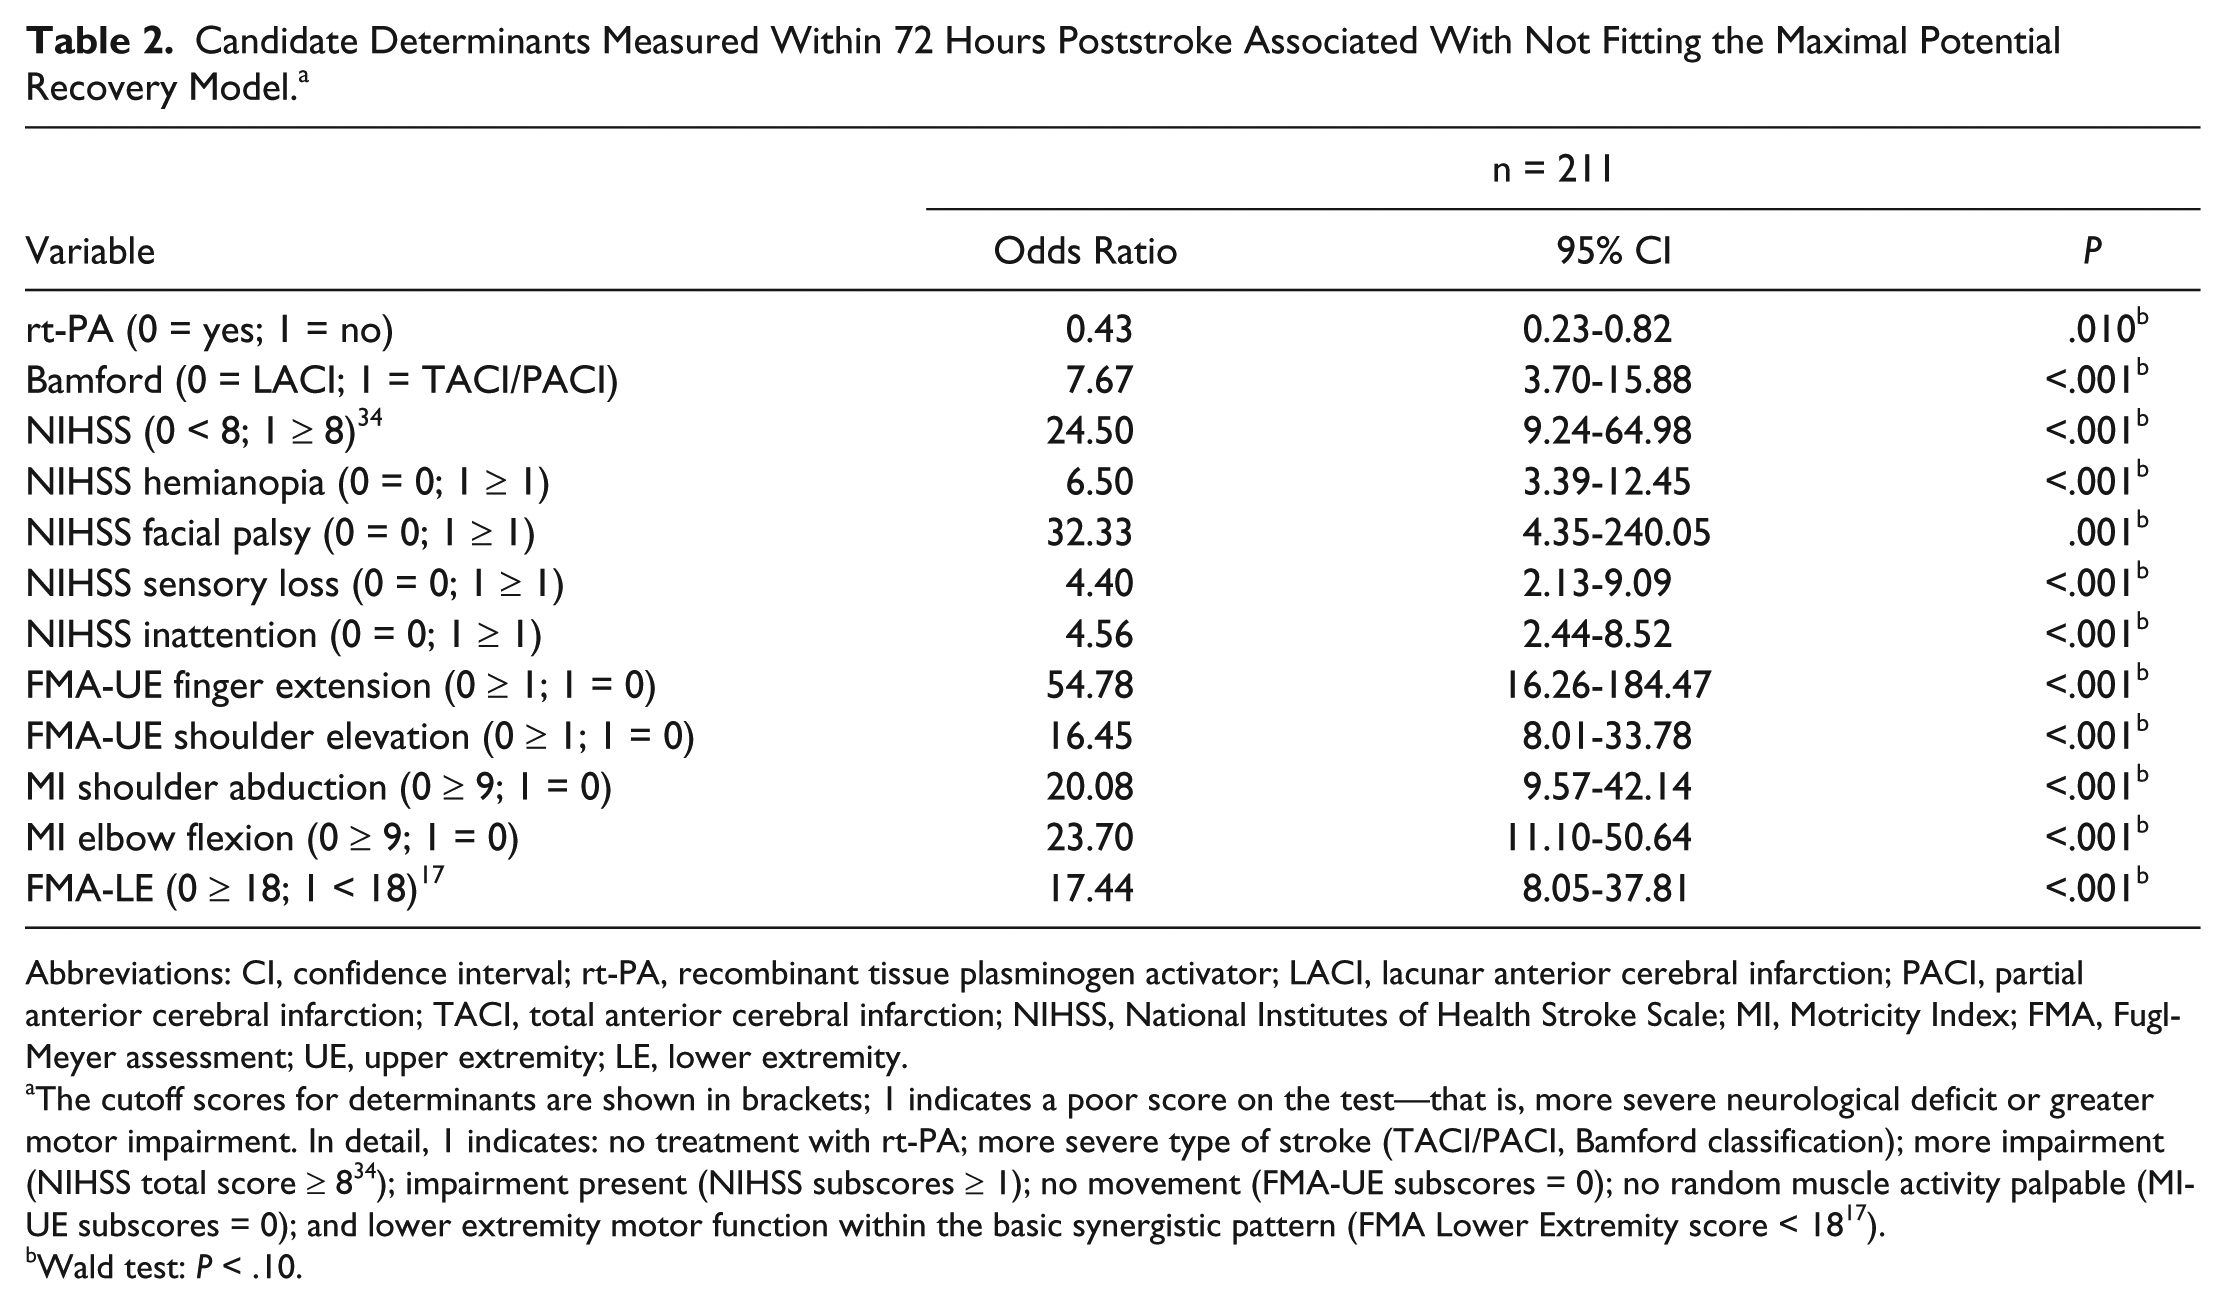
Abbreviations: CI, confidence interval; rt-PA, recombinant tissue plasminogen activator; LACI, lacunar anterior cerebral infarction; PACI, partial anterior cerebral infarction; TACI, total anterior cerebral infarction; NIHSS, National Institutes of Health Stroke Scale; MI, Motricity Index; FMA, Fugl-Meyer assessment; UE, upper extremity; LE, lower extremity.
The cutoff scores for determinants are shown in brackets; 1 indicates a poor score on the test—that is, more severe neurological deficit or greater motor impairment. In detail, 1 indicates: no treatment with rt-PA; more severe type of stroke (TACI/PACI, Bamford classification); more impairment (NIHSS total score ≥ 8 34 ); impairment present (NIHSS subscores ≥ 1); no movement (FMA-UE subscores = 0); no random muscle activity palpable (MI-UE subscores = 0); and lower extremity motor function within the basic synergistic pattern (FMA Lower Extremity score < 18 17 ).
Wald test: P < .10.
Predictor Determinants Included in the Final Logistic Prediction Model. a
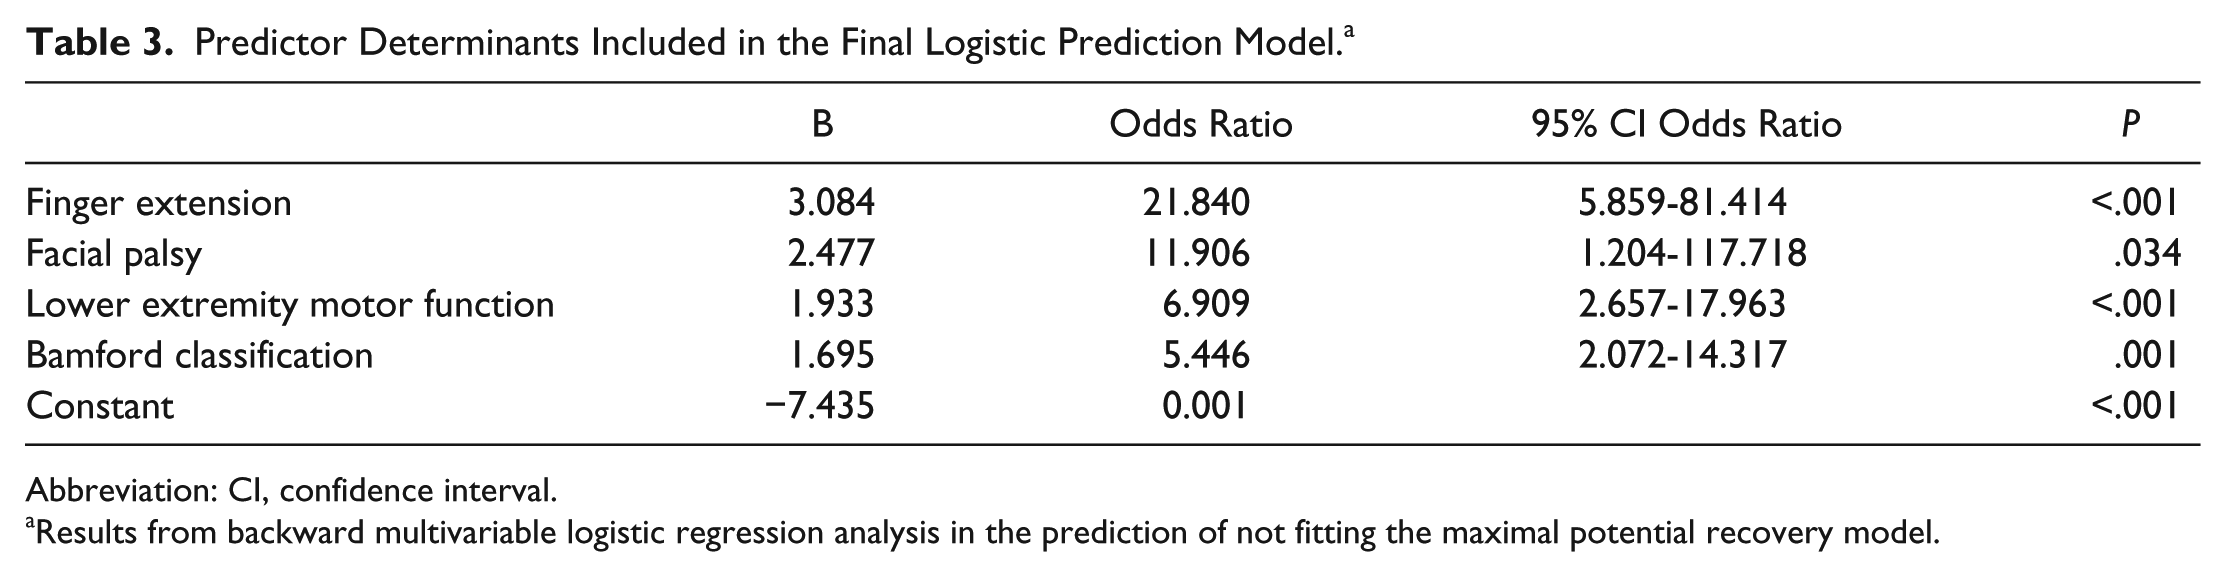
Abbreviation: CI, confidence interval.
Results from backward multivariable logistic regression analysis in the prediction of not fitting the maximal potential recovery model.
Probabilities of Not Fitting the Maximal Potential Recovery Model. a
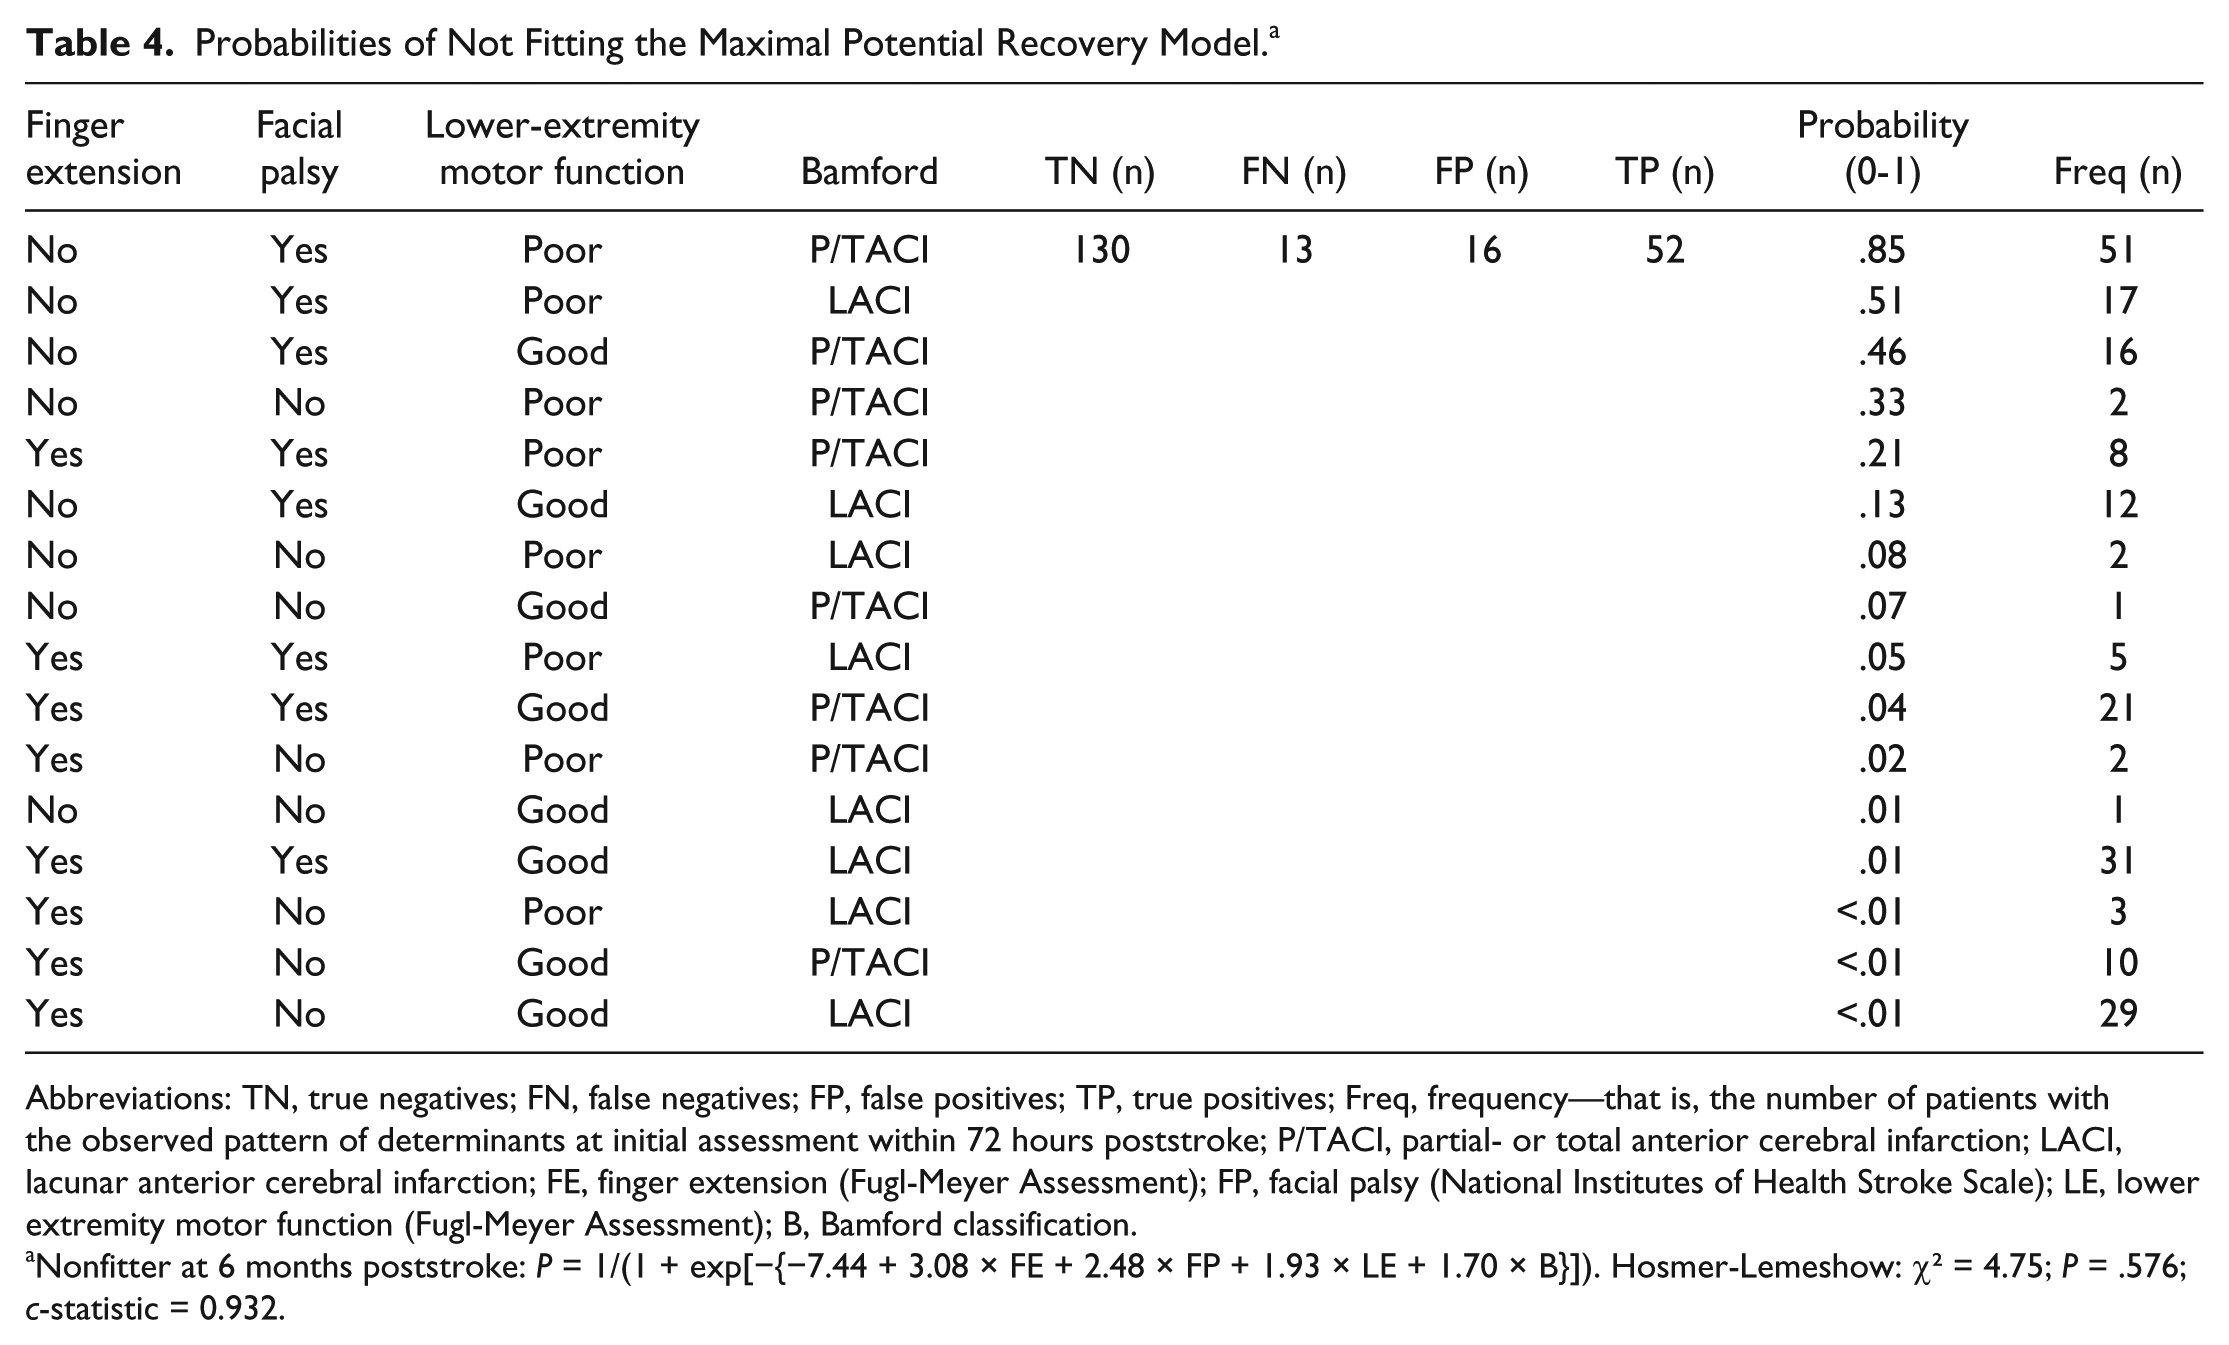
Abbreviations: TN, true negatives; FN, false negatives; FP, false positives; TP, true positives; Freq, frequency—that is, the number of patients with the observed pattern of determinants at initial assessment within 72 hours poststroke; P/TACI, partial- or total anterior cerebral infarction; LACI, lacunar anterior cerebral infarction; FE, finger extension (Fugl-Meyer Assessment); FP, facial palsy (National Institutes of Health Stroke Scale); LE, lower extremity motor function (Fugl-Meyer Assessment); B, Bamford classification.
Nonfitter at 6 months poststroke: P = 1/(1 + exp[−{−7.44 + 3.08 × FE + 2.48 × FP + 1.93 × LE + 1.70 × B}]). Hosmer-Lemeshow: χ2 = 4.75; P = .576; c-statistic = 0.932.
Discussion
The present study investigated the predictability of spontaneous motor recovery (ie, proportional recovery) in a group of first-ever ischemic hemispheric stroke patients by testing the proportional recovery model of Prabhakaran et al 8 and aimed to identify the clinical characteristics of those patients who do not show the expected amount of motor recovery.
We found that the amount of upper extremity motor recovery was an almost fixed proportion, accounting for approximately 78% of the total possible change. This fixed proportion of spontaneous neurological change was particularly observed in those patients with a mild to moderate neurological deficit within 72 hours after stroke, which was the majority of patients in our population (n = 146; ~70%). Our findings confirm the results of Prabhakaran et al 8 considering that the majority of their mild to moderately impaired stroke patients showed a fixed amount of about 70% spontaneous motor recovery after stroke. 8 The presence of a fixed proportional recovery after stroke is not unique to synergistic motor recovery but has also been found for speech. Lazar et al 24 reported that the improvement in aphasia scores following ischemic stroke was also fixed, and the change in the Western Aphasia Battery score achieved at 3 months poststroke was 73% of patients’ maximal potential recovery. Although their study was performed in a small sample of 21 stroke patients, this proportional recovery may be generic and could be applicable to other impairments.
The patients who did not follow the proportional recovery model in the present study (ie, nonfitters; ~30% of the total group) had an initial low FMA-UE score ranging from 0 to 17 points and were characterized by larger strokes, according to the Bamford classification, and more motor impairment in terms of absence of finger extension, presence of facial palsy, and more-impaired lower extremity motor function (FMA-LE < 18) within 72 hours poststroke. The reasons why these patients show less spontaneous neurological improvement than predicted remains unknown. One hypothesis is that changes in the integrity of the corticospinal tract as a result of ischemia are associated with the size of the lesion and with processes involving recovery of neuronal networks in salvaged penumbral tissue after reperfusion 25 or with alleviation of diaschisis 26 and homeostatic neuroplasticity in the first weeks poststroke.5,27 Zarahn et al 28 further investigated those patients who showed limited proportional change in upper extremity motor function measured with the FMA (ie, nonfitters). Note that part of their patient population consisted of patients from the study of Prabhakaran et al. 8 Zarahn et al 28 reported that adding functional magnetic resonance imaging task-related brain activation patterns (during hand closure task) to the prediction did not significantly improve the accuracy of prediction of recovery. This latter finding might suggest that early assessment of brain activation patterns detected by associated changes in blood flow within 48 hours has limited value in predicting the reversibility of hypoperfused penumbral brain areas after acute stroke. 25
We note that the current study was subject to limitations. First, all patients received usual care according to evidence-based guidelines; however, the exact type and intensity of upper extremity therapy was not reported. Our patient population followed the (proportional) recovery model very well despite differences between rehabilitation services worldwide. 29 The added value of other factors, including rehabilitative therapy that may contribute to underlying spontaneous mechanisms of neurological recovery should be investigated. 30 Second, although the present study investigated proportional recovery of the upper extremity in the largest sample of stroke patients to date, the sample is still relatively small because the nonfitter group consisted of 65 patients. The CIs tend to give a less precise estimate of effects in smaller samples, which could explain the larger 95% CI around the odds ratios. Third, future studies should confirm the merits of the selected predictor determinants in the logistic regression model for the prediction of nonfitters before it could be useful within clinical practice. 31 Fourth, we did not include direct measurements of lesion volume but used the Bamford classification as an indication of stroke severity.14,32 Infarct size alone and concomitant injury to cortical and/or subcortical structures involved in recovery may offer further explanation of the divergent pattern in the nonfitter group. Further work should, therefore, try to include these imaging covariates. Fifth, the proportional motor recovery model may not be suitable for mildly affected patients with high baseline FMA scores because of the known ceiling effect of the FMA. 20 Also, results cannot be readily generalized to the wide-ranging stroke population because our study sample included only patients with a first-ever ischemic stroke who were oriented and able to communicate.
The current study does underpin the importance of previous ideas regarding (proportional) motor recovery8,24,28 and provides clinical markers to identify those patients who are likely not to achieve the predicted amount of spontaneous neurological recovery in the first 6 months after stroke. Clinically, the proportional motor recovery model may be used as a tool to guide the choice for therapy. The nonfitters have low potential to recover at the impairment level (FMA) and may be provided with arm-hand therapy focused on compensation strategies (ie, using alternative limbs and/or environmental adaptation). Alternatively, therapy for fitters may initially focus on improving function by reducing the impairment. Although model testing is an important step forward, it remains essential to investigate spontaneous neurological recovery from a neurophysiological perspective, including the regional disruption of the blood-brain barrier, which leads to vasogenic edema and hinders the reperfusion of noninfarcted oligemic and penumbral brain areas in the first days poststroke. 25 In addition, the added predictive value of transcranial magnetic stimulation for patients who do not show the expected proportional motor recovery requires further investigation. 33 Future studies should also further investigate this proportional recovery for visuospatial inattention and somatosensory deficits in order to gain insight into a possible common, yet poorly understood, mechanism for spontaneous neurological recovery after stroke.
Footnotes
Acknowledgements
The authors thank all Early Prediction of Functional Outcome After Stroke (EPOS) assessors at the stroke units of the participating university medical centers and local hospitals (Academic Medical Center Amsterdam; Erasmus Medical Center Rotterdam; Leiden University Medical Center; Radboud University Medical Center Nijmegen; University Medical Center Utrecht; VU University Medical Center Amsterdam; Amphia Hospital Breda; Diaconessen Hospital, Leiden; and Franciscus Hospital, Roosendaal) and in the associated nursing homes (Sint Jacob, Zonnehuis, and Cordaan/Berkenstede in Amsterdam; Laurens Antonius Binnenweg and Reumaverpleeghuis in Rotterdam; Albert van Koningsbruggen in Utrecht; and Wiekendaal in Roosendaal) for performing the measurements as well as the patients who participated in the study.
Declaration of Conflicting Interests
The authors declared no potential conflicts of interest with respect to the research, authorship, and/or publication of this article.
Funding
The authors disclosed receipt of the following financial support for the research, authorship, and/or publication of this article: The research leading to these results has received funding from the Royal Dutch Society of Physical Therapy, supported by the EXPLICIT-stroke grant from the Netherlands Organization for Health Research and Development (ZonMw; Grant No. 89000001) and the European Research Council under the European Union’s Seventh Framework Programme (FP/2007-2013)/ERC Grant Agreement no. 291339-4D-EEG. The funding organization had no role in the design or conduct of the study; the collection, management, analysis, or interpretation of the data; or the preparation, review, or approval of the manuscript.