
Abstract
Background. Understanding the factors that influence language recovery in aphasia is important for improving prognosis and treatment. Chronic comprehension impairments in Wernicke’s aphasia (WA) are associated with impairments in auditory and phonological processing, compounded by semantic and executive difficulties. This study investigated whether the recovery of auditory, phonological, semantic, or executive factors underpins the recovery from WA comprehension impairments by charting changes in the neuropsychological profile from the subacute to the chronic phase. Method. This study used a prospective, longitudinal observational design. Twelve WA participants with superior temporal lobe lesions were recruited 2 months post–stroke onset (2 MPO). Language comprehension was measured alongside a neuropsychological profile of auditory, phonological, and semantic processing and phonological short-term memory and nonverbal reasoning at 3 poststroke time points: 2.5, 5, and 9 MPO. Results. Language comprehension displayed a strong and consistent recovery between 2.5 and 9 MPO. Improvements were also seen for slow auditory temporal processing, phonological short-term memory, and semantic processing but not for rapid auditory temporal, spectrotemporal, and phonological processing. Despite their lack of improvement, rapid auditory temporal processing at 2.5 MPO and phonological processing at 5 MPO predicated comprehension outcomes at 9 MPO. Conclusions. These results indicate that recovery of language comprehension in WA can be predicted from fixed auditory processing in the subacute stage. This suggests that speech comprehension recovery in WA results from reorganization of the remaining language comprehension network to enable the residual speech signal to be processed more efficiently, rather than partial recovery of underlying auditory, phonological, or semantic processing abilities.
Introduction
Wernicke’s aphasia (WA) is a syndrome resulting in severe disruption to language production and comprehension. WA results from lesions to the left temporoparietal region,1-3 which supports a range of functions related to language comprehension, including auditory and phonological processing of the speech stream in the superior temporal lobe,4-7 semantic processing of lexical information in the middle temporal gyrus (MTG) and angular gyrus (AG),8-11 and short-term phonological memory relevant for syntactic comprehension in the supramarginal gyrus (SMG) and posterior superior temporal lobe.12-14 WA occurs in 20% of acute aphasia presentations but reduces to 5% by the chronic phase. 15 Despite this, persistent WA has proved resistant to therapeutic intervention.16,17 Detailed consideration of the evolution of neuropsychological processes during recovery from WA will increase our understanding of the mechanisms of poststroke plasticity in the left hemisphere language system and contribute to informing accurate prognosis and the development of effective rehabilitation.
The neuropsychological profile observed in chronic WA displays impairments that mirror the function of the left temporoparietal regions identified through neuroimaging studies (ie, auditory-phonological processing, phonological short-term memory, and semantics).2,18-20 The areas most consistently affected by lesions in WA are the left midposterior superior temporal gyrus (STG) and sulcus (STS) and underlying white matter.1,3,20 These regions are associated with the analysis of acoustic stimuli, including stimuli with relatively simple acoustic structures such as modulated tones, frequency sweeps, and harmonic stimuli21-23 as well as with the analysis of auditory-phonological information.24,25 Patients with chronic WA display impairments in detecting and analyzing auditory stimuli with all but the most simple acoustic structures (eg, pure tones) 19 and have severe difficulties in discriminating phonological differences in word and nonword stimuli.3,18 Importantly, we have previously demonstrated a direct link between auditory and phonological processing abilities and language comprehension,19,26 supporting the hypothesis that impaired speech comprehension in WA is a consequence of deficits in hierarchical auditory processing, leading to underspecified or noisy access to semantic information.27-29 Lesions in WA commonly spread beyond this core region into the MTG and/or AG, associated with a range of cognitive functions, including lexical and semantic processing.11,30 Concurrently, across the WA population, semantic processing is usually but not universally impaired. 3 Although no statistical relationship between semantic abilities and language comprehension has been documented in chronic WA, it is logical that semantic impairments compound the speech perception–based comprehension deficits. One further area frequently affected in WA is the SMG. Lesions to this region are associated with impairments of phonological encoding during speech production31,32; however, functional neuroimaging and lesion-symptom mapping indicate that the SMG and posterior STG are part of a network supporting auditory and phonological short-term memory,12,33,34 a cognitive function associated with the comprehension of sentence and discourse-level information. 35
At present, relatively little information exists concerning the cognitive neuropsychological profile of acute WA and how this evolves over time. Based on the neuropsychological profile observed in chronic WA it was hypothesized that recovery of comprehension in WA would be supported by the recovery or improvement of underlying cognitive functions, in particular auditory-phonological analysis known to affect comprehension at the chronic stage. More specifically, it was hypothesized that improved scores on auditory and phonological analysis tasks would precede or parallel improvements in language comprehension. To investigate this hypothesis, we present here the first longitudinal prospective neuropsychological study exploring the cognitive dynamics underpinning changes in WA-type comprehension impairments from the subacute through to the chronic stage.
Methods and Materials
Study Design
This study comprised a longitudinal cohort observational study. Participants with WA were recruited in the acute-subacute phase (0-2 months postonset [MPO]). Longitudinal neuropsychological assessments were undertaken 3 times at 2.5, 5, and 9 MPO. Ethical approval was granted by the NHS Research Ethics Committee (REC ref: 13/EE/0014); all participants gave written informed consent.
Study Setting
Participants were recruited from NHS in-patient services in the south of England with the support of local clinical and research teams. The recruitment period extended from April 2013 to February 2016. Following referral, participants were screened for eligibility and invited to take part in the study. All screening and data collection visits occurred in the participants’ homes. Data collection at each time point was done over multiple sessions (3 to 5, depending on the participant), and collection was completed within 2.5 weeks.
Participants
Participants were referred to the study by NHS research practitioners or speech and language therapists if they presented with any error on a single-word language comprehension screening assessment and any error on a single-word repetition screening assessment. Screening assessments were developed in-house for the purpose of the study. Participants or friends/relatives/carers provided written consent/assent for referral. A total of 24 participants were referred to the study of whom 17 were contactable and 12 fulfilled the inclusion and exclusion criteria and consented to participate. One participant (participant 7) was referred too late to be included in the first testing time point (2.5 MPO); all remaining participants took part in all testing time points. Participants were considered eligible for the study if they presented with the classical dimensions of WA—fluent speech, impaired comprehension, and impaired repetition—or if they displayed differential performance on spoken and written word comprehension assessments, with spoken comprehension being disproportionately impaired in comparison to written word comprehension, consistent with previous reports of WA. Screening assessment used the Boston Diagnostic Aphasia Examination (BDAE)—Short Form. 36 Although the phonological paraphasias that hallmark WA were not an inclusion criteria, these were nevertheless observed in all participants. Participants were excluded if there was a significant history of previous neurological disorder, including previous stroke, with the exception of TIAs.
Twelve individuals were recruited to the subacute group; 10 displayed classical WA at the point of recruitment, and 2 displayed a nonclassical profile with reduced fluency contributed to by severe apraxia of speech (participants 9 and 12). Table 1 presents an overview of participant demographics and neuroimaging. All participants were right-handed, with the exception of participant 2, and all participants were monolingual English speakers.
Participant Demographics. a
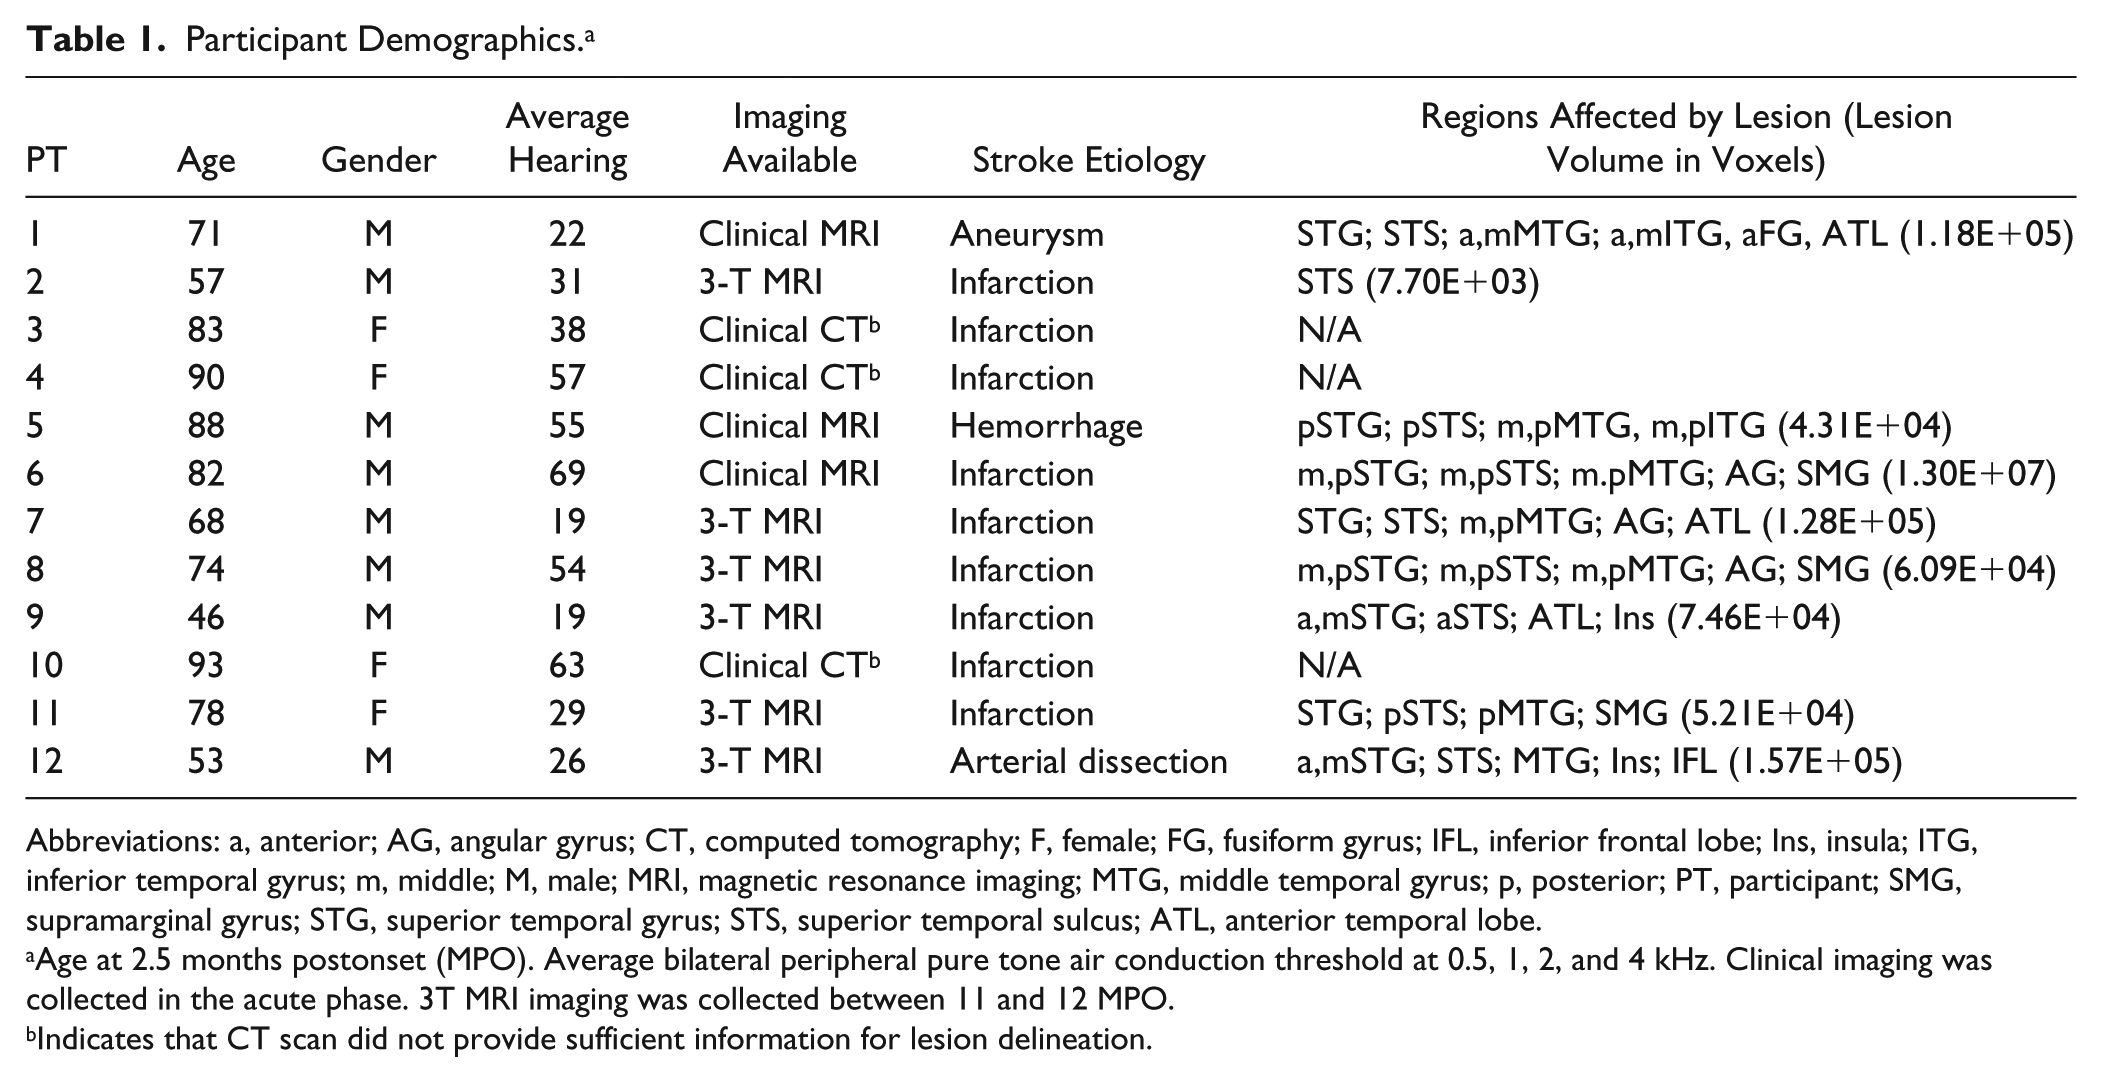
Abbreviations: a, anterior; AG, angular gyrus; CT, computed tomography; F, female; FG, fusiform gyrus; IFL, inferior frontal lobe; Ins, insula; ITG, inferior temporal gyrus; m, middle; M, male; MRI, magnetic resonance imaging; MTG, middle temporal gyrus; p, posterior; PT, participant; SMG, supramarginal gyrus; STG, superior temporal gyrus; STS, superior temporal sulcus; ATL, anterior temporal lobe.
Age at 2.5 months postonset (MPO). Average bilateral peripheral pure tone air conduction threshold at 0.5, 1, 2, and 4 kHz. Clinical imaging was collected in the acute phase. 3T MRI imaging was collected between 11 and 12 MPO.
Indicates that CT scan did not provide sufficient information for lesion delineation.
Participant Neuroimaging
Where possible, 3T MRI structural T1-w images were collected for lesion definition at the Centre for Integrative Neuroscience and Neurodynamics at the University of Reading. Data were collected on a GE ×750 3.0-T MRI Scanner with a 12-channel head coil. An MPRAGE sequence with 2 averages: 192 slices, 1 mm3 resolution, 250 mm FOV, TR 2020 ms, TE 302 ms, Inversion Time 900 ms. Clinical neuroimaging data (CT or MRI) were obtained for participants with significant contraindication to MRI or who declined an MRI scan. Three of these participants’ CT scans did not show any clear evidence of lesion and were not included in further imaging analysis.
Lesions were delineated manually using lesion drawing in native space on a slice-by-slice basis in MRIcron. 37 The SPM Clinical Toolbox 38 was used for scan and lesion normalization. Scans were normalized to a CT or MRI template using cost-function masking, and normalization parameters were subsequently applied to the native space lesion image. Subsequently, binary lesion images were compared with normalized scans, and modifications were made to the lesion images where necessary.
The lesion overlap map is displayed in Figure 1. Overall, the group displayed a relatively homogeneous lesion distribution, with high overlap in the white matter of the left superior temporal lobe. There was maximal overlap in the midposterior STG, high overlap in temporoparietal junction regions (STS, MTG), and involvement of the anterior STS in half the group.
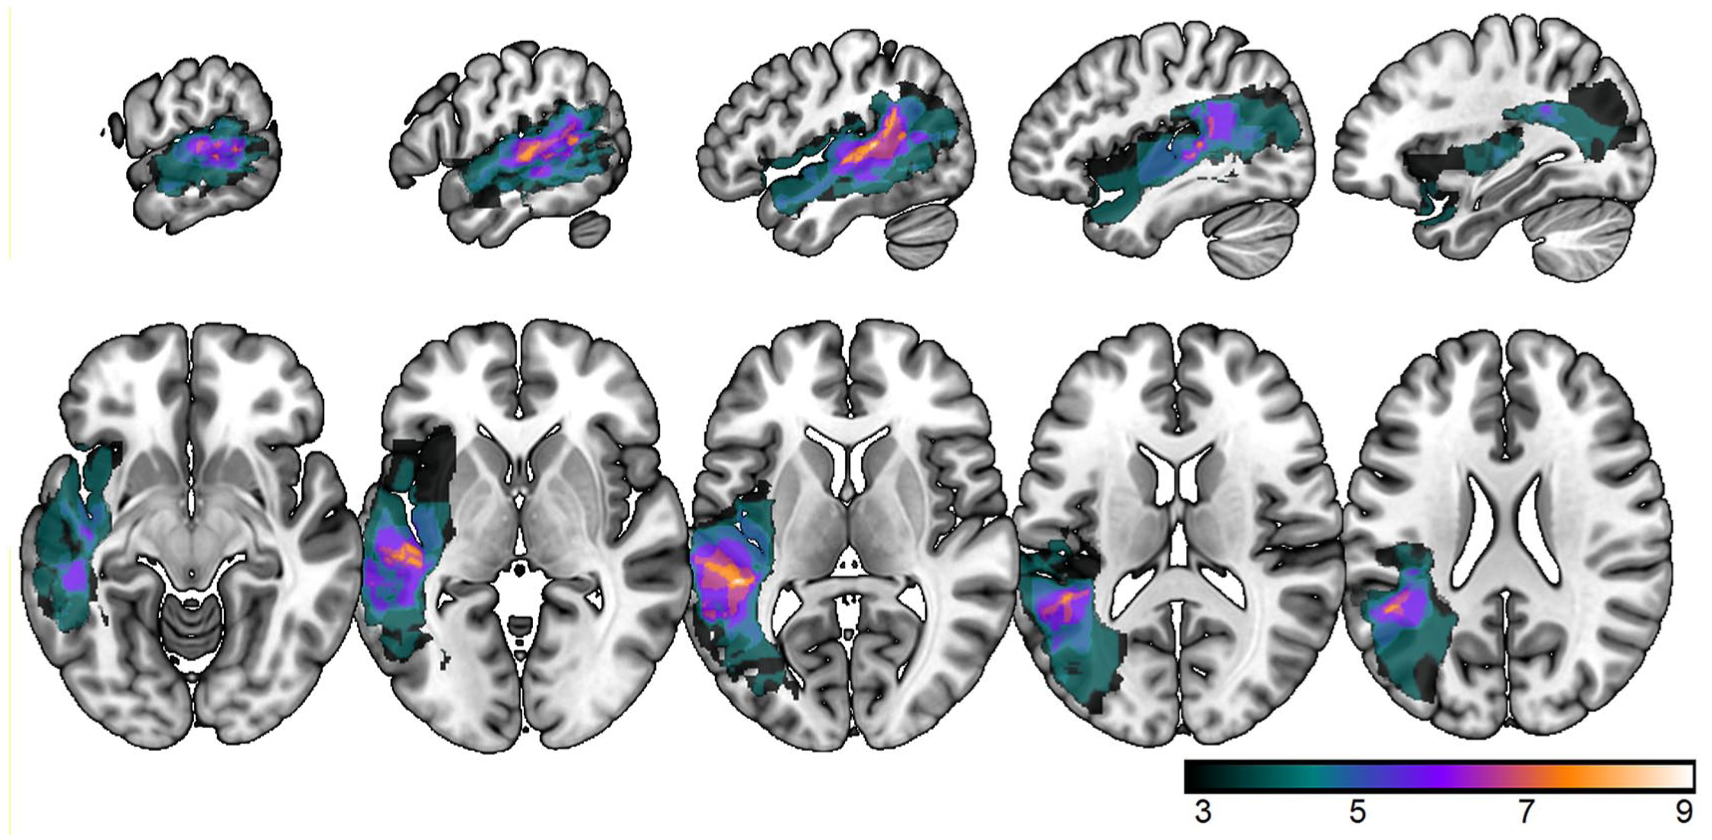
Lesion overlap map: Lesion overlap map created from binary lesion images from 9 participants. The remaining 3 participants did not have sufficient neuroimaging to identify full lesion extent. The map was created in MRIcron and presented in MRIcroGL. Sagittal coordinates: −61 −54 −47 −40 −33; Axial coordinates: −9 −1 7 15 23. Color bar indicates number of participants with lesion in each area; maximum potential overlap n = 9.
Neuropsychological Measures/Variables
Primary Outcome Variable
This study used a composite score from 2 auditory comprehension assessments as the primary outcome measure. These assessments were the BDAE auditory comprehension subtests (single word, phrases, and complex ideational material), and an in-house 6 distracter single spoken-word picture matching (sWPM) assessment consisting of 48 items of varying familiarity and phonological length (see supplementary material). Frequency and imageability were controlled across all trials of the sWPM test. Distracters comprised an item semantically related to the target, phonologically related to the target, phonologically related to the semantic distracter, and 2 unrelated distracters. The sWPM test was administered in E-Prime, recorded spoken words were played over headphones, and participants pointed to the picture they believed to correspond to the word. Table 1 displays normal cutoff data for this assessment and the other neuropsychological assessments based on data from 15 neurotypical individuals 50 to 82 years old. Normal cutoff was defined as the mean score minus 2 SDs. A composite comprehension measure was derived because of the high correlations between the BDAE and sWPM measures at 9 MPO (r2 = 0.76; P = .004) to produce a variable more reflective of the data from research into chronic WA, which focuses on the single word level and to reduce multiple comparisons. The composite score was created using unrotated principal component analysis, which produced a single factor with an eigenvalue greater than 1.
Neuropsychological Measures/Explanatory Predictors
Neuropsychological measures of component linguistic abilities (auditory, phonological, cognitive-semantic processing) were administered to explore the degree to which they were able to predict comprehension recovery.
Auditory Processing
Auditory processing assessments were selected to reflect the known impairment profile in chronic WA. 19 Rapid and slow auditory temporal modulation processing was measured using 40- and 2-Hz frequency modulation (FM) detection, respectively. Spectrotemporal modulation processing was measured using dynamic modulation (DM) “ripple” detection. FM was applied to 500-Hz carrier tones. DM stimuli consisted of 400 frequency components, logarithmically spaced across 4 octaves from 250 to 4000 Hz, modulated with an upward drift at a rate of 1 cycle/octave, −4 cycles/s. Threshold modulation index (FM) and modulation depth (DM) at which modulation could just be detected was calculated through adaptive staircase paradigms. The adaptive staircase paradigms used a 3-interval, 2 alternative forced choice A×B 2-down, 1-up design. Participants heard 3 stimuli and were instructed to identify which was the odd one out or which stimulus was wobbly by pointing to a sheet of paper with boxes representing the trial structure. The target stimulus was never in the middle position, which acted as a reference. The assessment consisted of 40 trials, starting at suprathreshold modulation index/depth. Each trial was 3750 ms in length (3 stimuli and 2 ISI of 750 ms). After 2 consecutive correct responses, the modulation index/depth was decreased, and after 1 incorrect stimulus, the modulation index/depth was increased—a reversal. Thresholds were calculated as the average of modulation index/depth of the final 6 reversals. Auditory processing experiments were administered using Matlab R2013a. The adaptive staircase design reduces memory and language load and enables the experimenter to observe whether task instructions have been comprehended because a staircase pattern cannot be achieved by guessing. 19
Phonological Processing
Input phonological analysis was measured using nonword phonological discrimination, 18 word phonological discrimination, and phonological short-term memory. Nonword discrimination used an in-house test of nonword discrimination based on phoneme confusability. 39 The experiment consisted of 14 levels (level 14, easiest; level 1, hardest) in which the stimuli systematically varied by the degree of phoneme confusability between reference and target stimuli. On levels 14 to 5, both the first and final phoneme differed between the reference and target, and on levels 4 to 1, only the final phoneme differed. The experiment started at level 14 and used a 3-down, 1-up design. Each trial used a 3-interval, 2 alternative forced choice A ×B structure, and participants were required to respond nonverbally. The test was terminated after 8 reversals or 8 consecutive correct responses at level 1. Threshold was calculated as the average level at which the final 4 reversals occurred. Phonological discrimination was measured using an in-house 48-item A×B test. Within each trial, items were matched on imageability, frequency, and familiarity. Items differed by a single phoneme word initially, medially, or finally (eg, word initial: parrot, parrot, carrot). Discrimination accuracy was taken as the raw score. Nonword phonological discrimination and word phonological discrimination were presented in E-Prime version 2.0. Phonological short-term memory was measured using immediate forward digit span recall from the Wechsler Memory Scale—Revised. 40 Each correct response was given a score of 1, with a maximum score of 2 for each span length (maximum score 14).
Semantic and Cognitive Processing
Semantic processing was measured using the 32-item version of the Camel and Cactus semantic association test. 41 Each trial consisted of this paper-based assessment and presents a picture probe stimulus at the top of the page and 4 interrelated picture stimuli below (1 target, 3 distracter). The participant is required to identify which stimulus is related to the probe stimulus (eg, probe: camel; target: cactus; distracters: sunflower, rose, tree). Semantic processing accuracy was taken as the raw score. Nonverbal reasoning was measured using Raven’s Coloured Progressive Matrices, 42 and age-related centile rank was derived from the raw score.
Additional Variable: Peripheral Hearing
Alongside age and time postonset, bilateral pure tone peripheral air conduction hearing thresholds at 0.5, 1, 2, and 4 kHz were measured and averaged.
Bias
Potential bias in the study may have arisen through recruitment procedures: for example, only more capable and medically well individuals being referred to the research. A consultee referral mechanism was available as an attempt to mitigate against this.
Study Size
An a priori power calculation using correlation effect size from Robson et al 18 indicated that n =12 provided a 92% probability of identifying significant relationships between neuropsychological assessment and comprehension outcome measures.
Results
Recovery
Improvements in language comprehension and neuropsychological profile were investigated using 1-way ANOVA (time points 2.5, 5, and 9 months) and are displayed in Figures 2 and 3; raw data can be found in Tables 2 to 4. A significant improvement in comprehension over time was found (BDAE: F(2, 20) = 22.2, P < .001, η = 0.69; sWPM: F(2, 20) = 34.5, P < .001, η = 0.78; Figure 2). Across the case series, all but 1 participant displayed improvements in language comprehension from 2.5 to 9 MPO. Post hoc paired t-tests showed that significant improvements were made between 2.5 and 5 MPO and 5 and 9 MPO for both assessments (BDAE t(11) > 3.2 and sWPM t(11) > 5.2 for all pairwise comparisons). Comprehension scores from the BDAE and sWPM were correlated at the final time point (r2 = 0.76; P = .004) and, therefore, were combined into a single comprehension measure using unrotated principal component analysis for further correlation analyses.
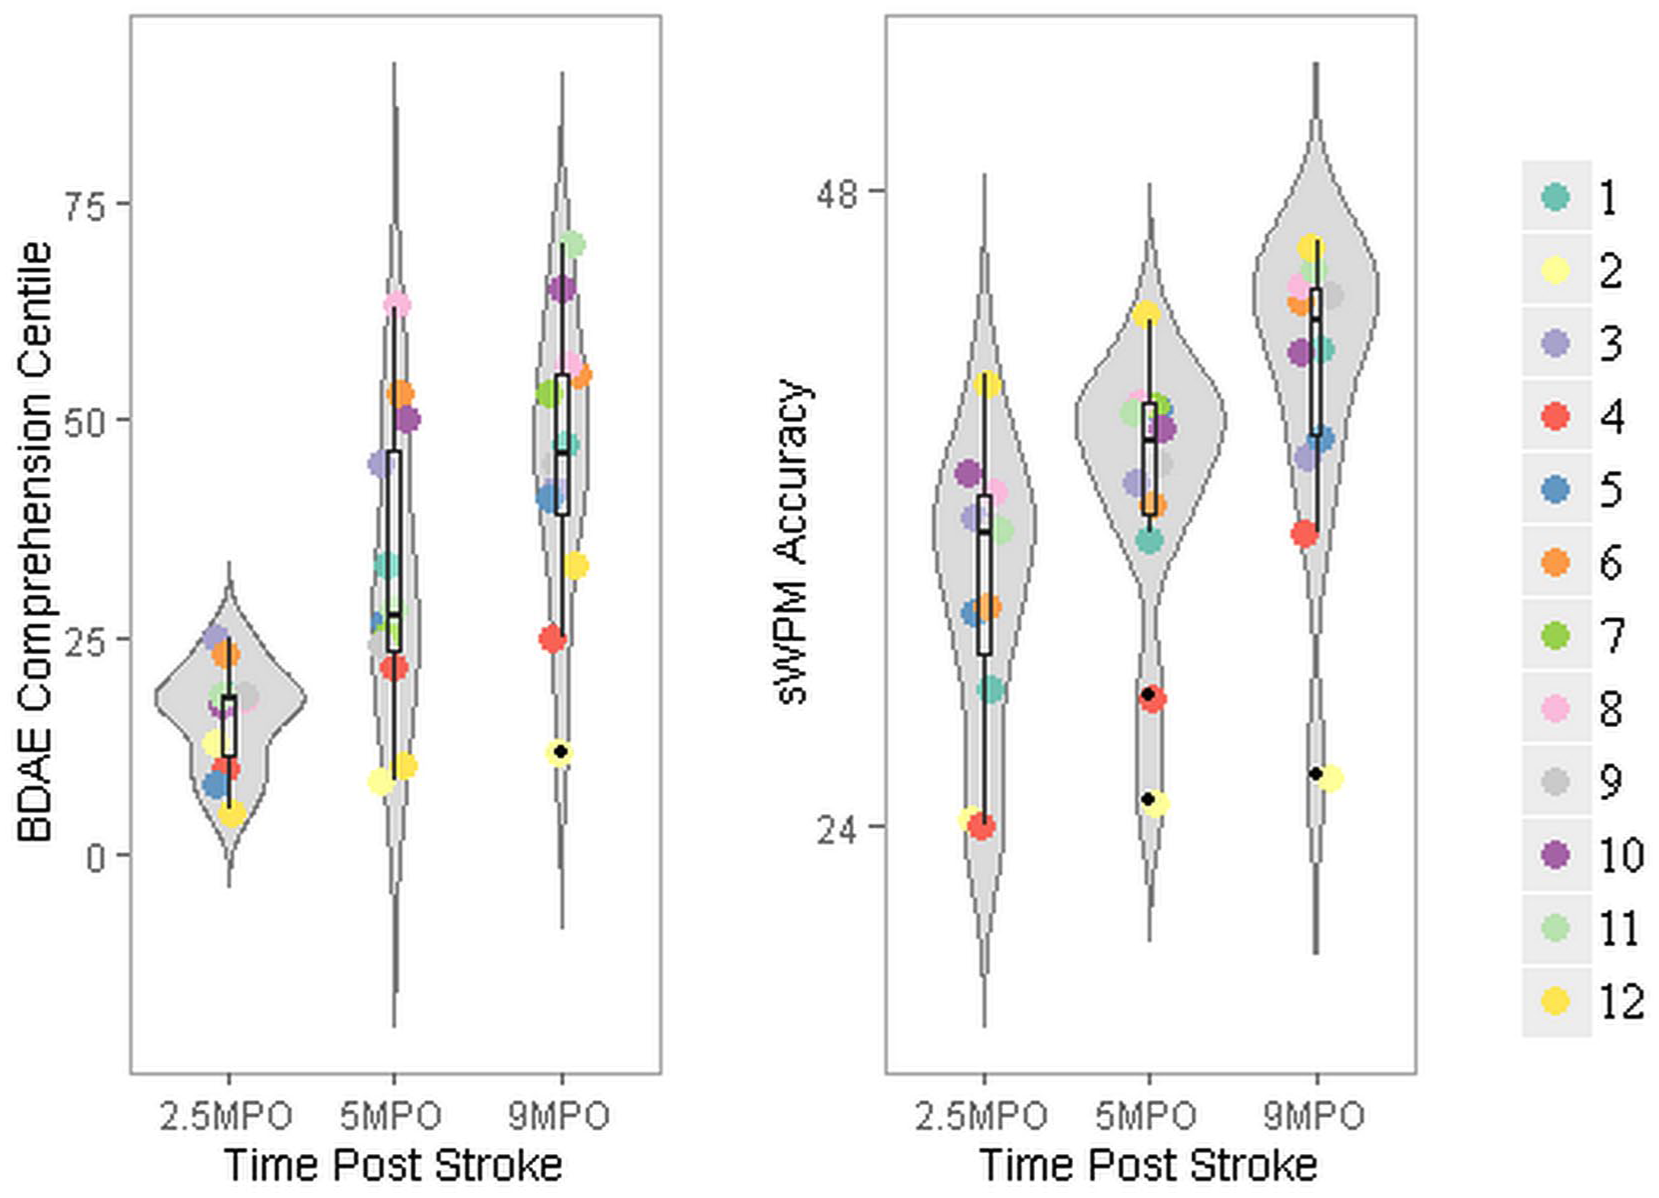
Auditory language comprehension profile: Violin, box, and dot plots representing group and individual data for auditory comprehension assessments at 2.5, 5, and 9 MPO. Participants are ordered alphabetically. The thickness of the violin plot represents the probability of a score based on the distribution of the group data. Each dot represents an individual participant’s performance (see legend). Box plots represent the mean and distribution of the scores.
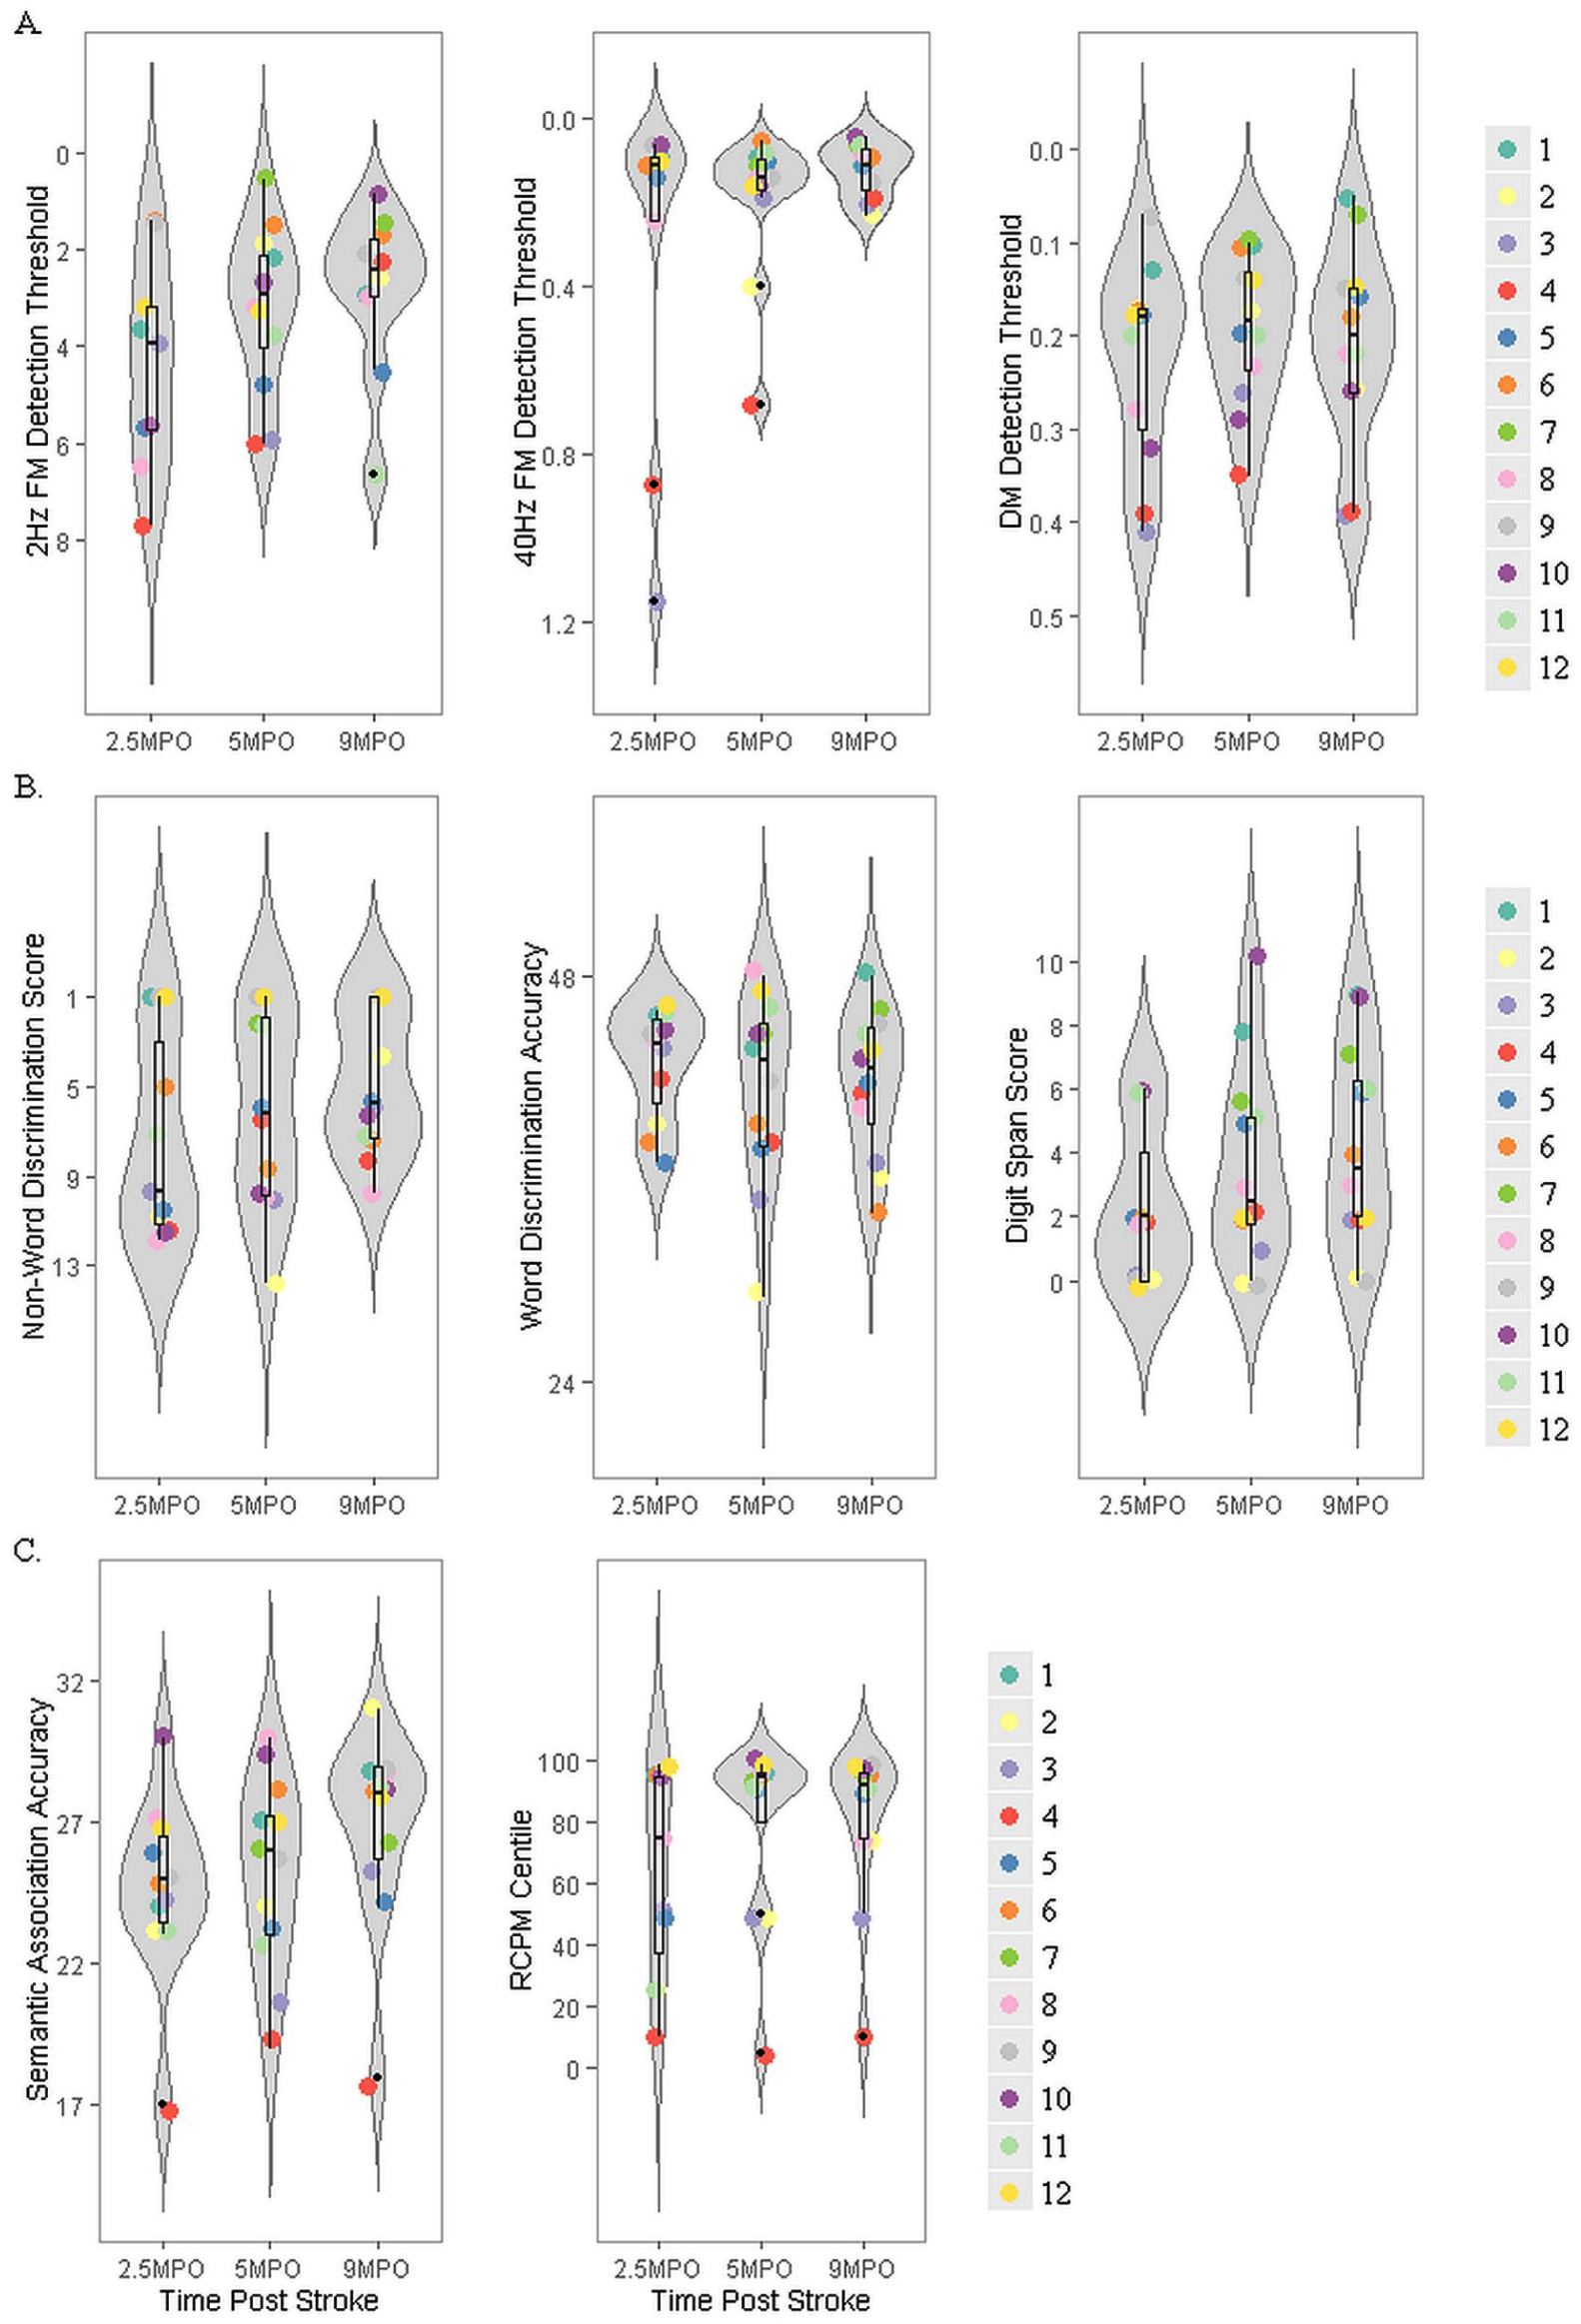
Auditory processing, phonological processing, and semantic-cognitive processing profile from subacute to chronic phase: Violin, box, and dot plots displaying probability distribution and individual data for auditory processing tasks (2 and 40 Hz FM detection and DM detection) in panel A, phonological processing tasks (nonword discrimination, word discrimination, and digit span) in panel B, and cognitive-semantic tasks (semantic association and nonverbal reasoning) in panel C. Data are presented from 2.5, 5, and 9 MPO. The thickness of the violin plot represents the probability of a score based on the distribution of the group data. Each dot represents an individual participant’s performance (see legend). Box plots represent the mean and distribution of the scores.
Comprehension and Neuropsychological Results at 2.5 Months Postonset. a
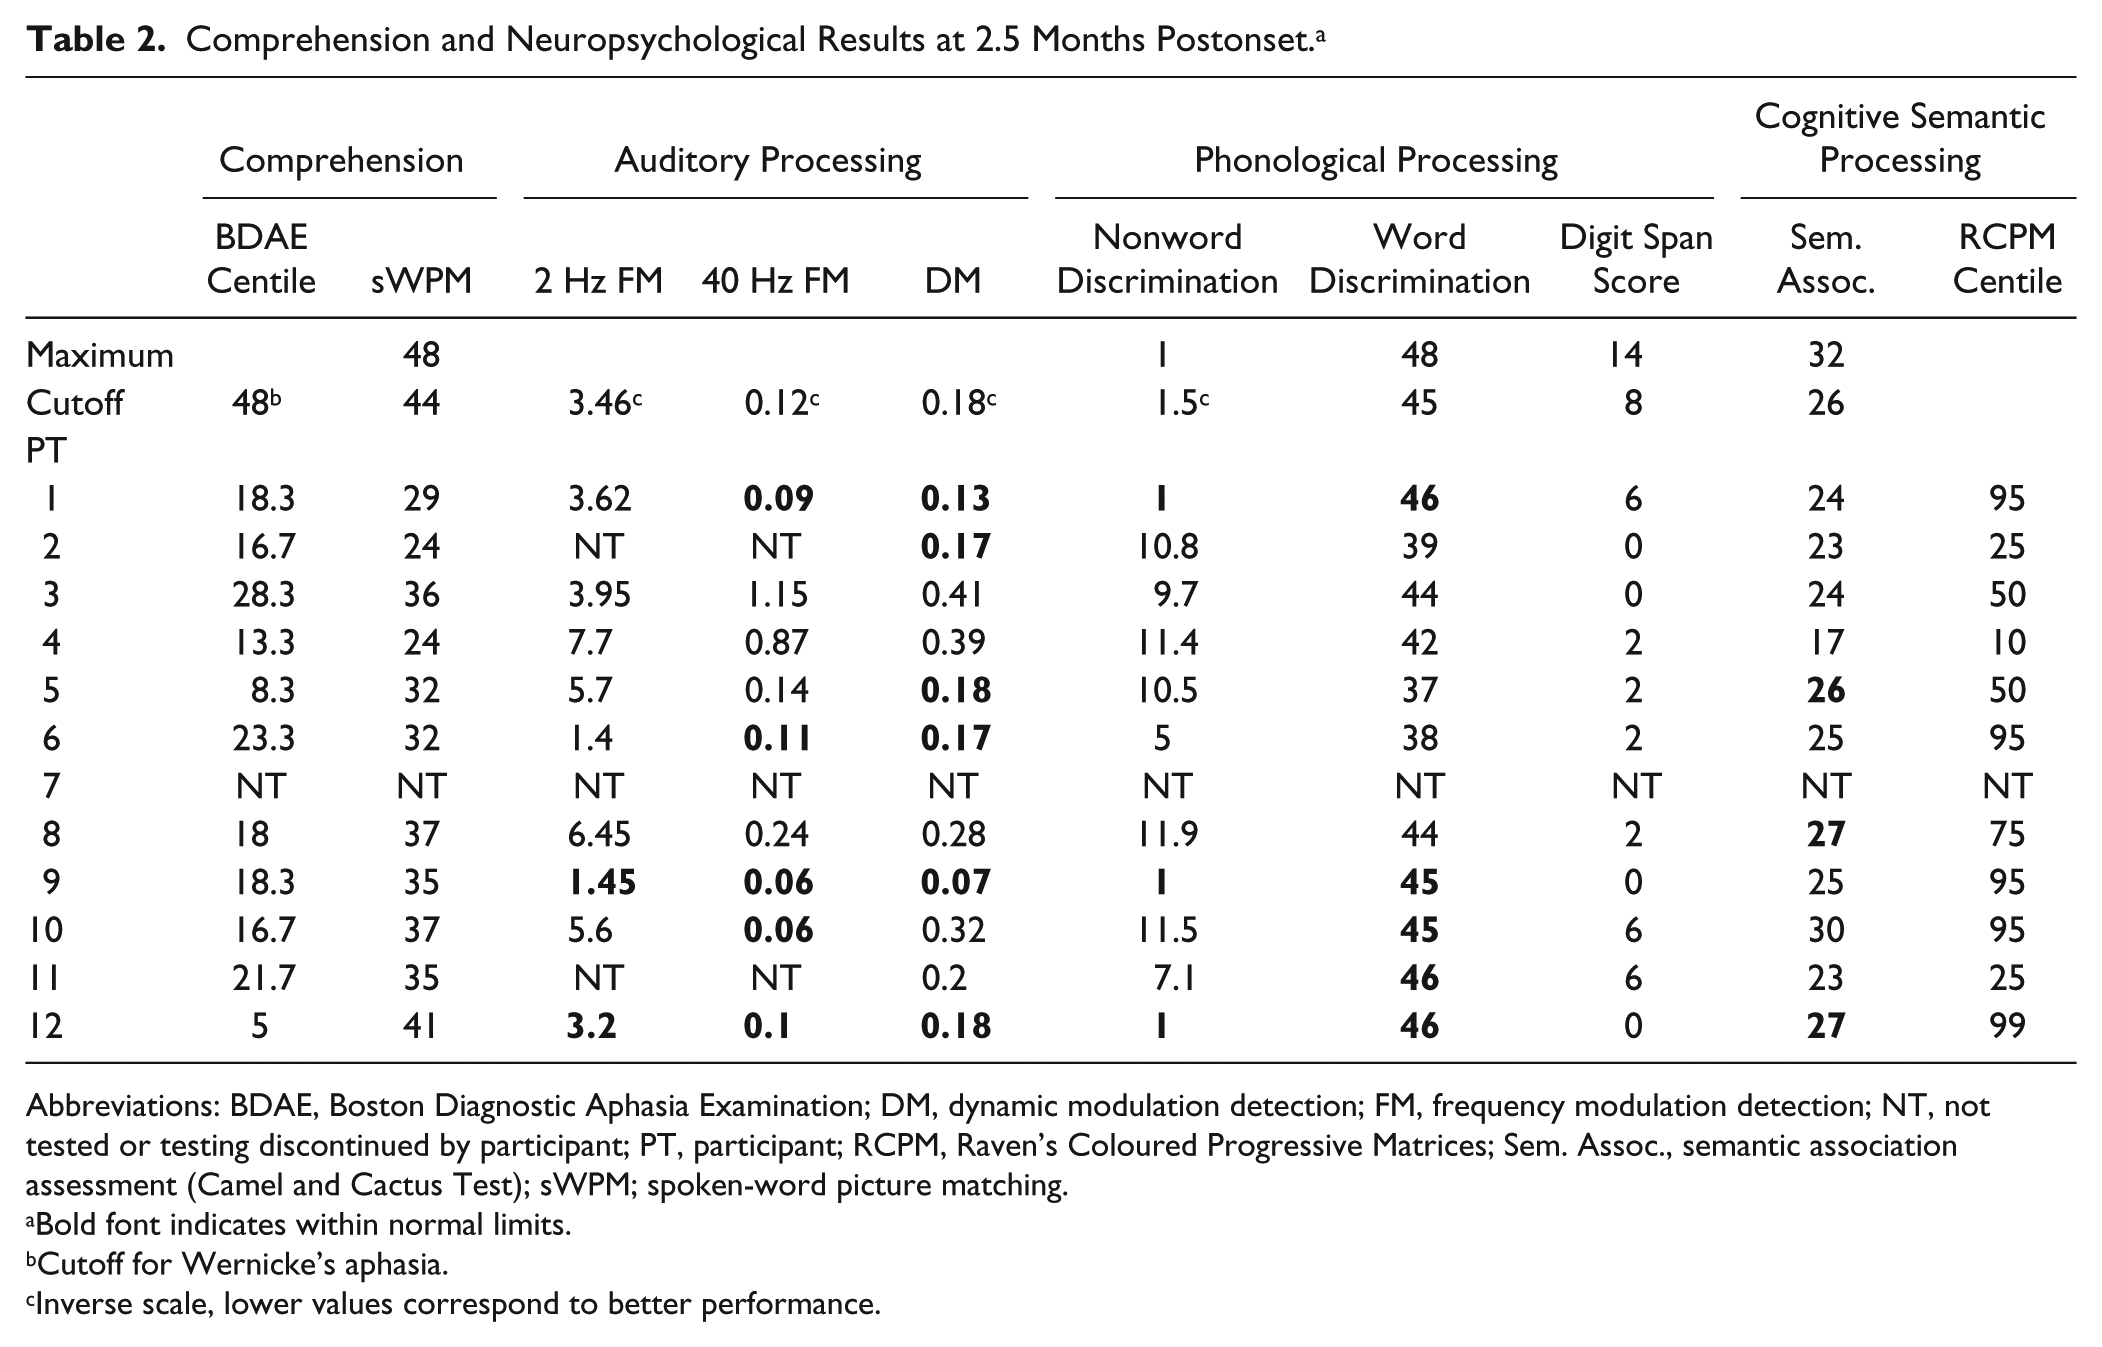
Abbreviations: BDAE, Boston Diagnostic Aphasia Examination; DM, dynamic modulation detection; FM, frequency modulation detection; NT, not tested or testing discontinued by participant; PT, participant; RCPM, Raven’s Coloured Progressive Matrices; Sem. Assoc., semantic association assessment (Camel and Cactus Test); sWPM; spoken-word picture matching.
Bold font indicates within normal limits.
Cutoff for Wernicke’s aphasia.
Inverse scale, lower values correspond to better performance.
Comprehension and Neuropsychological Results at 5 Months Postonset. a
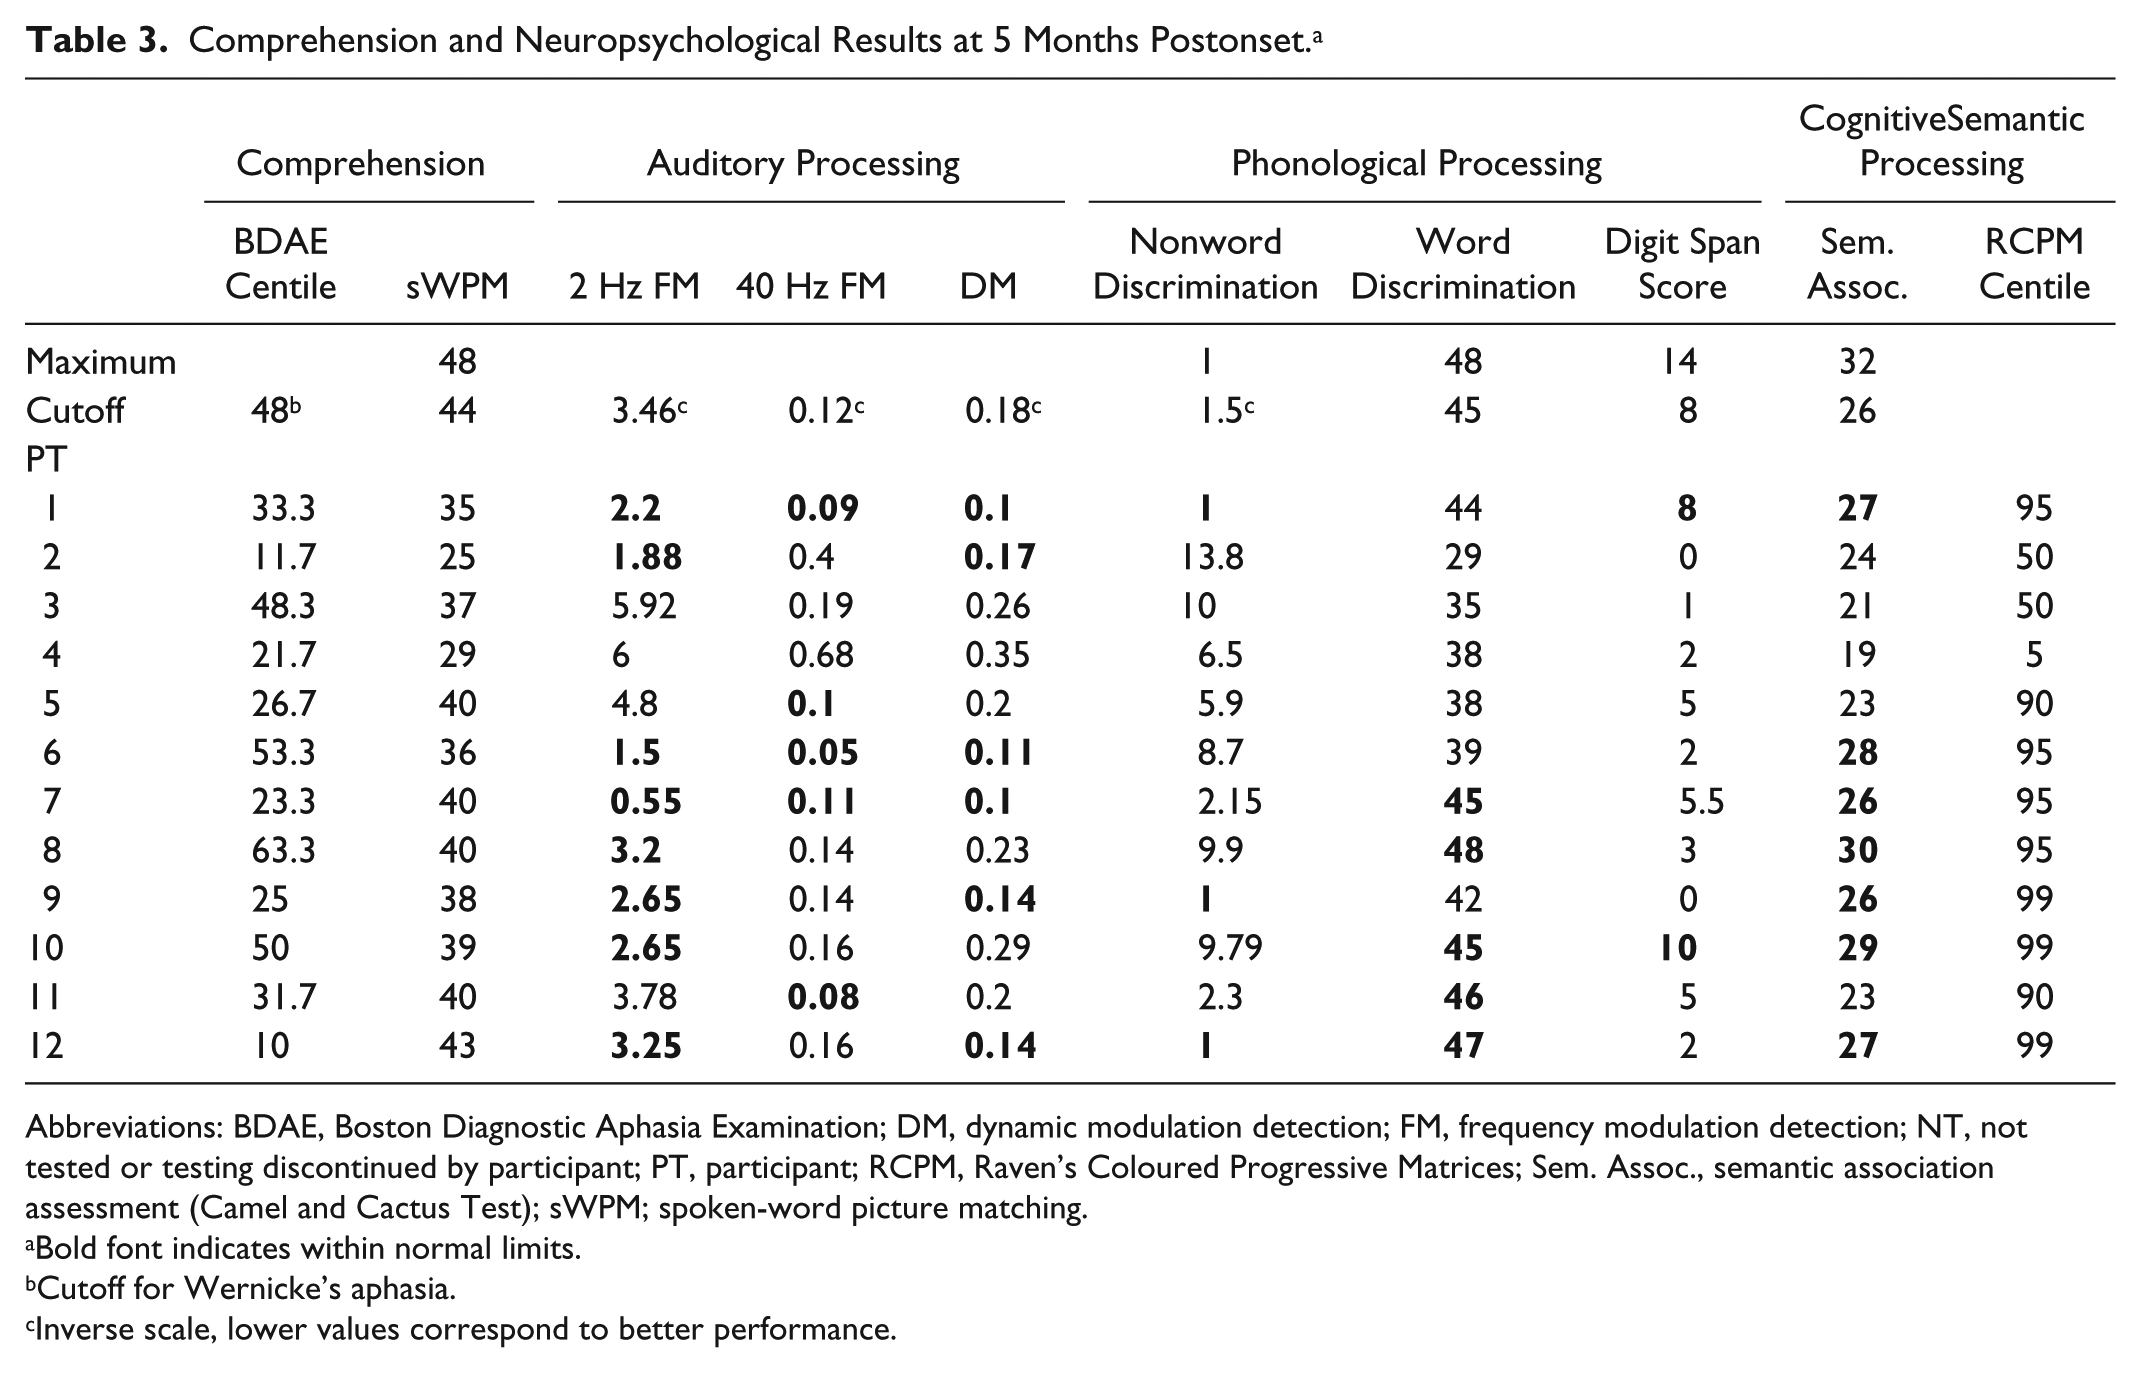
Abbreviations: BDAE, Boston Diagnostic Aphasia Examination; DM, dynamic modulation detection; FM, frequency modulation detection; NT, not tested or testing discontinued by participant; PT, participant; RCPM, Raven’s Coloured Progressive Matrices; Sem. Assoc., semantic association assessment (Camel and Cactus Test); sWPM; spoken-word picture matching.
Bold font indicates within normal limits.
Cutoff for Wernicke’s aphasia.
Inverse scale, lower values correspond to better performance.
Comprehension and Neuropsychological Results at 9 Months Post Onset. a
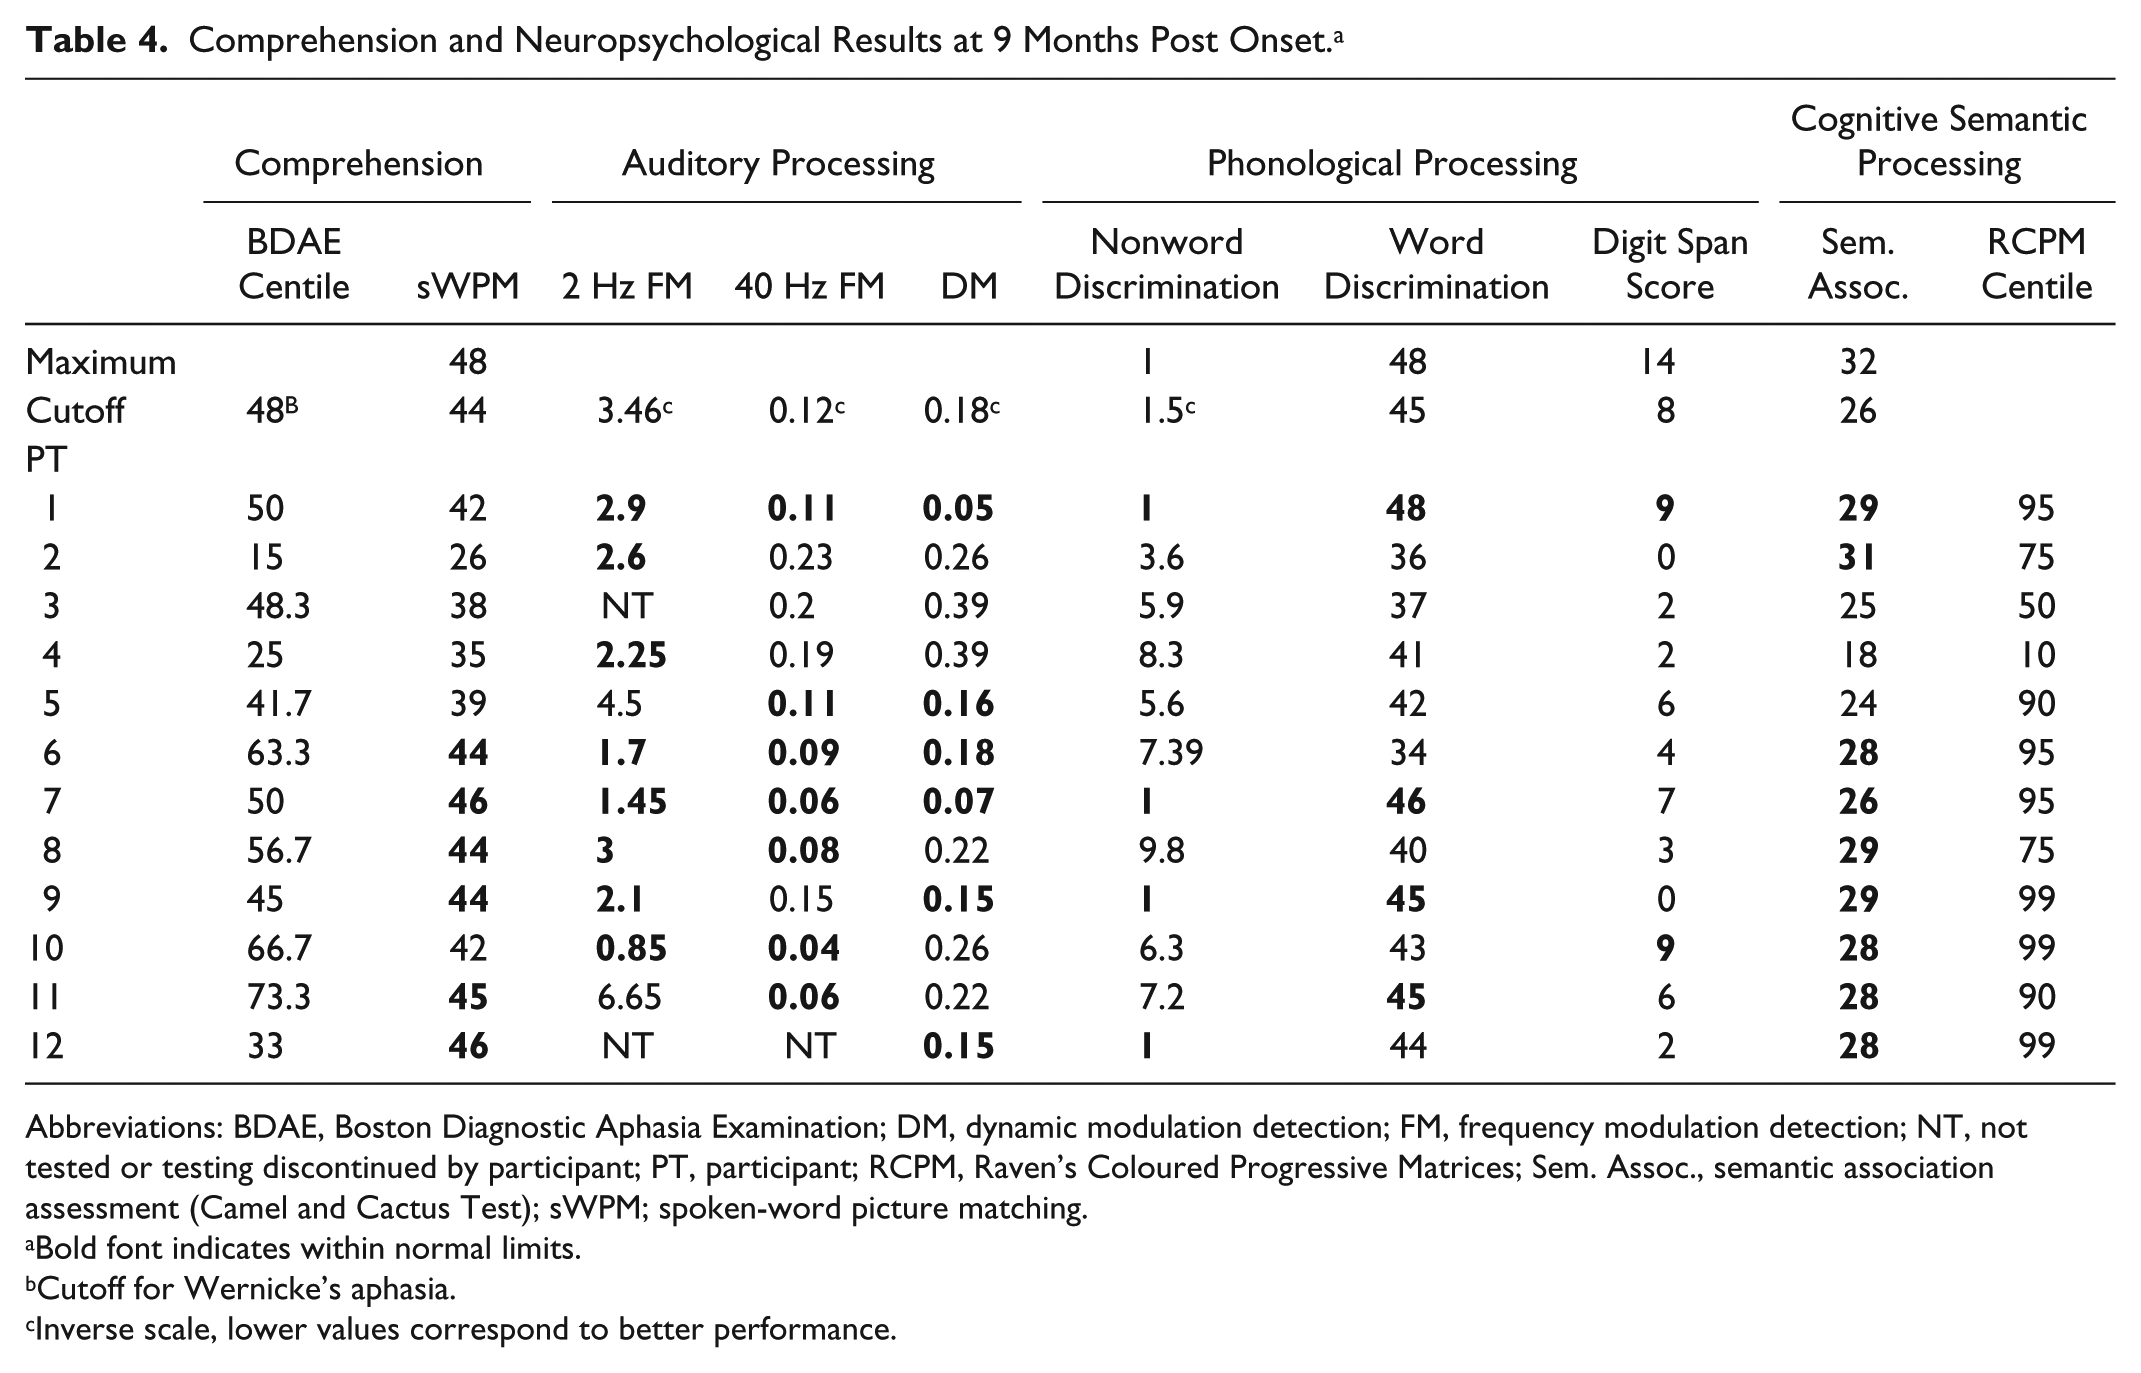
Abbreviations: BDAE, Boston Diagnostic Aphasia Examination; DM, dynamic modulation detection; FM, frequency modulation detection; NT, not tested or testing discontinued by participant; PT, participant; RCPM, Raven’s Coloured Progressive Matrices; Sem. Assoc., semantic association assessment (Camel and Cactus Test); sWPM; spoken-word picture matching.
Bold font indicates within normal limits.
Cutoff for Wernicke’s aphasia.
Inverse scale, lower values correspond to better performance.
Significant improvements over time were found in auditory, phonological, and semantic processing (Figure 3): slow auditory temporal processing [2 Hz FM detection; F(2, 12) = 4.3, P = .039, η = 0.42], phonological short-term memory [digit-span score; F(2, 20) = 8.3, P = .002, η = 0.45], and semantic association [Camel and Cactus Test; F(2, 20) = 4.7, P = .021, η = 0.32]. However, it is important to note that improvements were not seen across the remaining neuropsychological tasks. Paired t-tests found that the phonological short-term memory significantly improved between all 3 time points [t(11) > 2.2], whereas semantic association only improved between 2.5 and 9 MPO [t(10) = 2.6; P = .028] and 5 and 9 MPO [t(11) = 2.2; P = .049], and slow auditory temporal processing only displayed a weak improvement between 2.5 and 9 MPO [t(6) = 2.3; P = .065] but between no other pairs of time points. A number of individuals fell within normal limits on neuropsychological measures at 2.5 MPO (Table 2). The ANOVAs were rerun after including only those participants who fell outside normal limits at 2.5 MPO; the results remained statistically the same.
Within–Time Point Correlations
The relationship between language comprehension and underlying cognitive skills over time was examined with Pearson correlations between neuropsychological and comprehension scores. Tables 2 to 4 display language comprehension assessments and neuropsychological data across the case series and time points. Unlike in chronic WA, no significant relationships were found between comprehension scores and neuropsychological profile at 2.5 MPO. At 5 MPO, a significant correlation was found between comprehension and phonological processing (word phonological discrimination: r = 0.67; P = .018; n = 12), rapid auditory temporal processing (40 Hz FM detection: r = −0.69; P = .012; n = 12), and nonverbal reasoning (RCPM: r = 0.6; P = .03; n = 12). The correlation between comprehension and rapid auditory temporal processing (40 Hz FM detection: r = −0.88; P < .001; n = 11) remained significant at 9 MPO.
Correlation With Additional Variables
Onset severity and age have been shown to influence recovery from stroke. 43 Pearson correlations explored the relationship between comprehension scores at 9 MPO and additional variables: comprehension score at 2.5 MPO, age, average bilateral peripheral hearing threshold, and lesion volume in voxels. A significant correlation was found between 2.5 and 9 MPO comprehension scores (r = 0.73; n = 11; P = .011) but not age, hearing, or lesion volume. As such, comprehension at 2.5 MPO was added as a covariate in further correlations.
Cross-Lagged Correlations
The relationship between earlier neuropsychological assessments and later language comprehension was assessed with partial correlations covarying for comprehension scores at 2.5 MPO to explore the extent to which the additional cognitive measure could improve outcome prediction beyond that obtained from initial severity. No neuropsychological score at 2.5 MPO was significantly associated with comprehension at 5 MPO. Rapid auditory temporal processing (40 Hz FM detection: r = −0.94; df = 6; P ≤ .001) and phonological short-term memory (digit span: r = 0.64; df = 8; P = .046) at 2.5 MPO were significantly associated with comprehension at 9 MPO. Word phonological processing at 5 MPO was significantly associated with comprehension at 9 MPO (r = 0.84; df = 8; P = .002), and a further marginally significant association was found between nonword phonological processing at 5 MPO and comprehension at 9 MPO (r = −0.63; df = 8; P = .053).
Discussion
This study aimed to investigate the cognitive dynamics associated with recovery from WA comprehension impairments from the subacute to the chronic phase. Strong recovery in language comprehension was observed, indicating considerable functional reorganization. Analysis of evolving neuropsychological profiles indicates, contrary to the hypothesis, that this reorganization process is influenced by residual auditory processing capacity (rapid auditory temporal and phonological processing) but does not require the improvement of these abilities. These results suggest that spontaneous recovery of comprehension in WA is dependent on enhancing the efficiency with which the remaining information from the speech signal is used within the language system. Furthermore, these results indicate that individuals with significant impairments in auditory and phonological abilities at 2.5 to 5 MPO are at risk for poor language comprehension outcomes.
At the subacute stage post–stroke onset (2.5 MPO), no relations were identified between language comprehension in WA and any other tested cognitive domain—auditory, phonological, or semantic-executive processing. Psycholinguistics, computational modeling, and functional neuroimaging have identified these factors to be fundamental to language comprehension. These results, therefore, indicate that the language comprehension network remains highly disorganized into the subacute phase, with considerable reorganization yet to occur. Toward the chronic phase, significant relationships emerged between phonological and auditory processing capacity and language comprehension. At 5 MPO, the capacity to discriminate between spoken words as well as the ability to detect rapid auditory temporal modulations was associated with language comprehension, the latter remaining a significant factor at 9 MPO. These results indicate an increasingly systematic organization of the language comprehension network emerging over the first year after stroke and moving toward a pattern established at the chronic phase. Data from individuals with chronic WA indicate that the degree of impairment in spoken language comprehension is associated with residual capacity to process phonological and acoustic stimuli.19,26,29 These results converge with the original model of WA, 28 which postulates that an impairment in processing the auditory structure of speech (speech perception) disrupts the ability to accurately access semantic representations corresponding to lexical items and syntactic structures.
Although all individuals in this study had residual comprehension impairments at 9 MPO, improvements in language comprehension occurred for all but 1 participant. At the group level, the degree of improvement in language comprehension was similar between 2.5 and 5 MPO, and 5 and 9 MPO. These recovery curves parallel those identified by Kertesz and McCabe, 43 which indicated a more drawn-out recovery in WA over the first year poststroke in comparison to other types of aphasia. This pattern also contrasts with other types of impairment poststroke—for example, motor, in which rapid spontaneous recovery in the early phase plateaus after the first 3 to 6 months.44-46 One hypothesis is that differences in the time frame of spontaneous recovery reflect the complexity of underlying functional network organization, with more complex networks engaging in longer periods of recovery. 47 Although there are no direct comparisons of network complexity, the posterior superior-middle aspects of the temporal lobe, the areas of greatest lesion overlap in WA (Figure 1), are proposed to be core aspects of the language network 48 and are associated with both dorsal and ventral language pathways. 49 This experimental evidence, along with lesion studies, indicates that these regions are critical to almost all aspects of language processing and, therefore, may require protracted periods of reorganization. This finding may be useful for rehabilitation because it indicates an extended window in which to supplement and augment the process of spontaneous recovery and optimize long-term outcomes.
As well as comprehension recovery, this study identified recovery of associated cognitive functions across auditory, phonological, and semantic domains. However, in comparison to recovery in comprehension, the improvements in these associated areas were inconsistent across the case series and only occurred significantly at the group level for a subset of the neuropsychological assessments—slow auditory temporal processing (2-Hz FM detection), phonological short-term memory (digit span), and semantic association (Camel and Cactus Test). In contrast, there was a notable lack of consistent recovery in phonological processing (word and nonword discrimination) and auditory processing requiring the analysis of rapid temporal information or spectrotemporal information. It should be noted that some data from auditory assessments were missing because participants discontinued these tests. The most striking finding in the current study was that the factors that showed capacity to improve were, for the most part, not related to long-term comprehension outcomes in WA. Comprehension recovery was independent of performance on slow auditory temporal processing and semantic processing. Instead, a significant influence of rapid auditory processing and phonological processing was found on language comprehension at 9 MPO. Cross-lagged correlations found that comprehension capacity at 9 MPO was associated with rapid auditory temporal processing (40-Hz FM detection) at 2.5 MPO and word phonological discrimination capacity at 5 MPO. These correlations indicate that although acoustic-phonological processing has limited plasticity in WA, these abilities play a significant role in shaping the eventual language comprehension outcome and suggest that residual capacity in these areas is an important prognostic indicator for comprehension recovery.
One interpretation of these behavioral results is that language comprehension recovery in WA results from reorganization processes that enable increasingly efficient use of residual acoustic-phonological processing capacity. Interestingly, despite an apparent lack of natural plasticity in the acoustic-phonological processing network in the current study, the same abilities have been found to be amenable to therapy-induced improvement in chronic phase WA, and therapy for acoustic-phonological processing is effective for improving language comprehension when delivered in large doses.16,50 Such therapies may be expected to be even more effective in the subacute phase, where natural plasticity is high. Therapy-induced improvement of early auditory processing may, therefore, result in a greater recovery of language comprehension abilities over time.
There are a number of further factors that could have affected the profile of results and capacity to identify the relationship between comprehension and underlying cognitive factors. The current study recruited 12 participants with WA. This sample size reflected an a priori power calculation; however, this calculation was conducted on chronic WA data, and the sample remains small. It is possible that a larger sample size would have revealed further associations between neuropsychological assessments and language comprehension outcomes and been suitable for statistical analyses able to identify interactions between auditory, phonological, and semantic factors. Second, involvement in therapy was not an exclusion criterion for the study and could have accounted for some of the variance in the degree and trajectory of comprehension and neuropsychological profile recovery. Therapy engagement was monitored; however, therapy input reflected personalized targets and local service provision, resulting in high variability in therapy content. Half the group received therapy targeting speech production, and only 1 participant received auditory comprehension therapy (participant 12). No participant received an evidence-based dosage of impairment-based therapy. 47 Dosage and treatment specificity are both key principles for promoting neuroplasticity and recovery of the language network. 48 To reflect this, we ranked the participants in terms of the amount of therapy they received, and this was not correlated with comprehension outcomes (see Supplementary Materials for details of this analysis). Therefore, there is no evidence to suggest that speech and language therapy involvement significantly influenced the primary outcome measure in the current study. One further potential source of unaccounted variance in the current study is the degree of neural atrophy or the presence and severity of small-vessel disease. These factors could affect the capacity for reorganization in the residual neural network. Age is a known risk factor for atrophy and small-vessel disease,49,51 and the participants in this study were on average older than the participants in the majority of aphasia research studies. As such, this may have limited the potential for functional recovery. However, we found no systematic relationship between age and comprehension outcome or degree of comprehension recovery, and general age-related limitations on recovery would not explain the differences in recovery over tasks. It was noted, however, that 2 of the older participants (3 and 4, 80 and 93 years old, respectively) displayed consistently low scores on the RCPM over the 3 testing time points, in contrast to 2 other participants (2 and 11), who showed low RCPM scores at 2.5 MPO but who had considerably improved by 9 MPO. Although it cannot be ruled out that age-related cognitive decline was interacting with stroke recovery processes at least in participants 3 and 4, it could not explain the key findings of an association between subacute auditory processing and chronic language comprehension.
Conclusions
This study provides the first longitudinal consideration of the cognitive dynamics of comprehension recovery in WA. The substantial comprehension recovery observed was not consistently related to the component cognitive abilities that also showed improvement. Rather, long-term comprehension outcomes were primarily shaped by remaining auditory-phonological capacity, despite a lack of improvement in these abilities over time. The results indicate that comprehension recovery in WA is constrained by residual auditory-phonological capacity but that improvement in auditory-phonological function is not required for language comprehension recovery. Rapid auditory temporal processing in the subacute phase was associated with comprehension outcome in the chronic phase, presenting a potential prognostic indicator for individuals with WA, clinicians, and researchers and a potential target for early rehabilitation.
Supplemental Material
Aud_Phon_Sem_Factors_Recovery_Wernickeas_Aphasia_SupplementaryMaterials_19-6-19 – Supplemental material for Auditory, Phonological, and Semantic Factors in the Recovery From Wernicke’s Aphasia Poststroke: Predictive Value and Implications for Rehabilitation
Supplemental material, Aud_Phon_Sem_Factors_Recovery_Wernickeas_Aphasia_SupplementaryMaterials_19-6-19 for Auditory, Phonological, and Semantic Factors in the Recovery From Wernicke’s Aphasia Poststroke: Predictive Value and Implications for Rehabilitation by Holly Robson, Timothy D. Griffiths, Manon Grube and Anna M. Woollams in Neurorehabilitation and Neural Repair
Footnotes
Acknowledgements
We thank the participants for taking part in this work and their carers for facilitating their participation. Extensive thanks go to those members of the NIHR clinical research network who supported recruitment to this study.
Supplementary material for this article is available on the Neurorehabilitation & Neural Repair website along with the online version of this article.
Authors’ Note
All authors: research design; HR and AMW: data analysis; all authors: report writing.
Declaration of Conflicting Interests
The authors declared no potential conflicts of interest with respect to the research, authorship, and/or publication of this article.
Funding
The authors disclosed receipt of the following financial support for the research, authorship, and/or publication of this article: This work was funded by a Stroke Association Senior Research Training Fellowship (SRTF 2012/02) awarded to HR.
References
Supplementary Material
Please find the following supplemental material available below.
For Open Access articles published under a Creative Commons License, all supplemental material carries the same license as the article it is associated with.
For non-Open Access articles published, all supplemental material carries a non-exclusive license, and permission requests for re-use of supplemental material or any part of supplemental material shall be sent directly to the copyright owner as specified in the copyright notice associated with the article.