
Abstract
Background. A fraction of stroke survivors with chronic aphasia experience declines in language abilities over time, but the reason for this remains unclear. Objective. To evaluate the effect of leukoaraiosis on baseline aphasia severity and long-term changes in aphasia severity. This study directly compares the predictive capacity of leukoaraiosis severity to that of lesion damage, a factor known to account for a substantial proportion of variance in the degree of language impairment and recovery. Methods. Using a longitudinal database of behavioral and neuroimaging data from 35 individuals in the chronic stage of recovery after a single-event left-hemisphere stroke (9 females, mean stroke age = 55.8 ± 9.1 years, mean months poststroke at initial evaluation = 36.3 ± 40.8), we examined 2 lines of inquiry: (1) to what extent does leukoaraiosis severity at initial evaluation predict aphasia severity and (2) to what extent does leukoaraiosis severity at initial evaluation predict longitudinal change in aphasia severity. Participants underwent high-resolution magnetic resonance imaging for the purpose of lesion volume analysis and leukoaraiosis severity rating. Biographical information was also considered. Results. Lesion volume and time poststroke at initial assessment best predicted initial aphasia severity (adjusted R2 = 0.37). Leukoaraiosis severity and initial aphasia severity significantly predicted decline in language abilities at follow-up, accounting for approximately one-third of the variance (adjusted R2 = 0.33). More severe leukoaraiosis was associated with a 4.3 odds increase of decline. Conclusions. Leukoaraiosis is a significant risk factor for declining language abilities in aphasia and should be considered for better identification of individuals at risk for long-term decline, which can guide clinical decision making.
It is a common view that in aphasia, a language disorder most commonly caused by stroke, recovery of language ability plateaus at approximately 3 to 6 months poststroke. 1 Recent studies have challenged this assumption, showing that improvement or decline can occur years beyond stroke onset.2-4 Long-term change in language ability is highly variable across stroke survivors, and the individual neurobiological markers that predict this change are largely undefined. The identification of personalized neurobiological predictors for prognosis is important, as illustrated by the fact that the National Institutes for Deafness and Other Communication Disorders has made this a strategic aim. Identifying factors that predict changes in severity over time will enable better detection of individuals with the potential to improve, or those at risk for decline, thereby guiding the long-term management of aphasia. For example, for those at risk for decline, speech-language interventions could focus on compensatory strategies, while those likely to demonstrate continued improvement may be more likely to benefit from impairment-based treatments. 5
The spatial extent6,7 and location6,8-11 of poststroke lesions are commonly considered important neurobiological predictors of aphasia severity, recovery potential, and chronic deficits. Indeed, lesion volume has been reported to account for almost half the variance in language ability in individuals with chronic aphasia. 9 However, lesion factors alone do not adequately explain long-term changes in language abilities.2,12 A recent study by Hope and colleagues 2 found that in 28 individuals with chronic aphasia, lesion volume did not significantly differ between those who demonstrated significant decline in word finding ability and those whose word finding improved over time. Taken together, evidence suggests that other neurobiological factors may improve prediction of long-term aphasia severity and the potential for continued recovery or significant decline.
Apart from gliosis or necrosis in the areas directly damaged by the stroke, the presence of leukoaraiosis, that is, pathological white matter hyperintensities (WMHs) visible on magnetic resonance imaging (MRI), which have been associated with white matter small vessel disease, is a promising candidate for predicting aphasia severity and recovery. Leukoaraiosis is commonly identified in T2-weighted or FLAIR (fluid-attenuated inversion recovery) MRIs as WMH in periventricular spaces and/or deep white matter, and severity has most often been quantified using an ordinal scale based on visual inspection, ranging from mild (periventricular caps, small WM lesions) to severe (confluent hyperintensities in periventricular and/or deep white matter). 13 Leukoaraiosis is associated with axonal breakdown, 14 and in turn, white matter structural networks have been shown to be affected, particularly long-range white matter connections,15,16 leading to compromised global white matter network integrity. 17 Not only does white matter appear to be affected, but leukoaraiosis severity has also been associated with a decrease in region-specific gray matter volumes; specifically, in orbitofrontal, parietal, and occipital regions. 18
Risk factors for leukoaraiosis include age, atherosclerotic disease, diabetes, and hypertension,13,19 and it has been linked to cognitive decline, depression, and loss of functional ability.20,21 As most stroke survivors are older adults and present with concomitant health conditions that may lead to leukoaraiosis (eg, diabetes, hypertension), and because leukoaraiosis itself is a risk factor for stroke, 22 it follows that a proportion of stroke survivors will present with leukoaraiosis on clinical imaging. Despite this, the extent to which leukoaraiosis severity influences aphasia severity and recovery is a new area of inquiry. To our knowledge, only one study to date 23 has investigated the role of leukoaraiosis in the recovery of acute aphasia. In this study, Wright et al 23 showed that more severe leukoaraiosis at the acute-subacute stages was related to suboptimal language recovery in early stages poststroke, as measured by change in naming ability ≥3 months after the stroke. In individuals whose aphasia does not resolve (ie, extends into the chronic phase), it stands to reason that leukoaraiosis severity affects language ability and potential for longitudinal language change, but this hypothesis has not been directly examined. Given prior evidence establishing a relationship between leukoaraiosis severity and recovery of acute aphasic impairment, 23 as well as evidence associating leukoaraiosis severity with cognitive decline 20 and atrophy in gray matter areas associated with language processes, 18 we investigated two lines of inquiry identifying the role of leukoaraiosis severity in aphasia and aphasia recovery.
The first line of inquiry of the current study evaluates the relative contribution of leukoaraiosis severity to aphasia severity at initial evaluation (ie, on first assessment in the chronic stage) and the second evaluates the relative contribution of leukoaraiosis severity to aphasia recovery (ie, improvement or decline of language abilities at a follow-up assessment, at least 6 months later).
Materials and Methods
Participants
This is a retrospective study including multi–time point assessment of N = 35 participants (9 females; age at stroke: M = 55.5 ± 10 years, range = 31-71 years) in the chronic stage of recovery after a single-event left hemisphere stroke (ie, ≥6 months poststroke; at initial MRI assessment, M = 36.4 ± 40.8 months poststroke, range = 6-202 months). Participants included in the present analysis had been recruited for various assessment and treatment studies by our group that focused on understanding lesion-deficit relationships and treated aphasia outcomes.
Inclusion criteria for these studies were as follows: between the ages of 21 and 85 years, premorbidly right-handed individuals in the chronic (≥6 months poststroke) stage of recovery following a single-event left hemisphere stroke, presence of aphasia (as indicated by a Western Aphasia Battery24,25 (WAB) Aphasia Quotient (AQ) <93.8), and able to undergo neuroimaging on a 3T MRI scanner. All participants presented with left hemisphere stroke to the territory of the middle cerebral artery. Exclusion criteria included positive history of developmental speech/language impairment, concomitant traumatic brain injury, or other neurologic illness affecting the brain.
In addition to the above criteria, participants who met these additional criteria were included in the present analysis: (1) received a language evaluation using the WAB at initial evaluation, (2) had T1- and T2-weighted scans acquired within 1 week of initial WAB testing, and (3) had a follow-up WAB evaluation at least six months after the initial assessment. To ensure that a subsequent stroke did not occur between initial and follow-up testing, all participants were asked if any significant medical events (eg, stroke, brain injury, tumor, other relevant diagnoses) had occurred in the interval between testing. Subsequent stroke/neurological event was considered an exclusionary factor for this study. No participants reported any exclusionary events at time of follow-up testing.
The final sample of 35 participants included here had a moderate aphasia severity, as evidenced by a mean initial WAB AQ severity score of 55.7 ± 21.1 (range = 5.6-90.2). The mean test-retest interval for all participants was 34.8 ± 26.2 months (range = 6-87 months). Table 1 provides participant details, and Figure 1 presents a lesion overlay map for participants in this study.
Participant Demographics.
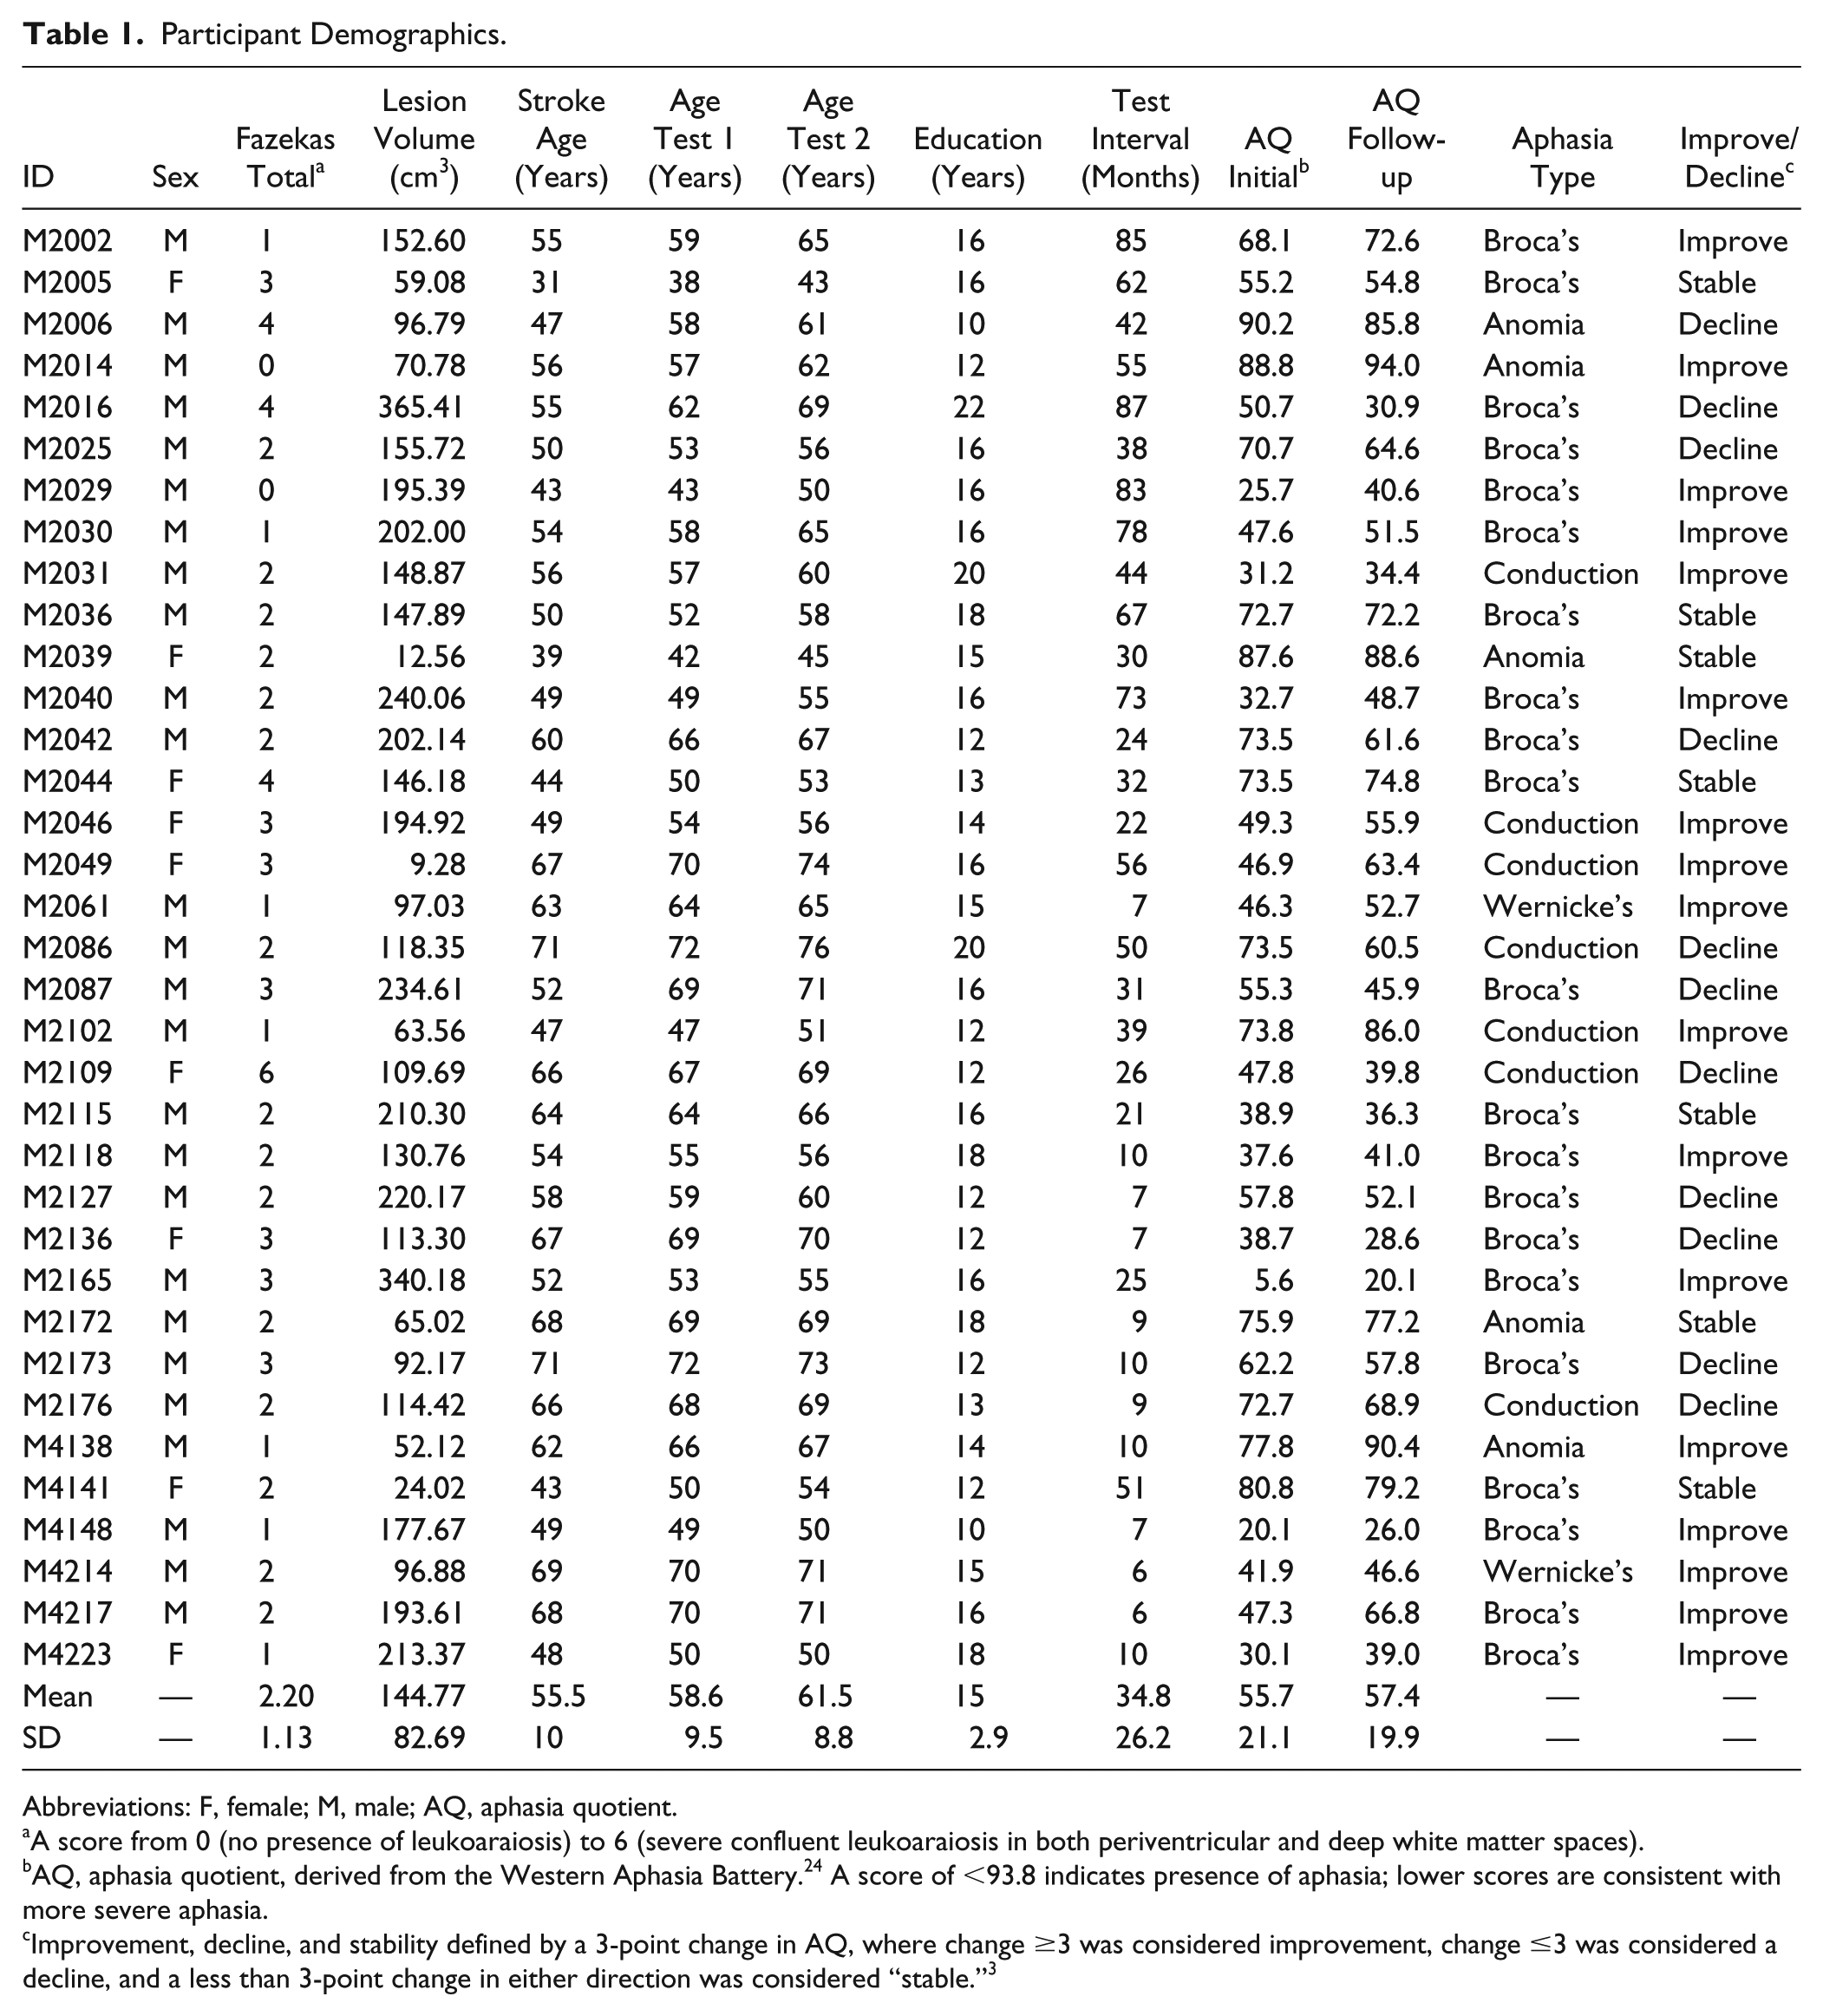
Abbreviations: F, female; M, male; AQ, aphasia quotient.
A score from 0 (no presence of leukoaraiosis) to 6 (severe confluent leukoaraiosis in both periventricular and deep white matter spaces).
AQ, aphasia quotient, derived from the Western Aphasia Battery. 24 A score of <93.8 indicates presence of aphasia; lower scores are consistent with more severe aphasia.
Improvement, decline, and stability defined by a 3-point change in AQ, where change ≥3 was considered improvement, change ≤3 was considered a decline, and a less than 3-point change in either direction was considered “stable.” 3
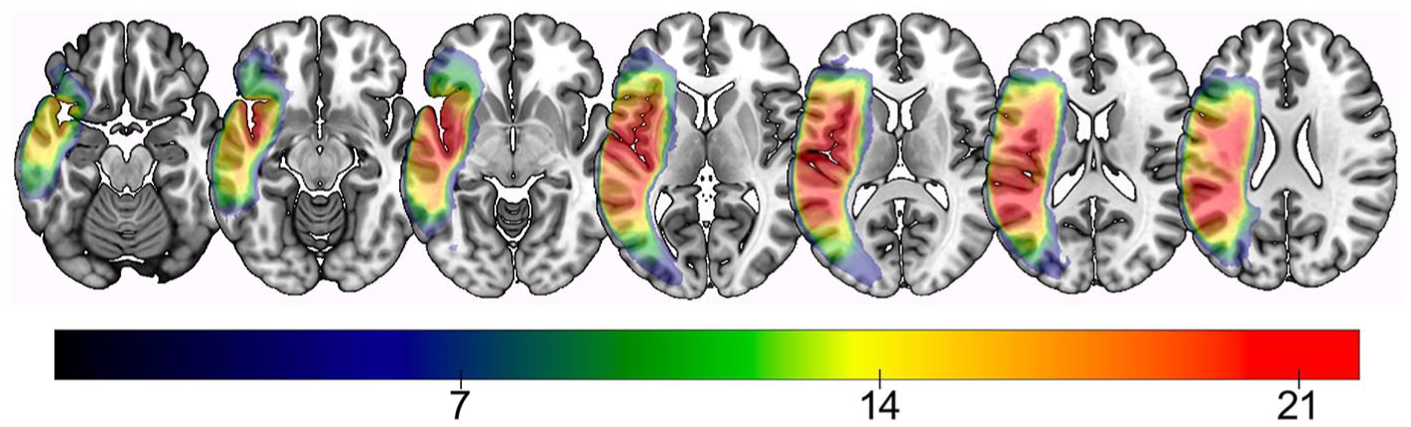
Lesion overlay map of all participants. Warmer colors indicate greater areas of lesion overlap, that is, voxels where more subjects share damage. Color bar indicates the minimum number of participants with damage to that region.
All participant testing took place at research laboratories at the University of South Carolina and Medical University of South Carolina. Institutional Review Boards at each University approved studies from which these data were obtained, and all participants provided informed consent.
Neuroimaging
All participants underwent high-resolution T1- and T2-weighted neuroimaging. T1- and T2-weighted images were acquired on a Siemens Trio 3T scanner equipped with a 12-element head coil, with the following parameters: T1-weigthed imaging utilized an MP-RAGE sequence with 1 mm isotropic voxels, a 256 × 256 matrix size, a 9° flip angle, and a 92-slice sequence with repetition time (TR) = 2250 ms, inversion time (TI) = 925 ms, and echo time (TE) = 4.11 ms. T2-weighted scans were acquired using a 3-dimensional T2-weighted SPACE sequence covering the whole head and with a resolution of 1 mm3 was used (field of view = 256 × 256 mm, 160 sagittal slices, variable degree flip angle, TR = 3200 ms, TE = 212 ms).
Predictor Variables Obtained From Neuroimaging
Leukoaraiosis Severity
Leukoaraiosis was scored on the T2-weighted MRI scans using the Fazekas scale, 13 a visual rating scale. The Fazekas scale rates periventricular hyperintensities (PVH) and deep white matter hyperintensities (DWMH) individually, each on a 0 to 3 scale, for a total score between 0 and 6. Of note, total Fazekas scores ≥3 have been considered to reflect severe white matter changes, as these scores correspond to the presence of early-confluent or confluent WMH. 26 Because of variability in left hemisphere lesion size and location, ratings were completed for the right hemisphere only, as per prior work in post-stroke individuals 23 and the assumption that leukoaraiotic changes are generally symmetric between hemispheres. 27 Scans were rated by consensus by authors AB and LJ, who were blind to all participant information. A third rater (author BS, also blinded to participant information) rated a subset of scans (22%) for interrater reliability. A 2-way mixed-effects model with absolute agreement showed excellent interrater reliability (single measures intraclass correlation coefficient = 0.86). Figure 2 displays a sample of mild, moderate, and severe leukoaraiosis from our sample. Total Fazekas scores (the sum of the PVH and DWMH totals, ie, ranging between 0 and 6) were used to predict initial aphasia severity and change in aphasia severity.
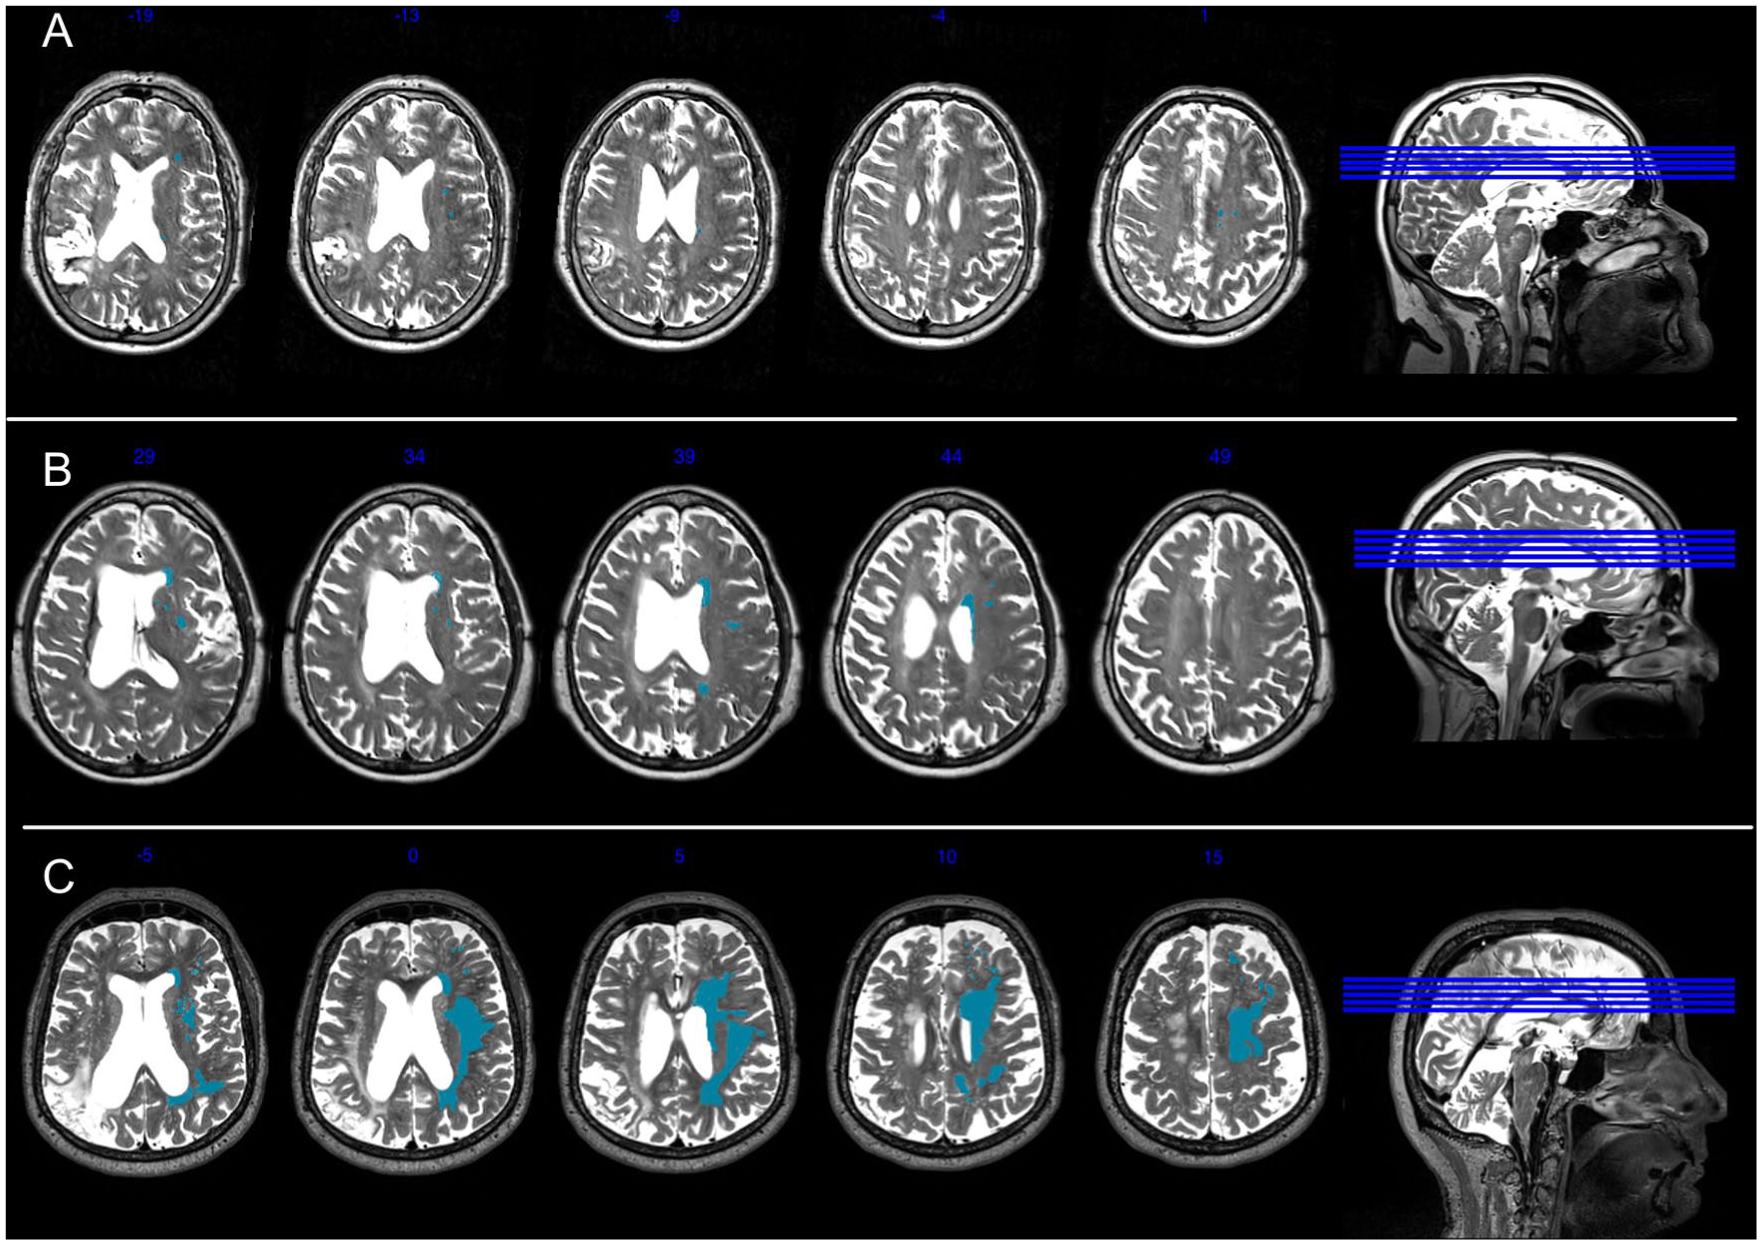
Example Fazekas ratings. This figure presents a participant with mild leukoaraiosis (Panel A: Total Fazekas score = 1 [DWMH score = 1; PVH = 0], participant M2061), a participant with early confluent leukoaraiosis (Panel B: Total Fazekas score = 4 [DWMH = 2; PVH = 2], participant M2049), and a participant with severe confluent leukoaraiosis (Panel C: Total Fazekas score = 6 [DWMH = 3; PVH = 3], participant M2109). Right hemisphere WMHs are highlighted in blue for illustrative purposes. DWMH, deep white matter hyperintensities; PVH, periventricular hyperintensities.
Lesion Volume
Lesion volume was obtained following normalization of participant MRIs. Normalization procedures were as follows: First, stroke lesions were manually traced by a stroke neurologist blind to participant testing (author LB) in MRIcron 28 on individual T2-MRIs (in native space). The T2 image was co-registered to the T1 image, and the lesion was then spatially transformed into native T1 space. Resliced lesion maps were smoothed with a 3mm full-width half maximum Gaussian kernel to smooth sharp edges commonly associated with hand drawing. Enantiomorphic segmentation-normalization was then employed using SPM12 and a series of custom MATLAB 29 scripts. This procedure included the following: (1) a mirrored image of the right hemisphere was created and this mirrored image was co-registered to the native T1 image. A chimeric image was then created, based on the native T1 scan with the lesioned tissue replaced by tissue from the mirrored scan. SPM12’s unified segmentation-normalization 30 warped this chimeric image to standard space, with the resulting spatial transform applied to the native T1 scan as well as the lesion map and the T2 image. (2) The normalized lesion map was then binarized using a 50% probability threshold. Lesion volume, obtained from the normalized lesion maps, was used to determine the spatial extent of the stroke lesion, where lesion volume (in cm3) was used as a predictor variable in regression models.
Statistical Methods
SPSS v25 was used for all data analyses. Correlations were used to determine if the primary independent variables of interest (ie, Fazekas scores, lesion volume) were intercorrelated, or correlated with years of education, stroke age, time poststroke at initial or follow-up evaluation, age at stroke, or test age. Because the Fazekas scale is an ordinal scale and data were not normally distributed, Spearman correlations were utilized for all correlations with Fazekas scores. Pearson correlation coefficients were used when 2 normally distributed variables were compared (age at both testing time points, age at stroke, time poststroke at initial and follow-up assessment, education, initial and follow-up AQ, AQ change, and lesion volume). Correlations were Bonferroni corrected by dividing the P value of .05 by the number of comparisons (see details pertaining to Bonferroni correction in Table 2).
Correlation Coefficients Relating Imaging and Biographical Variables to Aphasia Severity, and Change in Aphasia Severity. a
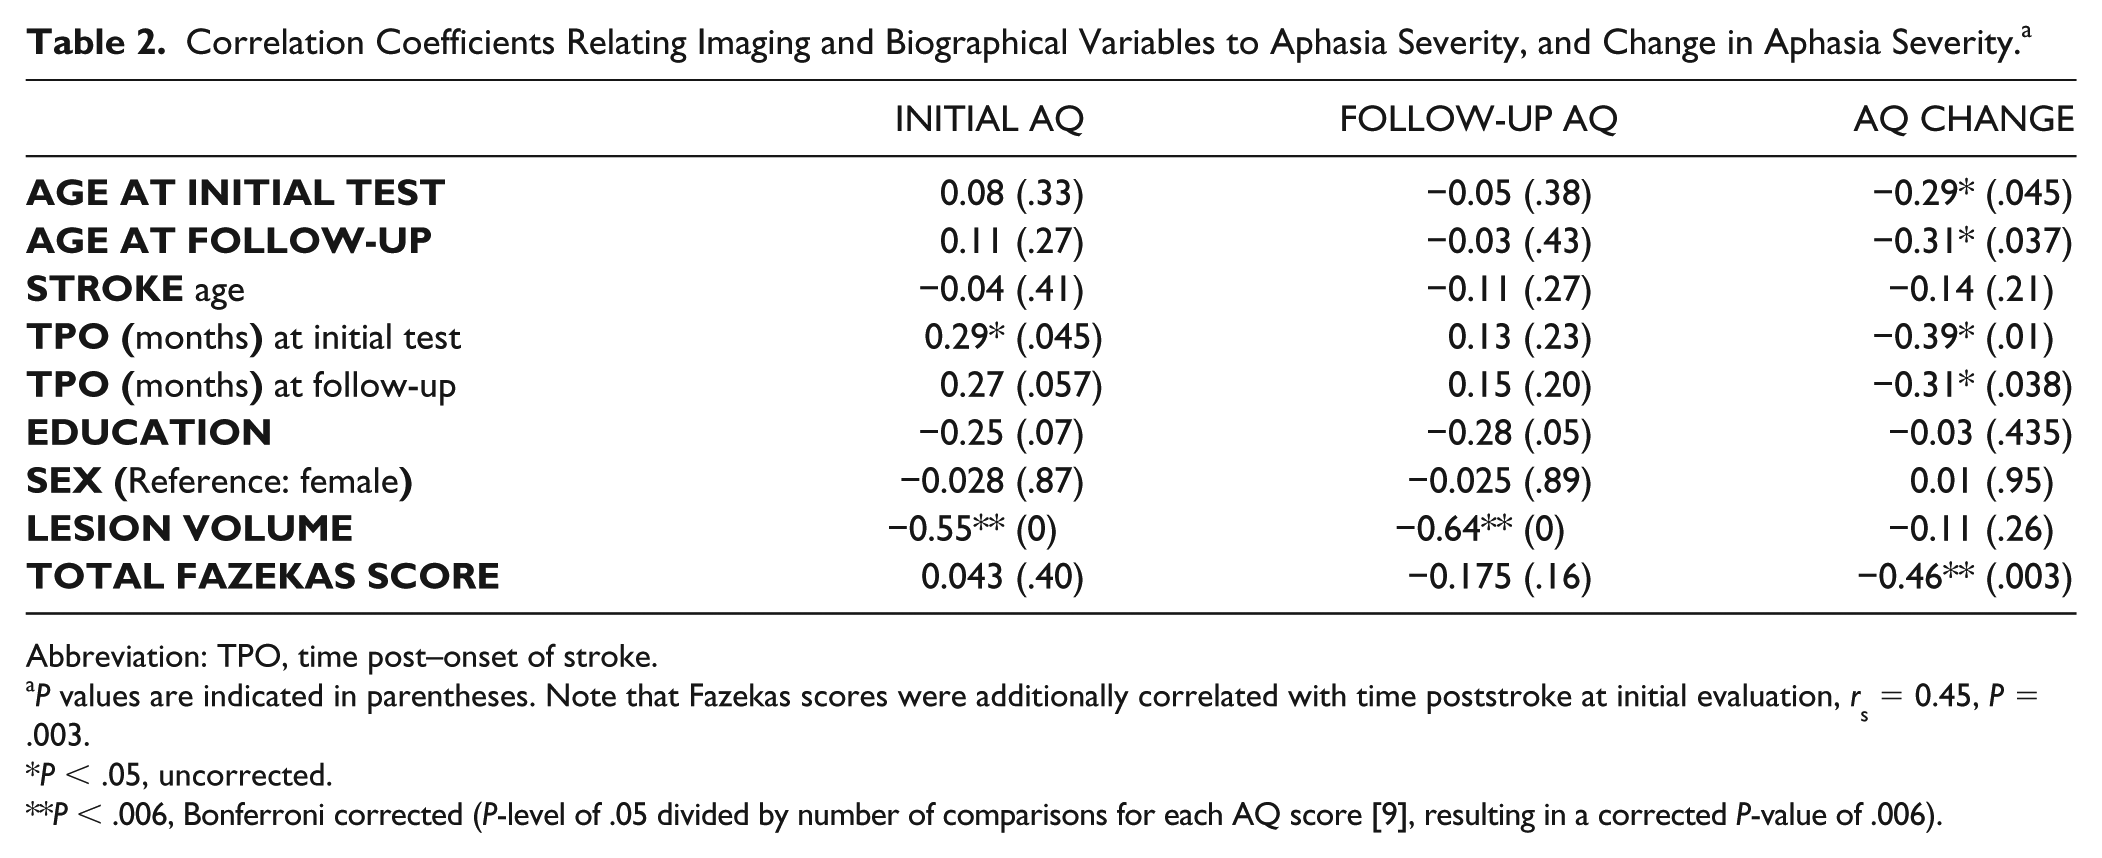
Abbreviation: TPO, time post–onset of stroke.
P values are indicated in parentheses. Note that Fazekas scores were additionally correlated with time poststroke at initial evaluation, rs = 0.45, P = .003.
P < .05, uncorrected.
P < .006, Bonferroni corrected (P-level of .05 divided by number of comparisons for each AQ score [9], resulting in a corrected P-value of .006).
A series of regression analyses (“Enter” method in SPSS) was then used to evaluate our 2 lines of inquiry. First, we evaluated the relative contribution of leukoaraiosis severity and lesion volume to predicting aphasia severity (AQ) at the initial evaluation. Lesion volume and leukoaraiosis severity were entered as predictors to a model with initial AQ as the dependent variable. Because time poststroke at initial evaluation was significantly correlated with initial AQ, it was also entered into the model (see correlation results in the Results section).
Second, we evaluated the relative contribution of leukoaraiosis severity and lesion volume to predicting change in aphasia severity (AQ). Again, lesion volume and leukoaraiosis severity were entered as predictors, this time predicting the raw change in AQ from initial to follow-up assessment.* Initial AQ was also used as a predictor in this analysis, alongside stroke age and time post-stroke at follow-up assessment, as these variables were significantly correlated with AQ change (see correlation results in the Results section).
Results
Correlations Between Imaging Variables and Biographical Factors
The mean Fazekas score for all participants was 2.2 ± 1.3 (range = 0-6), and lesion volume was 144.8 cm3 (SD = 82.7, range = 9.3-365.4 cm3). Fazekas scores and lesion volume were not correlated (rs = 0.01, P = .48). Fazekas scores were significantly correlated with time poststroke (rs = 0.45, P = .003), but not education (rs = −0.05, P = .38) or age at stroke (rs = −0.07, P = .34). Correlations between Fazekas scores and age at each of the testing time points approached statistical significance (rs = 0.25, P = .08; rs = 0.26, P = .06, for initial and follow-up, respectively).
Correlations Between Imaging Variables and Aphasia Severity
Fazekas scores were not correlated with initial or follow-up AQ (P > .15 for both), but when controlling for time poststroke (as time post-onset was significantly correlated with Fazekas scores, initial AQ, and AQ change, P < .045 for all), Fazekas scores were significantly correlated with follow-up AQ scores, rs = −0.34, P = .048. Notably, there was a significant negative correlation between Fazekas total and AQ change (rs = −0.46, P < .003), where more severe leukoaraiosis was associated with declining AQ scores (ie, worsening aphasia). This correlation between Fazekas scores and AQ change remained significant when controlling for time poststroke at initial assessment, rs = −0.36, P = .036.
Lesion volume was significantly correlated with initial (r = −0.55, P < .003) and follow-up AQ (r = −0.64, P < .0001), where larger lesions were associated with more severe aphasia at both initial and follow-up evaluation. Lesion volume was not correlated with AQ change (r = −0.11, P = .26). Results from the correlation analyses are presented in Table 2.
Predicting AQ and AQ Change
Assumptions of linear regression: For both regression analyses, there was independence of residuals, indicated by a Durbin-Watson statistic of 1.9 (initial AQ) and 2.2 (AQ change). No outliers were identified for either analysis; all cases had a standardized residual less than ±3 SDs; as well, no outliers were identified using the outlier labeling rule. 32 Visual inspection of standardized residuals versus standardized predicted values revealed homoscedasticity for both analyses, and residuals were normally distributed as visualized by normal probability plots. Finally, variance inflation factors (VIF) for both models do not suggest issues with collinearity with the data (VIF < 1.8 for across models).
In addressing our first line of inquiry, lesion volume and time poststroke at evaluation were the 2 significant predictors of initial aphasia severity, accounting for over one-third of the variance, F(4, 34) = 6.1, P < .001, adjusted R2 = 0.37. Larger lesions were associated with more severe aphasia at initial evaluation (t = −4.3, P = .001), and for every 1-month increase in time poststroke at assessment, expected AQ increase was 0.21 points (t = 2.66, P = .01). Figure 3a presents a scatterplot illustrating the relationships between time post-onset at initial evaluation and initial AQ, and lesion volume and initial AQ.
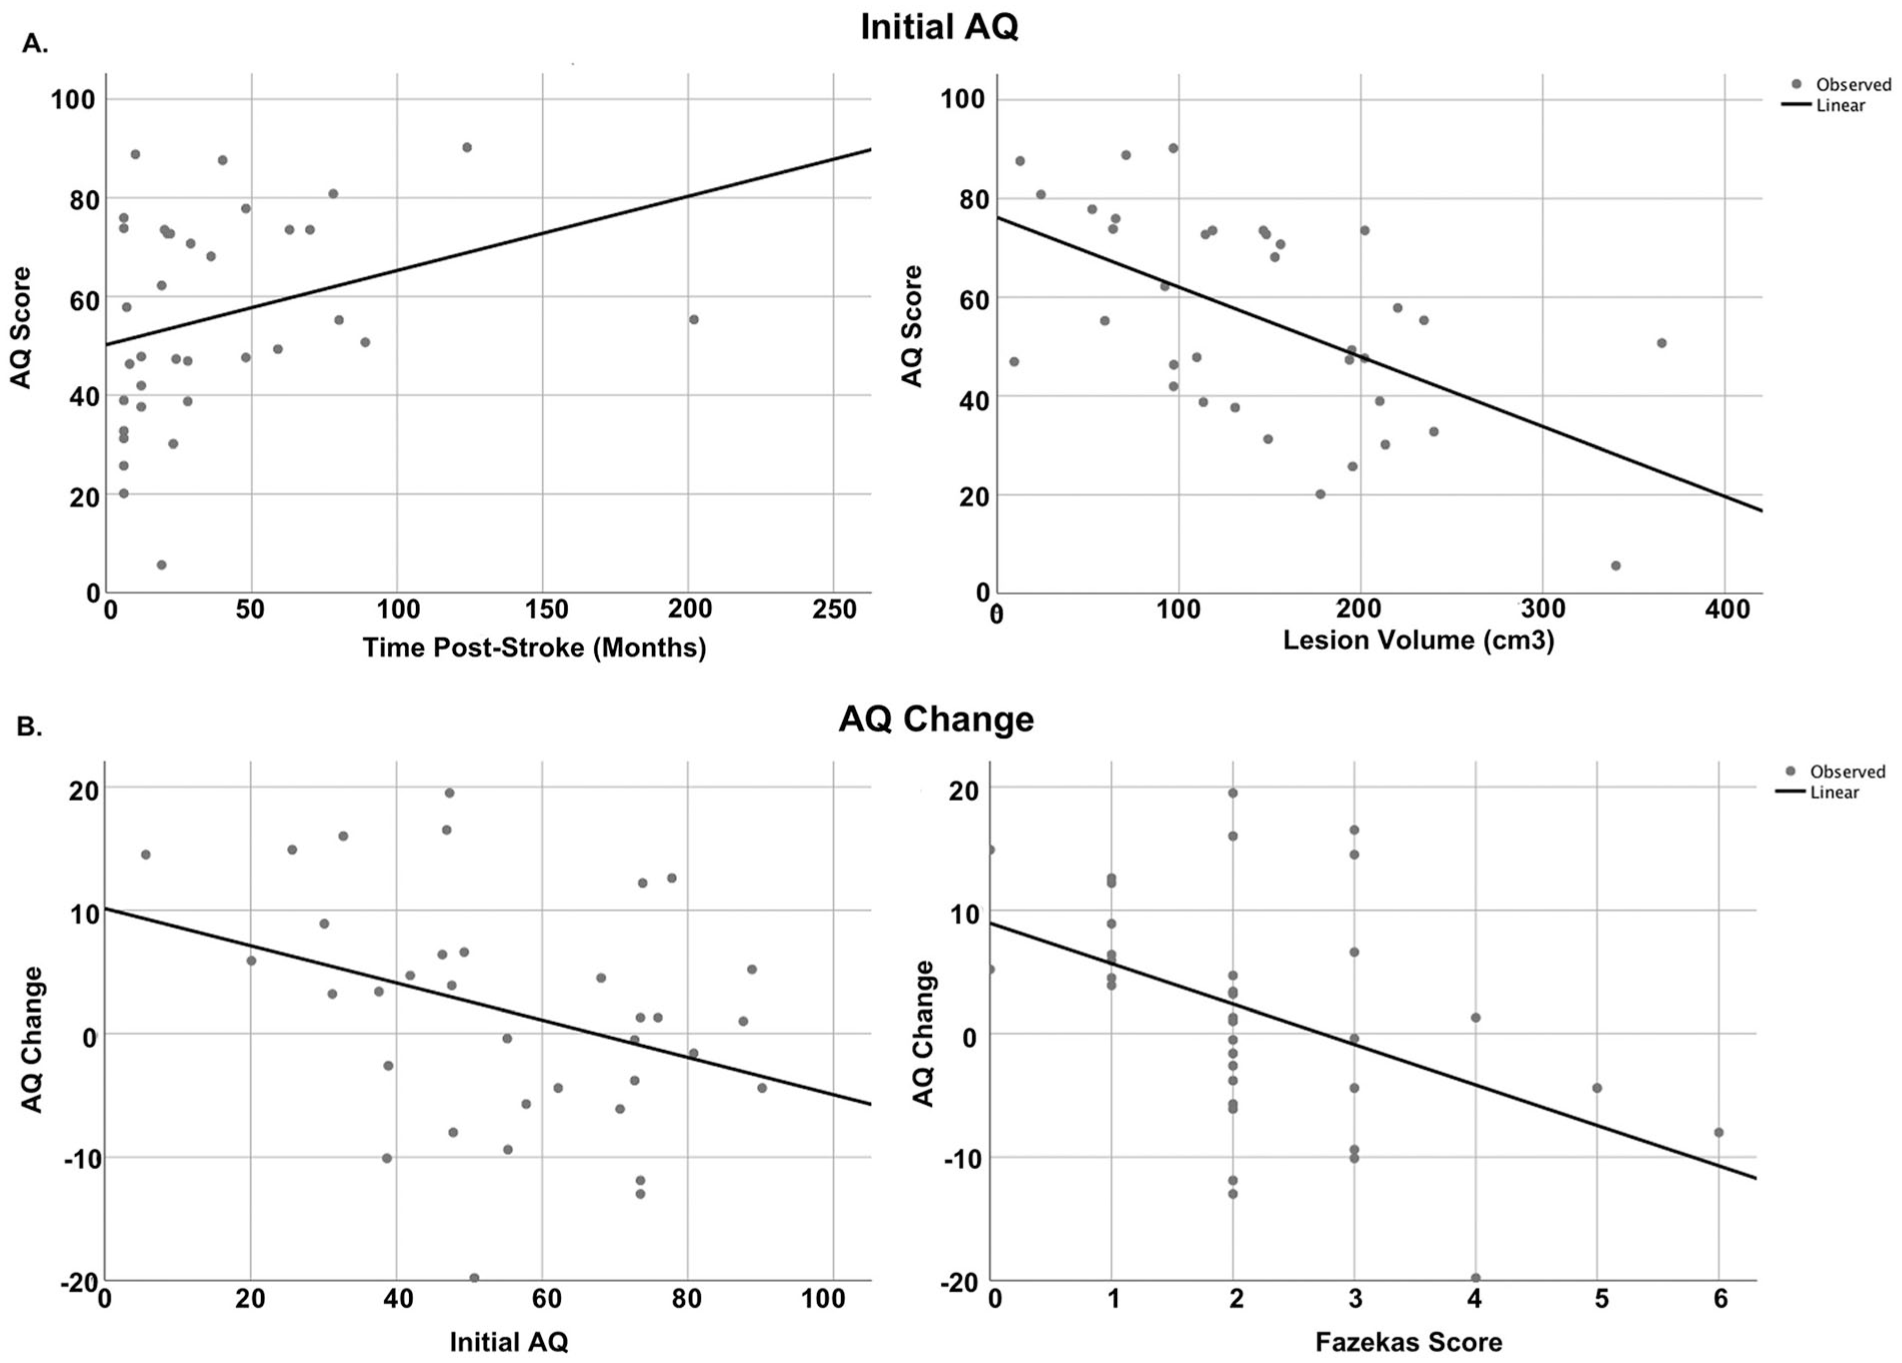
Scatterplots between dependent variables and predictors. Panel a: Scatterplot showing relationship between initial aphasia severity with lesion volume and time post-onset at initial evaluation. Panel b: scatterplots showing the relationships between aphasia quotient (AQ) change with initial AQ and total Fazekas scores.
In addressing our second line of inquiry, predicting change in aphasia severity, initial AQ and total Fazekas scores together predicted AQ change, accounting for 33% of the variance, F(5, 34) = 4.3, P = .005, adjusted R2 = 0.33. More severe leukoaraiosis at initial evaluation predicted decline in AQ at follow-up, as did higher initial AQ scores. Specifically, for every 1-point increase in Fazekas score, AQ decreased by 2.6 points (t = −2.3, P = .028), and for every 1-unit increase in initial AQ, follow-up AQ decreased by 0.22 (t = −2.6, P = .014). Figure 3b presents scatterplots between AQ change and Fazekas scores, as well as AQ change and initial severity. The results from both regression models are presented in Table 3.
Results From Regression Models.
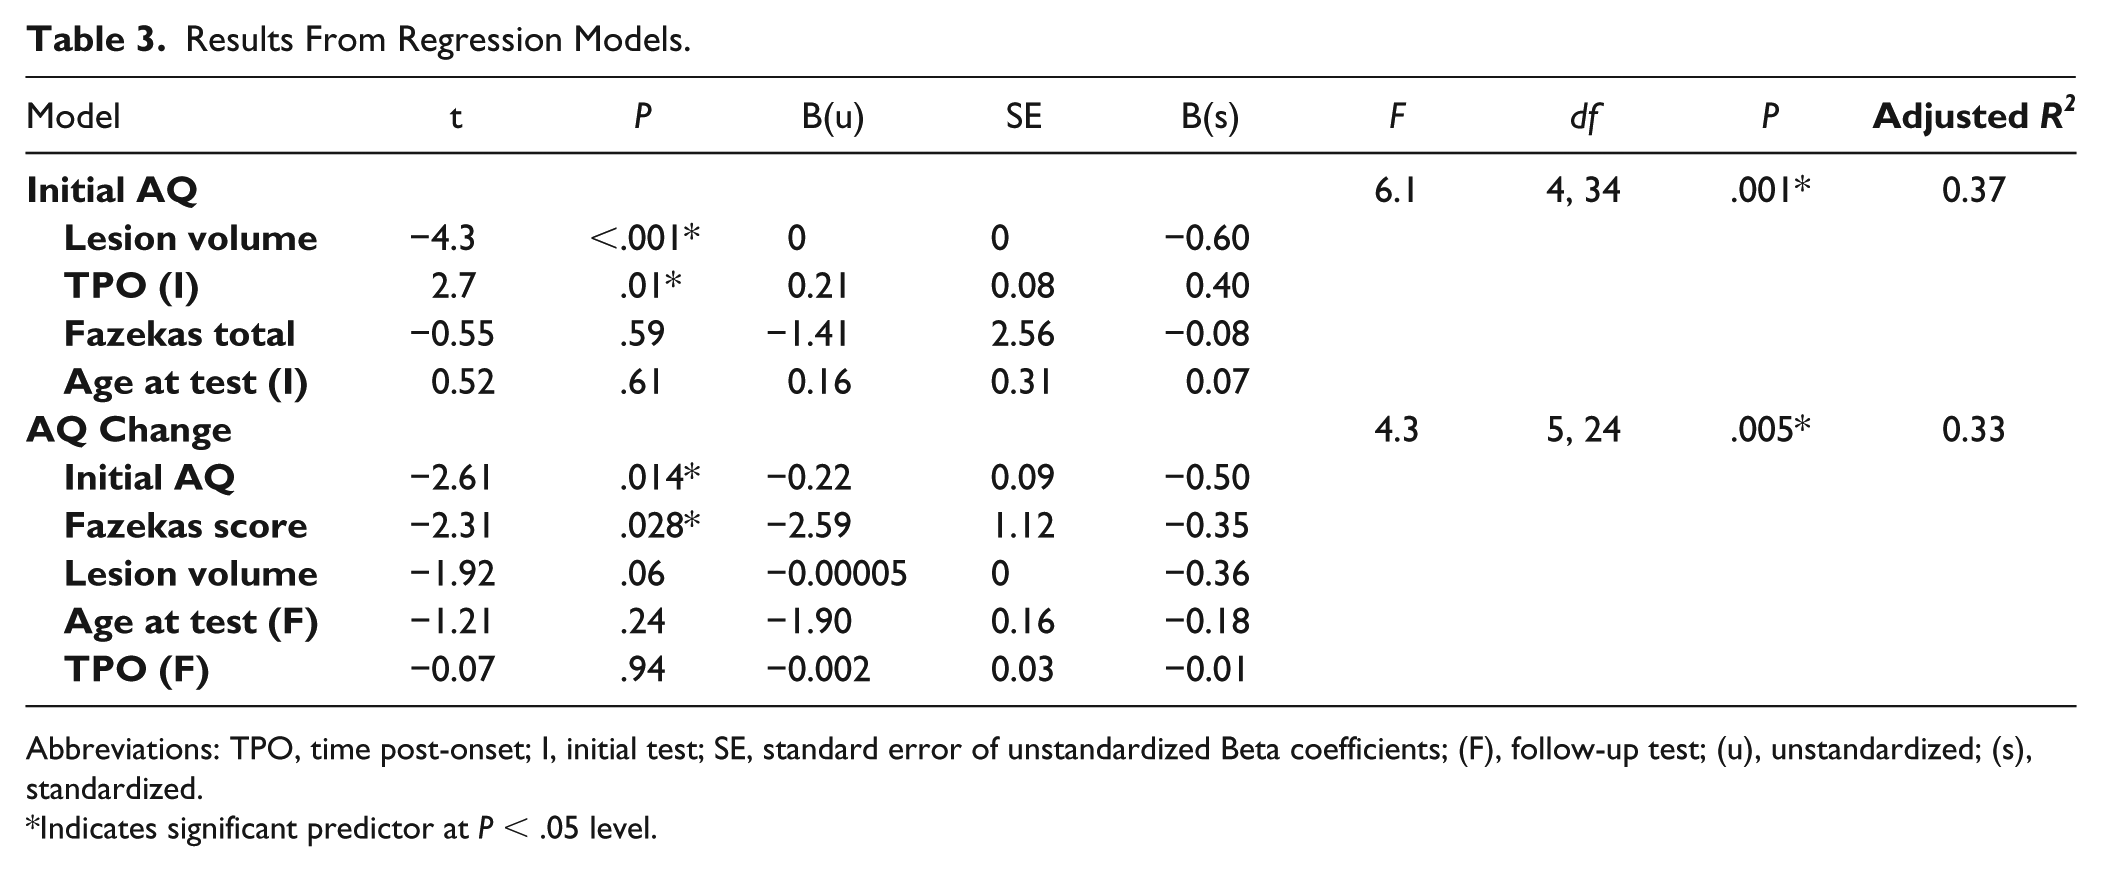
Abbreviations: TPO, time post-onset; I, initial test; SE, standard error of unstandardized Beta coefficients; (F), follow-up test; (u), unstandardized; (s), standardized.
Indicates significant predictor at P < .05 level.
As a post hoc analysis, a binary logistic regression was conducted to determine the odds of language decline based on Fazekas scores. Only those who demonstrated a clinically meaningful improvement or decline were included in this analysis (n = 28). Consistent with Holland et al, 3 “improvement” and “decline” were coded as binary dependent variables, where a participant was labeled “improved” if they had at least a 3-point AQ increase at follow-up WAB testing, and those who demonstrated at least a 3 point AQ decrease at follow-up testing were labeled “decliners.” Total Fazekas scores were entered as independent variables. This analysis was significant, χ2(1) = 11.39, P < .001, Nagelkerke r2 = 0.45, where for every 1-point increase in Fazekas score, the odds of decline was 4.3, 95% CI = 1.2-14.7 (β = 1.48, P = .017). To illustrate further the influence of Fazekas scores on AQ decline, Figure 4 shows the percentage of participants whose language improved (≥3-point increase in AQ), declined (≤3-point decrease in AQ), and remained stable (<3-point AQ change in either direction) 3 for each one-point change in total Fazekas score.
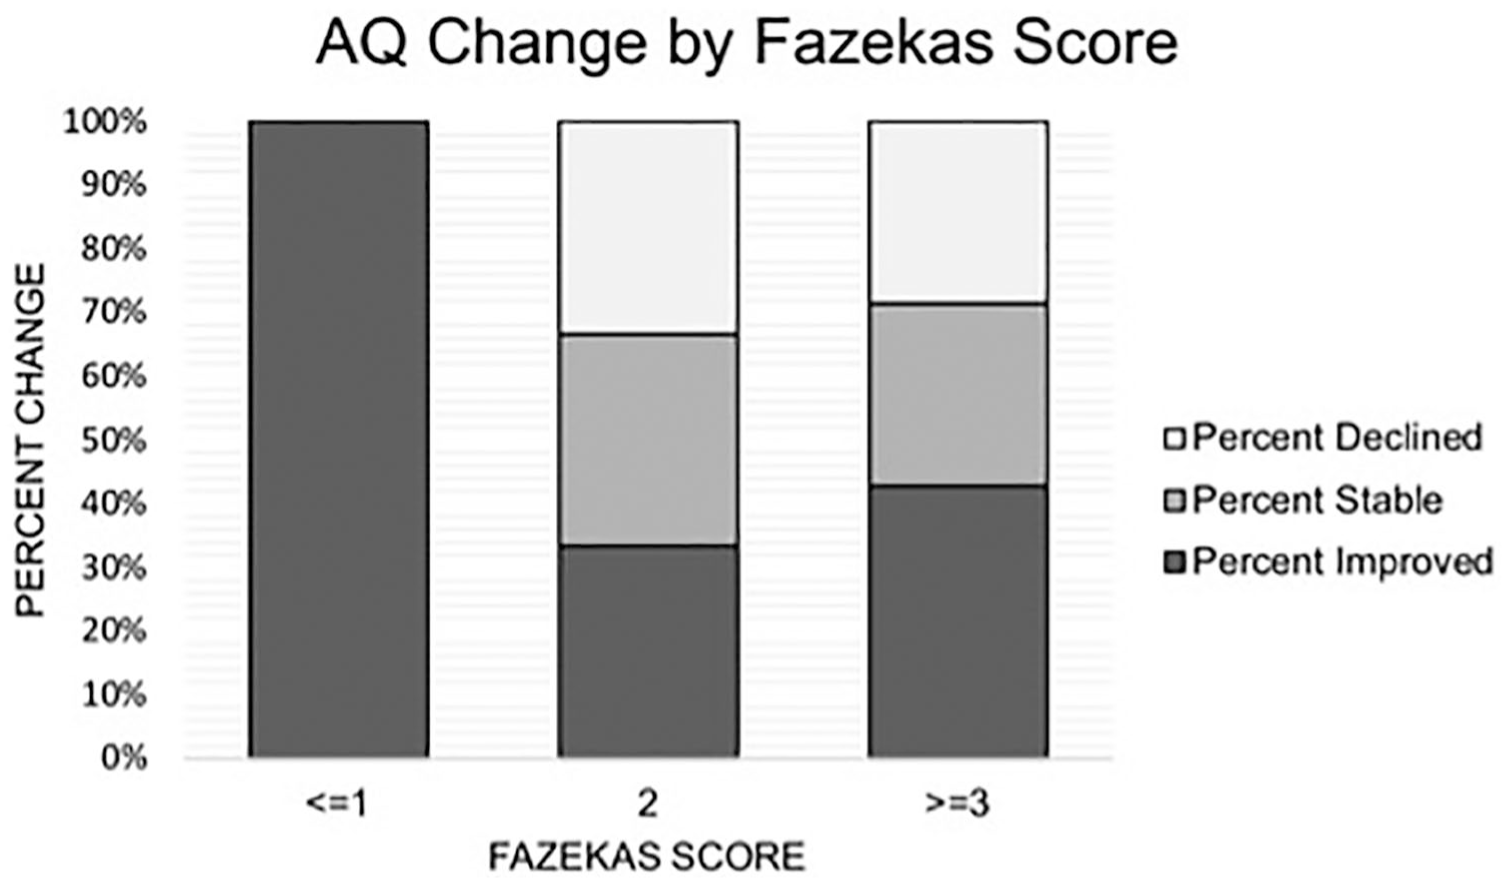
Aphasia quotient (AQ) change by Fazekas score. Percentage of participants who increased (≥3-point increase in AQ), decreased (<3-point decrease in AQ), and demonstrated stable language abilities (<3-point AQ change in either direction) 3 for each one-point change in total Fazekas score.
Discussion
This study investigated 2 lines of inquiry regarding the effects of leukoaraiosis severity in chronic poststroke aphasia; specifically, its relative impact on initial aphasia severity and on longitudinal change in aphasia severity. Our results showed that lesion volume and time post-stroke at initial assessment were the best predictors of initial aphasia severity; leukoaraiosis severity was not a significant predictor of initial aphasia severity in the chronic stage. Of note, it is possible that a relationship between baseline aphasia severity and leukoaraiosis may become evident with a larger sample size, as other work by our group 16 indeed suggests a relationship with baseline AQ and leukoaraiosis in a larger, partially overlapping sample. Importantly, however, the current study shows that changes in aphasia severity were driven by initial aphasia severity and leukoaraiosis severity. Specifically, higher initial AQ scores were predictive of decline; for every 1-point increase in WAB AQ at initial evaluation, expected AQ change declined by 0.22 points when holding all other variables constant. Regarding Fazekas scores, for each 1-point increase in total leukoaraiosis severity, expected AQ decline was approximately 3 points when holding all other variables constant. Participants with more severe Fazekas scores, that is, those with early confluent or confluent WMH, were those less likely to demonstrate clinically significant improvement (Figure 4). As discussed in Holland et al, 3 a 3-point change on AQ is clinically meaningful and is unlikely to be due to test-retest effects, suggesting an important role for leukoaraiosis severity in predicting clinically significant change in aphasia recovery (or decline). The results we show here corroborate recent findings from acute stroke, 23 which suggest that leukoaraiosis severity negatively affects aphasic performance over time, even years beyond the stroke.
Our behavioral outcomes—that improvements and declines in aphasia severity can occur years post-stroke—add to the literature demonstrating that long-term changes in aphasia in the chronic period are indeed possible. While our regression analyses, which included lesion volume and leukoaraiosis severity, predicted one-third of the variance in AQ change, other variables, which were not modeled here, are likely involved in the evolution of language impairment. The remaining variance in predicting AQ change may also be explained by structural changes in contralesional gray matter 2 and/or perilesional integrity, 33 It may also be the case that some participants had “normal appearing white matter” that was indeed pathological, but not yet evident for the purpose of a visual rating scale, like the Fazekas scale utilized here. 34 Therefore, the degree of white matter degradation may not be fully appreciated in our sample. However, we utilized the Fazekas scale due to its use in many prior studies,17,20,26,34,35 with a recent study concluding that it is a sufficient measure for rating leukoaraiosis in stroke survivors because of its high correlation with other gold-standard objective measuresments. 35 Indeed, it has been shown to correlate with volumetric measures of leukoaraiosis,35-37 and is highly correlated with other more fine-grained visual rating scales. 38 Nevertheless, further study should consider volumetric approaches to measuring leukoaraiosis,39,40 as well as consider other measures of white matter integrity (eg, fractional anisotropy, mean diffusivity, and other connectomic and scalar measures) as they relate to leukoaraiosis and stroke damage to understand further the mechanism by which leukoaraiosis affects language abilities. These measures could be utilized to understand how leukoaraiosis severity differentially affects white matter networks, which may have implications for cognitive-linguistic function 41 and aphasia outcomes.16,23 For example, Lawrence et al 42 investigated white matter connectivity in 115 individuals with small vessel disease (defined as the presence of lacunar infarct on MRI in addition to Fazekas scores ≥2) and found that in those with small vessel disease, global and local efficiency of white matter networks was reduced relative to matched controls, and that this compromised white matter integrity was related to cognitive decline. In the aphasia literature, several studies have found that the integrity of white matter connectivity is important for recovery, as structural white matter connectivity has been shown to predict treatment success in aphasia, 43 as well as explain overall aphasia severity, even when accounting for overall lesion volume. 44 Taken together, we suspect that leukoaraiosis affects aphasia recovery by reducing white matter network connectivity, 16 as well as potentially affecting gray matter volume in regions important for cognitive-linguistic functioning. 45
Other factors moderating the effects of leukoaraiosis on aphasia recovery have yet to be explored. As evident on Figure 4, there were some participants with milder leukoaraiosis (ie, Fazekas score of 2) who demonstrated decline as well as individuals with severe leukoaraiosis (Fazekas score ≥3) who improved or remained stable. Prior literature has suggested that punctate WMHs are likely benign, whereas more severe, confluent WMH are likely to be vascular in nature and lead to progressive decline in cognitive abilities,46,47 meaning those with more severe leukoaraiosis should be expected to decline. However, some studies have shown rather unexpected relationships between leukoaraiosis severity and behavioral decline, suggesting that individual factors may account for individual variability in the response to leukoaraiotic changes. 48 For example, Brickman and colleagues 48 investigated the extent that cognitive reserve (eg, psychosocial factors such as education and reading ability) moderates the degree to which leukoaraiosis can be “tolerated” before cognitive symptoms of these pathological changes occur. Brickman et al 48 found that although more severe leukoaraiosis was associated with reduced cognitive performance, when controlling for cognitive function (ie, executive function/processing speed, or language function), higher cognitive reserve was associated with more severe leukoaraiosis, which may serve as a “coping mechanism” for the detrimental effects of leukoaraiosis. 48 This suggests that some individual characteristics (eg, proxies of cognitive reserve) allow for compensation of the generally negative effects of leukoaraiosis, a finding that has been corroborated by other studies that have shown that education49-51 and occupation 50 may moderate the relationship between leukoaraiosis and decline.
Taken together, although leukoaraiosis is generally associated with decline, individual cognitive and behavioral factors may moderate this effect, explaining why not all participants in this study with significant leukoaraiosis demonstrated a decline in aphasia severity. A prospective study, including a larger sample size with more neural and behavioral predictors, is needed to elucidate fully the points raised in this discussion.
Limitations
Because of the retrospective nature of this study, there are several limitations that should be considered. First, the sample size was relatively small, and we were unable to control for, or identify, factors that may have influenced the presence and severity of leukoaraiosis (eg, diabetes, atherosclerotic disease, hypertension, age). Diabetes mellitus is a risk factor for leukoaraiosis, but our sample contained only 8 individuals with a diagnosis of diabetes mellitus, precluding a more detailed analysis of the effects of diabetes mellitus on leukoaraiosis severity and the evolution of aphasic impairment. In addition, although there is a link between leukoaraiosis and degenerative disease, none of the participants included here reported diagnosis of a neurodegenerative disease or recurrent stroke upon follow-up. However, the relationship between leukoaraiosis and dementia (eg, vascular and Alzheimer’s types) is difficult to disentangle,14,52 and it is possible that some of the participants included here may go on to present with a neurodegenerative diagnosis. Future, prospective studies should match participants on these risk factors to determine the relative contribution of age, health status, and other sociodemographic factors on leukoaraiosis and subsequent changes in aphasia severity.
Second, the mean stroke age of participants in this sample was relatively young (mean age at stroke = 55.5 years, SD = 10) compared with the United States national average, where three-quarters of strokes occur in individuals older than 65 years. 53 Though it should be noted that stroke rates are on the rise in younger populations (eg, 20- to 44-year-olds, 54 45- to 64-year-olds 55 ). Interestingly, while age is one of the most common risk factors for leukoaraiosis, age was not significantly correlated with Fazekas severity in our cohort (rs = 0.07 at age of stroke, rs = 0.25 at initial assessment, rs = 0.26 at follow-up, all P > .07), possibly driven by the fact that stroke itself is also a risk factor for leukoaraiosis. However, age at each evaluation time point was correlated with change in AQ, where older age at either time of test was correlated with worsening aphasia (Table 2). Holland et al 3 reported that the participants in their sample who demonstrated worsening aphasia were generally older than those who improved or remained stable (although statistical comparisons were not reported in their study). As in the current study, the participants who declined in the study by Holland et al 3 also presented with milder aphasia at initial evaluation. Accordingly, the effects of age on worsening aphasia, and how this relates to leukoaraiosis should be considered in a future study, as age may be a contributing factor.
Third, it should also be noted that the male dominated sample in this study (ie, approximately a 3:1 ratio of males:females) is not representative of the fact that when controlling for age, rates of poststroke aphasia are similar between males and females. 56 However, sex differences in leukoaraiosis have been reported, where women have been shown to demonstrate more severe leukoaraiosis,57,58 and that WMH tend to progress more rapidly in deep white matter regions. 59 However, sex differences in leukoaraiosis are not a unanimous finding. 60 Given these reported sex differences in leukoaraiosis and its progression, further study with a larger sample size should indeed explore the role of sex on leukoaraiosis in poststroke aphasia, and whether this gives rise to a sex difference in rates of decline. It is worth noting, however, that sex differences were not found in another recent study that considered improvement and decline in aphasia. 2
Finally, although we had an estimate of treatment hours all participants received while undergoing research studies conducted by our group (a measure that was not correlated with AQ change on its own, r = 0.10), we were unable to control for treatment that individuals may have received in acute inpatient or outpatient rehabilitation settings outside of our lab, factors that could have affected recovery. The current findings should be interpreted with these limitations in mind. Nevertheless, we believe that our preliminary findings persuasively suggest that leukoaraiosis severity should be studied further in chronic aphasia severity and recovery, and future prospective studies could be designed to address the limitations described above.
Conclusions and Future Directions
To conclude, this study supports prior findings that chronic aphasia is dynamic, even years poststroke.2-4 Crucially, whereas stroke lesion volume and location are conventionally cited as important predictors of aphasia severity,5-8,61 leukoaraiosis severity may be a key factor when evaluating the evolution of aphasia. The importance of prognostic indicators for recovery at all stages is critical, especially considering that the mortality rate of stroke has been declining 62 and the age of stroke is decreasing,54,55,62 meaning stroke survivors are likely to be living longer with post-stroke impairments. Continued study of the role of leukoaraiosis in clinical outcomes for individuals with aphasia may ultimately improve prognostic indicators for recovery and inform clinical decision making for stroke neurologists and speech-language clinicians. Importantly, leukoaraiosis has been referred to as a “major public health problem” because of its association with negative outcomes for quality of life and functional ability. 14 Indeed, it has been associated with cognitive decline, a four times increased risk for dementia, and double the risk of all-cause mortality. 21 Therefore, further investigation into its effects has the potential to inform further quality of life and functional outcomes for individuals with aphasia.
Footnotes
*
Although there are several ways to investigate change in poststroke behaviors, 31 we chose to evaluate change by subtracting initial AQ from follow-up AQ, as was done recently by Holland and colleagues. 3 Additionally, computing raw change allows for some appreciation of the degree of decline, beyond that which can be gleaned from follow-up AQ alone.
Author Contributions
AB conceived of the study, rated images, analyzed data, and wrote manuscript with input from coauthors; BC and LJ collected/organized data, rated images, and contributed to the manuscript; CR, LB, and GY acquired and analyzed MRI data, and contributed to the manuscript; JF led the collection/organization of behavioral and neuroimaging data, assisted with analyzes and interpretation, and contributed to the manuscript. All authors contributed to revisions and approved the final manuscript.
Declaration of Conflicting Interests
The author(s) declared no potential conflicts of interest with respect to the research, authorship, and/or publication of this article.
Funding
The author(s) disclosed receipt of the following financial support for the research, authorship, and/or publication of this article: This work was supported by grants from the National Institute on Deafness and Other Communication Disorders (NIDCD) to Julius Fridriksson (R03 DC005915, R01 DC008355, DC008355-03S1, R01 DC009571, DC009571-01A1S1, R03 DC010262, R01 DC011739, R01 DC014170, P50 DC014664). Alexandra Basilakos was funded by T32 DC014435.