
Abstract
Background. Stroke is a leading cause of adult disability owing largely to motor impairment and loss of function. After stroke, there may be abnormalities in γ-aminobutyric acid (GABA)-mediated inhibitory function within primary motor cortex (M1), which may have implications for residual motor impairment and the potential for functional improvements at the chronic stage. Objective. To quantify GABA neurotransmission and concentration within ipsilesional and contralesional M1 and determine if they relate to upper limb impairment and function at the chronic stage of stroke. Methods. Twelve chronic stroke patients and 16 age-similar controls were recruited for the study. Upper limb impairment and function were assessed with the Fugl-Meyer Upper Extremity Scale and Action Research Arm Test. Threshold tracking paired-pulse transcranial magnetic stimulation protocols were used to examine short- and long-interval intracortical inhibition and late cortical disinhibition. Magnetic resonance spectroscopy was used to evaluate GABA concentration. Results. Short-interval intracortical inhibition was similar between patients and controls (P = .10). Long-interval intracortical inhibition was greater in ipsilesional M1 compared with controls (P < .001). Patients who did not exhibit late cortical disinhibition in ipsilesional M1 were those with greater upper limb impairment and worse function (P = .002 and P = .017). GABA concentration was lower within ipsilesional (P = .009) and contralesional (P = .021) M1 compared with controls, resulting in an elevated excitation-inhibition ratio for patients. Conclusion. These findings indicate that ipsilesional and contralesional M1 GABAergic inhibition are altered in this small cohort of chronic stroke patients. Further study is warranted to determine how M1 inhibitory networks might be targeted to improve motor function.
Keywords
Introduction
Stroke is the second leading cause of death and the third leading cause of disability among adults worldwide.1,2 Motor impairment is common after stroke, affecting around 80% of patients and recovery of movement is important for regaining independence. 3 In human primary motor cortex (M1), the main inhibitory neurotransmitter γ-aminobutyric acid (GABA) plays a critical role in shaping corticomotor output 4 and the induction of plasticity. 5 Early after stroke, GABAergic activity may be lower in ipsilesional M1, 6 which may support cortical reorganization and recovery. 7 Downregulation of GABAergic inhibition within ipsilesional M1 at the chronic stage may have implications for residual motor impairment and the potential for functional improvements. Disinhibition within contralesional M1 may facilitate upper-limb functional outcomes in patients with more severe residual impairment.8-12
Paired-pulse transcranial magnetic stimulation (TMS) protocols can be used to assess GABA-mediated neurotransmission within M1. Specifically, short-interval intracortical inhibition (SICI), long-interval intracortical inhibition (LICI), and late cortical disinhibition (LCD) are proposed markers of postsynaptic GABAA, 13 postsynaptic GABAB, 14 and presynaptic GABAB 15 receptor activity, respectively. Conventional TMS protocols use constant conditioning and test stimulation parameters, and inhibition is quantified as the decrease in motor-evoked potential (MEP) amplitude elicited by the conditioned test stimulus relative to the test stimulus alone. 16 However, conventional stimulation parameters (ie, 1 mV MEP) can be difficult to obtain in some patients as corticomotor excitability is lower in ipsilesional M1. 6 An alternative approach is threshold tracking paired-pulse TMS, whereby inhibition is quantified as the increase in test stimulus intensity required to maintain a small, more achievable, target MEP amplitude (200 μV) in the presence of the conditioning stimulus.17,18 Threshold-based quantification of inhibition reduces the confound of MEP variability associated with amplitude-based methods. 19 MEP variability may be greater at ages typical of stroke incidence 20 and following damage to the corticomotor pathway. 21 Therefore, threshold tracking may offer advantages for assessing GABA-mediated neurotransmission within ipsilesional M1 after stroke.
GABA concentration within M1 can be quantified noninvasively using magnetic resonance spectroscopy (MRS). 22 MRS provides a means to quantify GABA in ipsilesional M1 of patients without MEPs in distal muscles of the paretic upper limb. These patients typically exhibit less potential for further gains in upper limb function than patients with MEPs. 23 However, such gains may occur through mechanisms that do not rely on the lateral corticospinal tract. Previous studies have shown that GABA concentration may be lower in ipsilesional M1 of chronic stroke patients compared with controls.24,25 It is unknown whether stroke effects on GABA concentration are specific to ipsilesional M1, or extend to other brain regions such as contralesional M1.
The primary aim of this study was to investigate GABA neurotransmission and concentration within ipsilesional and contralesional M1 using threshold tracking paired-pulse TMS and MRS. We hypothesized that GABA-mediated neurotransmission and concentration would be altered in ipsilesional, but not contralesional M1, compared with age-similar controls. A secondary aim was to determine if GABAergic inhibition within M1 relates to upper limb impairment and function at the chronic stage.
Methods
Participants
Twelve people with first ever mono-hemispheric stroke at least 6 months earlier participated in the study (Table 1). Participants were excluded if they had contraindications to TMS or magnetic resonance imaging, or had significant aphasia or impaired cognition precluding informed consent. These data were compared with data from 16 neurologically healthy age-similar controls reported previously. 26 Each participant provided written informed consent and the study was approved by the University of Auckland Human Participants Research Ethics Committee.
Patient Characteristics.
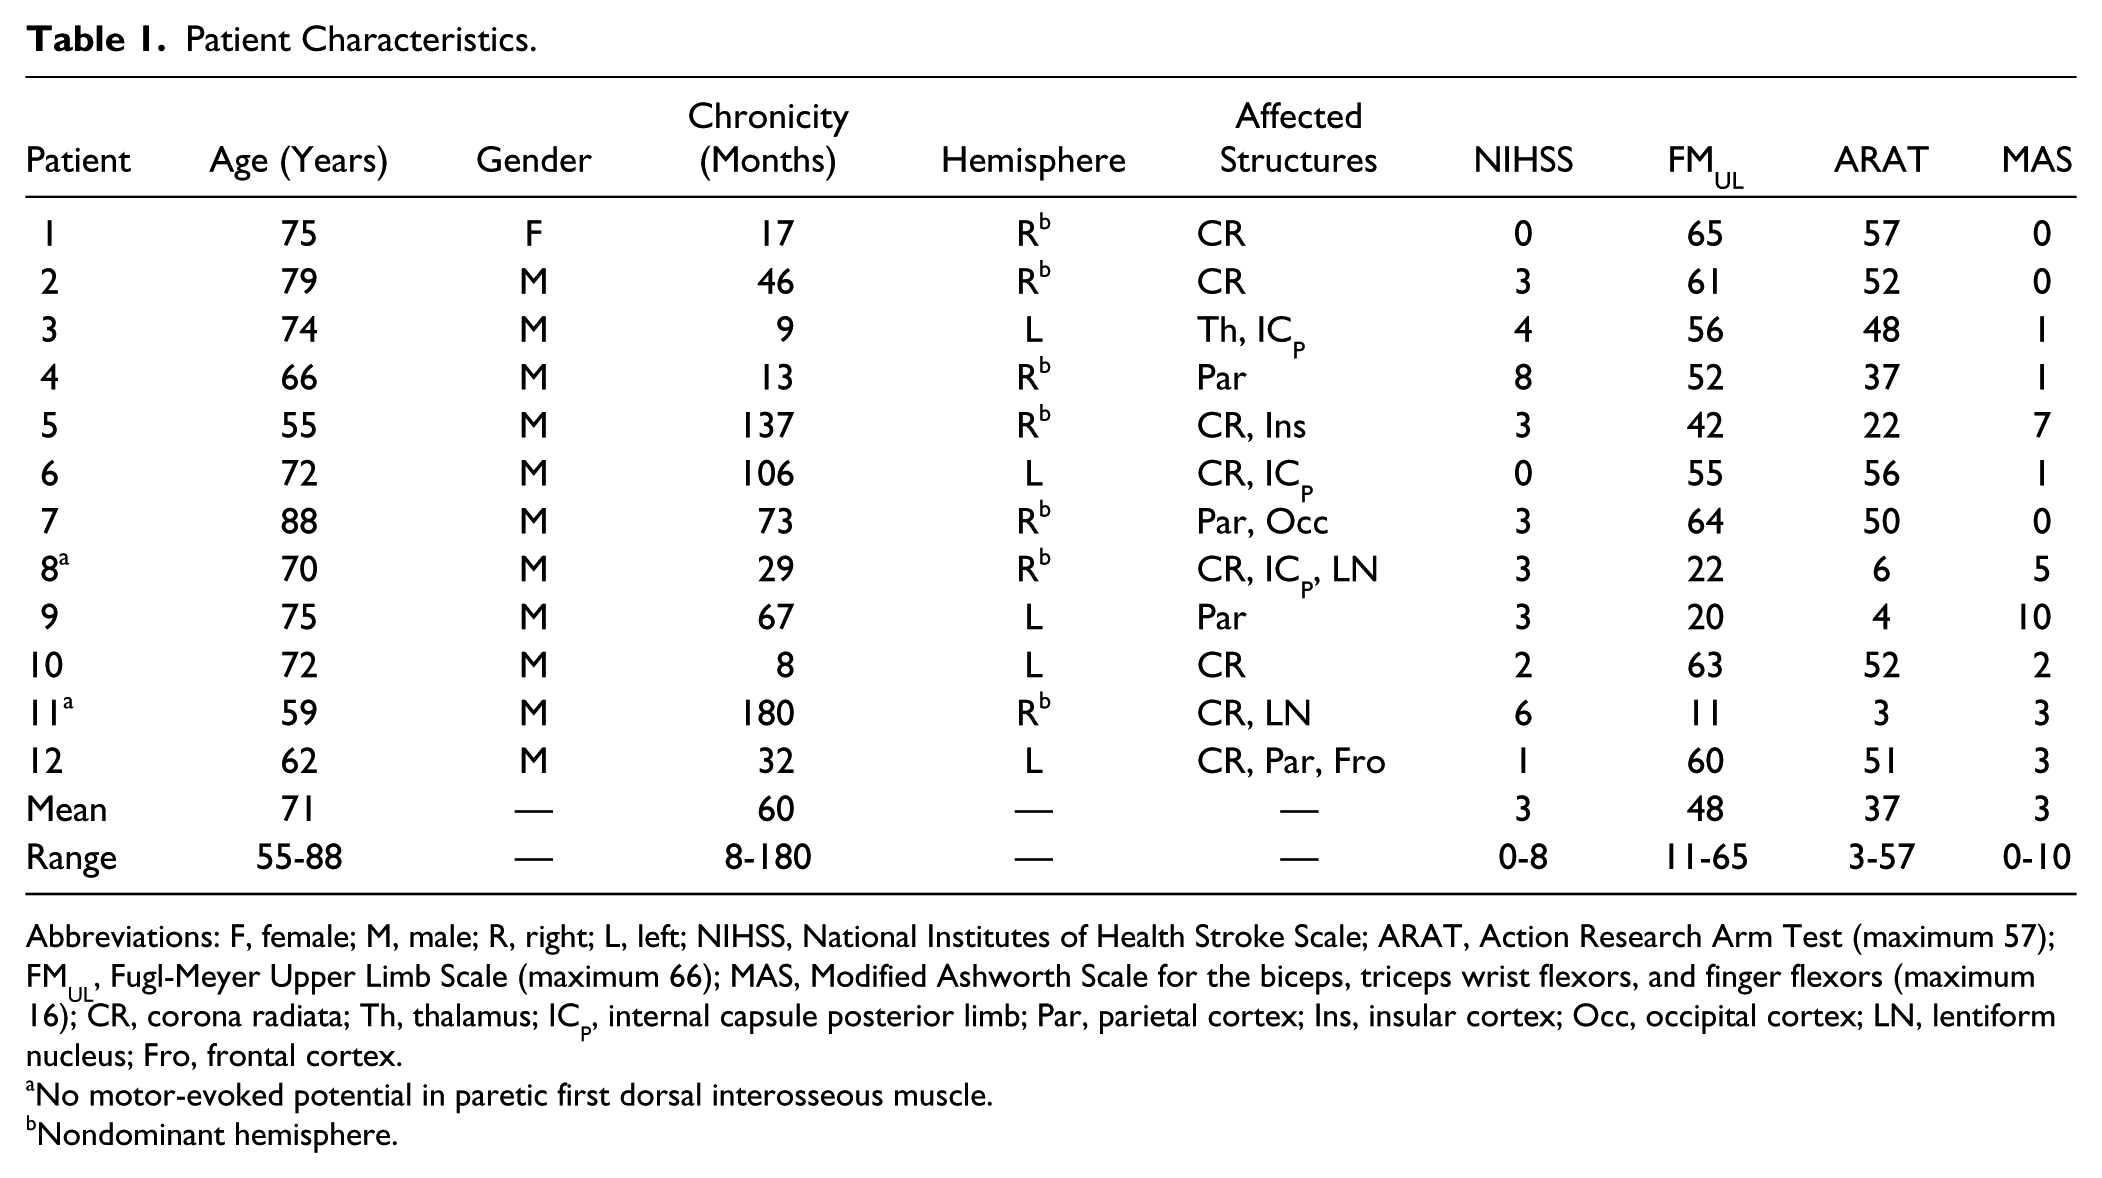
Abbreviations: F, female; M, male; R, right; L, left; NIHSS, National Institutes of Health Stroke Scale; ARAT, Action Research Arm Test (maximum 57); FMUL, Fugl-Meyer Upper Limb Scale (maximum 66); MAS, Modified Ashworth Scale for the biceps, triceps wrist flexors, and finger flexors (maximum 16); CR, corona radiata; Th, thalamus; ICP, internal capsule posterior limb; Par, parietal cortex; Ins, insular cortex; Occ, occipital cortex; LN, lentiform nucleus; Fro, frontal cortex.
No motor-evoked potential in paretic first dorsal interosseous muscle.
Nondominant hemisphere.
Clinical Assessments
Stroke severity was evaluated with the National Institutes of Health Stroke Scale. Upper limb impairment was assessed with the upper limb section of the Fugl-Meyer Scale (FMUL, maximum 66). Upper limb function was assessed with the Action Research Arm Test (ARAT, maximum 57). Spasticity in the biceps, triceps, wrist flexors, and finger flexors was assessed with the Modified Ashworth Scale. Assessments were carried out by a clinical assessor trained in the administration of these tests.
Recording and Stimulation Procedures
Surface Electromyography
Surface electromyography (EMG) was recorded from the first dorsal interosseous (FDI) muscle of each hand, using 10-mm diameter Ag-AgCl recording electrodes (Ambu, Ballerup, Denmark) arranged in a belly-tendon montage, with a 20-mm diameter ground electrode (3M Health Care, Canada) positioned on the dorsum of each hand. EMG signals were amplified (1000×) and band-pass filtered (10-1000 Hz) using a CED1902 amplifier (Cambridge Electronic Design Ltd, Cambridge, UK), sampled at 2 kHz using a CED1401 interface and recorded onto a computer for offline analysis using Signal software (Cambridge Electronic Design Ltd, Cambridge, UK).
Transcranial Magnetic Stimulation
Single- and paired-pulse TMS was delivered to ipsilesional and contralesional M1 using a figure-of-eight coil (70 mm wing diameter) connected to 2 monophasic Magstim 2002 magnetic stimulators via a Bistim module (Magstim, Whitland, Wales, UK). The coil was held tangentially to the scalp, handle posterior, approximately 45° to the mid-sagittal line, to induce posterior-anterior current flow in the brain 27 using a monophasic waveform. The optimal site to elicit a consistent MEP in the resting FDI muscle was marked on the scalp. TMS was delivered at 0.2 Hz, with ~20% variation between trials, and optimal coil position was continually monitored throughout the experiment.
Rest motor threshold (RMT) was defined as the minimum stimulus intensity required for eliciting MEPs of ≥50 µV in amplitude. 28 Active motor threshold (AMT) was defined as the minimum stimulus intensity required for eliciting MEPs of ≥100 µV in amplitude, with FDI preactivated to approximately 10% of maximum voluntary contraction.
Threshold Tracking
Threshold tracking a target MEP amplitude of 200 µV was used to quantify the extent of inhibition and disinhibition in M1 in line with previous work.17,18,26,29 First, a nonconditioned threshold tracking target (TTT) was obtained (Figure 1). The TTT was defined as the minimum stimulus intensity required for eliciting MEPs of 200 µV (±20%) in amplitude in 4 out of 8 trials.26,29 The nonconditioned TTT was determined before and after each paired-pulse protocol and the average value obtained.
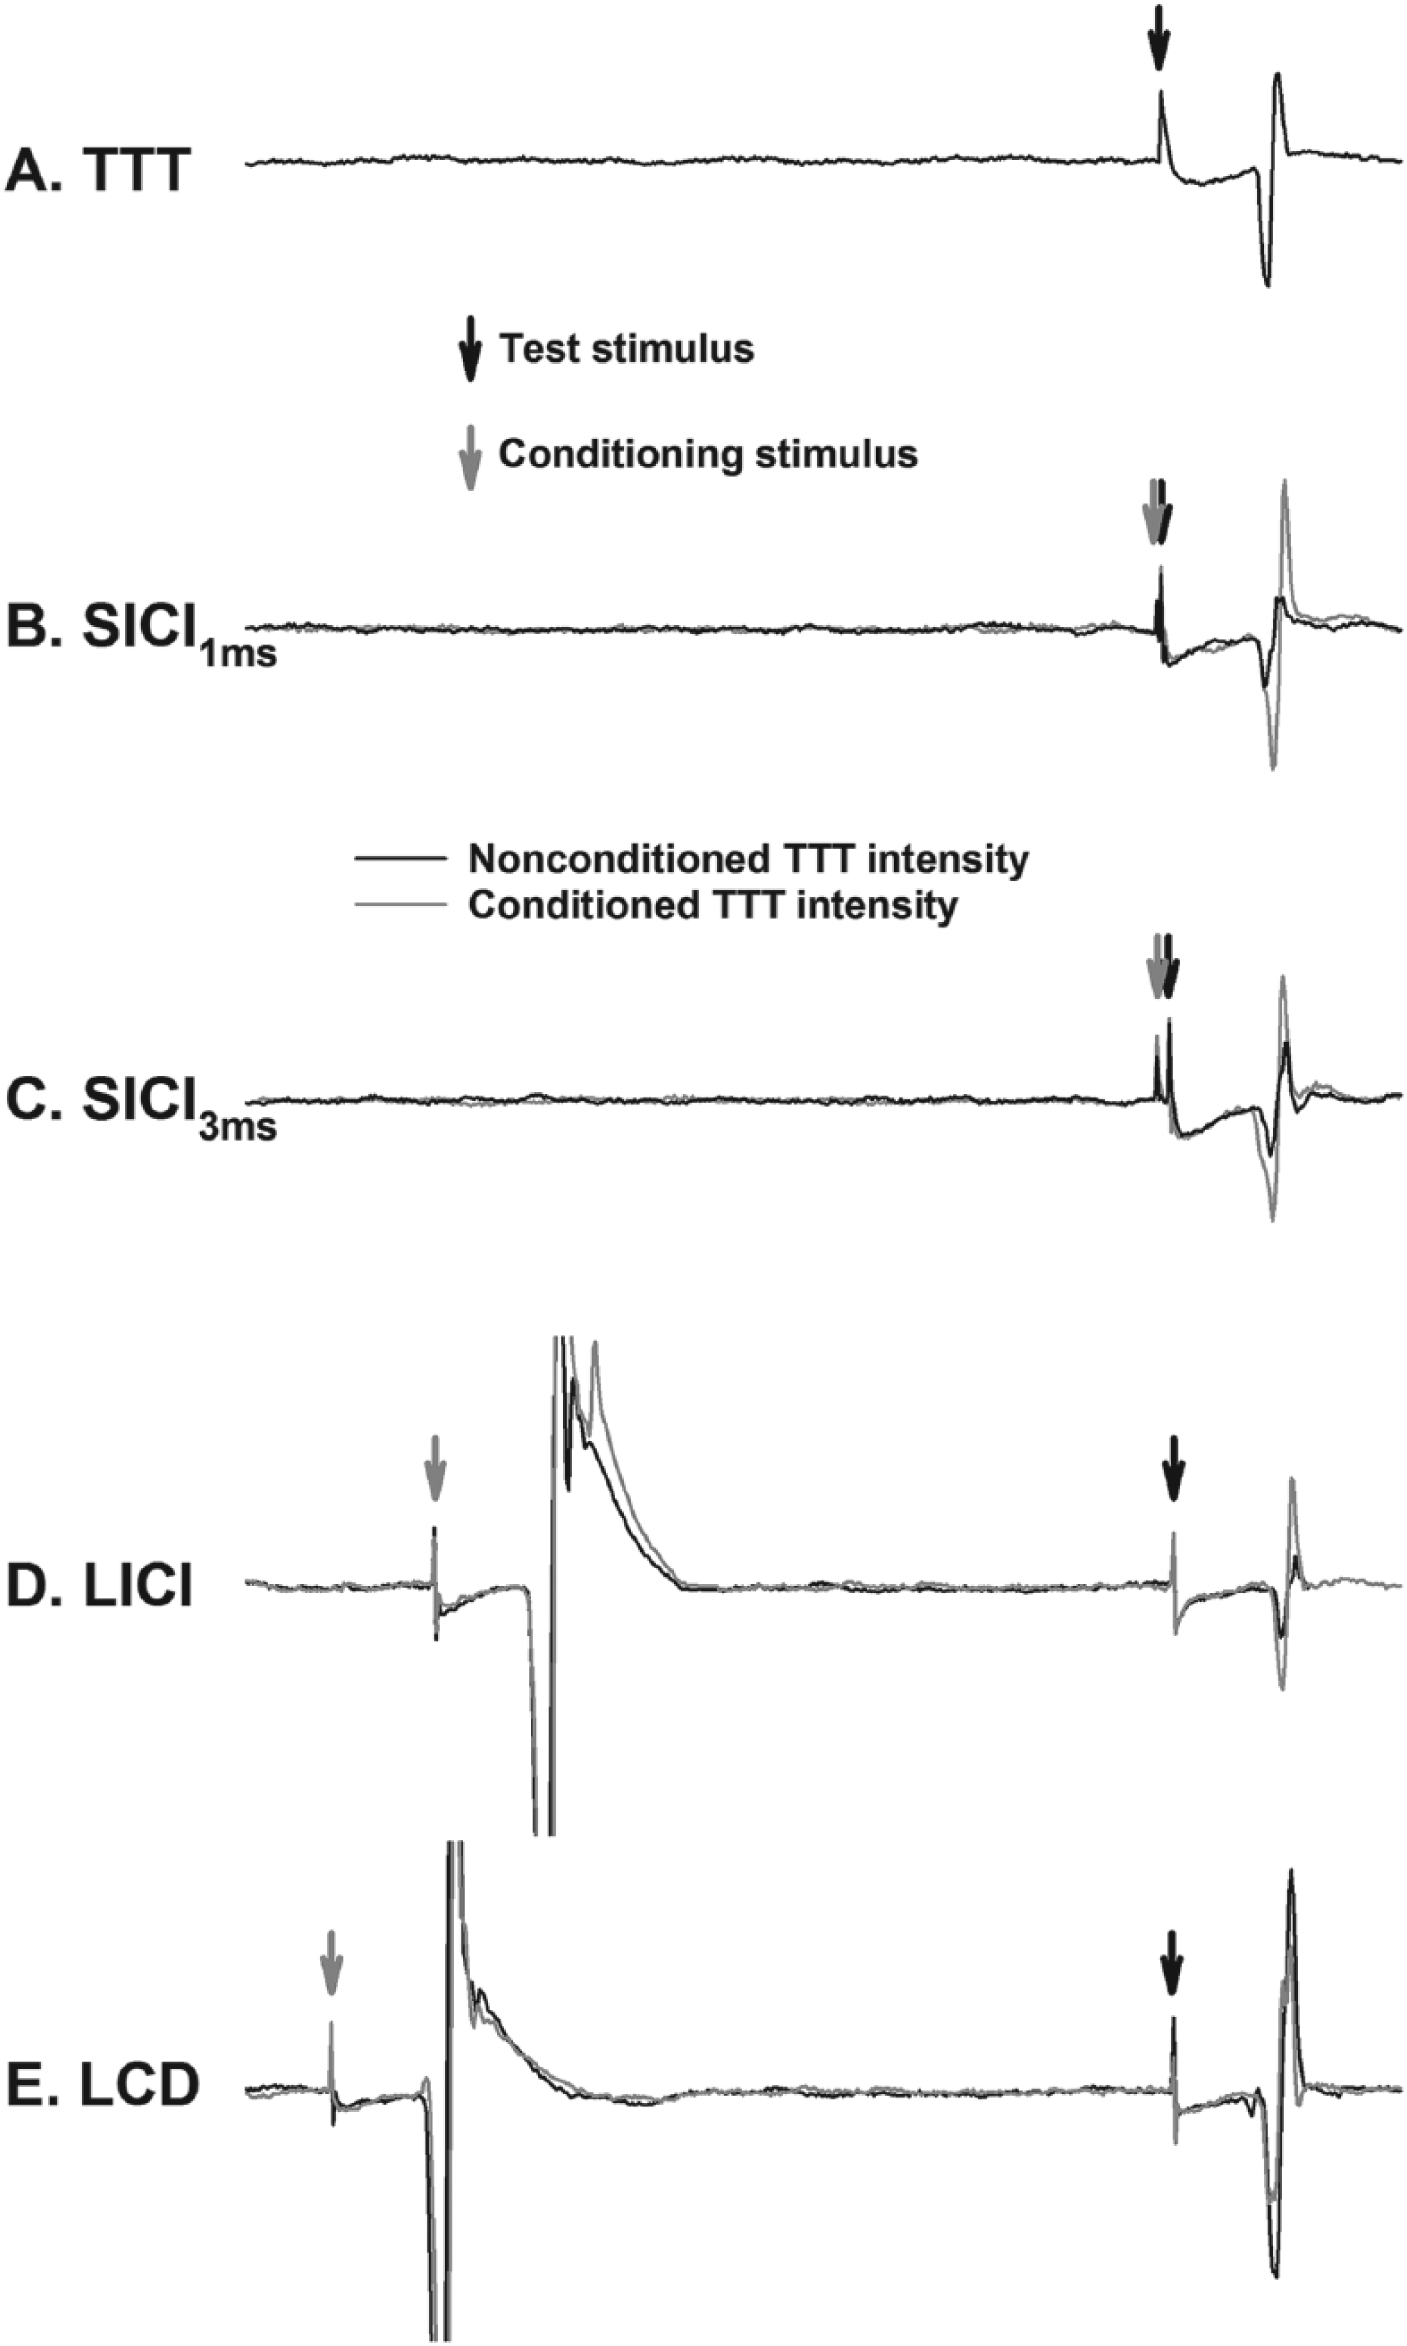
Example electromyography traces depict motor evoked potentials from the paretic first dorsal interosseous muscle. (A) Stimulation intensity required to elicit a fixed motor-evoked potential amplitude (200 μV) to the single-pulse test stimulus (threshold tracking target; TTT). (B and C) Short-interval intracortical inhibition (SICI) at 1 and 3 ms, respectively. (D and E) Long-interval intracortical inhibition (LICI) and late cortical disinhibition (LCD), respectively. Threshold tracking requires an increase or decrease in the test stimulus intensity to evoke the target response in the presence of the conditioning stimulus (gray traces in B-E).
To investigate SICI, a subthreshold conditioning stimulus was delivered 1 (SICI1ms) and 3 (SICI3ms) ms prior to the test stimulus. SICI1ms and SICI3ms are proposed to reflect extrasynaptic 30 and synaptic 13 GABAA receptor activity, respectively. In the presence of the conditioning stimulus, the test stimulus intensity was increased or decreased in 1% maximum stimulator output (MSO) steps until the TTT was reached. Tracking was deemed successful when the conditioned MEP amplitude was above or within 20% of the TTT in 2 out of 3 consecutive trials. Four conditioning intensities were used ranging from 50% to 95% AMT (15% AMT steps) in a sequential order.
Five interstimulus intervals (150, 175, 200, 225, and 250 ms) were used to investigate LICI and LCD in line with previous work. 15 The conditioning stimulus was set to 130% RMT and the test stimulus intensity was increased or decreased in 1% MSO steps until the TTT was achieved for each interstimulus interval in a sequential order.
Magnetic Resonance Imaging
A Siemens Magnetom Skyra 3T scanner and 20-channel head coil (Siemens, Erlangen, Germany) were used for the neuroimaging session. T1-weighted whole-brain structural images were acquired using 1 × 1 × 1 mm voxels and a 256mm field of view (repetition time [TR] = 1900 ms, echo time [TE] = 2.07 ms).
Magnetic Resonance Spectroscopy
The T1-weighted structural images were used to visually identify and manually place an 18 × 18 × 18 mm voxel of interest over the ipsilesional and contralesional precentral hand knobs (Supplementary Figure 1). As described previously, 26 spectral GABA editing and simultaneous water suppression were then performed using the MEGA-PRESS sequence (TR = 1500 ms, TE = 68 ms, 96 averages). 22 Shimming was performed prior to the acquisition of each voxel to correct for inhomogeneity in the applied magnetic field (achieved linewidth of the water peak <15 Hz). Outer volume suppression bands were used to prevent contamination from lipid signals.
Data Analysis
Neurophysiology
For the threshold tracking protocols, trials that were contaminated by prestimulus EMG activity (root mean squared EMG >10 μV; 50 ms before stimulation) were rejected online and repeated immediately. The amplitude of the first MEP from the LICI/LCD protocol was used as a measure of corticomotor excitability. SICI1ms, SICI3ms, LICI, and LCD induced by the conditioning stimulus were quantified as the percentage increase or decrease in test stimulus intensity required to evoke the TTT 17 :
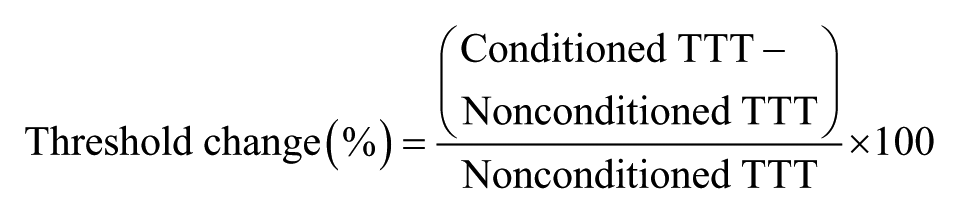
where positive values indicate inhibition and negative values indicate disinhibition. For both SICI1ms and SICI3ms, the largest threshold change value among conditioning stimulus intensities was determined as maximum inhibition for each participant. Maximum inhibition and disinhibition observed between the interstimulus intervals of 150 to 250 ms were used to index LICI and LCD respectively.
Neuroimaging
MRS data were processed using the Java Magnetic Resonance User Interface (jMRUI). 31 Quantification of M1 GABA concentration using MEGA-PRESS and jMRUI has good intra- and interindividual reproducibility. 32 As described previously, 26 spectral analysis for both the ipsilesional and contralesional voxels was carried out in the time-domain using AMARES. A fixed Gaussian function was used to obtain a linewidth for the reference metabolite creatine (Cr). Peak fitting the GABA resonance was performed using 2 Gaussian curves with the linewidths constrained to that of the Cr resonance. Total amplitude of GABA was obtained by summing the 2 peaks. Additional peak fitting for the co-edited glutamate + glutamine (Glx) resonance was also performed in an identical manner. All spectra were included as the Cr linewidths were <3 standard deviations (SDs) from the mean Cr linewidth. 32
T1-weighted structural images were used to determine the relative quantities of gray matter (GM), white matter (WM) and cerebrospinal fluid within each voxel. The amplitude of the Cr peak was corrected for the proportion of total brain tissue volume (GM + WM) within the voxel and the GABA and Glx amplitudes corrected for the proportion of GM volume. 33 GABA and Glx amplitudes were then expressed as ratios relative to the Cr amplitude (GABA:Cr and Glx:Cr). The Glx amplitude was expressed relative to the GABA amplitude (Glx:GABA) to determine the excitation-inhibition ratio. 34
Statistical Analysis
Normality was assessed using the Shapiro-Wilk’s test and homoscedasticity of variance using the Levene’s test of equality and Mauchly’s test of sphericity. Nonnormal data (MEP amplitude) were log transformed for statistical analysis, however, nontransformed data are reported for clarity. One-sample t tests (hypothesized mean = 0) were performed for SICI1ms, SICI3ms, LICI, and LCD to confirm significant inhibition/disinhibition for each hemisphere. Bonferroni-corrected 2-tailed independent-samples t tests and paired t tests were used to compare neurophysiological (RMT, AMT, TTT, MEP amplitude, SICI1ms, SICI3ms, LICI, and LCD) and neuroimaging (GABA:Cr, Glx:Cr, and Glx:GABA) variables between groups and within groups, respectively. Spearman correlation analyses were used to investigate the relationship between TMS measures of inhibition, metabolite concentrations and clinical scores. The significance level was set at P < .05 and group data are presented as mean ± standard error of the mean (mean ± SEM) in the text.
Results
Twelve participants (mean [range] age = 71 [55-88] years; 11 men) with first ever mono-hemispheric ischemic stroke at least 6 months earlier were studied (Table 1). These participants were compared with 16 neurologically healthy age-similar controls (mean [range] age 70 [62-83] years; 9 men). TMS data were unable to be obtained from ipsilesional M1 in 2 patients, contralesional M1 in 1 patient and in 1 control participant. MRS data from contralesional M1 of 1 patient were unable to be analyzed due to a scanning artifact. The TMS and MRS session was separated by a mean (range) of 5 (1-9) days for patients and 8 (2-15) days for controls.
Transcranial Magnetic Stimulation
RMT, AMT, and TTT were similar between ipsilesional M1, contralesional M1, and controls (all P > .43; Table 2). MEP amplitude was lower in ipsilesional M1 compared with controls (P = .003) and contralesional M1 (P = .048), with no difference between contralesional M1 and controls (P = .59).
Single-Pulse Transcranial Magnetic Stimulation Data. a
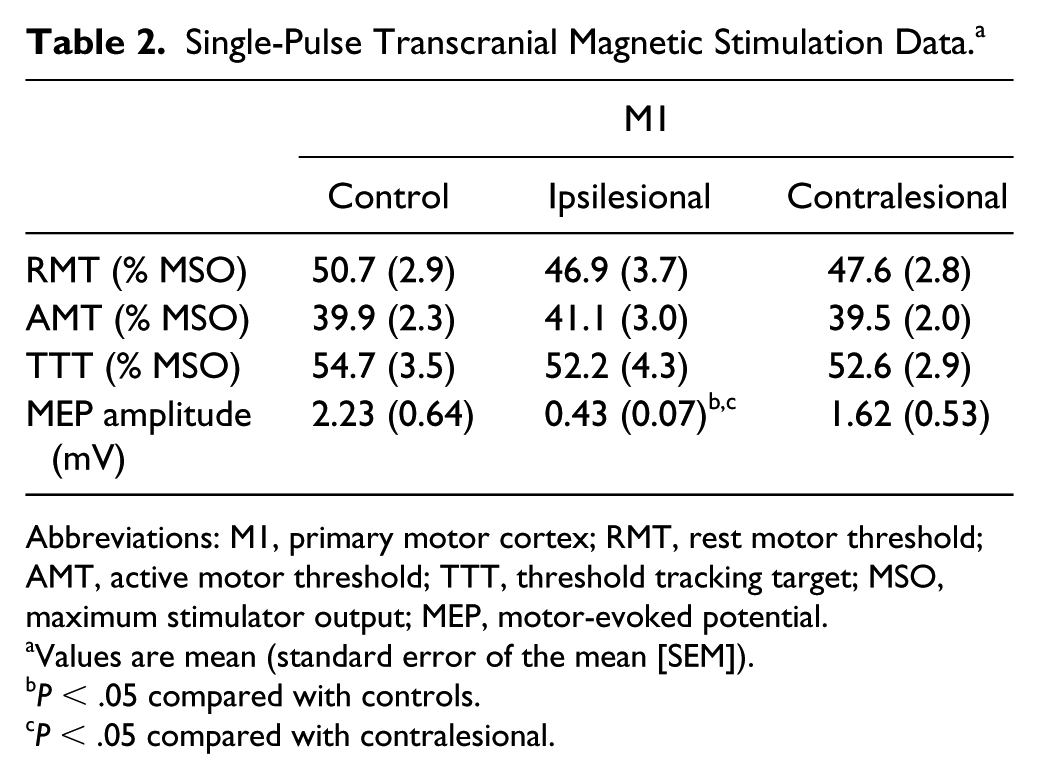
Abbreviations: M1, primary motor cortex; RMT, rest motor threshold; AMT, active motor threshold; TTT, threshold tracking target; MSO, maximum stimulator output; MEP, motor-evoked potential.
Values are mean (standard error of the mean [SEM]).
P < .05 compared with controls.
P < .05 compared with contralesional.
One-sample t tests revealed that SICI1ms, SICI3ms, and LICI were present in controls (all P < .001), ipsilesional M1 (all P < .005), and contralesional M1 (all P < .023). LCD was only present in controls (P = .020), and not ipsilesional or contralesional M1 (both P > .15). SICI1ms and SICI3ms were similar between ipsilesional M1, contralesional M1, and controls (all P > .09; Figure 2A and B). LICI was higher in ipsilesional M1 (31.2% ± 3.8%) compared with controls (10.7% ± 1.7%, P < .001; Figure 2C). There was a trend for higher LICI in contralesional M1 (20.0% ± 3.6%) compared with controls (P = .06) and no difference between ipsilesional and contralesional M1 (P = .14). LCD within ipsilesional M1 was not present at a group level (9.0 ± 5.8) and was different compared with controls (−4.8% ± 2.4%, P = .039; Figure 2D). There were no differences in LCD between ipsilesional and contralesional M1 (P = .17) or contralesional M1 and controls (P = .26).
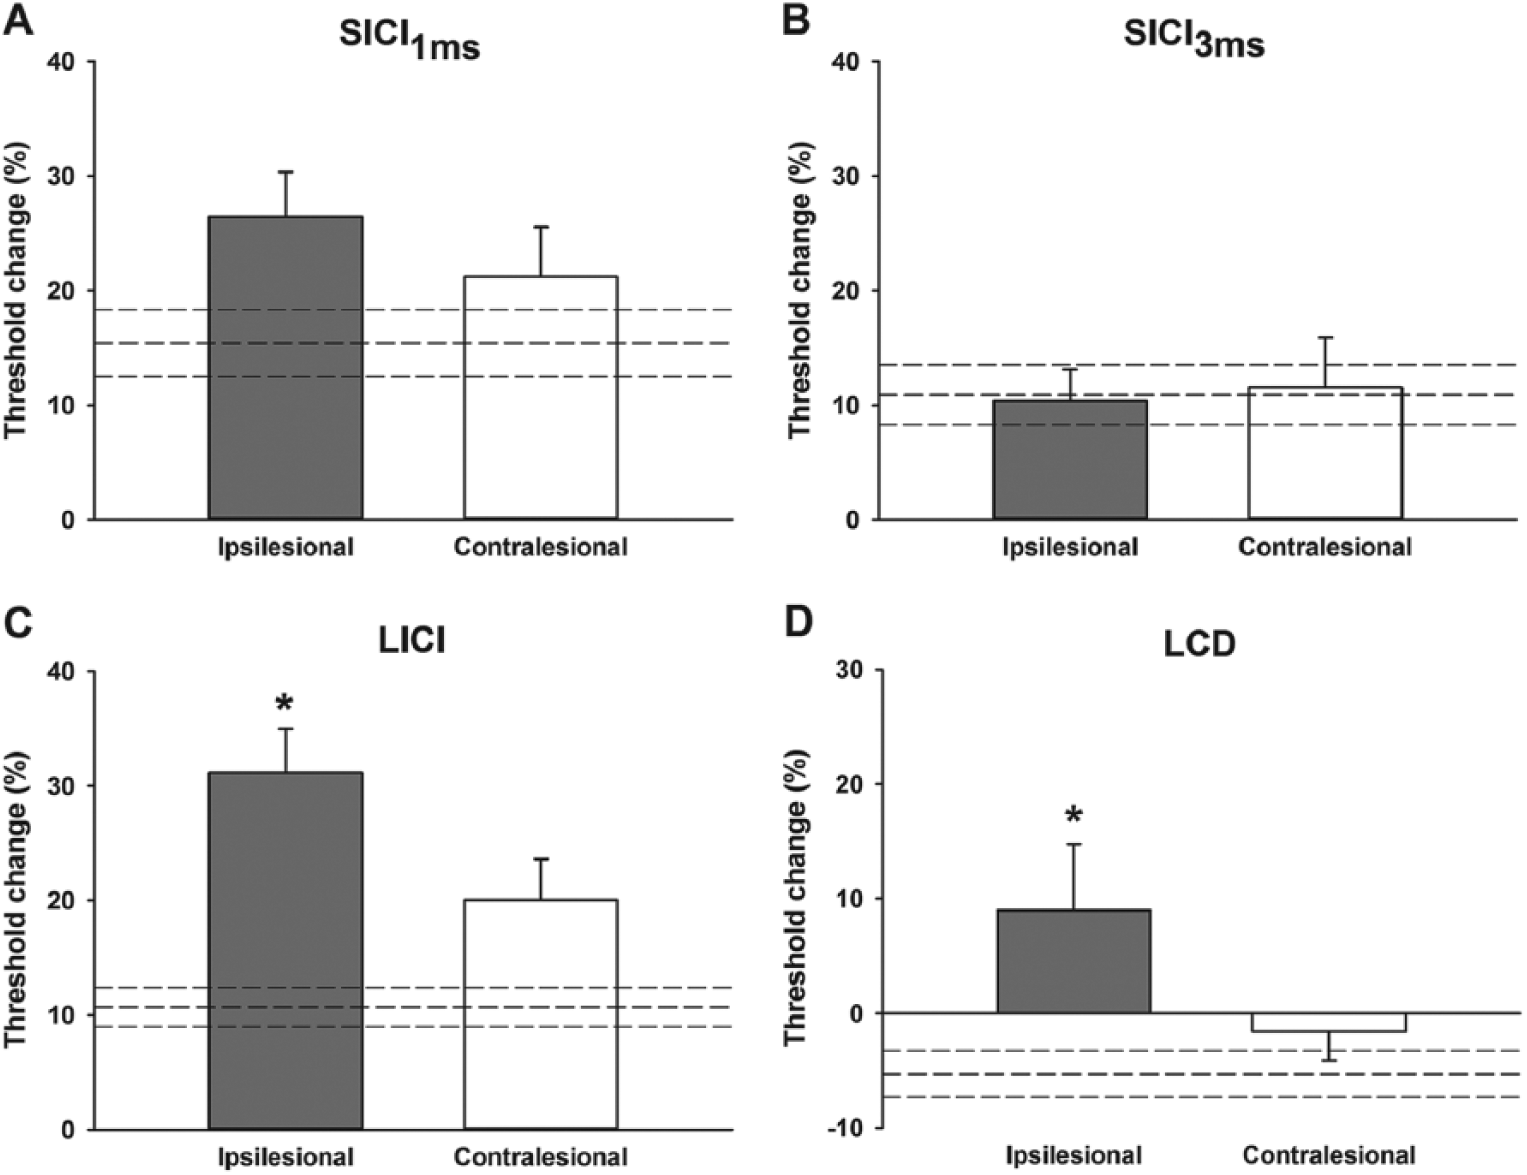
Threshold tracking values obtained from each paired-pulse protocol. There were no differences in short-interval intracortical inhibition (SICI) at 1 (A) or 3 ms (B) between control, ipsilesional, and contralesional primary motor cortex. (C) Long-interval intracortical inhibition (LICI) was greater in ipsilesional primary motor cortex compared with controls. (D) Late cortical disinhibition (LCD) was not present in ipsilesional primary motor cortex. Dashed lines indicate control mean ± standard error of the mean (mean ± SEM). In A-C greater inhibition is indicated upward. In D, greater disinhibition is indicated downward. Data are presented as mean ± SEM. N = 15 controls, 10 ipsilesional, and 11 contralesional. *P < .05 compared with controls.
Magnetic Resonance Spectroscopy
The linewidths of the Cr peaks from ipsilesional, contralesional and control M1 were 7.83 ± 0.29, 7.73 ± 0.42 and 8.05 ± 0.41 Hz respectively. GABA:Cr was lower in ipsilesional (0.075 ± 0.009, P = .009) and contralesional M1 (0.080 ± 0.009, P = .021) compared with controls (0.114 ± 0.008; Figure 3A), with no difference between ipsilesional and contralesional M1 (P = .75). Glx:Cr was similar between ipsilesional M1, contralesional M1, and controls (all P > .24; Figure 3B). The excitation-inhibition ratio was higher in ipsilesional (1.08 ± 0.10, P = .037) and contralesional M1 (1.11 ± 0.12, P = .039) compared with controls (0.80 ± 0.06; Figure 3C), with no difference between ipsilesional and contralesional M1 (P = .98).
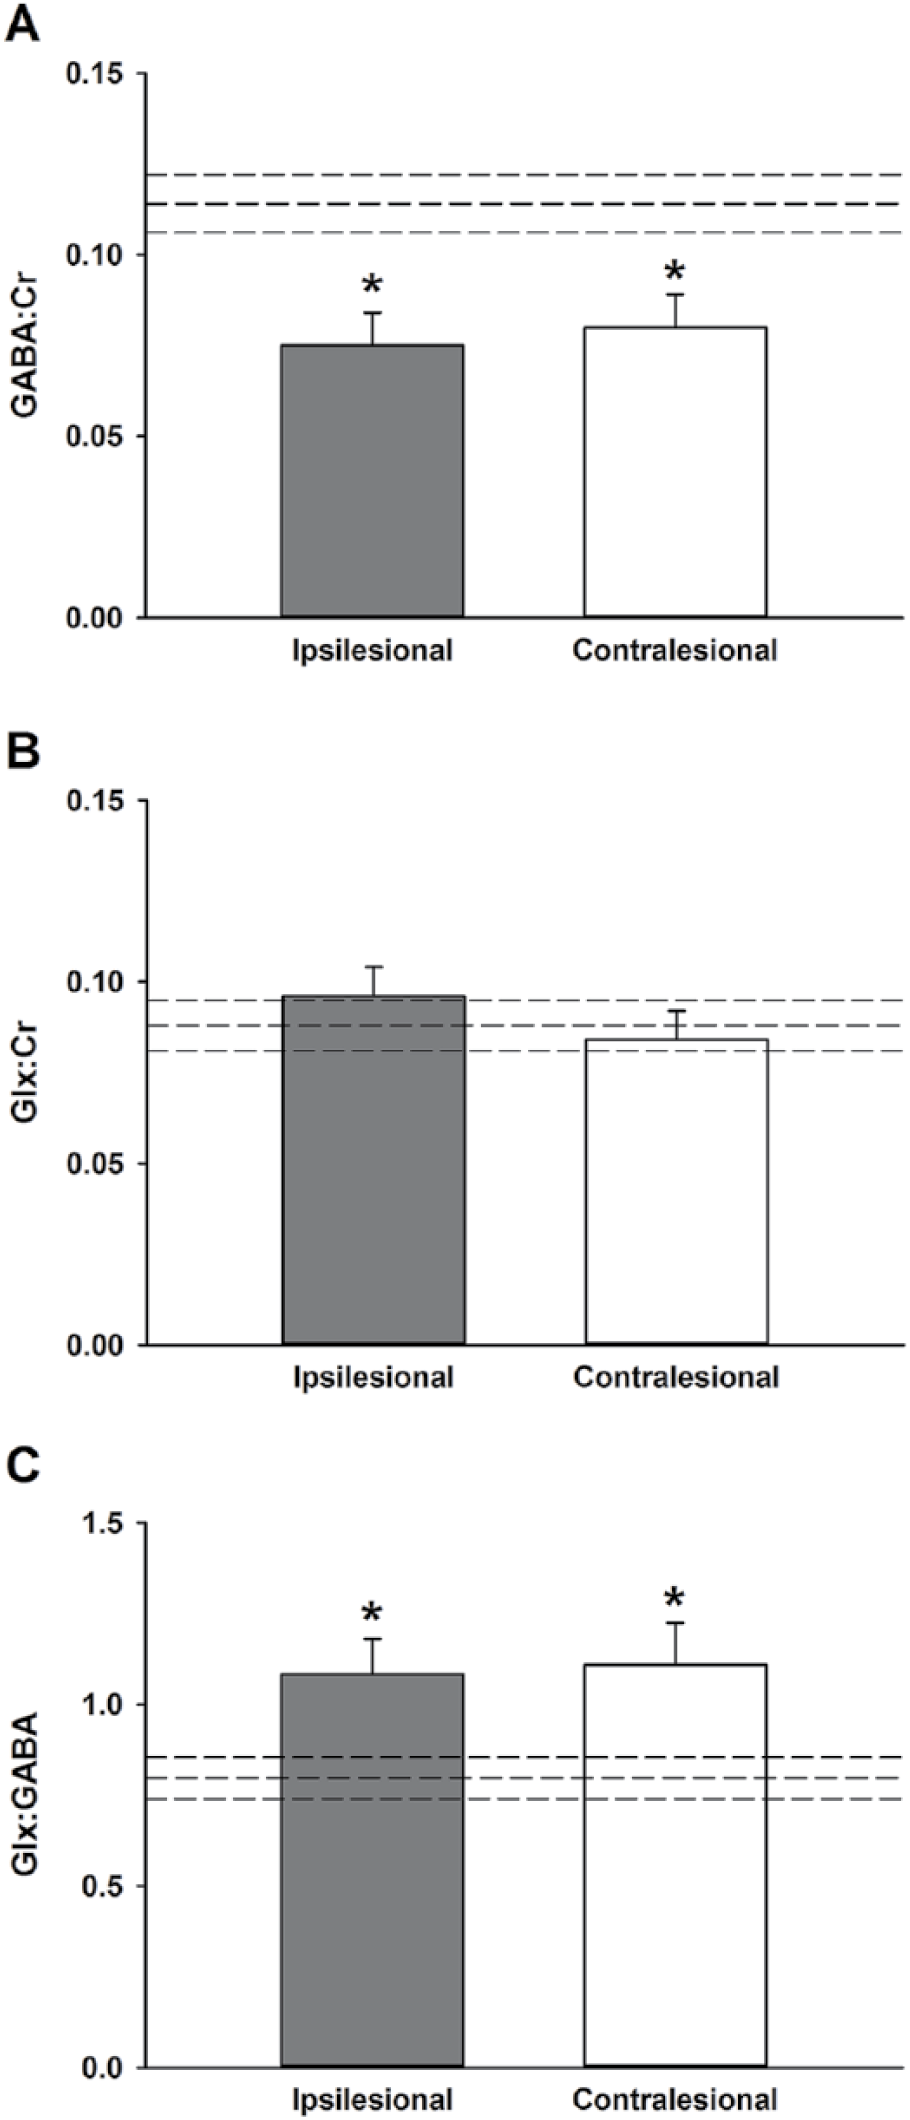
Magnetic resonance spectroscopy. (A) γ-Aminobutyric acid (GABA) concentration was lower in ipsilesional and contralesional primary motor cortex compared with controls. (B) There was no difference in glutamate + glutamine (Glx) concentration between ipsilesional, contralesional, and control primary motor cortex. (C) Glx:GABA was higher in ipsilesional and contralesional primary motor cortex compared with controls. Dashed lines indicate control mean ± standard error of the mean (mean ± SEM). N = 16 controls, 12 ipsilesional, and 11 contralesional. *P < .05.
Correlation Analyses
A negative correlation was observed between ipsilesional M1 LCD and FMUL scores (ρ = −0.86, P = .002; Figure 4A) and ARAT scores (ρ = −0.73, P = .017; Figure 4B). Patients with disinhibition had less upper limb impairment and better function, whereas patients without disinhibition had greater upper limb impairment and worse function. No other correlations between inhibition measures or metabolite concentrations and clinical scores were observed (all P > .11), or between TMS measures of inhibition and metabolite concentrations (all P > .13).
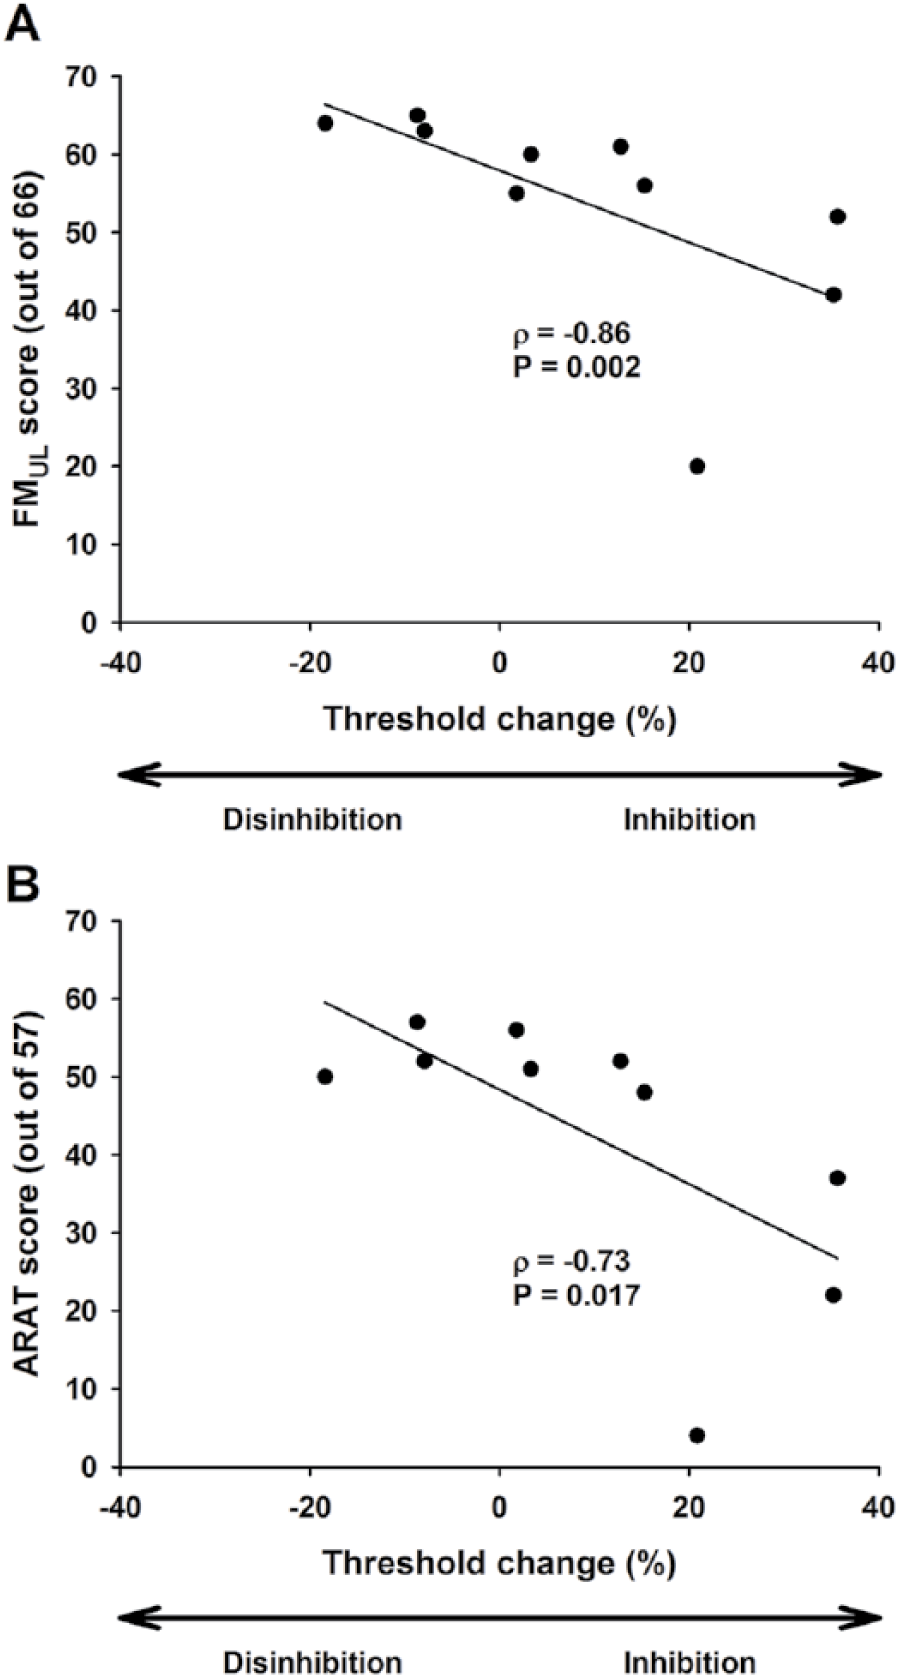
Correlation between late cortical disinhibition values from ipsilesional primary motor cortex and upper limb Fugl-Meyer (FMUL; A) and Action Research Arm Test (ARAT; B) scores. Patients who exhibited disinhibition had less impairment and better upper limb function, whereas patients who exhibited inhibition had greater impairment and worse upper limb function.
Discussion
This study confirms that ipsilesional corticomotor excitability is lower compared with contralesional hemisphere and control levels at the chronic stage of stroke. A novel finding from paired-pulse TMS was that postsynaptic GABAB receptor-mediated inhibition was greater in ipsilesional M1. In contrast, presynaptic GABAB receptor-mediated inhibition was lower in ipsilesional M1 and was not present in patients with greater upper limb impairment and worse function. There were no differences in postsynaptic GABAA receptor-mediated inhibition between patients and controls. A novel finding from MRS was that GABA concentration was lower in ipsilesional and contralesional M1, which contributed to a higher excitation-inhibition ratio. These findings indicate GABAergic inhibition is altered in ipsilesional and contralesional M1, which may be detrimental to motor function and the induction of plasticity at the chronic stage of stroke.
A recent meta-analysis of conventional paired-pulse TMS studies found less ipsilesional SICI compared with contralesional and controls early after stroke 6 but no differences at the chronic stage. We corroborate these findings using threshold tracking with chronic stroke patients. Only one previous study has assessed SICI after stroke using threshold tracking. 35 Huynh et al 35 observed lower ipsilesional and contralesional SICI early after stroke, which persisted into the chronic stage. Methodological differences in SICI stimulation parameters and data analysis may have contributed to the disparate findings between Huynh et al 35 and the present study. For example, Huynh et al 35 used a single conditioning intensity (70% of TTT) and averaged SICI across multiple interstimulus intervals (1-7 ms), while maximum SICI was determined from a range of conditioning stimulus intensities (50%-95% AMT) in our study. The latter may offer an advantage because the profile of the SICI curve can differ between individuals26,29,36 and after stroke. 37 Also, the SICI estimates obtained at 1 and 3 ms interstimulus intervals in the present study were analyzed separately since the former may reflect, in part, extrasynaptic GABAA 30 whereas the latter is presumed to occur through more purely synaptic 13 GABAA receptor activity. Ipsilesional SICI may be lower early after stroke, but our data indicate that it is unlikely to be different to contralesional or controls in the chronic stage when optimal stimulation parameters and analyses are used.
Compared with controls, LICI was elevated in ipsilesional M1 of chronic stroke patients. Our findings contrast with previous conventional paired-pulse TMS studies where no difference in LICI was observed between controls and patients at the chronic stage.38,39 The conventional studies assessed LICI at a single interstimulus interval (100 ms). In contrast, we determined maximum LICI over a range of interstimulus intervals (150-250 ms), which is advantageous as the time course of LICI varies between individuals. 15 Previous studies have shown that administration of baclofen, a postsynaptic GABAB receptor agonist 14 and tiagabine, a GABA reuptake inhibitor, 40 increases the magnitude of LICI. It is possible that exaggerated ipsilesional LICI may be mediated by greater efficacy of postsynaptic GABAB receptors and/or deficient GABA reuptake from the synaptic cleft. However, deficient GABA reuptake would increase tonic inhibition, which was not observed in the present study, making it an unlikely contributor to excessive LICI. Future studies are required to determine the mechanisms pertaining to excessive ipsilesional postsynaptic GABAB receptor-mediated inhibition in chronic stroke.
A brief period of LCD may be observed after the inhibition phase with the LICI protocol. This disinhibition is thought to be mediated by presynaptic GABAB receptors, which limit further GABA release. 15 LCD was only present in the ipsilesional M1 for patients with less upper limb impairment and better function. In contrast, patients who exhibited inhibition rather than LCD, had greater upper limb impairment and worse function. Excessive postsynaptic GABAB activity may mask presynaptic GABAB activity, ultimately degrading motor function.
Based on these findings, it seems reasonable to ask whether excessive ipsilesional postsynaptic GABAB receptor activity is responsible in part for impairment and loss of function in chronic stroke, and whether it could be reduced to normative levels. Pharmacological intervention with GABA antagonists may be warranted, but their use may be contraindicated for many patients. Nonpharmacological interventions such as a bout of aerobic exercise 41 and bilateral priming 42 produce transient reductions in LICI within M1. Preceding upper limb therapy with bilateral priming can accelerate recovery early after stroke 43 and produce greater functional improvements at the chronic stage. 8 Future studies could assess the modulation of ipsilesional postsynaptic GABAB receptor activity and the implications this has for motor function.
GABA concentration within ipsilesional and contralesional M1 of chronic stroke patients was lower than controls. Lower ipsilesional GABA concentration in the chronic stage may support the maintenance of recovered motor function, 25 as motor deficits reemerge following the administration of GABA agonists. 44 Since most patients had subcortical lesions, it seems unlikely that lower ipsilesional GABA concentration reflected a loss of GABAergic neurons. Lower contralesional GABA concentration may support input from contralesional networks in patients with severely low ipsilesional corticomotor integrity.8-12 However, this study had only 2 participants without a functioning ipsilesional corticomotor pathway and is therefore unlikely to be the only explanation for lower contralesional GABA concentration. Because Glx concentration was similar between patients and controls, lower GABA concentration contributed to a higher Glx:GABA ratio in patients. The Glx:GABA ratio provides an index of the excitation-inhibition balance within the cortex and is proposed to be a more sensitive proxy for plasticity than GABA alone. 34 Further studies are warranted to determine if lower GABA concentration and higher excitation-inhibition ratio are beneficial for plasticity induction and the maintenance of motor function at the chronic stage.
There were no associations between TMS measures of GABAergic inhibition and MRS assessed GABA concentration within ipsilesional, contralesional or control M1. These findings are consistent with previous multimodal studies in healthy young and older cohorts.26,45-47 In contrast to paired-pulse TMS surrogate measures of synaptic GABAA and GABAB activity, it has been proposed that MRS assessed GABA concentration primarily reflects ambient extracellular GABA levels. 48 Therefore, TMS and MRS likely provide metrics of synaptic GABAergic activity and inhibitory tone within M1, respectively.
This study has a number of limitations. First, this is a small sample of heterogeneous patients at the chronic stage after stroke. The small sample size prevented comparisons between subgroups of patients, for example, mild versus moderate-severe impairment or cortical versus subcortical stroke, which may influence TMS measures of inhibition 35 and GABA concentration. 25 Also, ipsilesional and contralesional TMS and MRS data were unable to be obtained from a proportion of patients further limiting the small sample. Second, the presence of LCD is not always consistent when assessed at rest in neurologically healthy individuals.49,50 However, we have recently shown that LCD may be more prominent using threshold tracking and multiple interstimulus intervals. 26 Finally, it is unclear to what extent macromolecules, which have the same resonance frequency as GABA, may contribute to, and thus contaminate the observed GABA concentration peak. 51
In summary, threshold tracking paired-pulse TMS demonstrated that postsynaptic GABAB receptor-mediated inhibition was higher in ipsilesional M1. In contrast, presynaptic GABAB receptor-mediated inhibition was lower in ipsilesional M1 and was not present in patients with greater upper limb impairment and worse function. These results, combined with the findings of lower M1 GABA concentration and higher excitation-inhibition ratio, warrant further study to identify treatments that might best improve motor function for those at the chronic stage of stroke.
Supplemental Material
Figure_Supp1 – Supplemental material for The Influence of Primary Motor Cortex Inhibition on Upper Limb Impairment and Function in Chronic Stroke: A Multimodal Study
Supplemental material, Figure_Supp1 for The Influence of Primary Motor Cortex Inhibition on Upper Limb Impairment and Function in Chronic Stroke: A Multimodal Study by Ronan A. Mooney, Suzanne J. Ackerley, Deshan K. Rajeswaran, John Cirillo, P. Alan Barber, Cathy M. Stinear and Winston D. Byblow in Neurorehabilitation and Neural Repair
Footnotes
Acknowledgements
The authors would like to thank Christine Mangold for carrying out clinical assessments and the Centre for Advanced MRI for assistance with imaging.
Author Contributions
R.A.M., S.J.A., D.K.R., J.C., P.A.B, C.M.S. and W.D.B. conception and design of research; R.A.M., S.J.A., D.K.R. and J.C. performed experiments; R.A.M. analyzed data; R.A.M., S.J.A., J.C., C.M.S. and W.D.B. interpreted results of experiments; R.A.M. prepared figures and drafted manuscript; R.A.M., S.J.A., D.K.R., J.C., P.A.B, C.M.S. and W.D.B. edited, revised, and approved final version of manuscript.
Declaration of Conflicting Interests
The authors declared no potential conflicts of interest with respect to the research, authorship, and/or publication of this article.
Funding
The authors disclosed receipt of the following financial support for the research, authorship, and/or publication of this article: This study was funded by grants from the Health Research Council of New Zealand to C.M. Stinear (11/270) and W.D. Byblow (14/136).
References
Supplementary Material
Please find the following supplemental material available below.
For Open Access articles published under a Creative Commons License, all supplemental material carries the same license as the article it is associated with.
For non-Open Access articles published, all supplemental material carries a non-exclusive license, and permission requests for re-use of supplemental material or any part of supplemental material shall be sent directly to the copyright owner as specified in the copyright notice associated with the article.