
Abstract
Background. Spasticity is common in patients with stroke, yet current quantification methods are insufficient for determining the relationship between spasticity and voluntary movement deficits. This is partly a result of the effects of spasticity on spatiotemporal characteristics of movement and the variability of voluntary movement. These can be captured by Gaussian mixture models (GMMs). Objectives. To determine the influence of spasticity on upper-limb voluntary motion, as assessed by the bidirectional Kullback-Liebler divergence (BKLD) between motion GMMs. Methods. A total of 16 individuals with subacute stroke and 13 healthy aged-equivalent controls reached to grasp 4 targets (near-center, contralateral, far-center, and ipsilateral). Two-dimensional GMMs (angle and time) were estimated for elbow extension motion. BKLD was computed for each individual and target, within the control group and between the control and stroke groups. Movement time, final elbow angle, average elbow velocity, and velocity smoothness were computed. Results. Between-group BKLDs were much larger than within control-group BKLDs. Between-group BKLDs for the near-center target were lower than those for the far-center and contralateral targets, but similar to that for the ipsilateral target. For those with stroke, the final angle was lower for the near-center target, and the average velocity was higher. Velocity smoothness was lower for the near-center than for the ipsilateral target. Elbow flexor and extensor passive muscle resistance (Modified Ashworth Scale) strongly explained BKLD values. Conclusions. Results support the view that individuals with poststroke spasticity have a velocity-dependent reduction in active elbow joint range and that BKLD can be used as an objective measure of the effects of spasticity on reaching kinematics.
Introduction
Stroke is a leading cause of long-term sensorimotor disability, with motor deficits in upper-limb (UL) function persisting into the chronic stage in a large proportion of survivors.1,2 Spasticity refers to the presence of hyperactive, velocity-dependent stretch reflexes at rest and during movement. It commonly occurs after stroke, appearing during the first year in 20% to 50% of patients.3,4 The relationship between spasticity and disordered voluntary movement is not fully understood, partly because of limitations in quantification methods. 5 Although the presence or absence of spasticity can be identified using clinical scales, 6 they are insufficient for determining relationships between spasticity, movement deficits, and functional ability.5,7
End-point movement of individuals with stroke is more variable than in healthy controls, whereas kinematic redundancy is restricted.8,9 Variability has been quantified by various measures, including principal component analysis (PCA), 10 dynamic time-warping cost,11,12 and uncontrolled manifold (UCM). 13 UCM examines task-related variability based on the idea that the system organizes movements of multiple joints together to ensure stability of a particular task variable (ie, end-point position at reaching end). It considers the extent to which variability of task-related joint rotations contribute, or not, to end-point progression toward the target throughout the reach. During task execution, joint motions can either vary within the UCM subspace without changing the performance variable or within a subspace that is orthogonal to it, leading to modification of the performance variable.14,15 For pointing movement, UCM showed that individuals with stroke had greater overall within-subject variability than healthy age-matched controls, whereas the ratio of controlled to uncontrolled variability for both groups was similar. 13 In contrast, PCA converts sets of variables into sets of linearly uncorrelated variables called principal components. Typically, PCA is computed for sets of joint movements, revealing covarying joints (configuration synergies). 16 PCA has also been used for single joint paths by defining a specific time interval position vector—for example, for each motion duration percentile.10,17 Both PCA and time-warping cost quantify variability for either within- or between-subject motion, whereas UCM quantifies the variability ratio (with respect to the multijoint control hypothesis) of each participant.
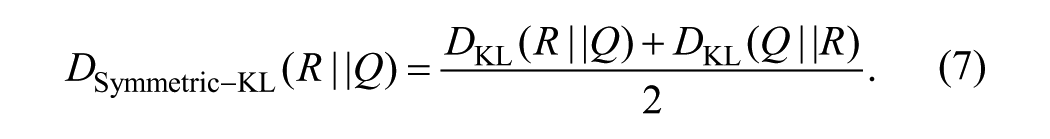
Unlike methods that model and quantify variability, stochastic motion models incorporate variability together with other temporal and spatial characteristics. Quantification of motion quality can then be established based on the model. Stochastic motion models have been used for reproducing human motion in robotics in the programing by demonstration (PbD) approach. 18 Model parameters are assessed based on demonstrated trajectories, and the models effectively capture embedded trajectory characteristics. Gaussian mixture models (GMMs) are commonly used for attaining smooth, generalized stochastic motion models for PbD.19,20 The use of stochastic models for assessing motor performance requires, in addition to parameter estimation methods, comparison and quantification methods. Stochastic models are typically compared using a goodness-of-fit criterion. However, because of the multivariate nature of mixture models such as GMMs, the classical maximum likelihood–based goodness-of-fit measures (eg, the χ2 test) cannot be used. An alternative measure suitable for multivariate distributions is the bidirectional Kullback-Liebler divergence (BKLD).21,22
Our goal was to determine whether BKLD measures movement disorders in those with stroke and its relationship to clinically measured spasticity. This is the first study to apply this modeling method to this end. We modeled elbow flexion/extension movements during reach-to-grasp tasks in each individual using 2-dimensional, spatiotemporal GMMs. We then computed BKLD between GMMs of controls (within control group) and between participants with stroke and controls (between groups). We compared BKLDs within and between groups. We hypothesized that BKLDs within the control group would be much lower than those between groups. We further hypothesized that between-group BKLDs would be larger in individuals attempting to extend the elbow further and faster into angular zones affected by spasticity. We also hypothesized that between-group BKLDs would be related to the amount of muscle resistance to passive stretch. Preliminary results have appeared in abstract form. 23
Methods
Participants
A total of 16 participants with stroke (9 men, 57.4 [11.0 SD] years, 10 left-hemiparesis) and 13 healthy age-matched controls (9 men, 60.5 [8.7 SD] years) participated (Table 1). Participants with stroke had sustained a first-ever stroke in the midcerebral artery territory, confirmed by magnetic resonance imaging/computed tomography. They were medically stable, in the subacute stage (3 weeks to 6 months poststroke), had arm paresis (Chedoke-McMaster Stroke Assessment 2-6/7), 24 could perform voluntary elbow flexion/extension of at least 30° per direction, had elbow flexor spasticity, and could provide informed consent. Individuals with other major neurological or neuromuscular/orthopedic problems, pain, or difficulty comprehending instructions were excluded. No participant was taking antispasticity medication. Participants signed informed consent forms approved by institutional review boards of Loewenstein Rehabilitation Hospital, Raanana, Israel; Centre for Interdisciplinary Research in Rehabilitation, Montréal, Canada; and Kasturba Hospital, Manipal, India.
Demographic Data and Clinical Measures of Individuals With Stroke. a
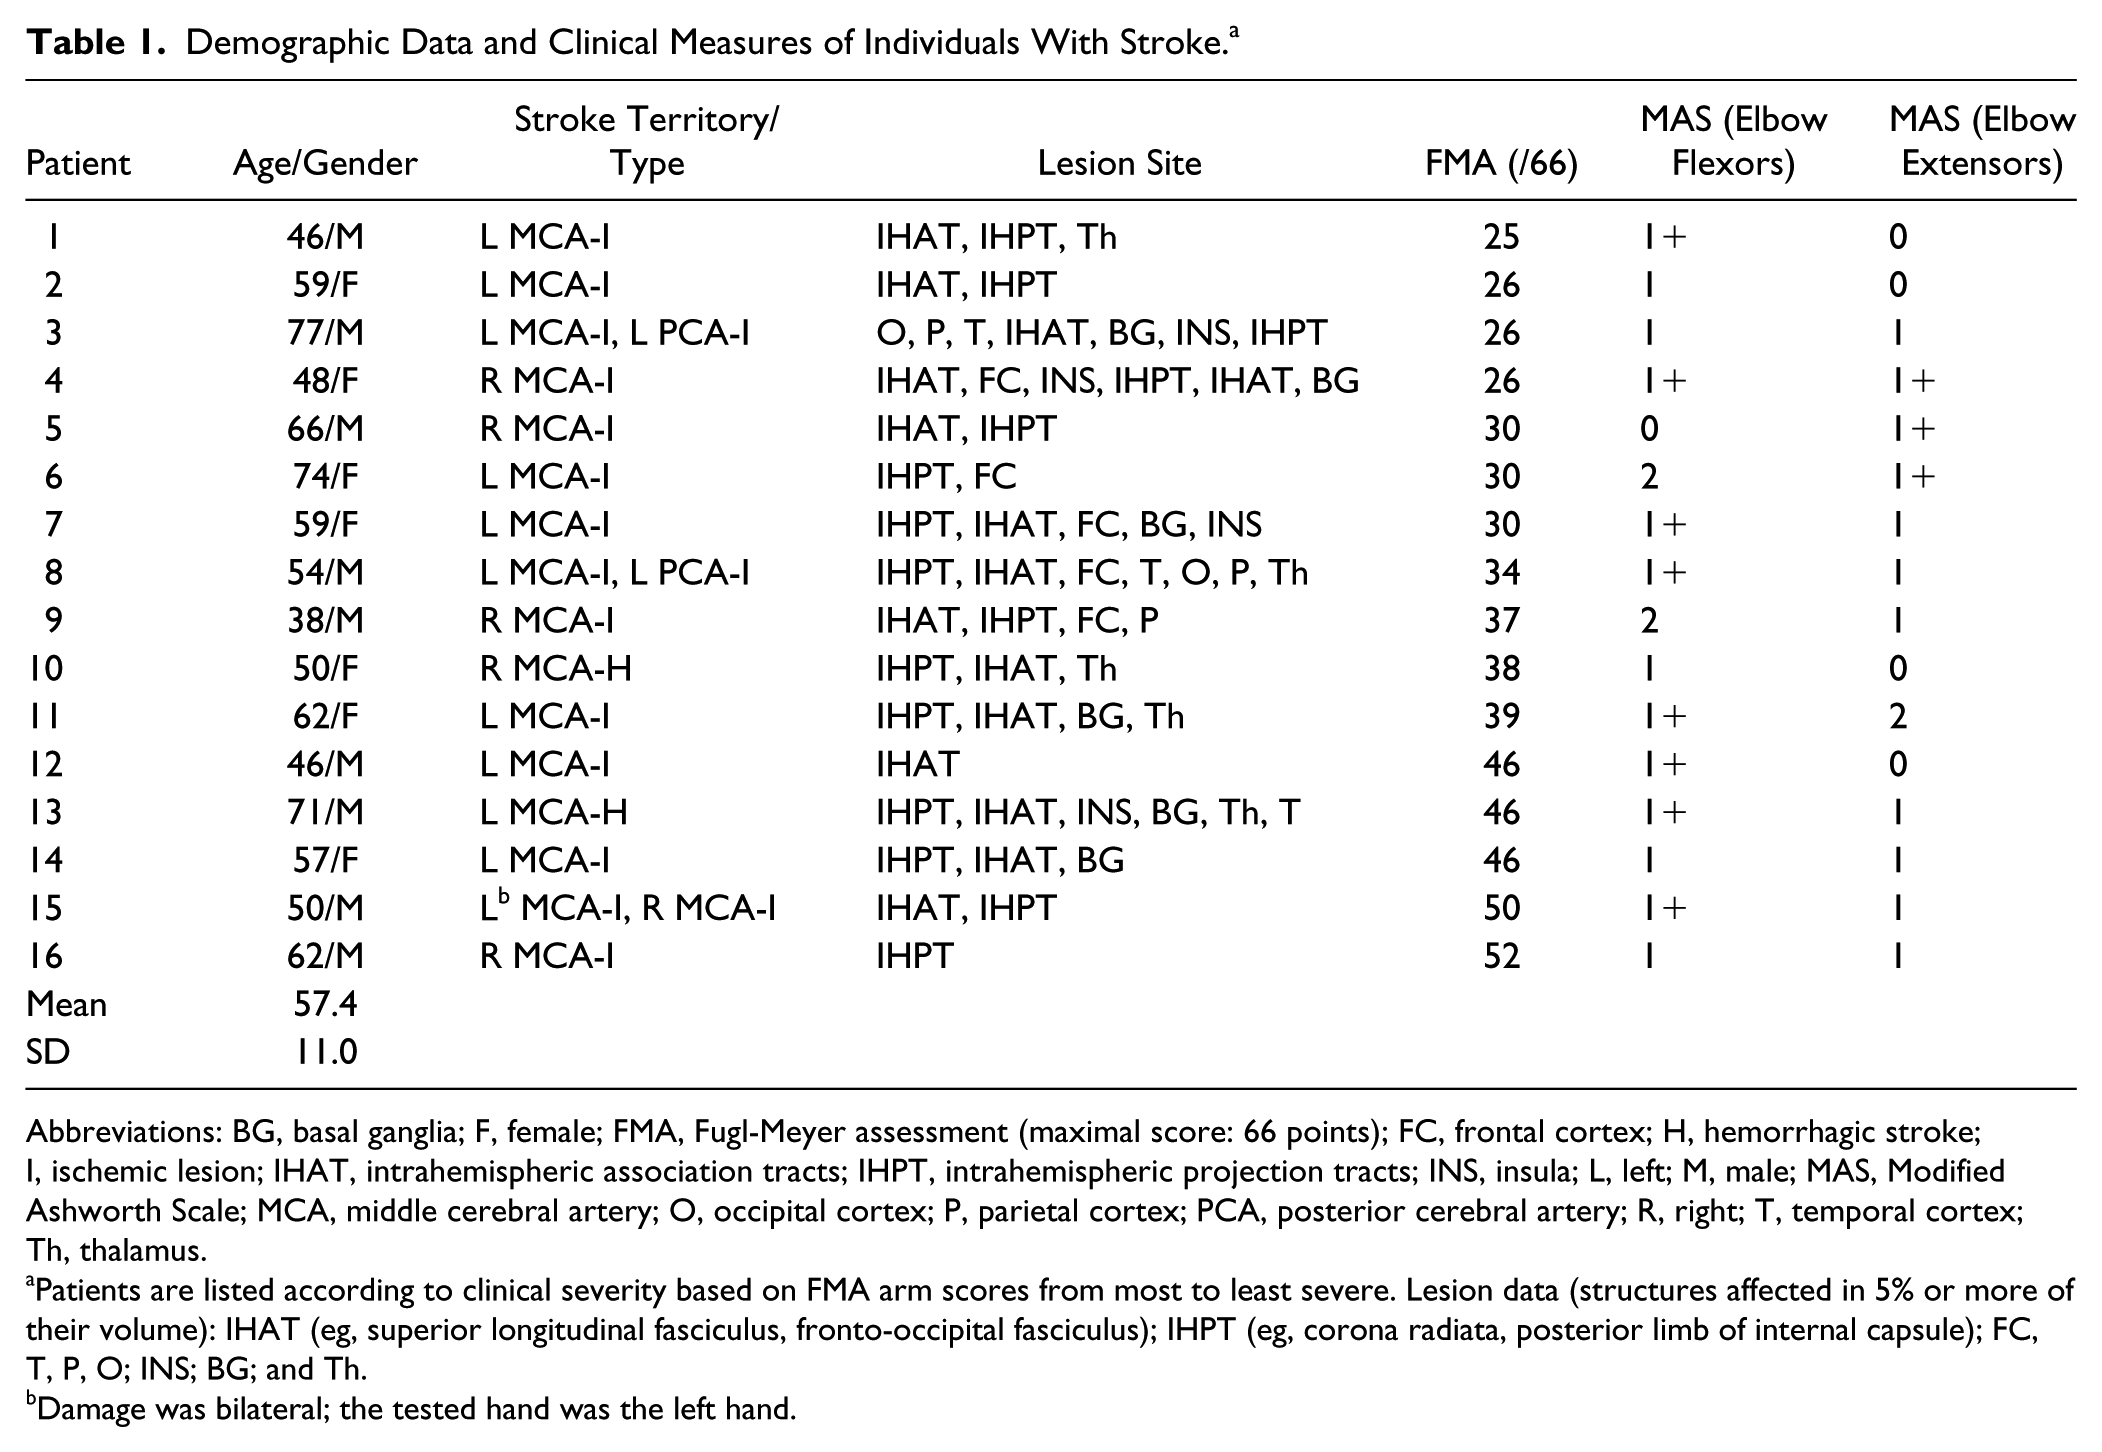
Abbreviations: BG, basal ganglia; F, female; FMA, Fugl-Meyer assessment (maximal score: 66 points); FC, frontal cortex; H, hemorrhagic stroke; I, ischemic lesion; IHAT, intrahemispheric association tracts; IHPT, intrahemispheric projection tracts; INS, insula; L, left; M, male; MAS, Modified Ashworth Scale; MCA, middle cerebral artery; O, occipital cortex; P, parietal cortex; PCA, posterior cerebral artery; R, right; T, temporal cortex; Th, thalamus.
Patients are listed according to clinical severity based on FMA arm scores from most to least severe. Lesion data (structures affected in 5% or more of their volume): IHAT (eg, superior longitudinal fasciculus, fronto-occipital fasciculus); IHPT (eg, corona radiata, posterior limb of internal capsule); FC, T, P, O; INS; BG; and Th.
Damage was bilateral; the tested hand was the left hand.
Clinical Assessment
UL impairment was assessed with the Fugl-Meyer Assessment (FMA) 25 on a 66-point scale. FMA scores between 0 and 30, 31 and 50, and 51 and 66, represent severe, moderate, and mild motor impairment, respectively. 26 Clinical spasticity was measured as resistance felt during stretching of passive muscles, graded on a 6-point ordinal scale (Modified Ashworth Scale [MAS]).27,28
Experimental Procedure
Reach-to-grasp motion toward a hollow cone (6-cm diameter base) placed on a table at 4 target locations was recorded (Figure 1).29-31 A midsagittal reference frame was used to determine target locations. The 4 locations were at two-third arm length (near-center) and arm length (far-center) in the midsagittal plane and ~30 cm to the right/left (depending on hemiparetic side: contralateral/ipsilateral). Arm length was measured from the medial axillary border to the distal wrist crease with the elbow extended. 32
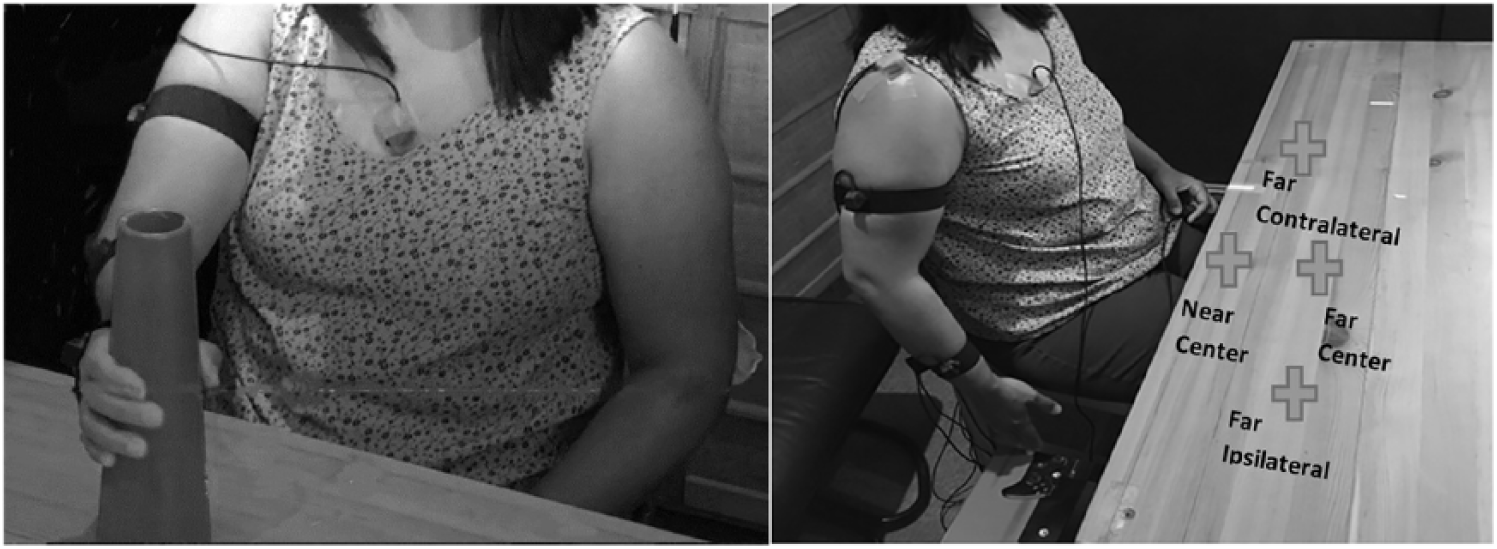
Experimental setup. Left: participant grasping a target cone (far-center target). Right: participant with the arm in the initial position and the elbow slightly bent. The far targets (contralateral, far-center, and ipsilateral) were at arm’s length, and the near target (near-center) was at two-third the arm’s length. The center targets were in the midsagittal plane. Contralateral and ipsilateral targets for right-handed participants were 30 cm along the horizontal axis to the left (contralateral) and right (ipsilateral) of the center targets, respectively.
Wrist, elbow, shoulder, and trunk motion were recorded by a wireless electromagnetic tracking system G4 (Polhemus, Colchester, VT) with 5 sensors (120 Hz) measuring 6 degrees of freedom with respect to a base calibration frame. Sensors were placed on the index metacarpophalangeal joint, dorsal forearm (1/3 forearm length proximal to ulnar head), midpoint of the ventrolateral arm, midpoint of the acromial superior-lateral border, and midsternum.
Participants sat before a table on an armless chair with feet supported (Figure 1). Trunk movement was unrestricted. Initial arm posture was placement of the third fingertip on an ipsilateral seat height support with 30° elbow flexion. Prior to recording, participants practiced reaching 8 times, twice toward each target. Participants performed 2 sets of 40 semirandomized reach-to-grasp movements (10 trials toward 4 targets) balanced in blocks across targets (to maintain a balanced trial number per target even when not all trials were completed), totaling 80 trials. A trial consisted of reaching to grasp the cone “as fast and as precisely as possible,” holding the cone for 2 s, lifting it toward the chin, returning it to the target position on the table, and returning the hand to the initial position. Only the first segment (ie, reaching to grasp the cone) of the movement sequence was analyzed. Participants rested between trials and blocks as needed.
Data Analysis
Trials were discarded in case of a recording error or task failure—for example, when the hand collided with the table or when motion started prior to the cue. Sensor data were filtered using a standard 2-way (zero lag), low-pass, third-order Butterworth filter with a 6-Hz cutoff. Tangential velocity was computed by differentiating position samples. Onset and offset of the first movement segment were defined as times at which the forearm tangential velocity exceeded and remained above, or decreased and remained below 10% of peak forearm tangential velocity for 0.1 s. Joint angles were reconstructed using the Cardan angle convention from determined motion rotation matrices. 33
Because BKLD is a unitless measure, within–control group BKLDs were used as normative comparators. For BKLD calculation, we first performed motion transformation and resampling (for attaining similar dimension ranges) and then estimated GMM parameters.
Motion Transformation and Resampling
Temporal and spatial dimensions of movement differ in magnitude. Using different value ranges in stochastic modeling would result in a larger weighting of the dimension with larger values—that is, construction of a biased model. 34 To avoid this, joint angles were linearly transformed (scaled) to the range of [−1, 1], similar to the average task duration:
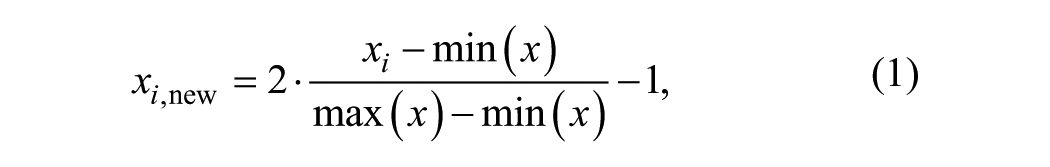
where x is the original joint angle trajectory vector, xi a point along the trajectory, and xi,new the transformed point. To create the model, trajectory lengths were scaled to a uniform length for each participant and target. A function representing each movement was approximated using general regression neural networks. 35 To equalize the number of samples per movement, the function was resampled at a constant rate determined for each participant and target, based on the average trial length originally sampled at 120 Hz.
GMM Parameter Estimation
Two-dimensional spatial and temporal GMMs (Equations 2-4) were estimated based on the transformed movement profiles:
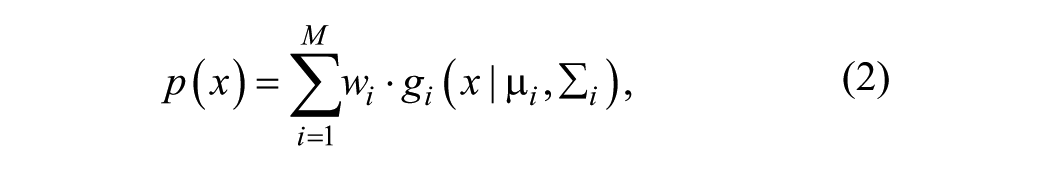
where wi are the component weights and
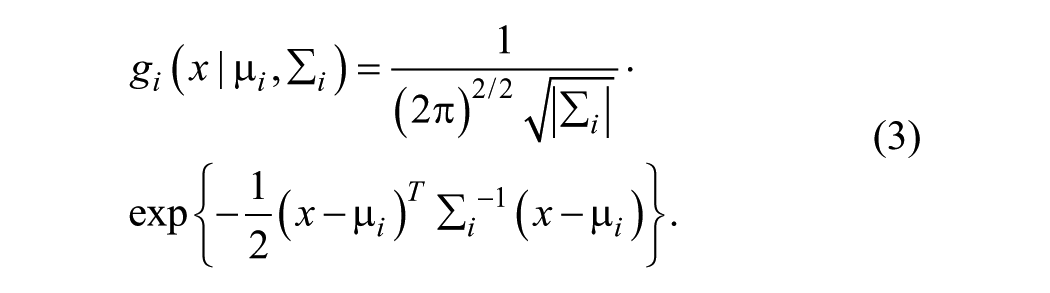
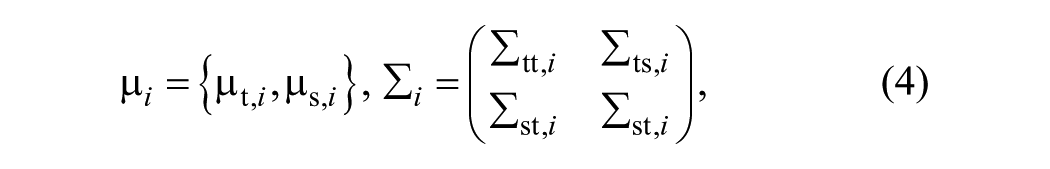
where µs,i
Models were computed for the elbow angle for each target—that is, 4 models per participant. Model parameters were estimated using the maximum likelihood method with expectation-maximization, initialized with K-means. 34 Models with 2 to 30 Gaussians were tested, and the best match was chosen based on the minimum estimated Bayesian Information Criteria. 36
BKLD Computation
Kullback-Liebler divergence (KLD) provides a measure of how one probability distribution diverges from another.21,22 KLD from a probability density function (PDF) of a random variable Q to the PDF of a random variable R is denoted by
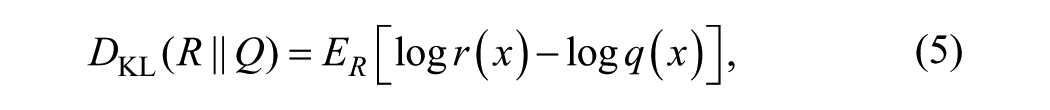
where
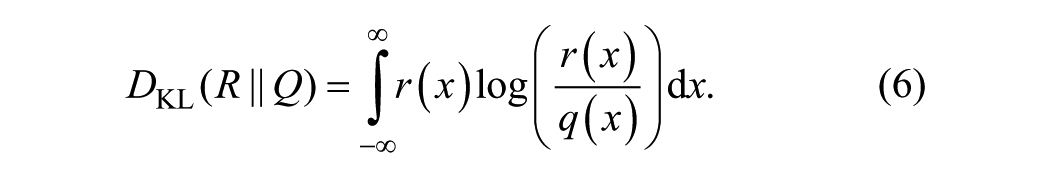
Higher values of
Various alternatives to KLD exist—for example, normalized L2 norm and Earth Movers Distance measure. However, KLD outperforms these measures especially when the number of GMM components is higher than 2. 38
BKLDs were computed between models of different participants for each target based on the variational approximation method. 37 Within–control group BKLDs were computed for all controls, and between-group BKLDs were computed between participants with stroke and controls. The final BKLD score for each participant (for both within and between computations) was determined as the minimal BKLD score using the nearest-neighbor methodology. 39
Conventional Kinematic Measures
Reach-to-grasp movements were further characterized using movement time, final elbow angle, average elbow velocity, and elbow velocity smoothness. Movement time was calculated as the difference between movement offset and onset. Final elbow angle was the elbow angle at movement offset. Elbow velocities above 10% maximal trial velocity between onset and offset were averaged. For assessing discontinuities in the motion trajectory, elbow velocity smoothness was quantified by the number of acceleration zero-crossings.
Statistical Analysis
Statistical analysis was done using R and R Studio IDE (version 3.4.2, The R Consortium, Boston, MA). Linear mixed models (LMMs) were computed with the restricted maximum likelihood (REML) criterion for convergence. 40 All LMMs included participants as a random effect intercept. When needed, multiple comparisons were computed with a confidence level of 95% adjusted using the Holm-Bonferroni correction. The LMM model (Equation 8) is a special case of the general linear mixed model (GLMM) suitable for fitting linear mixed-effects models to data sampled from normal distributions. 41 In the LMM model, responses from a participant are treated as the sum of fixed and random effects. For example, fixed effects are experimental conditions that affect the general population mean, whereas random effects are associated with the sampling procedure and with a specific set of participants in each group. GLMM yields asymptotically efficient estimators—that is, tend toward being optimal (minimal variance) as the sample size increases for both balanced and unbalanced research designs. In contrast, analysis of variance (ANOVA) produces an optimal estimator only for balanced designs. In GLMM, maximum likelihood and REML methods are used for estimating model parameters. REML produces variance component estimators with a smaller bias than maximum likelihood and is, thus, more similar to the traditional ANOVA analysis.

where yi,j is the outcome value of measurement, i, of participant j. β is the fixed effects vector, Xi,j is the observation vector, αj ~ N(0,
For the first and second hypotheses, an LMM was used to determine differences between within–control group and between-group BKLDs. The model included BKLD type (Within–control group, between-group), target (Near-center, Far-center, Contralateral, Ipsilateral), and their interaction as factors. In addition, for the second hypothesis, LMMs were computed for movement time, final elbow angle, average elbow velocity, and velocity smoothness. The models included group (Control, Stroke), target (Near-center, Far-center, Contralateral, Ipsilateral), and their interaction as factors. Separate LMMs were used for each group in case of a significant interaction between groups.
For the third hypothesis, we considered that reaching the target may be disrupted by various stroke-related deficits. We used LMM to test the influence of elbow flexor and extensor spasticity measured by MAS and the UL impairment level measured by FMA on kinematic characteristics (BKLD, final angle, movement time, average speed, and velocity smoothness). In all analyses, target location and its interactions with the clinical measures (MAS, FMA) were defined as factors. Both conditional (Rc2) and marginal (Rm2) R2 values were evaluated for all models. 42 The conditional Rc2 represents the variance explained by both fixed and random factors and, thus, indicates how the model fits the participant group. The marginal Rm2 represents the variance explained by fixed factors and indicates how the model fits the general population of people affected by stroke.
Results
Healthy controls completed 100%, whereas participants with stroke completed 71% (23% SD) of trials. For controls, 9% (0.7% task failure), and for participants with stroke, 28% (15% task failure) of all completed trials were discarded.
Reaches made by participants with stroke were qualitatively slower and more variable than those made by controls (Figure 2). This was reflected in GMMs having more Gaussian components than controls (stroke: 12.4 [1.6 SD]; controls: 6.3 [1.3 SD]; F1,27 = 270.24, P < .001) with no differences between targets (Figure 2). Within- and between-group BKLDs, movement times, final angles, and average elbow velocities are listed in Table 2.
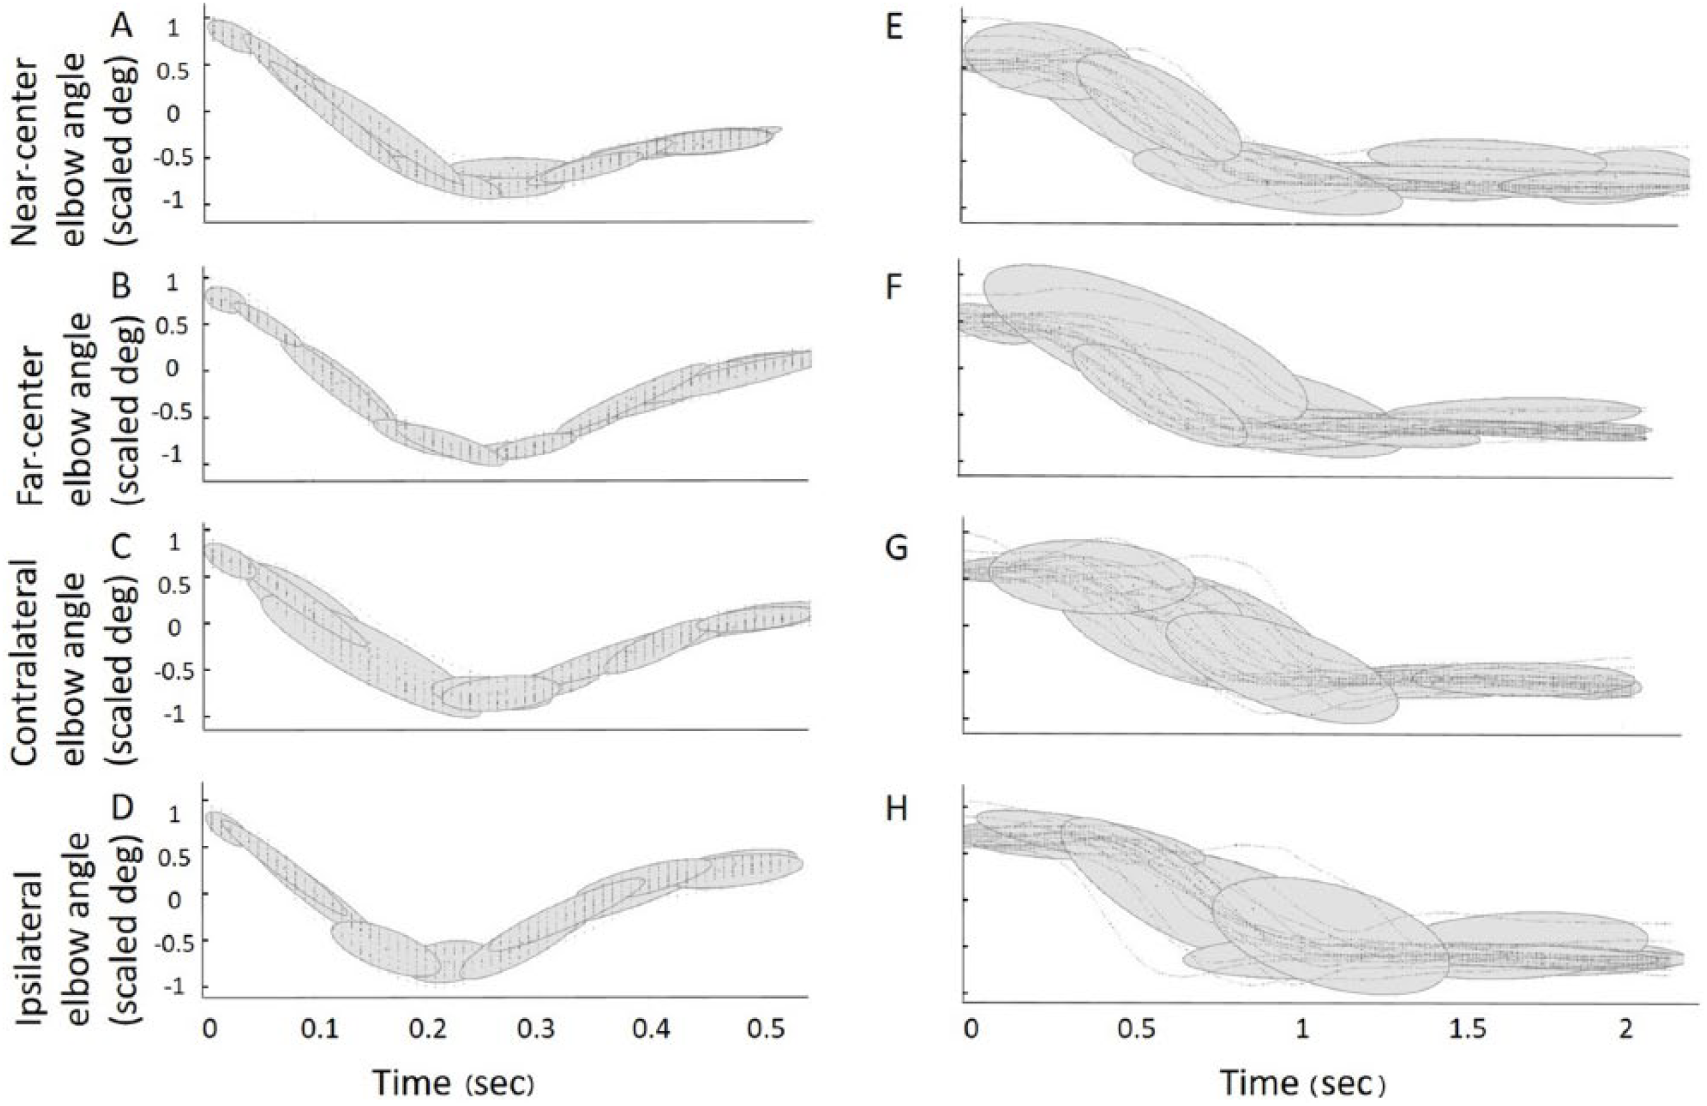
Elbow extension angle (scaled to [−1, 1]) Gaussian mixture model examples for 1 control participant (A-D) and 1 participant with stroke (E-H, S7) for reaches to each target (time scaled to the average movement time).
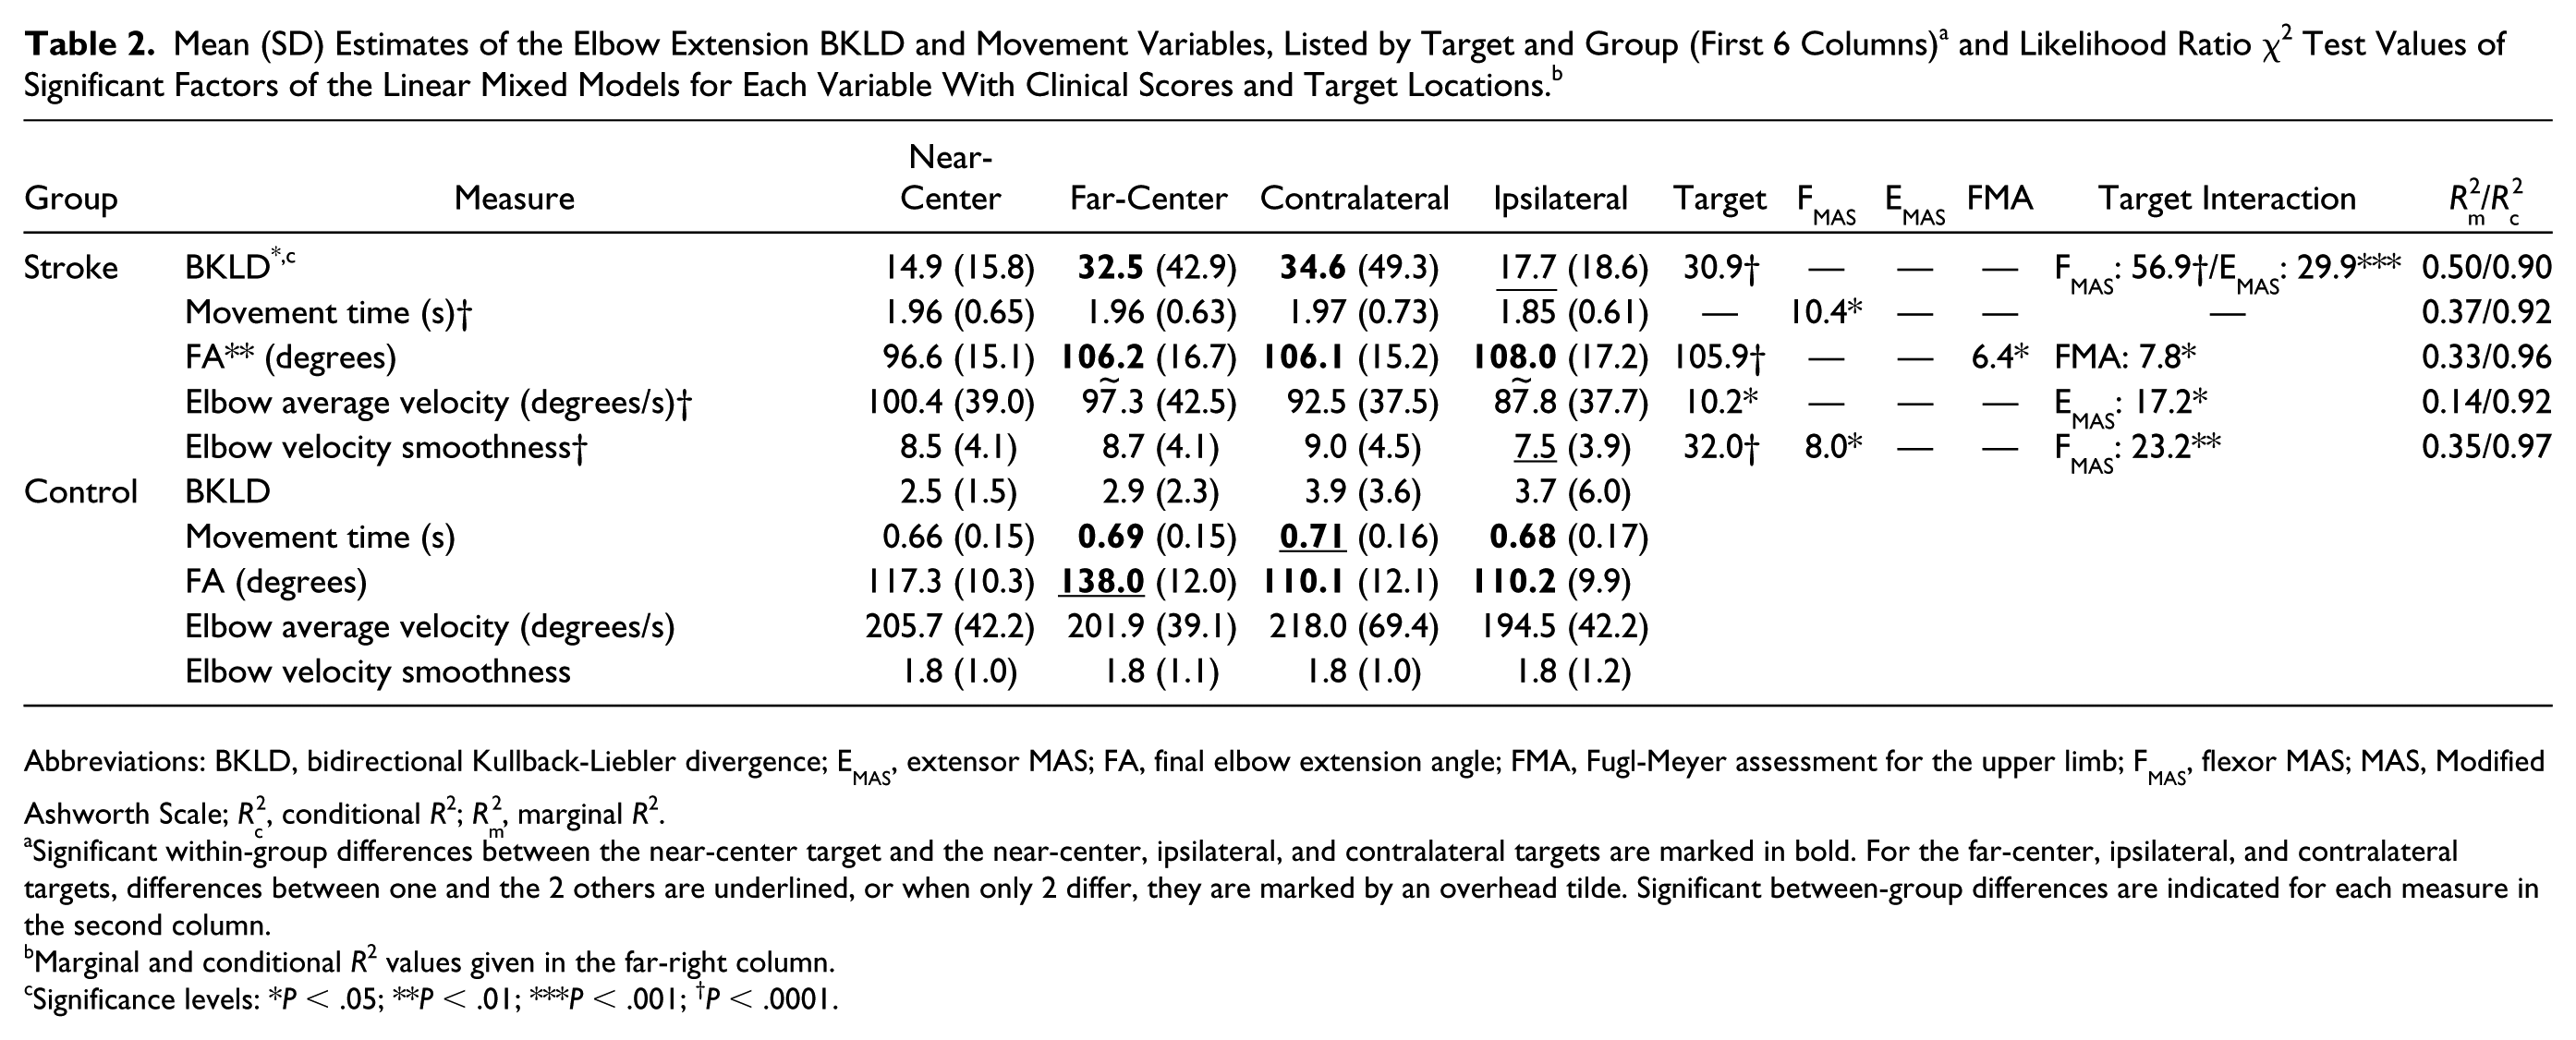
Abbreviations: BKLD, bidirectional Kullback-Liebler divergence; EMAS, extensor MAS; FA, final elbow extension angle; FMA, Fugl-Meyer assessment for the upper limb; FMAS, flexor MAS; MAS, Modified Ashworth Scale; Rc2, conditional R2; Rm2, marginal R2.
Significant within-group differences between the near-center target and the near-center, ipsilateral, and contralateral targets are marked in bold. For the far-center, ipsilateral, and contralateral targets, differences between one and the 2 others are underlined, or when only 2 differ, they are marked by an overhead tilde. Significant between-group differences are indicated for each measure in the second column.
Marginal and conditional R2 values given in the far-right column.
Significance levels: *P < .05; **P < .01; ***P < .001; †P < .0001.
Bidirectional Kullback-Liebler Divergence
Between-group BKLD values were an order of magnitude higher than within–control group values (Figure 3, left; F1,27 = 6.77, P < .05), with a difference between targets (F3,81 = 3.07; P < .05) and an interaction of target and BKLD type (F3,81 = 2.77; P < .05). Between-group BKLD values changed more from the near-center to the far-center target, compared with the changes in the within–control group BKLD. One participant from the stroke group (S6) with a low FMA score (FMA = 30) and a high spasticity score (flexor MAS = 2) had exceptionally high BKLDs, especially for the far-center and contralateral targets (Figure 3, left, rhombi). Removing this participant did not affect results.
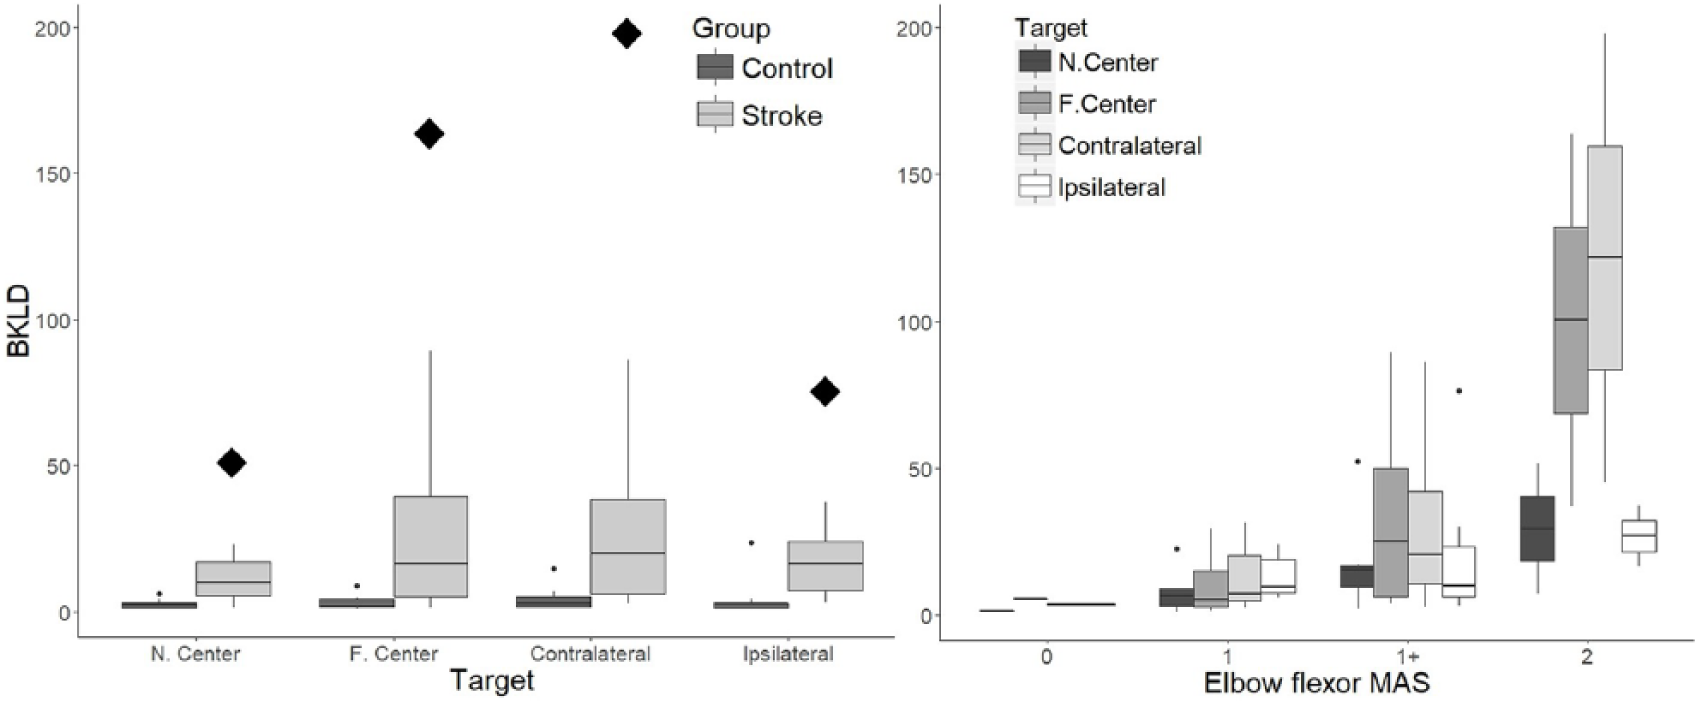
Left panel: Box plots of bidirectional Kullback-Liebler divergence (BKLD) values for elbow extension for each target in control participants (dark gray) and participants with stroke (light gray). Outliers are marked with dots and exceptionally high BKLD scores of S6 are indicated with large rhombi. Right panel: Box plots of BKLD values related to elbow flexor spasticity (MAS) for reaches to each target in participants with stroke.
There were significant differences between targets for the between-group BKLD (F3,45 = 3.68; P < .05). Participants with stroke had lower BKLD values (eg, were more similar to controls) for reaches to the near-center than for the far-center and contralateral targets (far-center P < .05; contralateral P < .05).
Movement Time, Final Angle, Average Velocity, and Velocity Smoothness
Participants with stroke had longer movement times (Figure 4A) than controls for all targets (F1,27 = 48.13; P < .0001), with no differences or interactions between targets and groups.
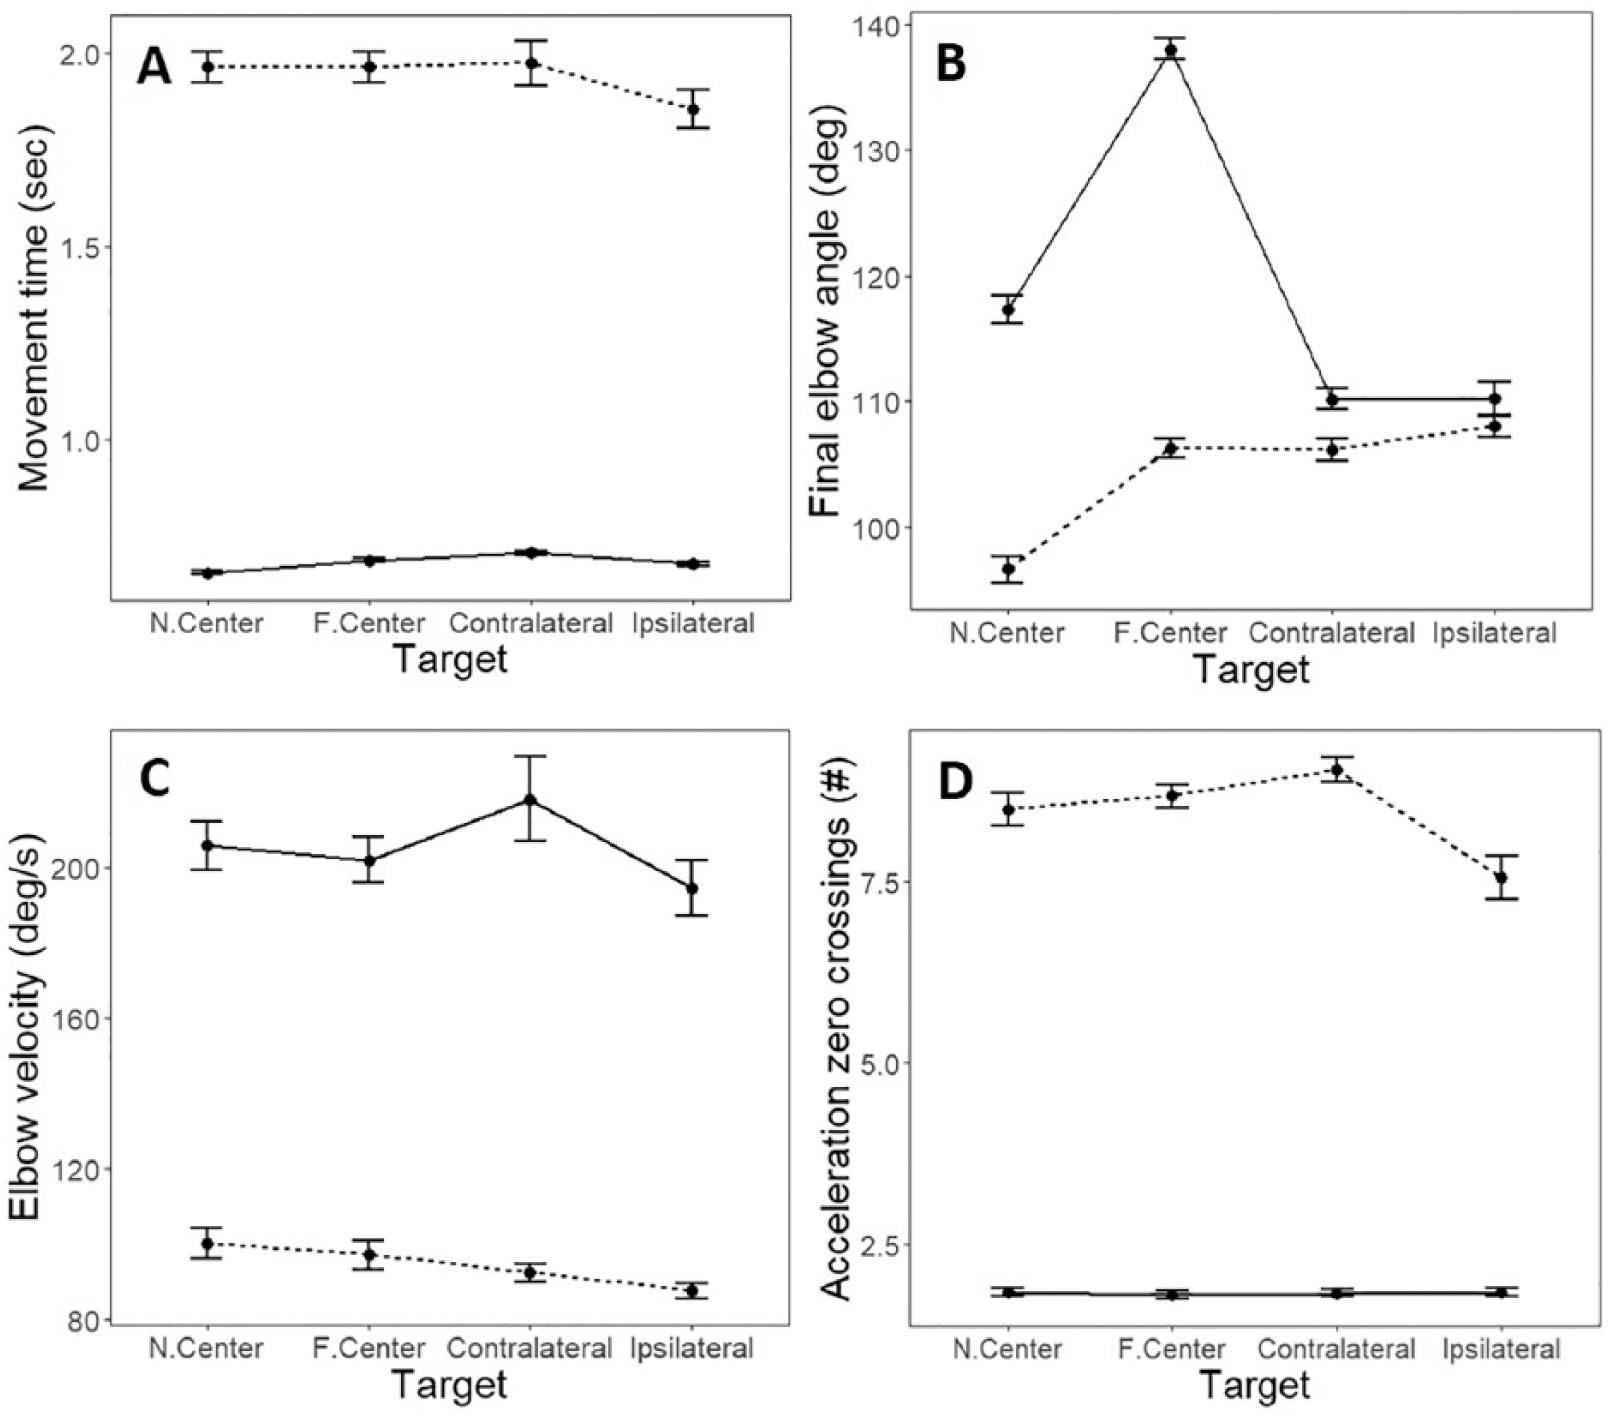
Mean and SD estimates for (A) movement time; (B) final elbow angle; (C) elbow velocity; (D) the number of acceleration zero-crossings, per target for healthy control (solid lines) and stroke (dotted lines) groups.
Final elbow angle (Figure 4B) was greater in controls than stroke participants for all targets (F1,27 = 8.20; P < .01). Elbow extension in both groups was affected by target location (stroke: F3,45 = 31.86, P < .0001; controls: F3,36 = 154.52, P < .0001) but in a different pattern. Controls modified elbow extension angle according to target location. Specifically, they used less elbow extension for the near-center compared with the far-center targets (P < .0001). They used more elbow extension for the near-center compared with the contralateral and ipsilateral targets (P < .0001 for both) and more elbow extension to the far-center compared with the ipsilateral and contralateral targets (contralateral, P < .0001; ipsilateral, P < .0001). In contrast, participants with stroke used less elbow extension for the near-center compared with all other targets (far-center P < .0001, contralateral P < .0001, ipsilateral P < .0001), whereas the other elbow ranges were not modified by target location.
Average elbow velocity (Figure 4C) was higher in controls than stroke for all targets (F1,27 = 54.47; P < .0001). Controls reached with the same average velocity to all targets. Participants with stroke reached at different speeds to different targets (F3,45 = 2.88; P < .05). The average velocity for movement to the near-center target was similar to that toward the far-center and contralateral targets but higher than the average velocity toward the ipsilateral target (P < .01).
Velocity smoothness (Figure 4D) was higher (lower number of acceleration zero-crossings) in controls than participants with stroke for all targets (F1,27 = 32.32; P < .0001). Reaches in controls had similar smoothness to all targets, whereas it differed according to target in participants with stroke (F3,45 = 8.12; P < .001). Average velocity smoothness for the near-center target was similar to that toward the far-center and contralateral targets but lower than that for the ipsilateral target (P < .01).
Relationship With MAS and FMA
BKLD values were related to the interaction between target and elbow flexor and extensor MAS (Rc2 = 0.90, Rm2 = 0.50; for both interactions, P < .001). They were not associated with FMA. BKLDs of the near-center were similar to the ipsilateral target for all elbow flexor MAS values (Figure 3 left). Near-center target BKLD values for participants with no flexor spasticity were marginally lower (P = .06) than those of the far-center and contralateral targets for participants with low flexor spasticity (MAS = 1) and were significantly lower than those of participants with higher spasticity (eg, MAS = 1+, P < .05; MAS = 2, P < .001; Figure 3 right). For far-center and contralateral targets, BKLD values of participants with elbow extensor spasticity of MAS = 1+ differed from those of other participants.
Movement time was related to elbow flexor MAS (Rc2 = 0.92; Rm2 = 0.37; P < .05), but not to target location, elbow extensor MAS, or FMA. Final elbow angles were associated with FMA and with interactions between FMA and target location (Rc2 = 0.96; Rm2 = 0.33; FMA-target interaction P < .05; FMA P < .05). Elbow angles were not related to elbow extensor or flexor MAS. Elbow velocity was related to the elbow extensor MAS interaction with target location (Rc2 = 0.92; Rm2 = 0.14; P < .05) but not to elbow flexor MAS or FMA. Velocity smoothness was strongly related to elbow flexor MAS and its interaction with target location (Rc2 = 0.97; Rm2 = 0.34; flexor MAS-target interaction P < .001; flexor MAS P < .05) but not with elbow extensor MAS or FMA.
Discussion
Relationship Between BKLD and Motor Dysfunction
GMMs have been used to model normal human motion for attaining a generalized task characterization in the robotic PbD approach.19,20 KLD, and its symmetric form BKLD, have been widely used in machine learning and data-mining applications, where it is important to measure the discrepancy between a candidate and a target distribution. 43 We show that BKLD can also be a useful tool for characterizing movement disorders.
Our results indicate that BKLD between healthy controls was an order of magnitude smaller than the BKLD between participants with stroke and controls. This suggests that BKLD may be a good biomarker of the disruption in movement patterns in people with stroke. Modeling motion using spatiotemporal GMMs facilitates integration of specific joint variability as part of the task-specific motion model. This represents an advantage over methods using global variability measures, such as UCM or PCA, because it permits the identification of key joint motion deficits, such as limitations in elbow extension caused by elbow flexor spasticity in patients with poststroke hemiparesis. Another advantage is that, unlike UCM, the BKLD approach can be used to model any movement without imposing excessive constraints on initial and final arm or joint configurations.
Relationship Between BKLD and Muscle Resistance
For participants with stroke (Rc2 values > 0.92), elbow flexor passive muscle resistance strongly explained movement time and velocity smoothness, whereas elbow extensor passive muscle resistance strongly explained elbow average velocity. This may be related to the movement pattern being initiated with elbow flexion followed by extension to the target. In addition, FMA explained the final elbow angle, which is likely related to the final angle being linked to the overall motion plan of all participating joints. The generalization of these models, however, was not very high (Rm2 values were below 0.37). In contrast, elbow flexor and extensor passive muscle resistance (MAS) strongly explained BKLD values for the examined group (Rc2 = 0.90) and had the best generalizability to the larger stroke population (Rm2 = 0.50). BKLD was not related to UL FMA scores. This lack of relationship was not surprising because FMA measures individual and combined joint movements without a specific focus on the elbow or a specific reaching task.
The MAS is a common clinical measure of muscle resistance, often used synonymously with the term spasticity. Despite its prevalence, MAS has questionable validity and only poor-to-good interrater reliability,28,44,45 partly because of the lack of consideration of stretch velocity as a controlled input variable. 5 There is general agreement that current clinical spasticity scales, even when objective, measure biomechanical variables (eg, resistance to an imposed muscle stretch) that are effects rather than causes of spasticity. 6 This may explain why determination of the relationship between spasticity and movement disorders has, thus far, been elusive.
Relationship Between Spasticity and Movement Disorders
Spasticity may be better understood in the context of a comprehensive model of motor control. According to the referent control theory of motor control, voluntary movement is generated by regulating the spatial thresholds of the stretch reflex—that is, the joint angle at which muscle activation begins and EMG emerges—based on the interaction of the system biomechanics with the environment. 46 The ability to regulate spatial thresholds is reduced in stroke and may be related to damage to descending neural pathways47-49 and is associated with a reduction in the active control range—that is, range of joint angles in which normal muscle activation is possible. Abnormal muscle activation patterns (ie, excessive coactivation) as well as spasticity, muscle weakness, and loss of dexterity appear outside this range.45,50
Levin and Feldman 47 proposed that the relationship between spasticity and voluntary motion has both spatial and temporal components. The relationship between the angular location of the tonic stretch reflex threshold (TSRT) and the angular zone in which spasticity is present, has been characterized at the elbow and ankle in participants with stroke.48,49,51,52 Using this approach, Turpin et al 50 showed that the TSRT measured at rest could be modulated during active elbow extension and that this modulation was related to the level of functional impairment caused by stroke. This was the first demonstration of a relationship between spasticity measured at rest and the motor deficit during active elbow extension.
Our results show that movement patterns of controls were similar to each other. However, those of participants with stroke differed according to target location. Reaches to the far-center and contralateral targets had greater velocities and joint ranges. It is likely that these targets required motion beyond the patient’s TSRT angle into the spasticity zone resulting in greater differences from healthy motion patterns expressed as greater BKLD values. This question can be addressed in future studies.
Limitations
Only spasticity in the elbow joint was analyzed, whereas patients with stroke can also have spasticity in the shoulder girdle, wrist, and/or finger flexors. It is possible that spasticity in muscles spanning adjacent joints may have affected the elbow movement. Movements were done only at a self-paced speed. Although spasticity is velocity dependent,3,4 the effect of varying speed on BKLD was not analyzed as well as the effects of impaired sensation. The participant cohort might be considered small, although it was consistent with sample sizes used in similar studies. Finally, although the age distribution was similar between groups (verified by a t-test), they were not exactly matched.
Footnotes
Acknowledgements
The support of the Helmsley Charitable Trust through the Agricultural, Biological and Cognitive Robotics Center (SB) is gratefully acknowledged. Finally, we would like to thank Rotem Duani, Tal Galinka, Maureen MacMahon, Arel Shasha, and Akash Shah for their assistance with the data collection.
Declaration of Conflicting Interests
The authors declared no potential conflicts of interest with respect to the research, authorship, and/or publication of this article.
Funding
The authors disclosed receipt of the following financial support for the research, authorship, and/or publication of this article: This project is supported by the Canada-Israel Health Research Program (MFL and DGL), a program that is jointly funded by the Canadian Institutes of Health Research, the Azrieli Foundation, the International Development Research Center (IDRC, Grant Number 108186-001), and the Israel Science Foundation (ISF, Grant Number 2392\15).