
Abstract
Background. Many persons with stroke experience physical, cognitive, and emotional problems that contribute to restrictions in social participation. There is, however, a lack of knowledge on the long-term course of participation over time post-stroke. Objective. To describe the time course of participation up to 2 years post-stroke and to identify which demographic and stroke-related factors are associated with this time course. Methods. This was a multicenter, prospective cohort study following 390 persons with stroke from hospital admission up to 2 years (at 2, 6, 12, and 24 months). Multilevel modeling with linear and quadratic time effects was used to examine the course of the frequency of vocational and social/leisure activities, experienced restrictions, and satisfaction with participation. Results. The frequency of vocational activities increased up to 1 year post-stroke and leveled off thereafter. Older and lower-educated persons showed less favorable courses of participation than younger and higher-educated persons, respectively. The frequency of social/leisure activities decreased post-stroke. Participation restrictions declined up to 1 year post-stroke and leveled off thereafter. Persons dependent in activities of daily living (ADL) kept experiencing more restrictions throughout time than independent persons. Satisfaction with participation increased slightly over time. Conclusions. Changes in participation occurred mostly in the first year post-stroke. Particularly older and lower-educated persons, and those dependent in ADL showed less favorable courses of participation up to 2 years post-stroke. Clinicians can apply these findings in identifying persons most at risk of long-term unfavorable participation outcome and, thus, target rehabilitation programs accordingly.
Introduction
Stroke can lead to long-lasting physical problems such as mobility limitations, 1 cognitive problems such as attention or memory deficits, 2 and emotional problems such as anxiety,3,4 depressive symptoms,3-5 and fatigue.4,6 The population of persons surviving a stroke7,8 increases, consistent with major improvements in acute stroke care (eg, stroke units, thrombolysis, and thrombectomy9,10), but this also means that more people have to deal with the long-lasting consequences of stroke.11,12 These consequences contribute to the deterioration of social participation post-stroke.13-17 Importantly, persons with stroke view social participation (participation hereafter) as a central aspect of their recovery.18,19
Participation can be defined as involvement in a life situation such as paid work, family, or community life, 17 which consists of actual performed activities, 20 such as the frequency of observable actions and behaviors,21-23 and the subjective experience of persons, 20 such as experienced restrictions and satisfaction.21-23
In previous studies, it was observed that the frequency of activities decreases in persons with stroke, relative to their premorbid levels.16,24-28 This particularly applies to vocational activities (work, unpaid work, and household activities), but social activities decrease after stroke, too. 28 Four months after discharge from outpatient rehabilitation, 50% of persons with stroke still experienced participation problems. 29 Social activity levels have been reported to be lower in persons with stroke at 1 year post-stroke than in healthy controls, 30 a level that remained stable up to 3 years. 31 Past studies showed that only 39% of persons with stroke were satisfied with their lives as a whole after 1 year, 16 which might be even lower up to 3 years post-stroke, 32 especially in socially inactive persons. 33
Although studies have shed some light on the course of participation over time post-stroke, it is difficult to get a good understanding of how levels of participation develop and change over time. This is a result of the use of cross-sectional designs,16,24,26,27,33 longitudinal designs limited to either only the first 6 months13,25,28,29 or only the long-term levels of participation after stroke,31,32,34 studies only incorporating 2 time points, 35 and many different participation measures, some measuring the frequency of activities and others the subjective experience of participation. 36
Research into factors associated with participation post-stroke could lead to identifying possible risk factors of an unfavorable outcome. Earlier studies showed that demographic factors such as older age at stroke onset,14,37 lower levels of education,29,38 and female sex 37 were related to a less favorable outcome in terms of participation, along with stroke-related factors such as dependence in activities of daily living (ADL),39,40 more severe stroke, 37 and lower levels of cognitive functioning.26,29 However, these factors are yet to be examined in relation to the course of participation over time and as such to be identified as possible risk factors.
To get a more detailed and comprehensive understanding of participation over time, it is necessary to include repeated measurements of objective (ie, frequency of activities) as well as subjective (ie, experienced restrictions and satisfaction) aspects of participation. Furthermore, it is important to identify persons in the early stage after stroke, who are at risk of an unfavorable outcome in the long term. At this point in time, potential risk factors can be easily determined through available information, including demographics and stroke-related information, and rehabilitation care can be provided. Consequently, we studied participation over a 2-year follow-up in a clinical cohort of persons with stroke in order to answer the following research questions: how does participation develop over the first 2 years after stroke in terms of frequency, restrictions, and satisfaction? Moreover, which demographic and stroke-related factors are associated with this time course?
Methods
Design and Procedure
The current study is part of the Restore4stroke Cohort, a multicenter, prospective cohort study of persons with stroke described in detail elsewhere. 41 Persons with ischemic or intracerebral hemorrhagic stroke (first ever and recurrent) were recruited from 6 general hospitals in the Netherlands and followed for up to 2 years. The Restore4stroke study was approved by the Committee on Research involving Human Subjects of the St Antonius Hospital in Nieuwegein (the Netherlands) and by the medical ethics committees of all participating hospitals. Written informed consent was obtained from all persons.
The Restore4stroke cohort study consists of 5 assessments: at stroke onset (ie, within first week of admission; T1) and at 2 (T2), 6 (T3), 12 (T4), and 24 (T5) months post-stroke. Nurses extracted information from medical charts on stroke-related factors and ADL dependence at 4 days post-stroke (assessed by the neurologist). At first assessment (T1), information on demographic factors was gathered as well as retrospective data on premorbid levels of vocational and social/leisure activities by consulting the patient or a family member. Premorbid level of functioning was considered T0. In the subsequent assessments, persons with stroke completed the questionnaires themselves. In addition, a trained research assistant conducted a cognitive screening at T2 and T3.
Participants
Persons with stroke were included if they had a clinically confirmed diagnosis of stroke (ischemic or intracerebral hemorrhagic lesion) as assessed by the neurologist in the hospital using standard procedures (eg, computed tomography scans) and suffered this stroke within the past 7 days. Persons were excluded if they (1) had a comorbid condition that was anticipated to interfere with study outcomes (eg, neuromuscular disease); (2) had a premorbid Barthel Index (BI) 42 score of 17 or lower, indicative of premorbid ADL dependence; (3) had insufficient command of the Dutch language to understand and complete questionnaires (as judged by the clinician); and (4) were already suffering from cognitive decline premorbidly, as indicated by a score ⩾1 on the hetero-anamnesis list cognition. 43 The current study only included those persons living at home (ie, community dwelling) because participation levels of persons living at home cannot be compared with those living in a nursing home. As the institutionalized group was very small, which therefore did not permit separate analyses, persons with stroke who lived in a nursing home at T5 were excluded.
Measures
Outcome Measure
The Utrecht Scale for Evaluation of Rehabilitation–Participation (USER-P) was used, which is a valid, reliable, and responsive self-report questionnaire on participation.22,23,44 The USER-P was used for its strong psychometric foundations, its unique perspective in combining the objective as well as the subjective aspects of participation, and prior use in studies involving persons with stroke.28,29,37,39,40 It consists of 3 scales: Frequency of participation, experienced participation Restrictions, and Satisfaction with participation.
The Frequency scale, Part A, measures self-perceived vocational activities per week across 4 items: the number of hours spent on paid work, unpaid work, education, and housekeeping. Each item is scored on a scale from 0 (none at all) to 5 (⩾36 hours). The Frequency scale Part B measures self-perceived frequency of social/leisure activities during the past 4 weeks across 7 items: physical exercise, going out, day trips, leisure activities at home, visiting family or friends, visit of family at your home, contact with others. Each item is scored on a scale from 0 (not at all) to 5 (⩾19 times).
The Restrictions scale consists of 11 items that measure self-perceived restrictions experienced with vocational, leisure, and social activities (eg, from paid work to visiting family and friends). The extent of experienced restrictions for each activity is scored on a scale from 0 (not possible to perform) to 3 (performed without difficulty). If the patient does not perform the activity for reasons other than stroke, a “not applicable” score can be recorded.
The Satisfaction scale consists of 10 items relating to self-perceived satisfaction with vocational, leisure, and social activities (ie, generally comparable with the restrictions items). Satisfaction is rated on a scale from 0 (very dissatisfied) to 4 (very satisfied). “Not applicable” can be recorded on 2 items in this scale if one does not perform vocational activities or does not have a partner.
All scale sum scores are converted to range from 0 to 100, with higher scores indicative of higher levels of participation (ie, more participation, less restrictions, and higher satisfaction). The Frequency scale (Parts A and B) was also administered in the first week post-stroke to collect information on premorbid level of participation (ie, 4 weeks before stroke, T0). In subsequent assessments, all USER-P scales were administered.
Independent Variables
Information on age, sex, level of education, stroke characteristics (type, hemisphere, severity), destination after discharge and independence in ADL were collected at T1. Education was measured according to the Dutch classification method of Verhage, 45 with scores ranging from 1 to 7, and higher scores indicative of higher completed education. Stroke severity was assessed by the National Institutes of Health Stroke Scale (NIHSS), 46 with higher scores indicative of more severe stroke symptoms (range 0-30). The BI was used to assess independence in ADL, 42 wherein higher scores indicate more independence in ADL (range 0-20). Cognitive functioning was assessed at T2 using the Montreal Cognitive Assessment (MoCA), 47 which is a brief cognitive screening method, with scores ranging from 0 to 30. Higher scores indicate better cognitive functioning.
Analyses
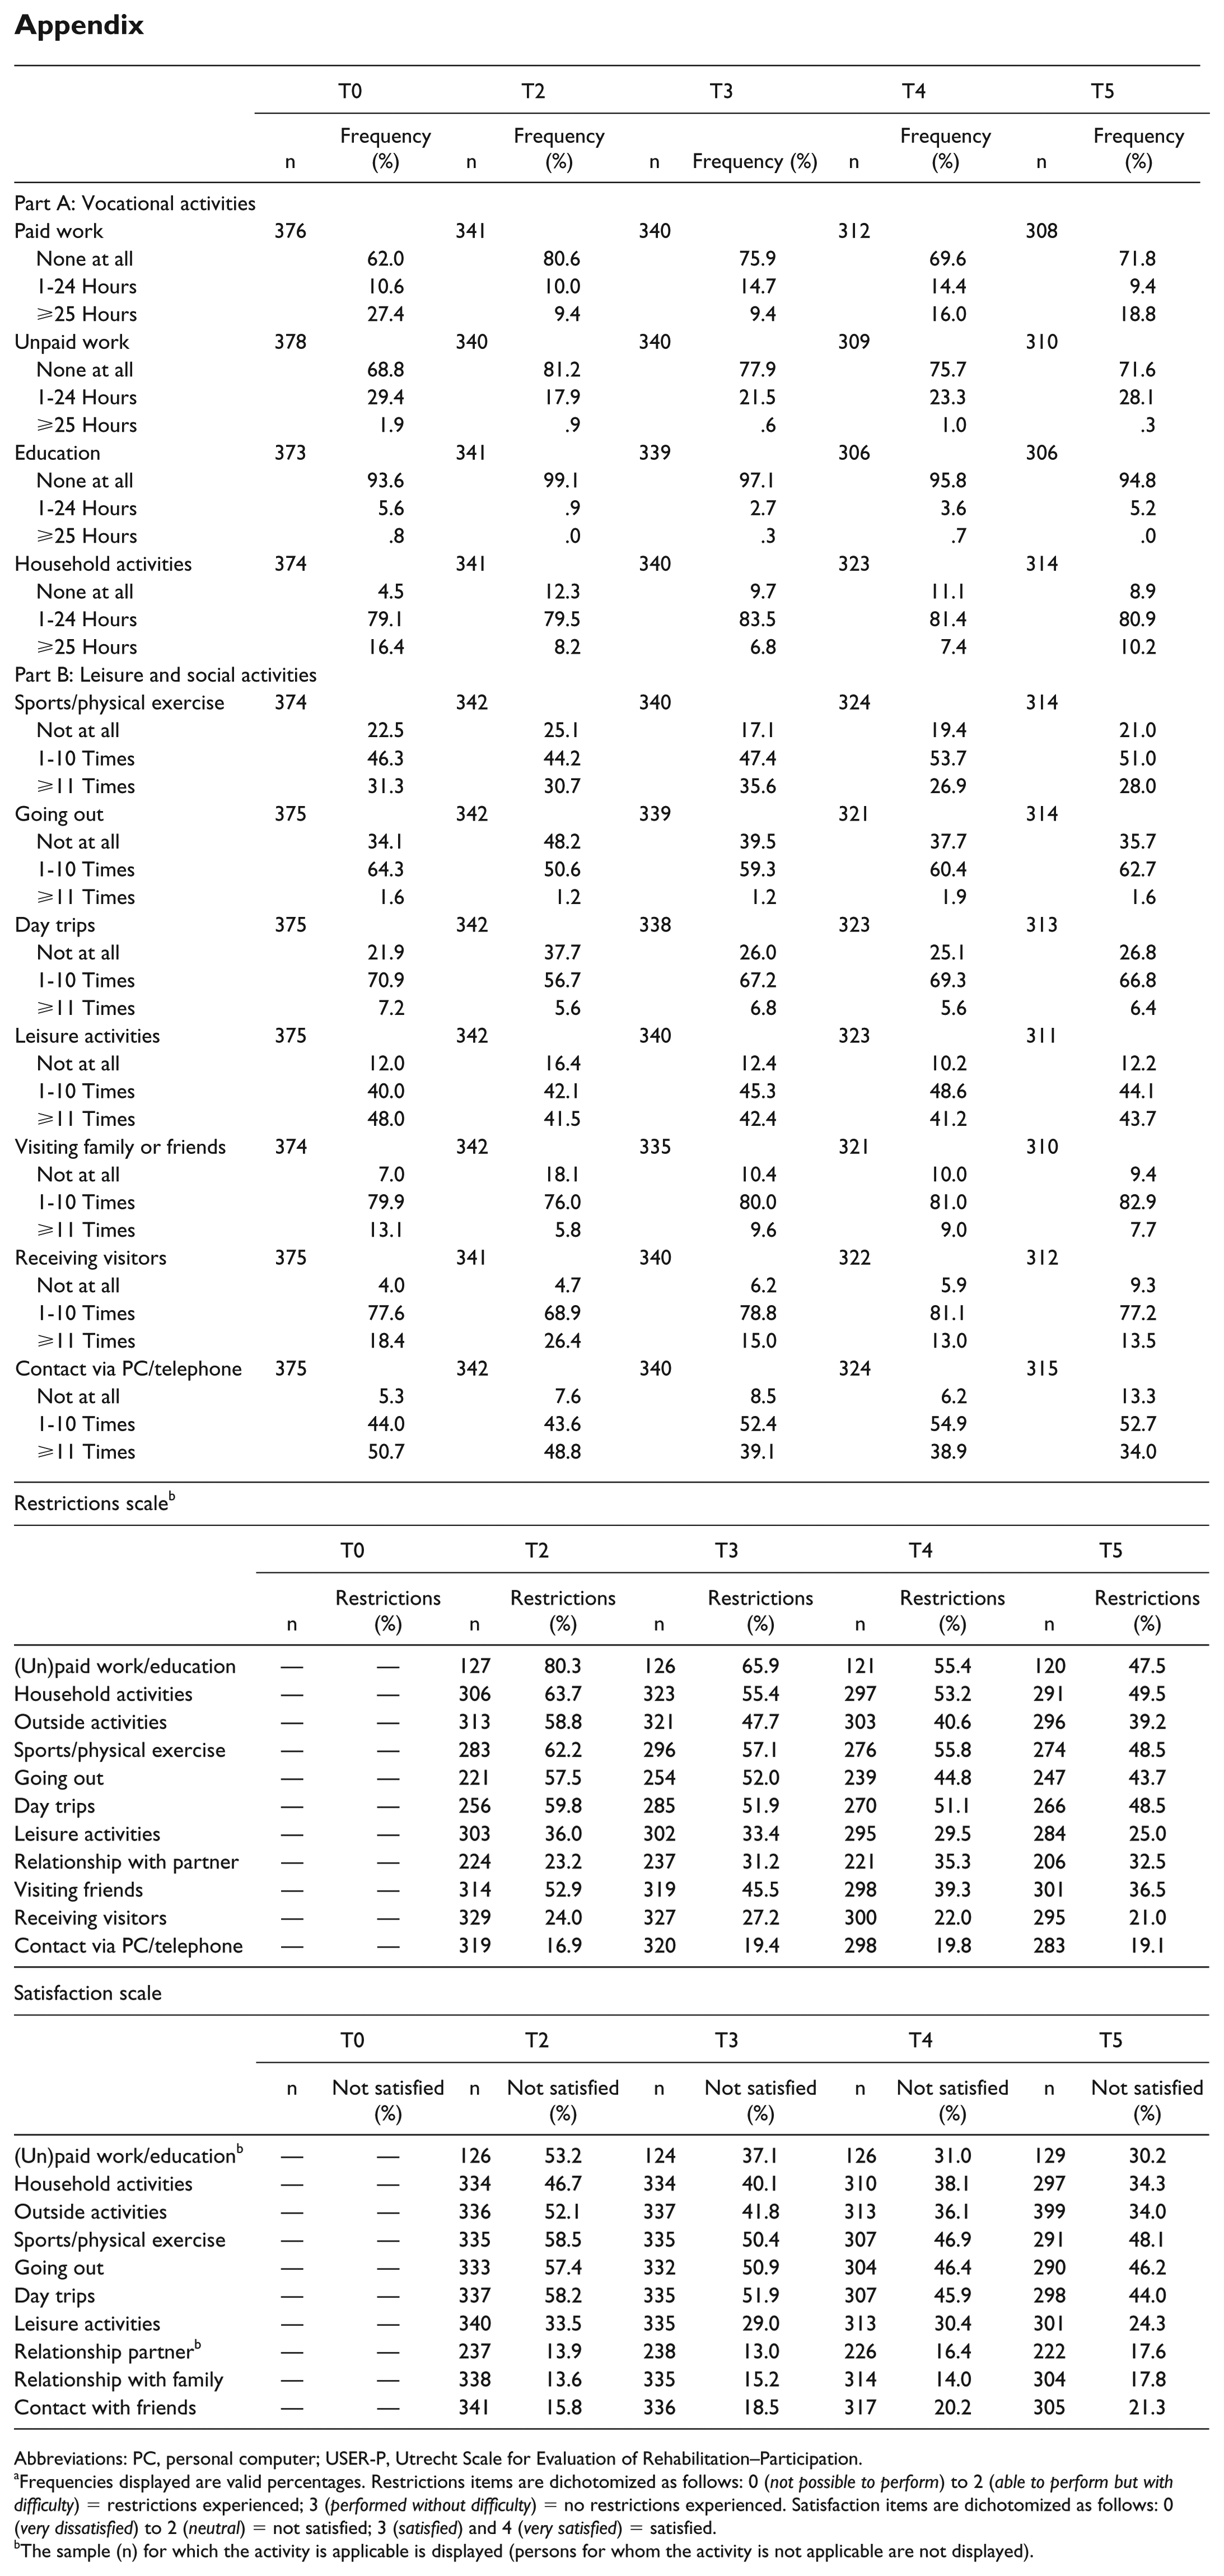
Characteristics of the included population, and subsequently the frequencies of activities of the USER-P, were described using median scores with ranges. For the frequencies of the Restrictions and Satisfaction scales, the items were dichotomized as follows: responses on the Restrictions Scale were coded into “0 = restrictions” (“activity not possible” to “activity possible with difficulties”) and “1 = no restrictions” (“activity possible without difficulties”). Satisfaction items were dichotomized into “0 = not satisfied” (“very dissatisfied” to “neutral”) and “1 = satisfied” (“satisfied” to “very satisfied”). “Not applicable” answers were recoded as missing.
The trajectories of post-stroke participation were modeled by multilevel (growth curve) modeling with the total scores of Frequency Part A (vocational activities) and Part B (social/leisure activities), Restrictions, and Satisfaction as the dependent variables in separate models. With this statistical technique, all available data could be used. As a first step, an unconditional means model (without any predictors) was fitted, with random intercepts across persons to account for the fact that repeated measures are correlated within individuals. The linear and quadratic functions of time were added in sequence, with time entered as a continuous variable (2, 6, 12, and 24 months). Likelihood ratio tests were used to assess model fit. Random slopes were allowed if the model was significantly better compared with a model with only random intercepts based on likelihood ratio testing. Likewise, covariance structures were specified according to best fit. Herewith, it was examined whether the addition of a quadratic time function added on the linear model. The best-fitting model was then used for testing main effects as well as main and interaction effects between the dichotomous predictors and time (linear as well as quadratic).
In total, 6 predictors were of interest: age as dichotomized with a median split into young (⩽67) and old (⩾68), sex, education into low (⩽5) or high (⩾6; completed higher professional education or have a university degree), NIHSS dichotomized into no/mild symptoms (⩽4) and moderate/severe symptoms (>4), the MoCA total scores for cognitive functioning at T2 into low (⩽25) and high (>25), and the BI at T1 into ADL dependent (⩽17) and ADL independent (>17). If a predictor showed a significant association with the averaged participation over time (main effects analyses), interaction terms between the predictor and time (linear and quadratic terms) were added to the model to assess whether groups differed in trajectories in participation over time (ie, forward selection). Subsequently, the premorbid means (T0) of the Frequency scale Part A and B were described for those groups showing significant interactions with time. An α of 5% (2-sided) was set for significance testing. All statistical analyses were performed with IBM SPSS Statistics for Macintosh, Version 24.0 (New York).
Results
Characteristics
Of the 395 participants in the Restore4stroke cohort, 390 met the inclusion criteria (5 persons with stroke lived at a nursing home at T5 and were, therefore, excluded from analyses). Table 1 provides demographic and stroke-related information of the included participants. Median age at stroke onset was 67 years, and 65% were men. The great majority suffered an ischemic stroke (93%). More than half of the participants experienced mild stroke symptoms (56%) and were independent in ADL at T1. Most participants (71%) were directly discharged to their homes.
Characteristics of All Persons With Stroke (n = 390). a
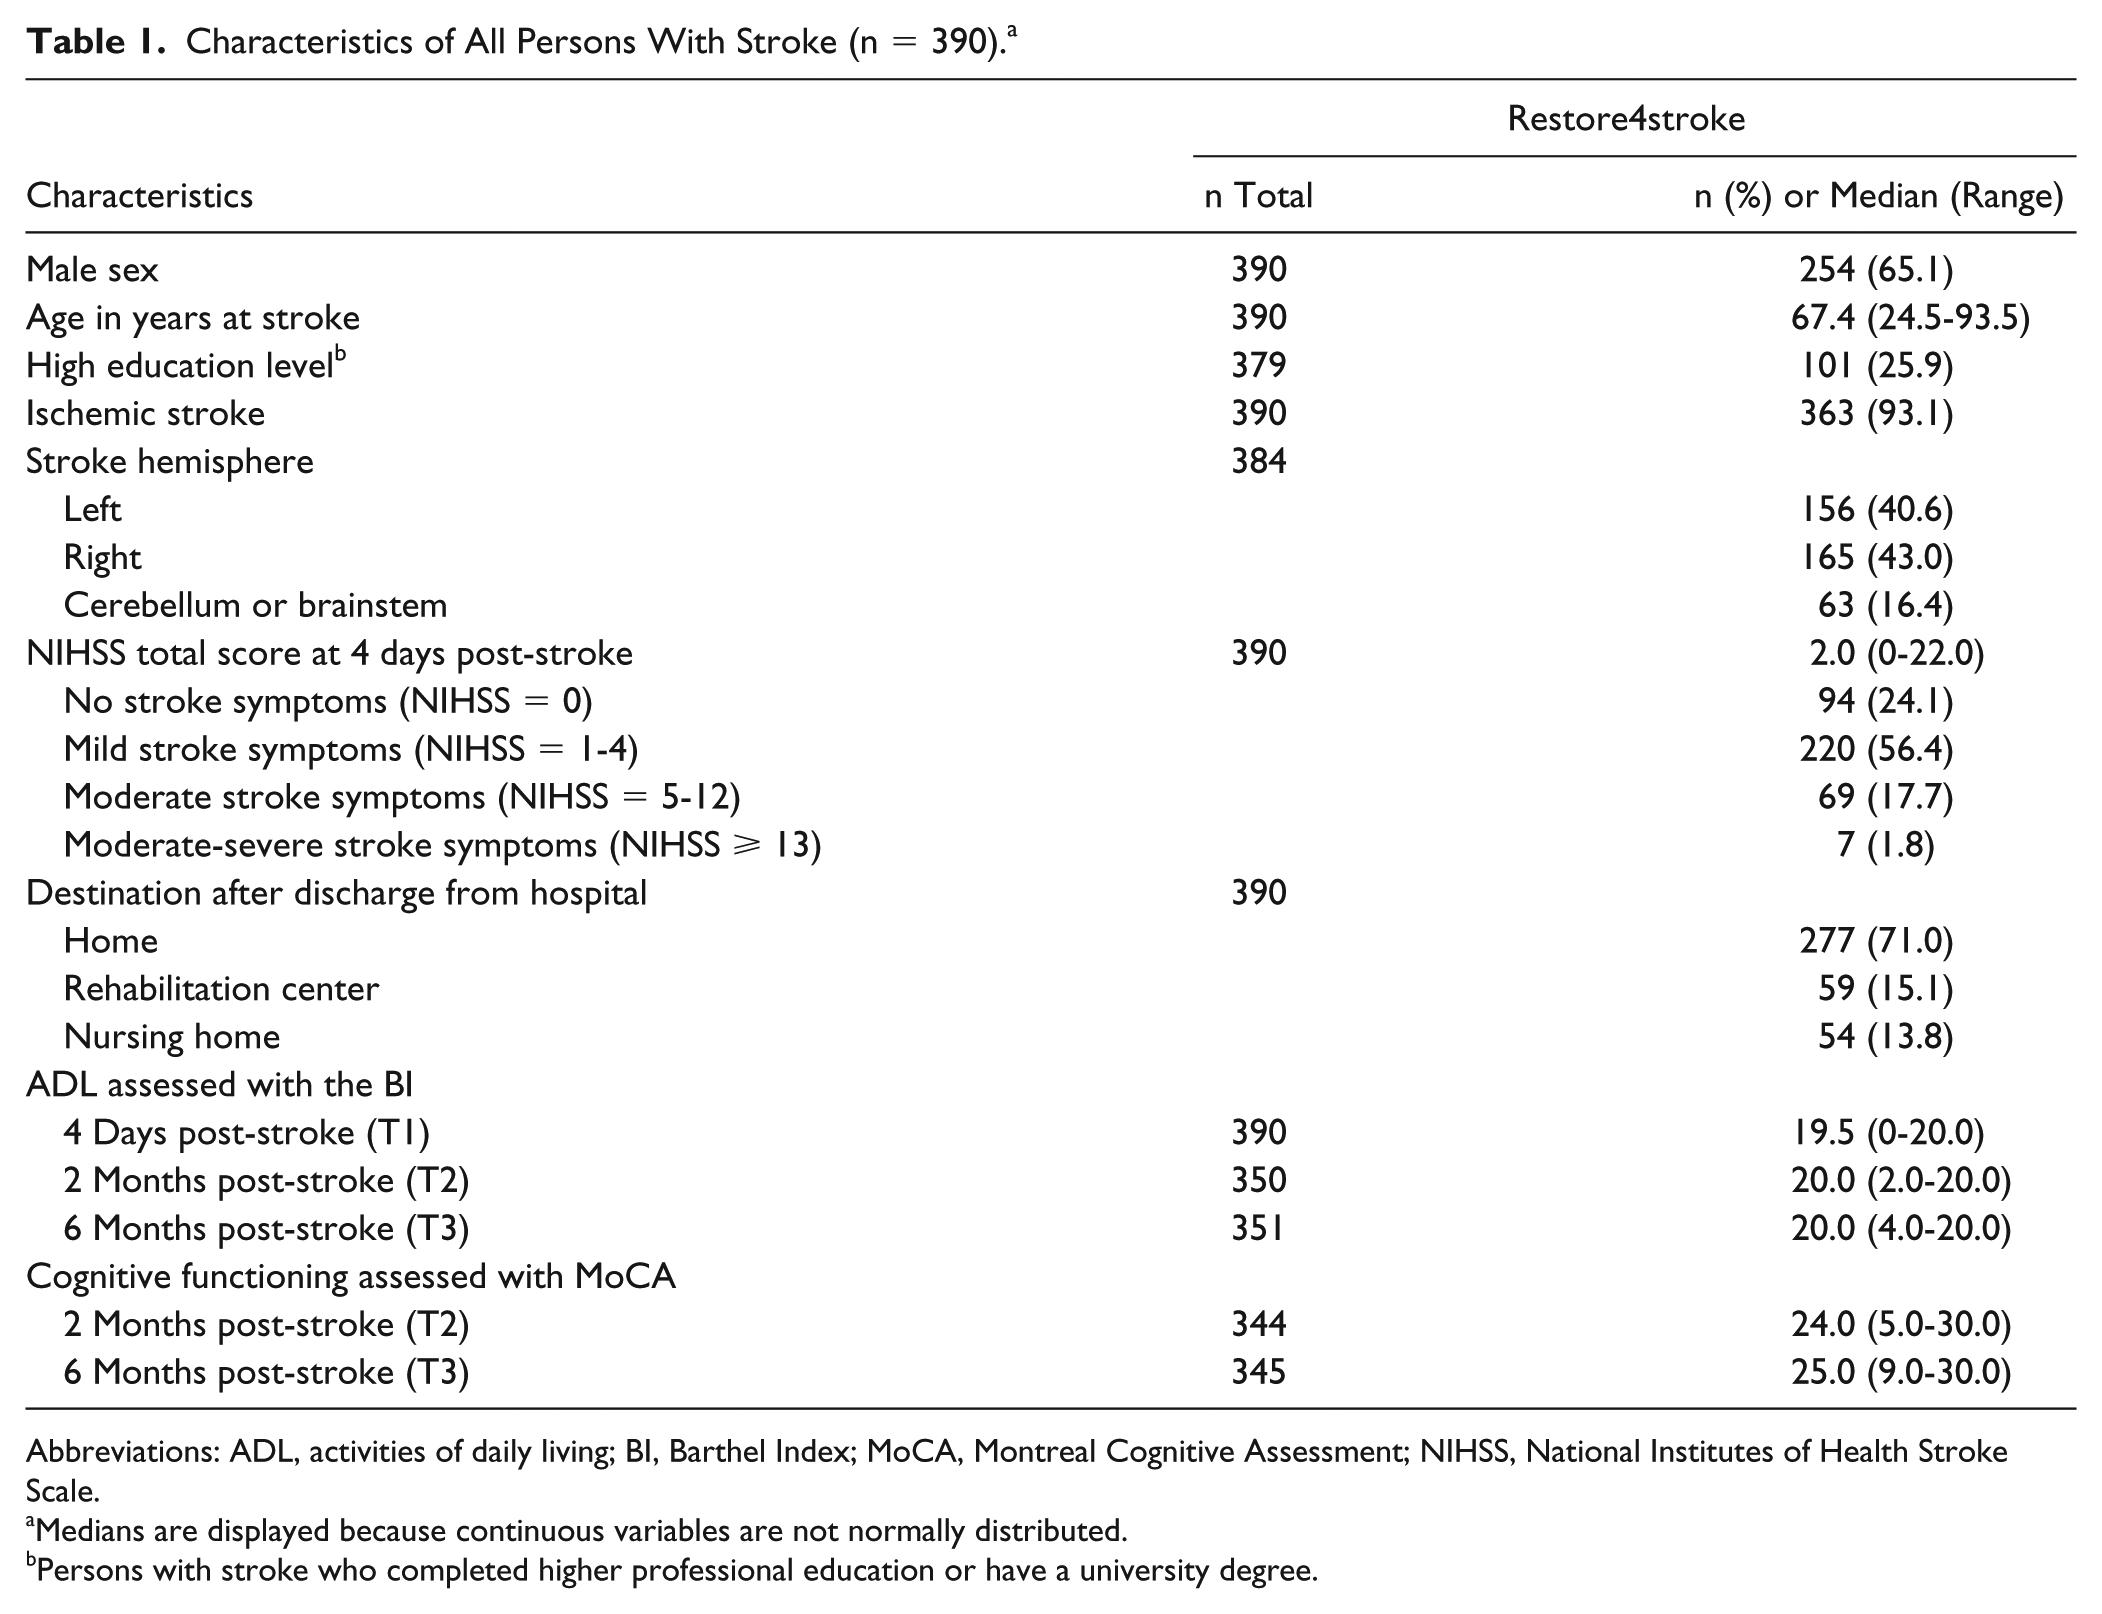
Abbreviations: ADL, activities of daily living; BI, Barthel Index; MoCA, Montreal Cognitive Assessment; NIHSS, National Institutes of Health Stroke Scale.
Medians are displayed because continuous variables are not normally distributed.
Persons with stroke who completed higher professional education or have a university degree.
Course of Participation Over Time
Table 2 shows raw median scores (with range) of the 4 outcome scales of the USER-P over time. The appendix shows the frequencies, experienced restrictions, and satisfaction with participation scores per activity (on item level).
Medians and Ranges for USER-P Participation Domains for All Included Participants at Each Time Point.
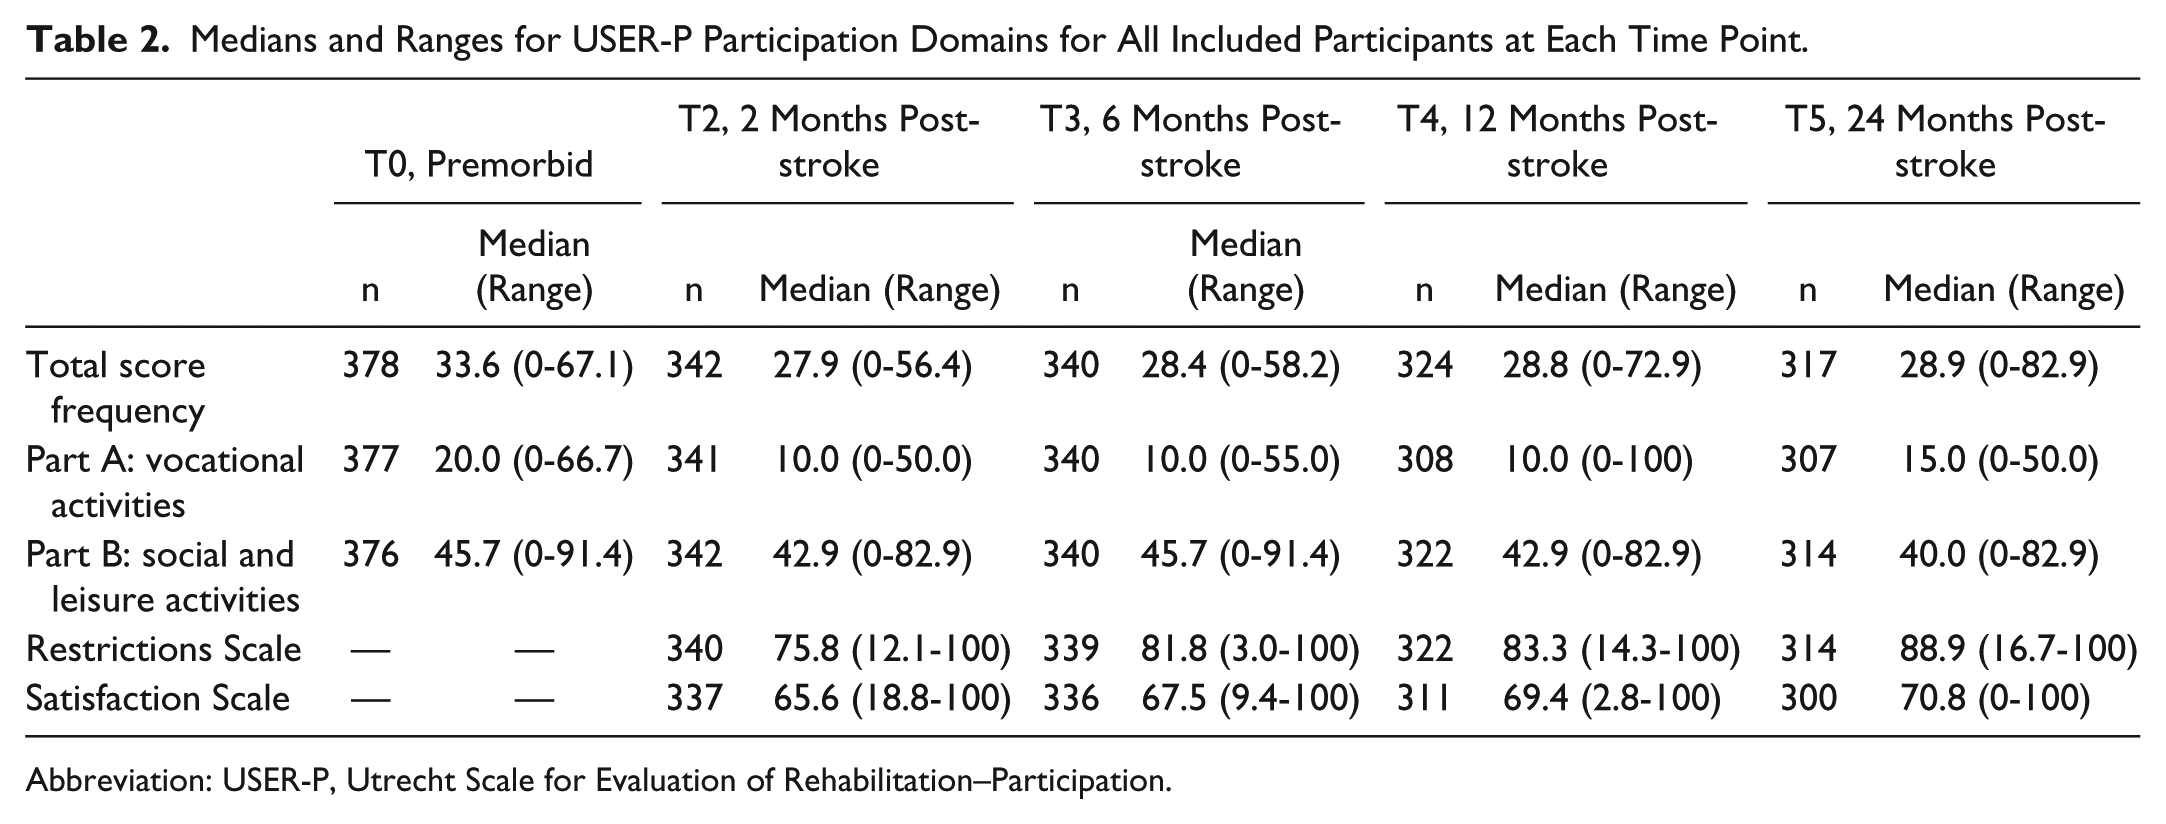
Abbreviation: USER-P, Utrecht Scale for Evaluation of Rehabilitation–Participation.
Part A: Vocational Activities
The best-fitting model of frequency of participation in vocational activities (Part A) over time included a significant positive linear effect of time as well as a significant negative quadratic effect of time (Table 3). The positive linear effect is indicative of an increase in vocational activities up to T4 and the negative quadratic effect of the smaller increase in vocational activities from T4 to T5 (Figure 1, section 1.1).
Rate of Change in Frequency of Participation in Vocational Activities and Social/Leisure Activities Over Time Post-stroke.
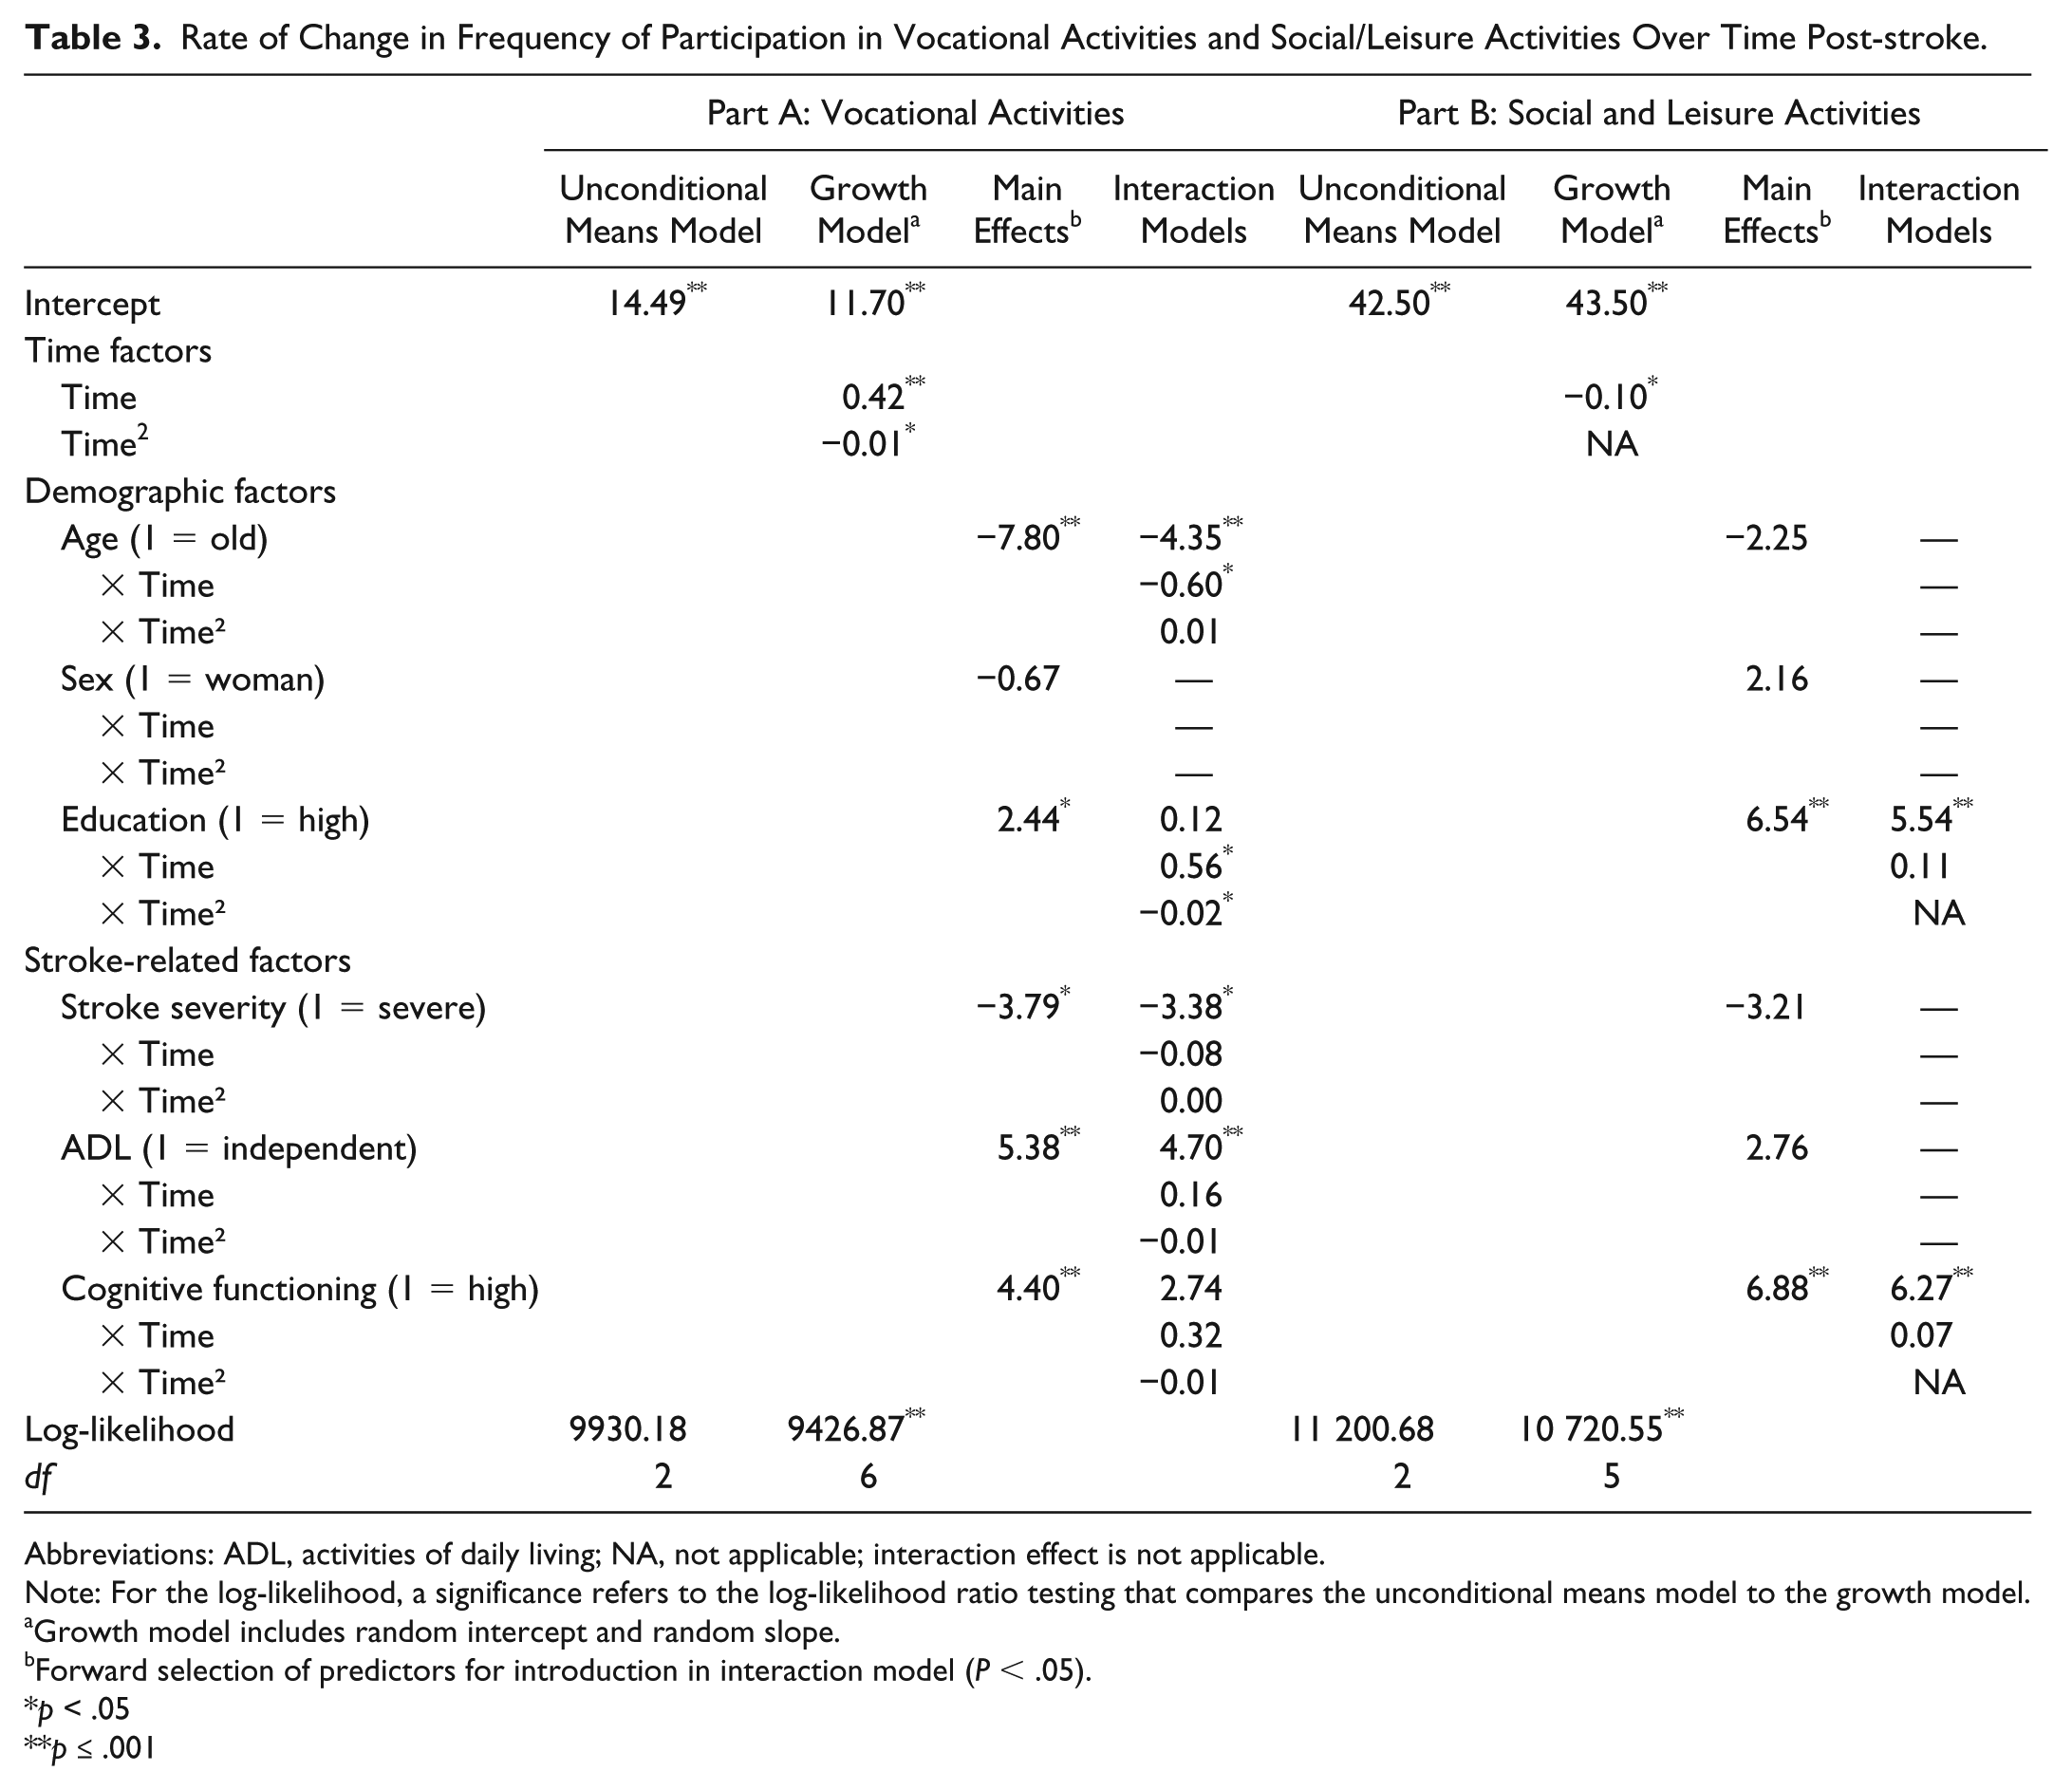
Abbreviations: ADL, activities of daily living; NA, not applicable; interaction effect is not applicable.
Note: For the log-likelihood, a significance refers to the log-likelihood ratio testing that compares the unconditional means model to the growth model.
Growth model includes random intercept and random slope.
Forward selection of predictors for introduction in interaction model (P < .05).
p < .05
p ≤ .001
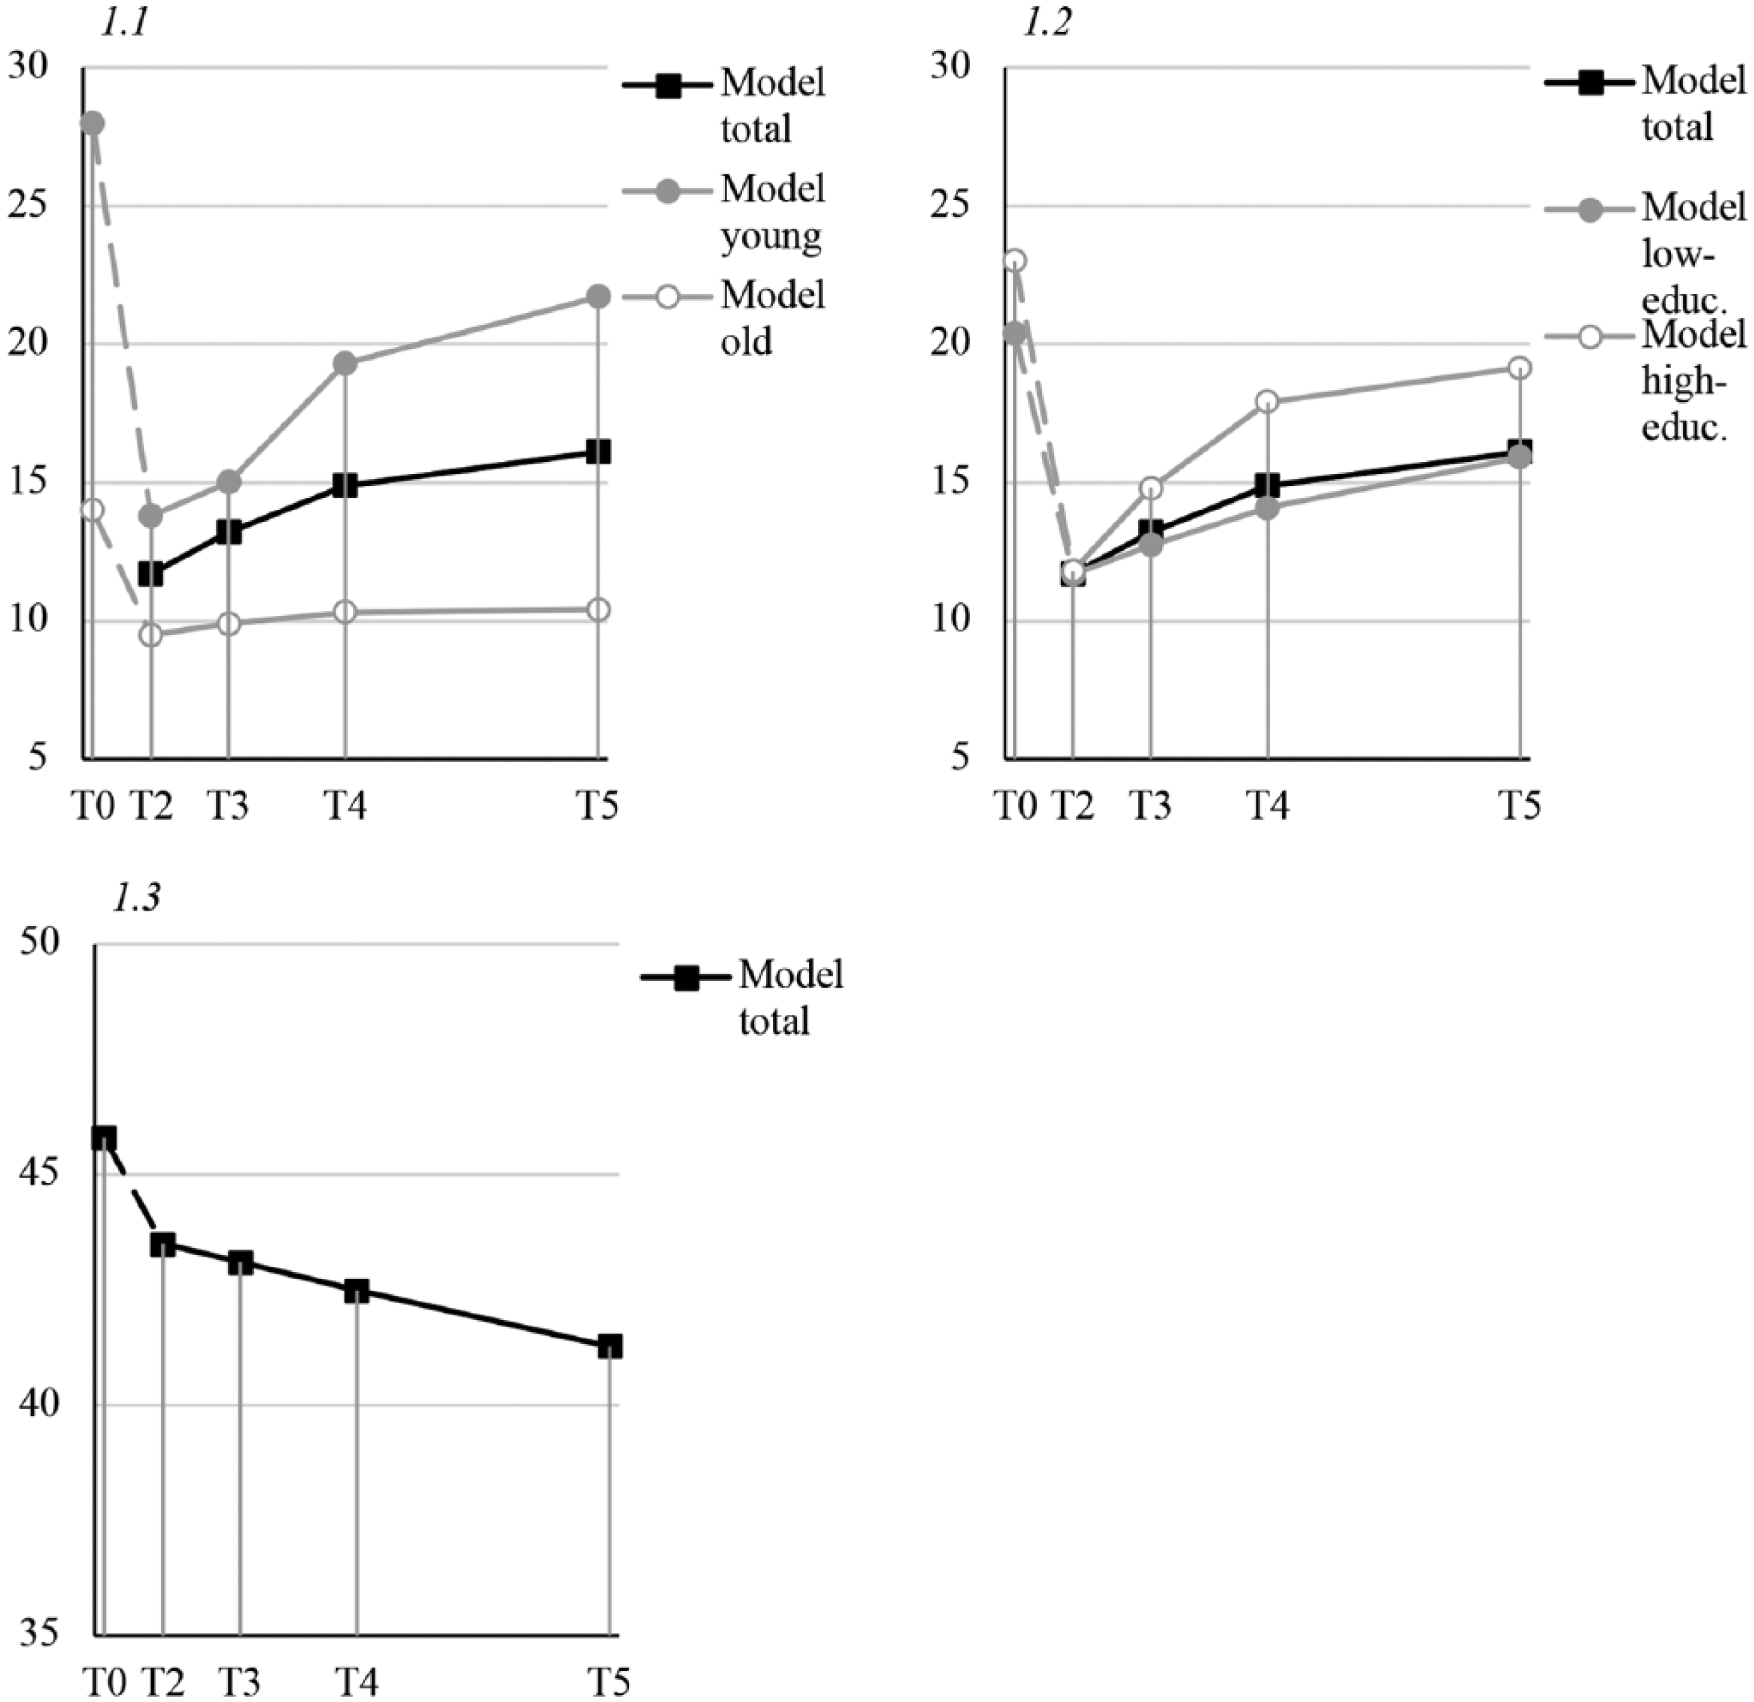
Section 1.1: vocational activities over time in interaction with age. Section 1.2: vocational activities over time in interaction with educational level. Section 1.3: Leisure activities over time. All scales originally range from 0 to 100; premorbid levels (T0) are not incorporated in the models and, therefore, followed by dashed lines.
Main effects analyses (ie, associations averaged over all time points) showed that young age and high educational level were significantly associated with more hours spent on vocational activities averaged over time. This association with more hours spent on vocational activities averaged over time was also observed for mild stroke severity, high ADL independence, and higher levels of cognitive functioning. Therefore, these variables were separately entered in the best fitting model (Table 3).
A significant time by age interaction effect was observed (Table 3), which showed that hours spent on vocational activities over time increased more for younger persons than for their older peers (Figure 1, section 1.1). Young persons showed a premorbid mean of 28.0 (SD = 12.2) and older persons a mean of 13.9 (SD = 9.1) in vocational activities. With regard to educational level, both a linear and quadratic time by educational level interaction effect were observed (Table 3). Higher-educated persons increased significantly more in vocational activities than lower-educated persons, but this increase also significantly leveled off over time (Figure 1, section 1.2). Low-educated participants showed a premorbid mean of 20.5 (SD = 12.5) and high-educated persons a mean of 23.1 (SD = 13.8). No other significant interaction effects of the predictors with the linear or quadratic effect of time were found (Table 3).
Part B: Social/Leisure Activities
The best-fitting model of the course of participation in social/leisure activities (Part B) included a significant negative linear effect of time (Table 3), indicative of a decrease in social/leisure activities after T3 (Figure 1, section 1.3).
High educational level and high cognitive functioning were significantly associated with a higher frequency of social/leisure activities averaged over time, but no significant interaction effects with the linear effect of time were found (Table 3).
Restrictions
The best-fitting model of the course of experienced restrictions in participation included a linear and quadratic time effect (Table 4). The positive linear effect is indicative of the increase in restrictions score (indicating less restrictions) up to T4 and the negative quadratic effect of the smaller increase from T4 to T5 (Figure 2, section 2.1).
Rate of Change in Experienced Restrictions and Satisfaction With Participation Over Time Post-stroke.
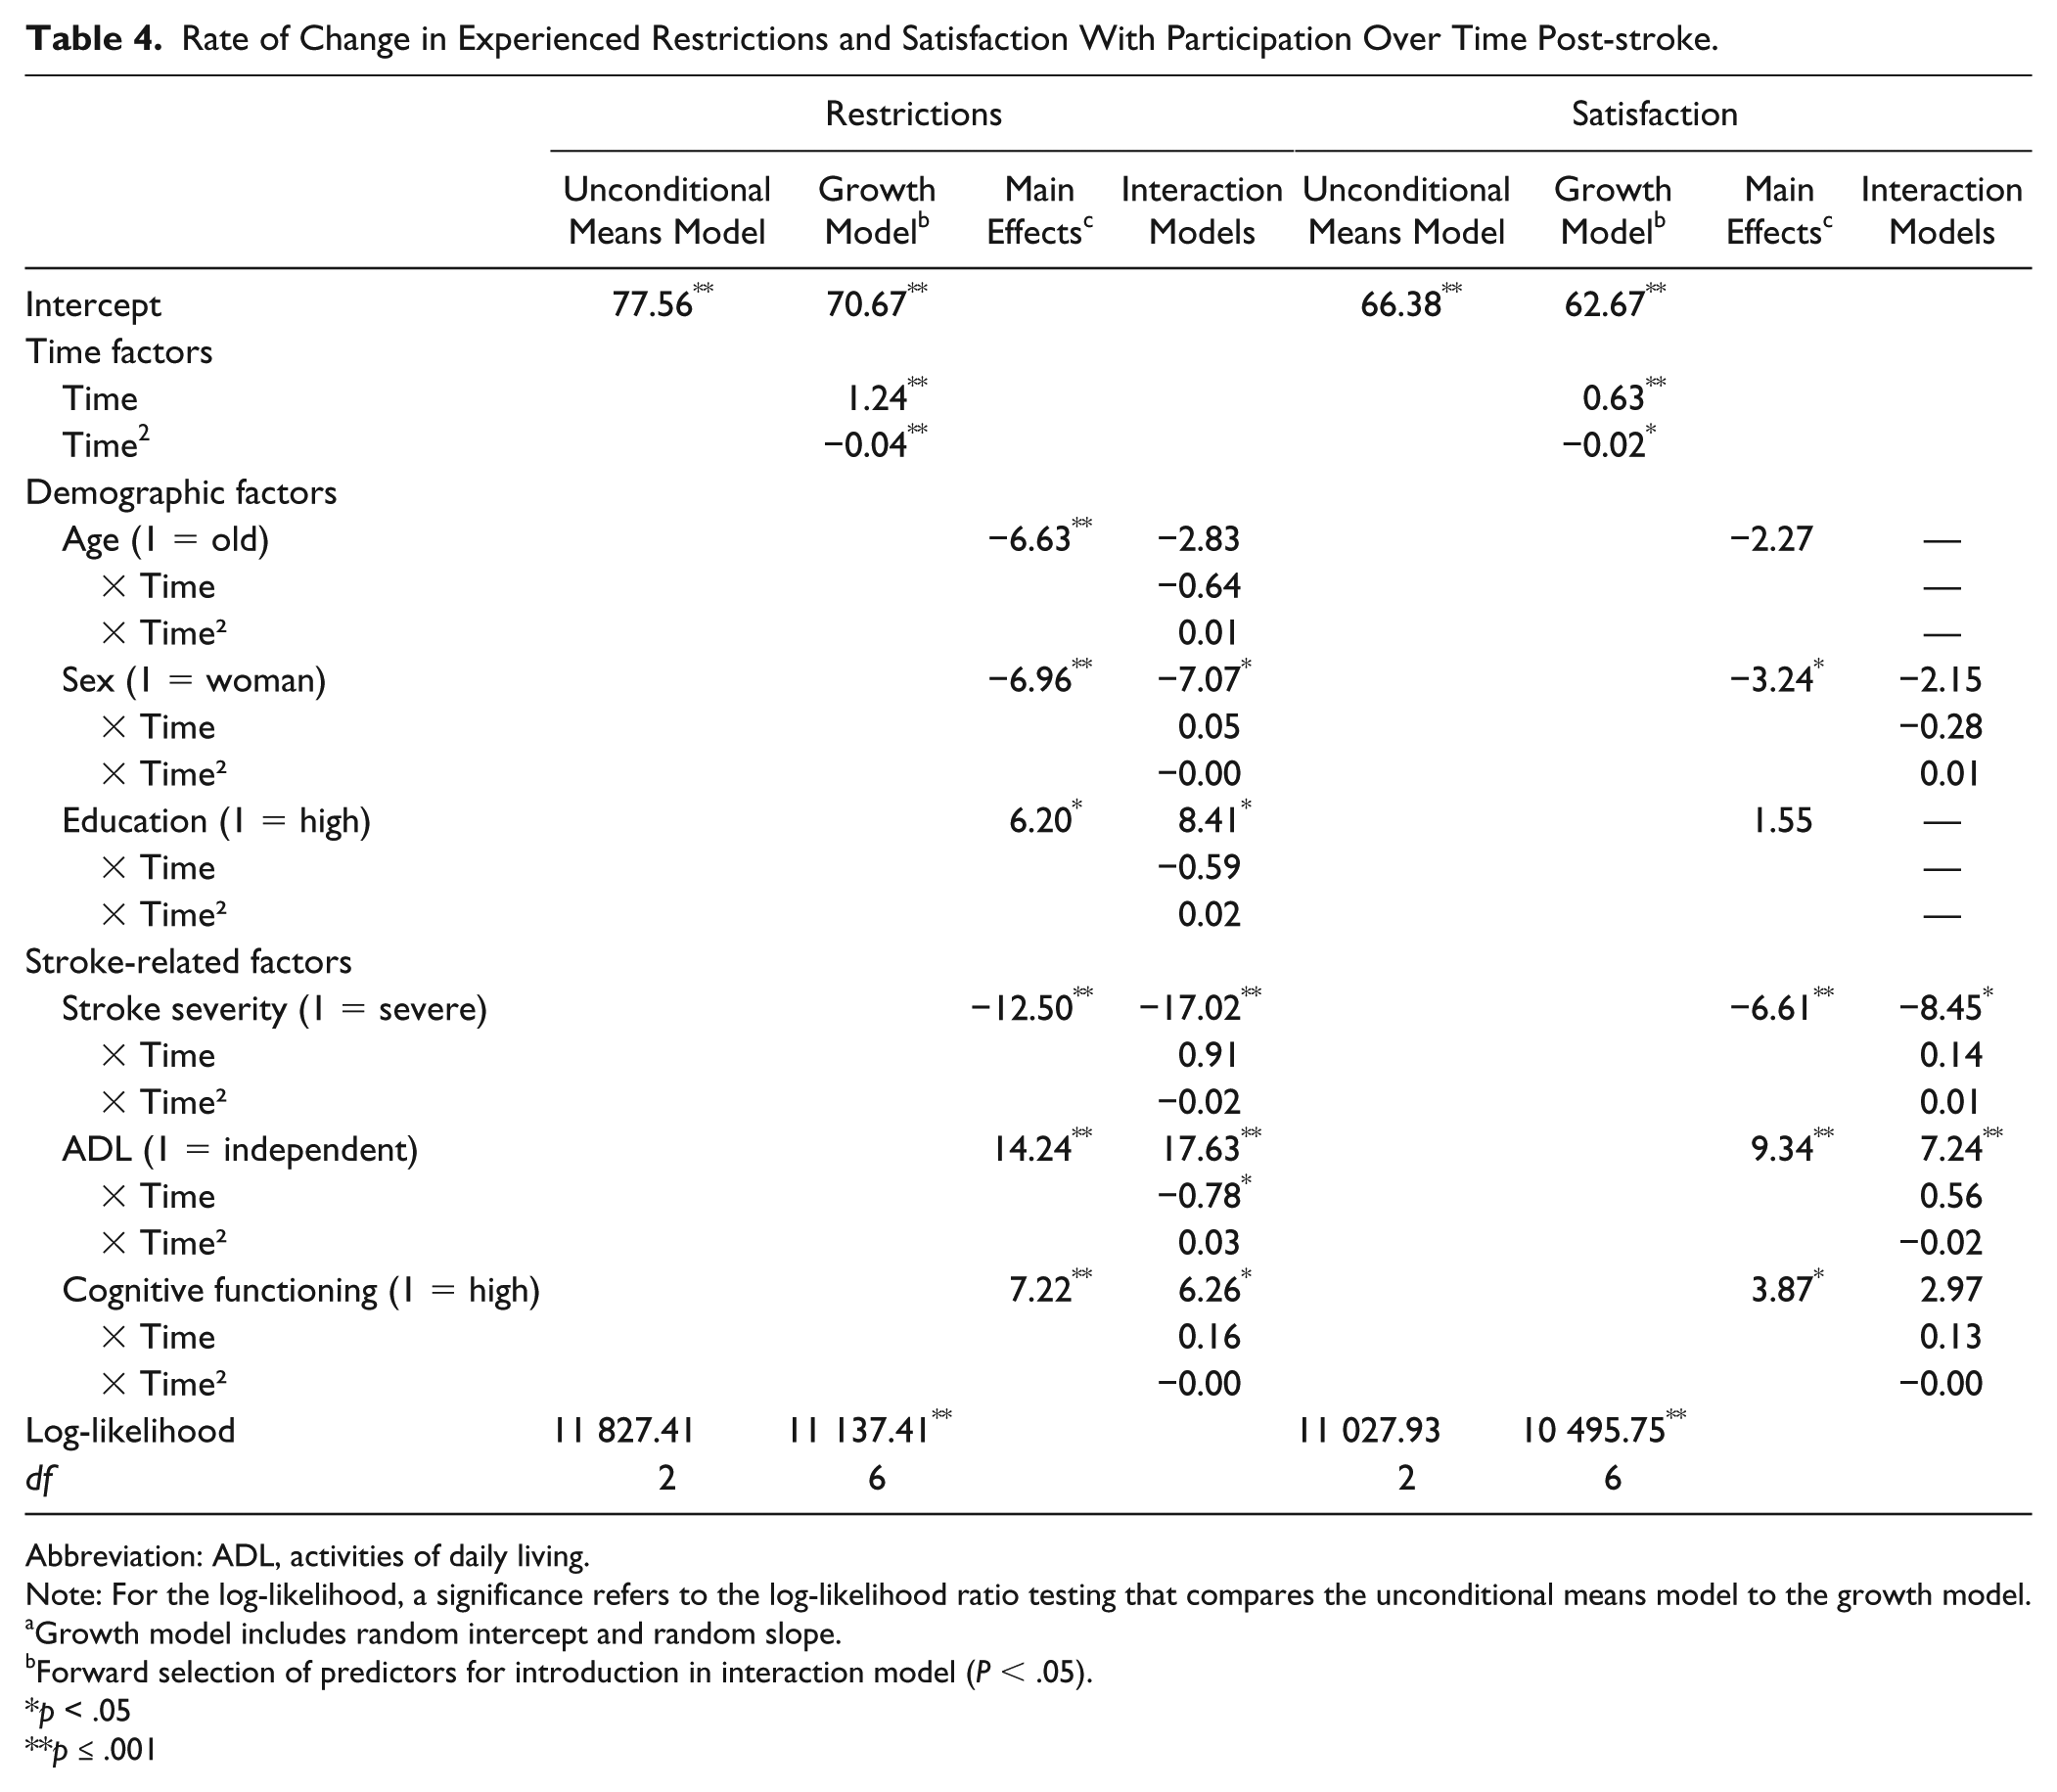
Abbreviation: ADL, activities of daily living.
Note: For the log-likelihood, a significance refers to the log-likelihood ratio testing that compares the unconditional means model to the growth model.
Growth model includes random intercept and random slope.
Forward selection of predictors for introduction in interaction model (P < .05).
p < .05
p ≤ .001
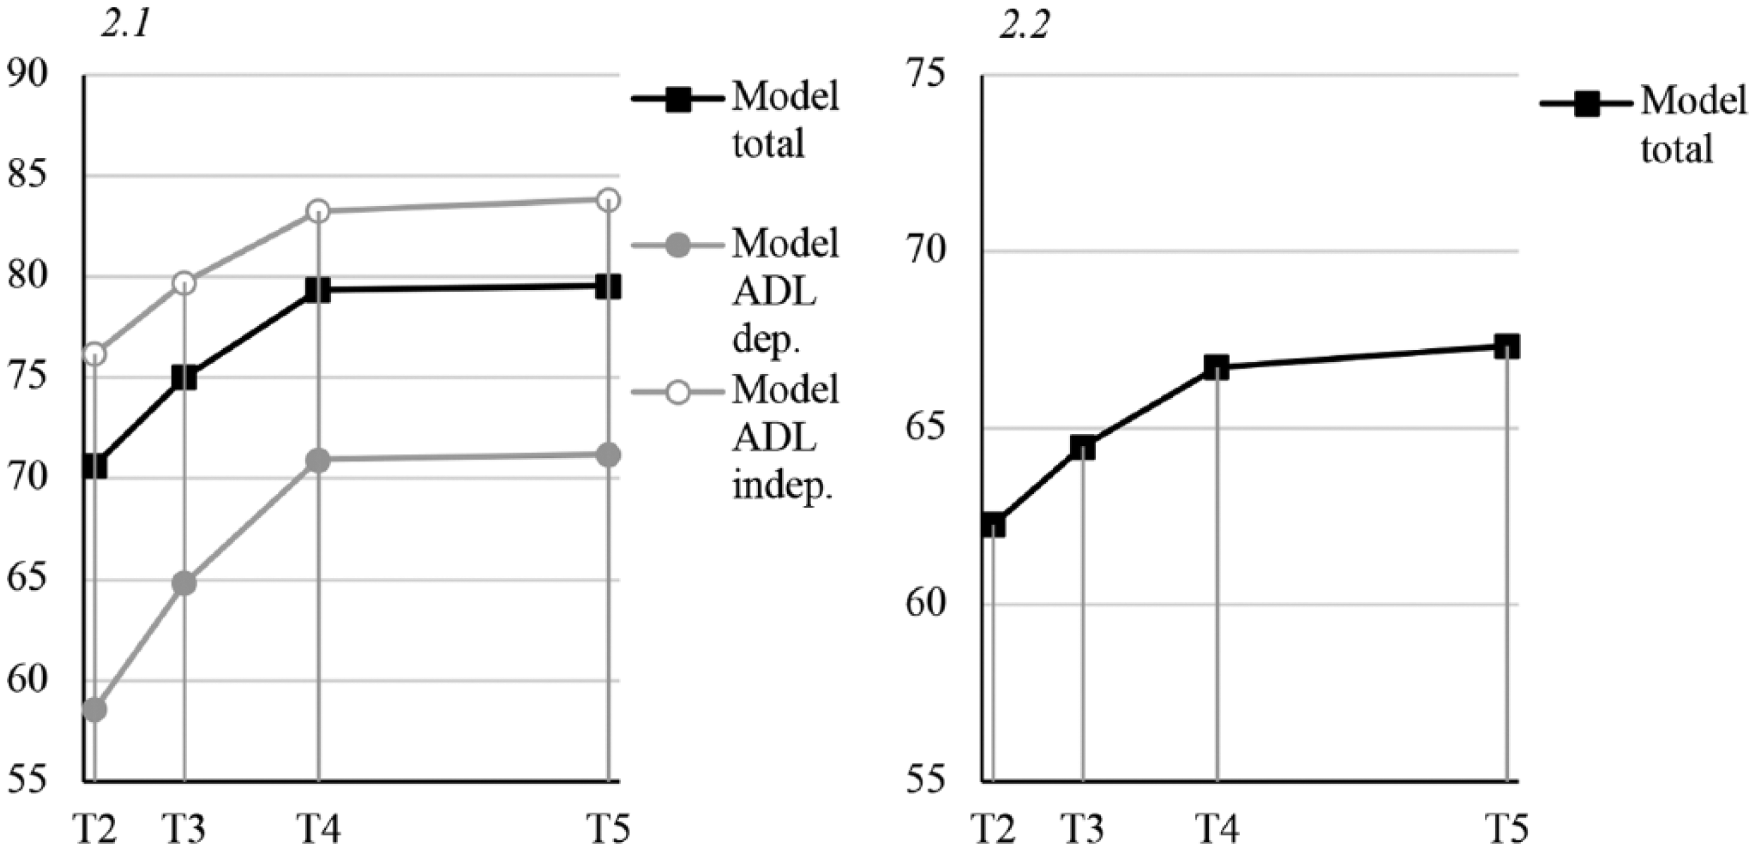
Section 2.1: experienced restrictions with participation over time in interaction, with independence in activities of daily life (ADL). Section 2.2: Satisfaction with participation over time. All scales originally range from 0 to 100. Higher scores on the restrictions scale are indicative of less-experienced restrictions.
Young age, male sex, and high level of education as well as lower stroke severity, ADL independence, and high cognitive functioning were significantly associated with less experienced restrictions with participation averaged over time (Table 4). A significant time by ADL independence interaction effect was found (Table 4). Persons with ADL dependence showed a significantly stronger decrease in experienced restrictions the first year post-stroke than those independent in ADL (Figure 2, section 2.1). No other significant interaction effects with time were found (Table 4).
Satisfaction
The best fitting model for the course of satisfaction with participation included a linear and quadratic time effect (Table 4). Again, the positive linear effect is indicative of the increase in satisfaction up to T4 and the negative quadratic effect of the smaller increase from T4 to T5 (Figure 2, section 2.2).
On average, male participants had significantly higher levels of satisfaction. In addition, lower stroke severity, high ADL independence, and high cognitive functioning were associated with higher levels of satisfaction. However, no significant interaction effects with the linear or quadratic effects of time were found (Table 4).
Discussion
In this prospective cohort study, the course of participation post-stroke and its associated factors were examined from stroke onset up to 2 years post-stroke. Results showed that total frequency of participation generally increased during the first year and then remained relatively stable for up to 2 years. Interestingly, hours spent on vocational activities increased, whereas the frequency of social and leisure activities decreased from stroke onset to 2 years post-stroke. The extent of experienced restrictions (or difficulties) with participation decreased especially during the first year and remained stable thereafter. Satisfaction with participation showed a small but significant increase throughout the 2-year time span.
Earlier studies found that participation post-stroke was decreased in comparison with premorbid levels16,24-26 and increased during the first 6 months. 48 A similar trend, an increase in the first 6 months followed by stability, has been observed for measures of health-related quality of life.39,49 Our study adds to this literature by showing an increase particularly in vocational activities and a decrease in experienced restrictions with participation during the entire first year post-stroke. Participation levels and experienced restrictions seemed to stabilize thereafter, as earlier observed for level of social activity. 30 In contrast, the frequency of leisure activities seemed to decrease, which might be a result of a trade-off with vocational activities. This might suggest that persons invest more time in vocational activities post-stroke because these might be considered activities that “need” to be done, possibly at the expense of the time available for social/leisure activities. It could also be a result of individuals not succeeding in maintaining high-demanding (physical) activities. 24 However, the frequencies per activity reported here suggest that the persons with stroke in this study succeeded relatively well in maintaining the more demanding physical activities (when looking at sports, going out, and day trips). Intriguingly, less-demanding activities such as receiving visitors and having contact via telephone or computer seem to decrease in frequency over time. The apparent decrease in leisure activities post-stroke should be examined more in depth in future research.
The demographic and stroke-related predictors were all, in a certain way, related to the outcome measures of participation. These results, therefore, confirm and extend the findings of previous cross-sectional studies on the influence of demographic14,29,31,37,38 and stroke-related16,26,29,37,50 factors on level of participation post-stroke. Particularly, older and lower-educated persons were at risk of less favorable outcomes in terms of participation over time, whereas women were less satisfied with participation. Furthermore, moderate/severe stroke, ADL dependence, and low cognitive functioning were predictive of a less favorable outcome in both objective and subjective levels of participation. In addition, individuals with low cognitive functioning also showed lower levels of leisure/social activities.
More important, we showed that persons who are older, lower educated, or dependent in ADL follow distinct courses and are particularly at risk of poor participation outcome. Those aged 68 years and older showed a relatively small decrease in vocational activities from prestroke to post-stroke, which could also be because they had already retired from work at this age. They additionally experienced significantly more restrictions with participation in contrast to their younger peers, which might be related to experiencing more anxiety symptoms because earlier studies have shown anxiety to be predictive of poor participation outcome in older individuals. 37 Advancing age in general, as an explanation for unfavorable participation outcome is less likely to play a role here, because the USER-P was modified in this study to ask specifically for restrictions caused by stroke. Despite similar premorbid levels, lower-educated persons showed a significantly smaller increase in time spent on vocational activities post-stroke than their higher-educated peers. Additionally, lower-educated persons stayed on lower levels of performing social/leisure activities. These insights into different trajectories across education levels specify the earlier observed association of educational level with frequency of participation.29,38 Furthermore, although ADL-dependent persons showed a stronger decrease in experienced restrictions with participation, they still experienced more restrictions at 2 years post-stroke than their ADL-independent peers. This might be a result of the relationship with stroke severity. 51 Moreover, it is likely that ADL-dependent persons show a steeper recovery curve because they have to recover more functions.
This study has a number of strengths and limitations. First of all, it provides a comprehensive insight into the course of participation by serial assessments over 2 years post-stroke in a large stroke sample. This allowed for well-powered longitudinal analyses. Importantly, it included the objective as well as the subjective aspects of participation. Specifically, we report not only on the activities that people with stroke participate in, but also on self-perceived restrictions and satisfaction in the engagement in those activities. Multilevel analyses were performed, and supplemental data on item level responses of the USER-P were presented in an attempt to provide the most comprehensive view of this time course. The generalizability to institutionalized patients, however, is expected to be limited because of the focus on community-dwelling patients. Furthermore, 93.1% of the cohort suffered from an ischemic stroke, which could limit the generalizability to patients with other types of stroke (eg, hemorrhages) and to the wider stroke population in which ischemic stroke represents 87%. 52 Nevertheless, the cohort is comparable on baseline characteristics with international—for example, Australian—cohorts of community-dwelling people with stroke. 35 Next, the USER-P has some limitations: frequency of activities can be difficult to estimate by patients; premorbid levels of participation are likely to be overestimated by patients; and finally, work-related factors and household activities are valued equally in Part A (as they add up), whereas they might be valued differently by the patients. Because this study had an exploratory character, we did not control for multiple testing, nor did we study in depth how the factors might interact. Although we identified several potential determinants of the course of participations, future research should be more hypothesis driven and include examinations of (shared) potential pathways and should focus on other related factors as well.
Implications
In this study, several factors were found that might help in identifying persons with stroke at early stages who are at risk of poor outcome in participation up to 2 years. This information (ie, demographics, NIHSS and BI score, cognitive functioning) is readily available from standard clinical assessments and could thus be used by clinicians without additional assessments. It might be of clinical interest that a relatively large proportion (17-46%) of individuals with stroke remain dissatisfied with participation in certain activities in the chronic phase. This suggests that they might not have adapted optimally to their experienced restrictions post-stroke. Emotional factors and personal factors should be taken into account in future research because earlier research showed that anxiety, depression, and fatigue are related to participation as well as life satisfaction.31,37,40 Additionally, from earlier studies, we know that a passive coping style is related to lower health-related quality of life. 53
Conclusion
In conclusion, our findings suggest that the course of participation is particularly defined by the first year post-stroke because most changes occur during this period. Furthermore, older, lower-educated, and ADL-dependent persons with stroke are particularly at risk of an unfavorable course of participation over time. Clinicians should take these findings into account during regular follow-up consults. Future research could focus on the role of emotional factors or the adaptation process in the identification of these at-risk persons with stroke.
Footnotes
Appendix
| T0 | T2 | T3 | T4 | T5 | ||||||
|---|---|---|---|---|---|---|---|---|---|---|
| n | Frequency (%) | n | Frequency (%) | n | Frequency (%) | n | Frequency (%) | n | Frequency (%) | |
| Part A: Vocational activities | ||||||||||
| Paid work | 376 | 341 | 340 | 312 | 308 | |||||
| None at all | 62.0 | 80.6 | 75.9 | 69.6 | 71.8 | |||||
| 1-24 Hours | 10.6 | 10.0 | 14.7 | 14.4 | 9.4 | |||||
| ⩾25 Hours | 27.4 | 9.4 | 9.4 | 16.0 | 18.8 | |||||
| Unpaid work | 378 | 340 | 340 | 309 | 310 | |||||
| None at all | 68.8 | 81.2 | 77.9 | 75.7 | 71.6 | |||||
| 1-24 Hours | 29.4 | 17.9 | 21.5 | 23.3 | 28.1 | |||||
| ⩾25 Hours | 1.9 | .9 | .6 | 1.0 | .3 | |||||
| Education | 373 | 341 | 339 | 306 | 306 | |||||
| None at all | 93.6 | 99.1 | 97.1 | 95.8 | 94.8 | |||||
| 1-24 Hours | 5.6 | .9 | 2.7 | 3.6 | 5.2 | |||||
| ⩾25 Hours | .8 | .0 | .3 | .7 | .0 | |||||
| Household activities | 374 | 341 | 340 | 323 | 314 | |||||
| None at all | 4.5 | 12.3 | 9.7 | 11.1 | 8.9 | |||||
| 1-24 Hours | 79.1 | 79.5 | 83.5 | 81.4 | 80.9 | |||||
| ⩾25 Hours | 16.4 | 8.2 | 6.8 | 7.4 | 10.2 | |||||
| Part B: Leisure and social activities | ||||||||||
| Sports/physical exercise | 374 | 342 | 340 | 324 | 314 | |||||
| Not at all | 22.5 | 25.1 | 17.1 | 19.4 | 21.0 | |||||
| 1-10 Times | 46.3 | 44.2 | 47.4 | 53.7 | 51.0 | |||||
| ⩾11 Times | 31.3 | 30.7 | 35.6 | 26.9 | 28.0 | |||||
| Going out | 375 | 342 | 339 | 321 | 314 | |||||
| Not at all | 34.1 | 48.2 | 39.5 | 37.7 | 35.7 | |||||
| 1-10 Times | 64.3 | 50.6 | 59.3 | 60.4 | 62.7 | |||||
| ⩾11 Times | 1.6 | 1.2 | 1.2 | 1.9 | 1.6 | |||||
| Day trips | 375 | 342 | 338 | 323 | 313 | |||||
| Not at all | 21.9 | 37.7 | 26.0 | 25.1 | 26.8 | |||||
| 1-10 Times | 70.9 | 56.7 | 67.2 | 69.3 | 66.8 | |||||
| ⩾11 Times | 7.2 | 5.6 | 6.8 | 5.6 | 6.4 | |||||
| Leisure activities | 375 | 342 | 340 | 323 | 311 | |||||
| Not at all | 12.0 | 16.4 | 12.4 | 10.2 | 12.2 | |||||
| 1-10 Times | 40.0 | 42.1 | 45.3 | 48.6 | 44.1 | |||||
| ⩾11 Times | 48.0 | 41.5 | 42.4 | 41.2 | 43.7 | |||||
| Visiting family or friends | 374 | 342 | 335 | 321 | 310 | |||||
| Not at all | 7.0 | 18.1 | 10.4 | 10.0 | 9.4 | |||||
| 1-10 Times | 79.9 | 76.0 | 80.0 | 81.0 | 82.9 | |||||
| ⩾11 Times | 13.1 | 5.8 | 9.6 | 9.0 | 7.7 | |||||
| Receiving visitors | 375 | 341 | 340 | 322 | 312 | |||||
| Not at all | 4.0 | 4.7 | 6.2 | 5.9 | 9.3 | |||||
| 1-10 Times | 77.6 | 68.9 | 78.8 | 81.1 | 77.2 | |||||
| ⩾11 Times | 18.4 | 26.4 | 15.0 | 13.0 | 13.5 | |||||
| Contact via PC/telephone | 375 | 342 | 340 | 324 | 315 | |||||
| Not at all | 5.3 | 7.6 | 8.5 | 6.2 | 13.3 | |||||
| 1-10 Times | 44.0 | 43.6 | 52.4 | 54.9 | 52.7 | |||||
| ⩾11 Times | 50.7 | 48.8 | 39.1 | 38.9 | 34.0 | |||||
| Restrictions scale b | ||||||||||
| T0 | T2 | T3 | T4 | T5 | ||||||
| n | Restrictions (%) | n | Restrictions (%) | n | Restrictions (%) | n | Restrictions (%) | n | Restrictions (%) | |
| (Un)paid work/education | — | — | 127 | 80.3 | 126 | 65.9 | 121 | 55.4 | 120 | 47.5 |
| Household activities | — | — | 306 | 63.7 | 323 | 55.4 | 297 | 53.2 | 291 | 49.5 |
| Outside activities | — | — | 313 | 58.8 | 321 | 47.7 | 303 | 40.6 | 296 | 39.2 |
| Sports/physical exercise | — | — | 283 | 62.2 | 296 | 57.1 | 276 | 55.8 | 274 | 48.5 |
| Going out | — | — | 221 | 57.5 | 254 | 52.0 | 239 | 44.8 | 247 | 43.7 |
| Day trips | — | — | 256 | 59.8 | 285 | 51.9 | 270 | 51.1 | 266 | 48.5 |
| Leisure activities | — | — | 303 | 36.0 | 302 | 33.4 | 295 | 29.5 | 284 | 25.0 |
| Relationship with partner | — | — | 224 | 23.2 | 237 | 31.2 | 221 | 35.3 | 206 | 32.5 |
| Visiting friends | — | — | 314 | 52.9 | 319 | 45.5 | 298 | 39.3 | 301 | 36.5 |
| Receiving visitors | — | — | 329 | 24.0 | 327 | 27.2 | 300 | 22.0 | 295 | 21.0 |
| Contact via PC/telephone | — | — | 319 | 16.9 | 320 | 19.4 | 298 | 19.8 | 283 | 19.1 |
| Satisfaction scale | ||||||||||
| T0 | T2 | T3 | T4 | T5 | ||||||
| n | Not satisfied (%) | n | Not satisfied (%) | n | Not satisfied (%) | n | Not satisfied (%) | n | Not satisfied (%) | |
| (Un)paid work/education b | — | — | 126 | 53.2 | 124 | 37.1 | 126 | 31.0 | 129 | 30.2 |
| Household activities | — | — | 334 | 46.7 | 334 | 40.1 | 310 | 38.1 | 297 | 34.3 |
| Outside activities | — | — | 336 | 52.1 | 337 | 41.8 | 313 | 36.1 | 399 | 34.0 |
| Sports/physical exercise | — | — | 335 | 58.5 | 335 | 50.4 | 307 | 46.9 | 291 | 48.1 |
| Going out | — | — | 333 | 57.4 | 332 | 50.9 | 304 | 46.4 | 290 | 46.2 |
| Day trips | — | — | 337 | 58.2 | 335 | 51.9 | 307 | 45.9 | 298 | 44.0 |
| Leisure activities | — | — | 340 | 33.5 | 335 | 29.0 | 313 | 30.4 | 301 | 24.3 |
| Relationship partner b | — | — | 237 | 13.9 | 238 | 13.0 | 226 | 16.4 | 222 | 17.6 |
| Relationship with family | — | — | 338 | 13.6 | 335 | 15.2 | 314 | 14.0 | 304 | 17.8 |
| Contact with friends | — | — | 341 | 15.8 | 336 | 18.5 | 317 | 20.2 | 305 | 21.3 |
Abbreviations: PC, personal computer; USER-P, Utrecht Scale for Evaluation of Rehabilitation–Participation.
Frequencies displayed are valid percentages. Restrictions items are dichotomized as follows: 0 (not possible to perform) to 2 (able to perform but with difficulty) = restrictions experienced; 3 (performed without difficulty) = no restrictions experienced. Satisfaction items are dichotomized as follows: 0 (very dissatisfied) to 2 (neutral) = not satisfied; 3 (satisfied) and 4 (very satisfied) = satisfied.
The sample (n) for which the activity is applicable is displayed (persons for whom the activity is not applicable are not displayed).
Declaration of Conflicting Interests
The authors declared no potential conflicts of interest with respect to the research, authorship, and/or publication of this article.
Funding
The authors disclosed receipt of the following financial support for the research, authorship, and/or publication of this article: The Restore4stroke cohort study was supported by the VSBfonds (Grant Number: 89000004) and coordinated by ZonMw (Dutch organization for Health Research and Development). This collaborative research project was supported by the James S. McDonnell Foundation 21st Century Science Initiative in Cognitive Rehabilitation–Collaborative Award (#220020413).