
Abstract
Background. Humans use voluntary eye movements to actively gather visual information during many activities of daily living, such as driving, walking, and preparing meals. Most stroke survivors have difficulties performing these functional motor tasks, and we recently demonstrated that stroke survivors who require many saccades (rapid eye movements) to plan reaching movements exhibit poor motor performance. However, the nature of this relationship remains unclear. Objective. Here we investigate if saccades interfere with speed and smoothness of reaching movements in stroke survivors, and if excessive saccades are associated with difficulties performing functional tasks. Methods. We used a robotic device and eye tracking to examine reaching and saccades in stroke survivors and age-matched controls who performed the Trail Making Test, a visuomotor task that uses organized patterns of saccades to plan reaching movements. We also used the Stroke Impact Scale to examine difficulties performing functional tasks. Results. Compared with controls, stroke survivors made many saccades during ongoing reaching movements, and most of these saccades closely preceded transient decreases in reaching speed. We also found that the number of saccades that stroke survivors made during ongoing reaching movements was strongly associated with slower reaching speed, decreased reaching smoothness, and greater difficulty performing functional tasks. Conclusions. Our findings indicate that poststroke interference between eye and limb movements may contribute to difficulties performing functional tasks. This suggests that interventions aimed at treating impaired organization of eye movements may improve functional recovery after stroke.
Keywords
Introduction
In daily life, we make thousands of voluntary eye movements to actively gather visual information from our environment. This “visual search” gathers information needed for normal performance of limb and body movements during functional activities like driving,1,2 walking,3,4 and preparing meals.5,6 Most stroke survivors experience chronic difficulties performing functional activities,7,8 and we often assume that motor impairments underlie these difficulties. However, impaired visual search may also play a role. 9 We recently studied visual search in stroke survivors who performed the Trail Making Test (TMT), 10 a visuomotor task in which visual search guides reaching movements. 11 TMT is also a predictor of on-road driving performance that is used to determine the need for on-road evaluations after stroke.12,13 We showed that many stroke survivors (without visual field defects or spatial neglect) perform an abnormally large number of saccades (rapid eye movements) during TMT, and these excessive saccades are predictive of diminished task performance. 10 While this suggests that impaired visual search may disrupt visuomotor performance, previous studies have not examined the nature of this relationship.
Eye and limb movements are highly coupled during visuomotor skills like reaching and driving.14-16 Given that saccades interact with planning and control of reaching, 17 we predicted that poststroke increases in saccades during visual search would interfere with planning and control of reaching movements. Our first objective was to test if poststroke increases in saccades used for visual search are predictive of decreases in reaching speed and smoothness.18-20 To address this objective, we examined the relationship between saccades and reaching in stroke survivors and age-matched controls who performed TMT. Our first hypothesis was that stroke survivors would perform more saccades than controls, including more during the reaching phases of TMT. Our second hypothesis was that saccades during the reaching phases would occur closely before rather than closely after local peaks in hand speed during reaching. Our third hypothesis was that increases in saccades made during the reaching phases would be strongly associated with decreases in reaching speed and smoothness. Our final hypothesis was that participants would make more saccades and exhibit greater decreases in reaching speed and smoothness during TMT-B than TMT-A because of the increased cognitive demands of TMT-B (see Materials and Methods section).
Given that most stroke survivors with little or no motor impairment experience chronic difficulties performing functional activities, 21 we also predicted that poststroke increases in saccades during visual search would interfere with functional motor tasks that rely on visual search. Our second objective was to test whether post-stroke increases in saccades during visual search are predictive of greater difficulties performing functional tasks involving hand function and mobility. To address this objective, our stroke survivors completed the hand function and mobility subsections of the Stroke Impact Scale (SIS), a patient-reported measure of functional difficulties. We hypothesized that increases in saccades during reaching phases of TMT would be associated with greater difficulties performing tasks involving hand function and mobility.
Materials and Methods
Participants
We recruited 16 stroke survivors and 16 age-matched controls to participate in the study. They completed a clinical history questionnaire and standardized assessments of handedness (modified Edinburgh Handedness Inventory 22 ), manual dexterity (Box and Block test 23 ), visual acuity (Snellen chart), visual field defects (confrontation testing 24 ), and cognitive impairment (Visual Cognition Assessment, a visuospatial analog of the Montreal Cognitive Assessment 25 that assesses the visuospatial/executive, memory, attention, and orientation components using nonverbal responses). Stroke survivors also completed standardized assessments of functional difficulties (SIS Hand Function and Mobility subsections 26 ), wrist and elbow spasticity (Modified Ashworth Scale 27 ), somatosensory impairments (modified Nottingham Sensory Assessment 28 ), and visuospatial neglect (Landmark Line Bisection Task 29 and Ota Cancellation Task 30 ). All participants provided informed consent before enrolling in the study, which was approved by the Institutional Review Board of the University of South Carolina.
We included stroke survivors who reported (a) a single, unilateral stroke of the left middle cerebral artery territory at least 6 months before testing and (b) a chronic difficulty performing at least one task involving hand function or mobility (any score <5 on SIS). Stroke survivors and controls were excluded if they had (a) any history of a central or peripheral neurological disorder other than stroke, (b) an ongoing musculoskeletal problem involving their preferred upper extremity, (c) an uncorrected visual impairment (Snellen chart, confrontation testing), or (d) a cognitive impairment that prevented the ability to follow of simple instructions (score <12 on Visual Cognition Assessment). Stroke survivors were also excluded if they had moderate to severe spasticity of their preferred upper extremity (score ⩾2 on Modified Ashworth Scale) or evidence of visuospatial neglect (>10% deviation on line bisection, <90% correct on cancellation). The preferred upper extremity was defined as the preferred hand poststroke using the Edinburgh Handedness Inventory.
Apparatus and Task
Experiments were performed on an upper-limb robot (KINARM Endpoint Lab, BKIN Technologies, Kingston, Ontario, Canada) with integrated eye tracking (SR Eyelink 1000, SR Research, Ottawa, Ontario, Canada) and an augmented reality workspace (Figure 1A). 31 Participants grasped a near-frictionless manipulanda that allowed them to make hand movements in the horizontal plane. Hand kinematics were sampled and recorded at 1000 Hz. The SR Eyelink 1000 Remote is a camera-based, monocular system that remotely tracks eye and head (gaze) movements with a maximum sampling frequency of 500 Hz and accuracy of 0.5°. This eye tracker allows freedom to make small head and trunk movements. Gaze position was calibrated within the robot’s horizontal workspace using proprietary algorithms (BKIN Technologies). Both the KINARM and SR Eyelink system had 16-bit resolution analog-to-digital conversion. Eye movements could be accurately monitored within a 50 cm by 50 cm area located between 10 cm and 60 cm in front of participants and between ±25 cm laterally from the midline. An inverted monitor created the augmented reality environment by projecting visual targets at 60 Hz through a semitransparent mirror into the same horizontal plane as the hands.
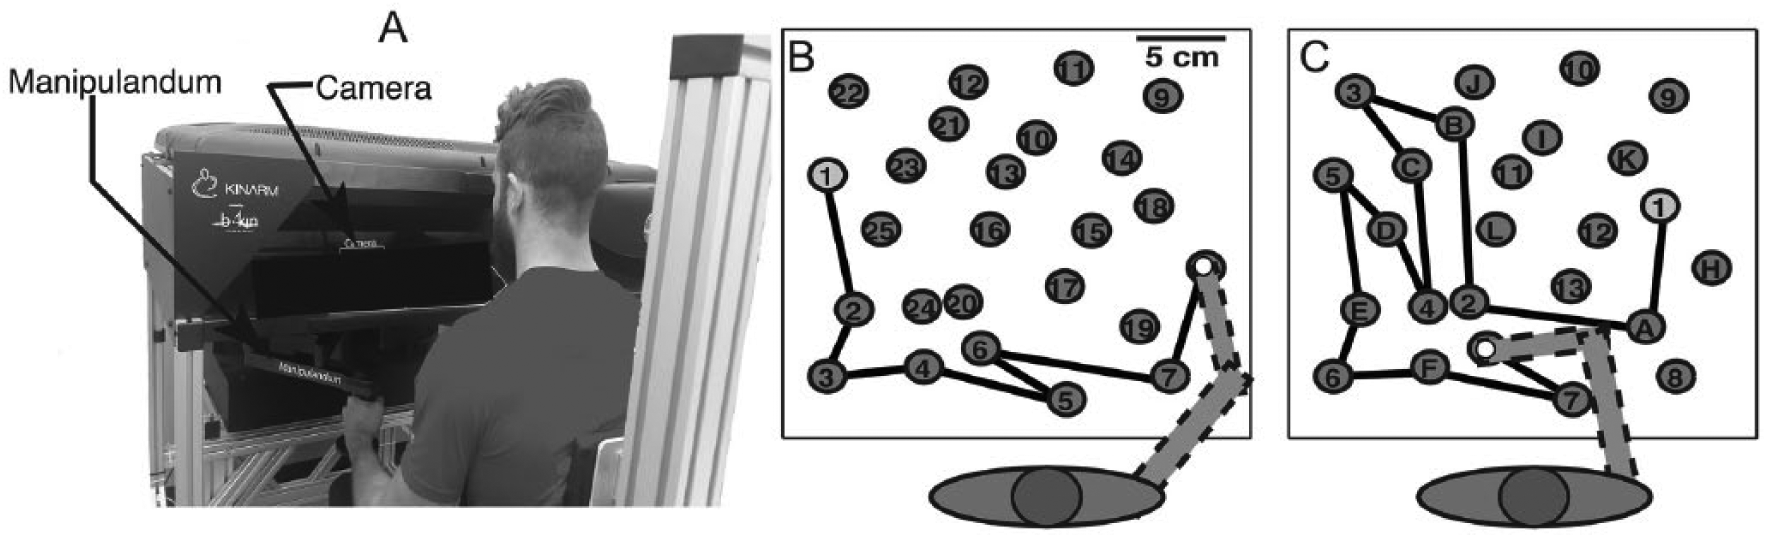
Experimental setup. (A) Participants grasp the robot handle while sitting in the chair. Targets are displayed in the same horizontal plane as the hands. The remote eye tracker is located at the back of the workspace. (B, C) Top view of the virtual environment showing the target workspace for TMT-A (B) and TMT-B (C). Hand location is displayed as a white circle and black lines show previously traversed targets; both are visible to the participant. The arm is drawn for illustrative purposes and was not visible to participants.
Participants were instructed to complete TMT as quickly as possible by performing reaching movements to targets (1.0 cm radius) in the horizontal plane. 10 In the numeric subtest (TMT-A), participants drew lines connecting the first 25 natural numbers (1, 2, 3, . . ., 25) (Figure 1B). In the more cognitively challenging alphanumeric subtest (TMT-B), participants drew lines alternating between the first 13 natural numbers and first 12 Roman letters (1, A, 2, B, . . ., 13) (Figure 1C). Before completing each variant, participants completed sequences of 5 practice targets. If a participant moved their hand to an incorrect target, the previous target turned red and participants were instructed to move their hand back to the previous correct target before continuing. The robot neither assisted nor resisted hand movements. The arms and hands were occluded from vision using an opaque shield and fabric cover. Visual feedback of hand position was provided with a small white circle (0.5 cm radius). Controls used their dominant hand and stroke survivors used their preferred hand (11 left, 5 right). Targets remained visible when the participants’ hand moved over them.
Participants completed only one trial of TMT-A and TMT-B. This controlled for known practice effects32-34 that would have made it difficult to determine if differences in task performance between stroke survivors and controls resulted from differences in learning. The trajectory of the completed portion of the test remained on the display for the entire duration of the trial (black lines in Figure 1B and C).
Eye Movement Processing
Eye movement data were processed using algorithms that we recently developed. 31 Data from the robot and gaze tracking systems were low pass filtered at 20 Hz. Gaze data were then preprocessed to remove blink artifacts, spikes caused by incorrect detection of corneal reflection, and outliers when gaze left the workspace. We then used our novel geometric method to transform gaze position in the horizontal workspace into rotational kinematics of the eye. We finally used custom algorithms that incorporate adaptive velocity and acceleration thresholds to identify saccades and fixations.
Robotic and Gaze Tracking Measures
Task Performance
We used Total Time and Number of Errors to examine overall task performance. We also used the hand kinematics from the robot to compute Mean Reach Time (average time the hand moved between targets) and Mean Dwell Time (average time the hand was located on targets). The hand was considered “on target” when any part of the hand feedback (0.5 cm radius) overlapped a target (1.0 cm radius).10,19
Visual Search
To examine the number of saccades during reaching phases, we computed Saccades per Reach (average number of saccades when the hand moved between targets) and Saccades per Dwell (average number of saccades when the hand was located on targets). To examine if saccades during reaching closely preceded or followed local peaks in reaching speed, we computed Saccades before Hand Peaks (percent of overall saccades initiated 25 to 400 ms before local peaks in hand speed) and Saccades after Hand Peaks (percent of overall saccades initiated 25-400 ms after local peaks in hand speed). We chose the 25 to 400 ms time window because it incorporated the range of reaction times observed in stroke survivors and controls during reaching. 19
Reaching Control
To examine relationships between saccades and reaching control, we computed two measures of reaching control. Reaching speed was measured by computing Mean Reach Speed (average distance between targets divided by average Reach Time). This was a reasonable estimate of reaching speed because average distance between targets was approximately constant. Reaching smoothness was measured by computing Speed Peaks per Reach (number of local hand speed peaks during reaching movements), where higher values indicate decreased smoothness.
Functional Measures
To examine the relationship between saccades during reaching and functional difficulties, we used the SIS Hand Function and Mobility subsections to compute a composite SIS score (%). Each subsection contributed equally to the SIS score. While the SIS does not examine reaching tasks, we used the SIS because of its sensitivity to difficulties performing functional motor tasks. 21 We chose the hand function subscale because it examines functional tasks that use vision to guide hand movements, including coordinated movements of both hands (eg, “tie a shoe lace,” “open a can or jar,” “pick up a dime”). We included the mobility subscale because it examines functional tasks (“walk without losing balance,” “walk one block,” “walk fast,” and “climb one or several flights of stairs”) that use vision to successfully navigate real-world environments. Hand function and mobility scores are also reported as percentages of the maximum attainable score.
Statistics
We examined differences between stroke survivors and controls with chi-square tests (sex, handedness) and Kolmogorov-Smirnov tests (age, Box and Block test, Visual Cognitive Assessment). We used Tukey’s quartile method (1.5 multiplier) to remove outliers from each measure and log transformed all measures that deviated from homoscedasticity or normality. 35 Fewer than 5% of all data points were outliers (similar for both groups). We performed a 2 × 2 linear mixed effects analysis to examine relationships between Group (Stroke, Controls) and Task (TMT-A, TMT-B). We modeled Group and Task (with interaction term) as fixed effects and participants and their intercepts as random effects nested within Group. We obtained P values from likelihood ratio tests of the full model with the effect in question against the model without the effect in question. We used linear regression to examine relationships between measures. The level of significance was set at α = .05 and Tukey’s correction was used to correct for multiple comparisons. Statistical tests were performed using lme4 in the R software package. 36
Results
Participant Characteristics
We studied 16 stroke survivors (age 62 ± 8 years) and 16 age-matched controls (age 60 ± 8 years). To detect difference in Total Time to complete TMT-A between stroke survivors and controls, we computed the effect size in terms of Cohen’s d based on the results from our previous study. 10 Based on the effect size (>1), the computed sample size of 16 provided a power level greater than 0.8 at a significance level of .05. Demographic and clinical information are summarized in Table 1. Participant age and Visual Cognition Assessment scores were similar between stroke survivors and controls. Although 5 stroke survivors preferred to use their right hand and 11 preferred to use their left hand, all 16 had clinical screening questionnaires and clinical assessments that were consistent with a stroke of the left middle cerebral artery (confirmed in 12 from neuroimaging). One stroke survivor was inadvertently included in the study despite reporting no chronic difficulties performing any of the functional activities on the Hand Function or Mobility subsections of the SIS. We retained this participant in our final analysis because this participant was not an outlier on any of the measures included in our study. Only 1 stroke survivor exhibited a score less than 17 on the modified Nottingham Sensory Assessment.
Participant Demographics and Clinical Information. a
Values indicate median [min, max]. SIS scores show the percent of the maximal attainable score (n = 16). Box and Block Test scores show the dominant hand of controls (n = 16) and preferred hand of stroke survivors (n = 16). Scores on the Modified Ashworth Scale show the number of participants with a maximal score of [0, 1] at the elbow or wrist of the preferred hand (n = 15). Scores out of 17 on the modified Nottingham Sensory Assessment are shown for the preferred hand (n = 12). Measures of neglect show scores on the Landmark line bisection task (n = 14) and Ota cancellation task (n = 16). Scores on the Visual Cognitive Assessment are out of 20, where values of 12 to 16 indicate mild cognitive impairment (n = 15).
Influence of Preferred Hand
We tested for differences in task performance between stroke survivors who preferred using their right (n = 5) or left (n = 11) hand. We did not find a significant difference for Total Time or Number of Errors, thus we grouped the stroke survivors together for all remaining analyses.
Features of Task Performance
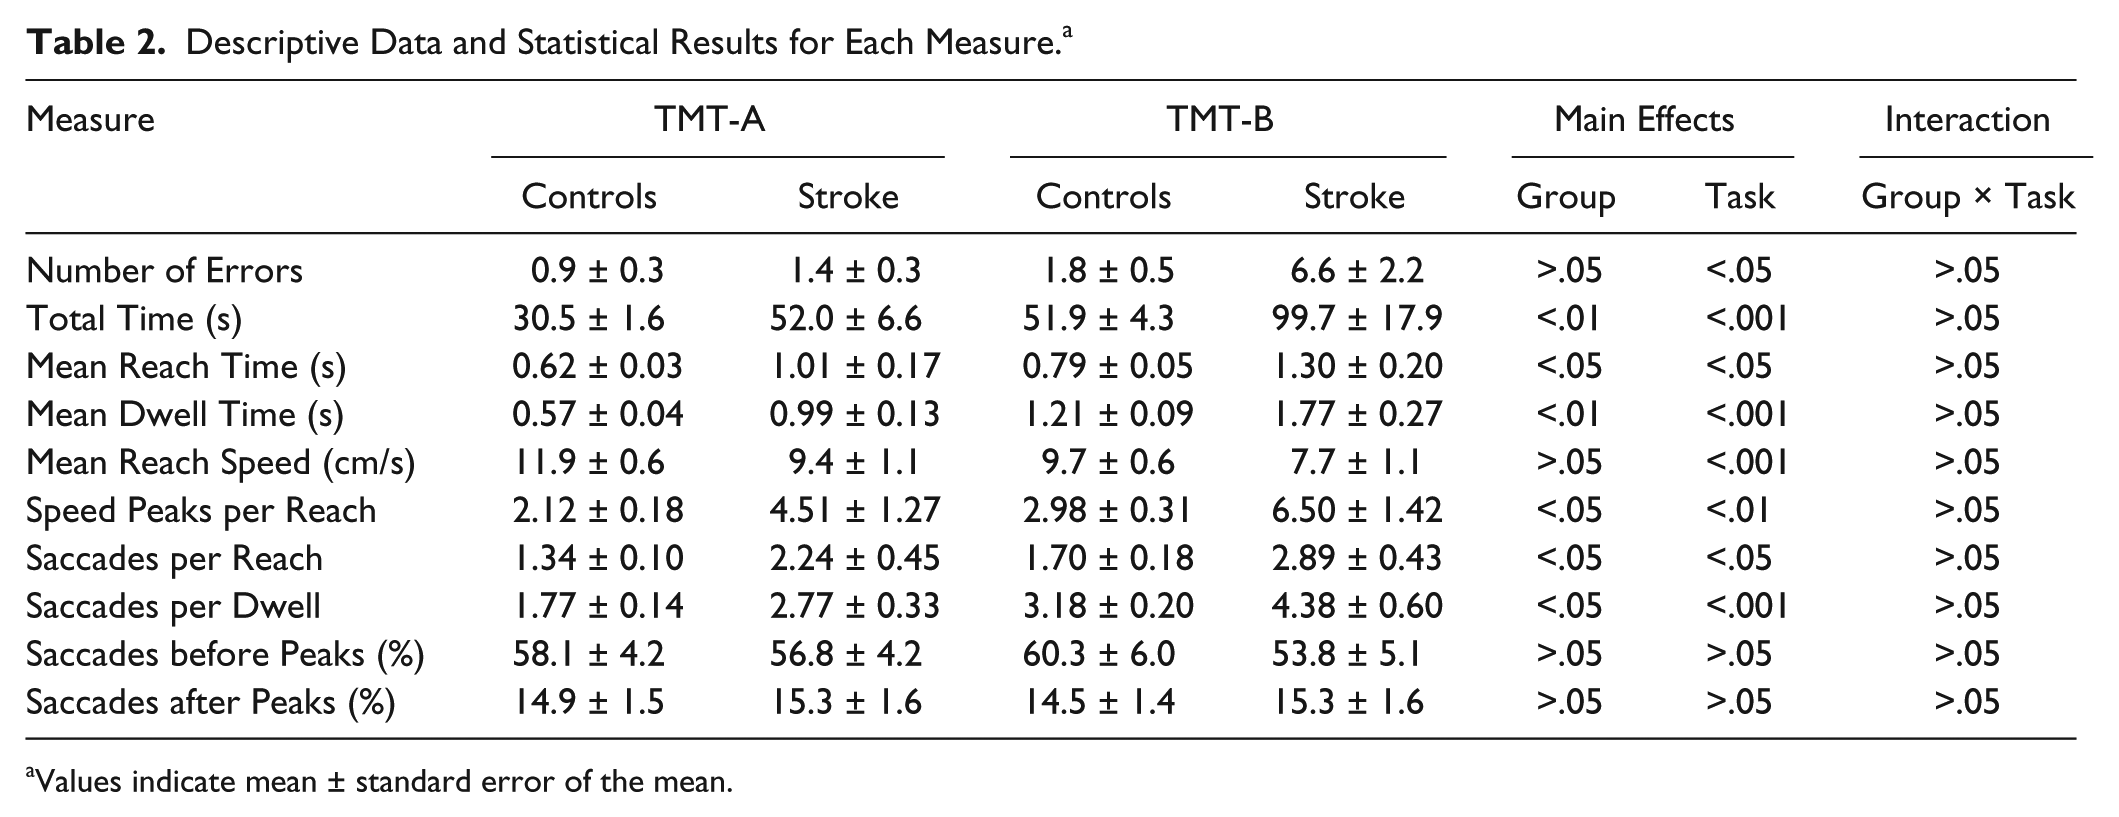
Table 2 shows the descriptive data and statistical results of our measures of task performance. On average, Total Times of stroke survivors were significantly longer than controls (51% longer in TMT-A; 92% longer in TMT-B). There was not a significant difference in Number of Errors made by the 2 groups, but we observed a significantly greater Number of Errors in TMT-B than TMT-A. Mean Reach Times were significantly longer in stroke survivors than controls (63% longer in TMT-A; 65% longer in TMT-B) and were significantly longer in TMT-B than TMT-A (29% longer in stroke survivors; 27% longer in controls). We observed similar statistical effects for Mean Dwell Time.
Descriptive Data and Statistical Results for Each Measure. a
Values indicate mean ± standard error of the mean.
Features of Reaching Control
Reaching movements were typically slower and less smooth in stroke survivors than controls (see Figure 2 and Table 2). Mean Reach Speed was significantly slower in stroke survivors than controls (20% slower in TMT-A; 21% slower in TMT-B) and was significantly slower in TMT-B than TMT-A (18% slower in both stroke survivors and controls). Stroke survivors produced significantly more Speed Peaks per Reach than controls (113% more in TMT-A; 117% more in TMT-B) and we found more Speed Peaks per Reach in TMT-B than TMT-A (44% more in stroke survivors; 42% more in controls).
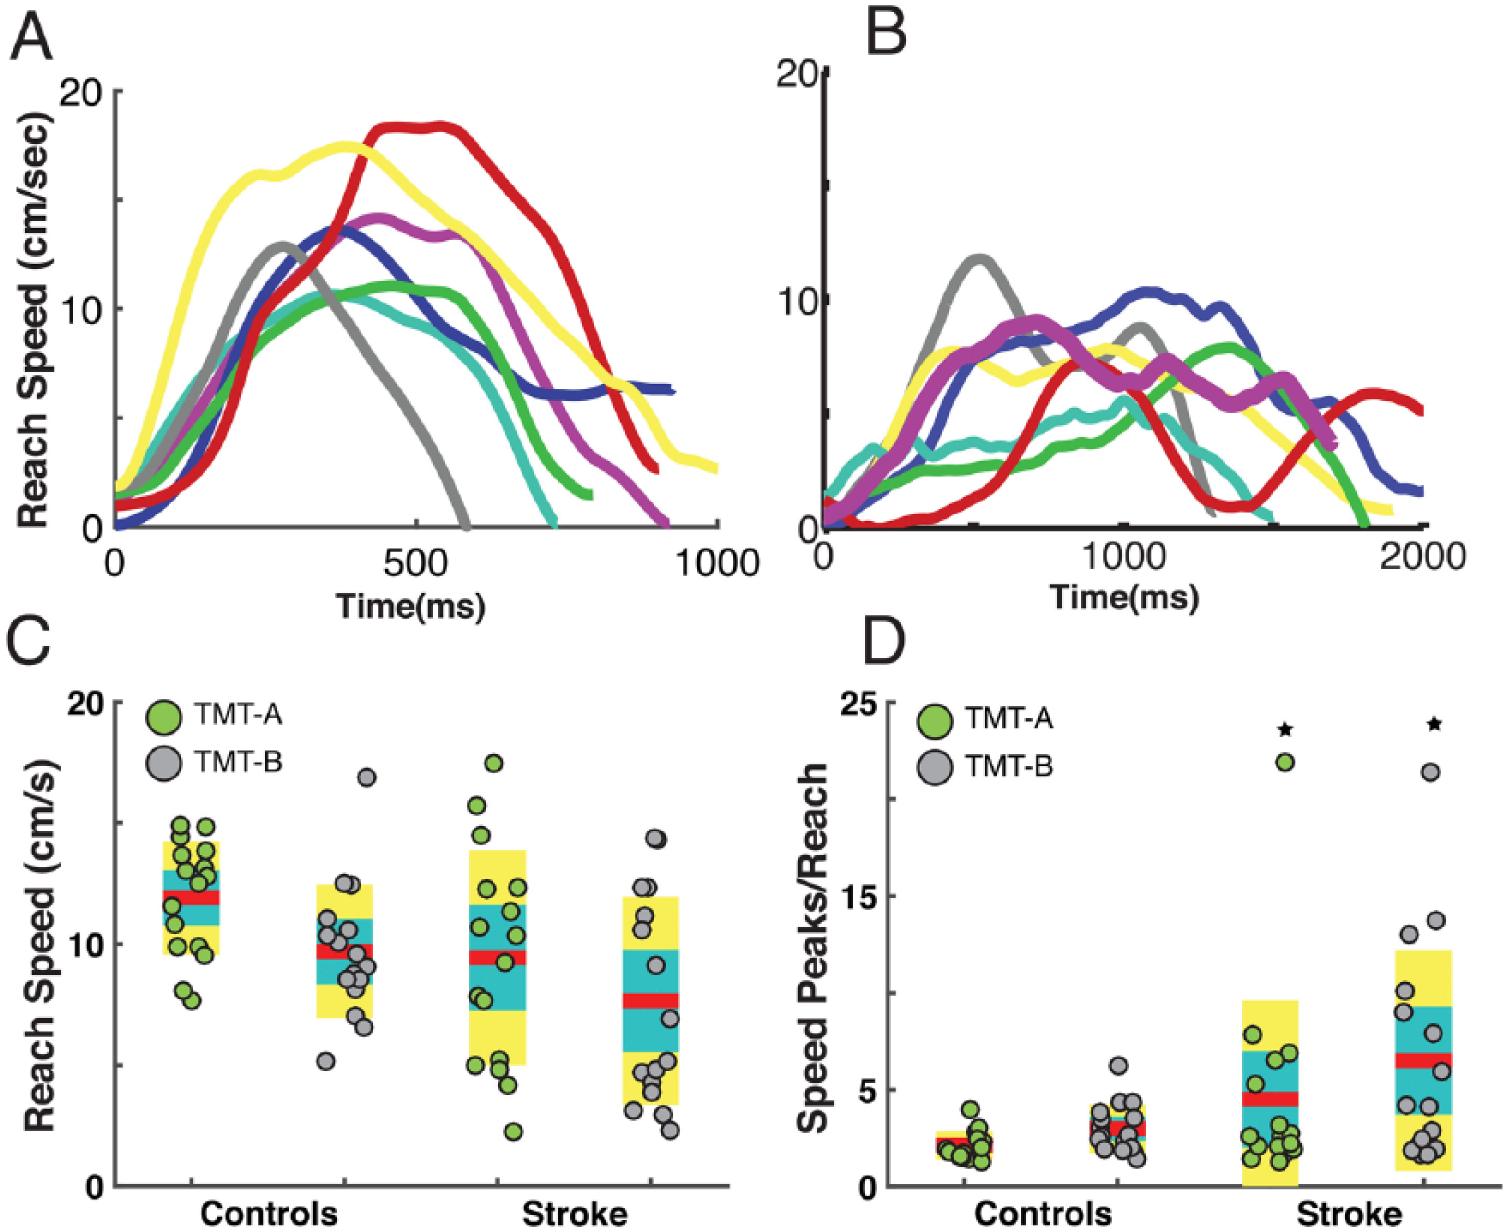
Speed and smoothness of reaching movements. (A, B) A randomly chosen subset of reaching speed profiles showing speed peaks (arrows) in TMT-A for a representative control (A) and stroke survivor (B). (C, D) Group data from TMT-A and TMT-B for Mean Reach Speed (C) and Speed Peaks per Reach (D). Green circles, individuals in TMT-A; gray circles, individuals in TMT-B; red lines, means; cyan areas, 1 SEM (standard error of the mean); yellow areas, 1 SD (standard deviation); ★, significant differences between stroke survivors and controls.
Features of Visual Search
We examined Saccades per Reach and Saccades per Dwell to test our hypothesis that stroke survivors would perform many saccades during reaching. Most stroke survivors and many controls continuously performed saccades during the reaching and dwell phases of TMT (see Figure 3 and Table 2). Stroke survivors made significantly more Saccades per Reach than controls (67% more in TMT-A; 70% more in TMT-B). Both groups made more Saccades per Reach in TMT-B than TMT-A (29% more in stroke survivors; 27% more in controls).
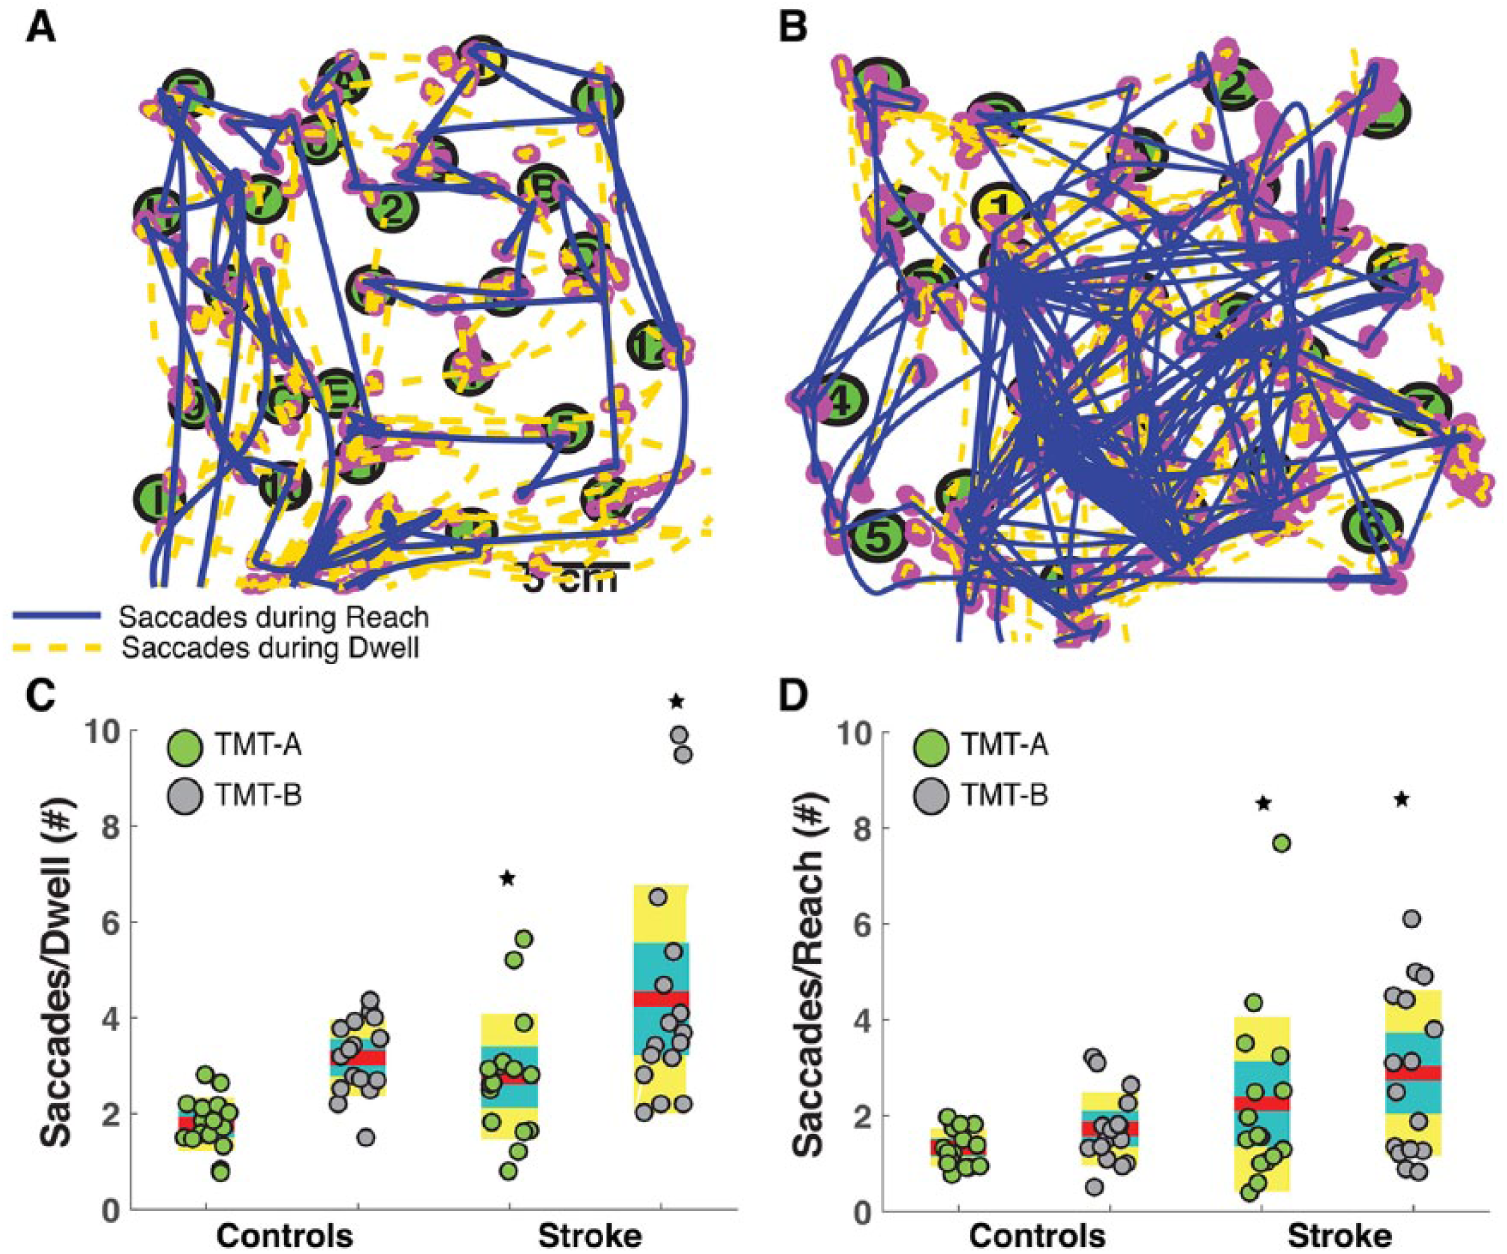
Saccades performed during TMT. (A, B) Spatial plots showing saccades performed during dwell and reaching in a representative control (A) and stroke survivor (B). (C, D) Group data in TMT-A and TMT-B for Saccades per Dwell (C) and Saccades per Reach (D). Symbols, lines and filled areas are the same as Figure 2.
We examined Saccades before Hand Peaks and Saccades after Hand Peaks to test our hypothesis that most saccades during reaching would closely precede local hand speed peaks. Although we did not observe a main effect of group, we found that both groups made more saccades shortly before than shortly after local peaks in reaching speed (see Figure 4A and Table 2). Saccades before Hand Peaks (across all participants) showed that 58% of all saccades during reaching preceded local hand speed peaks by 25 to 400 ms. In contrast, Saccades after Hand Peaks (across all participants) showed that only 15% of saccades during reaching followed local hand speed peaks by 25 to 400 ms.
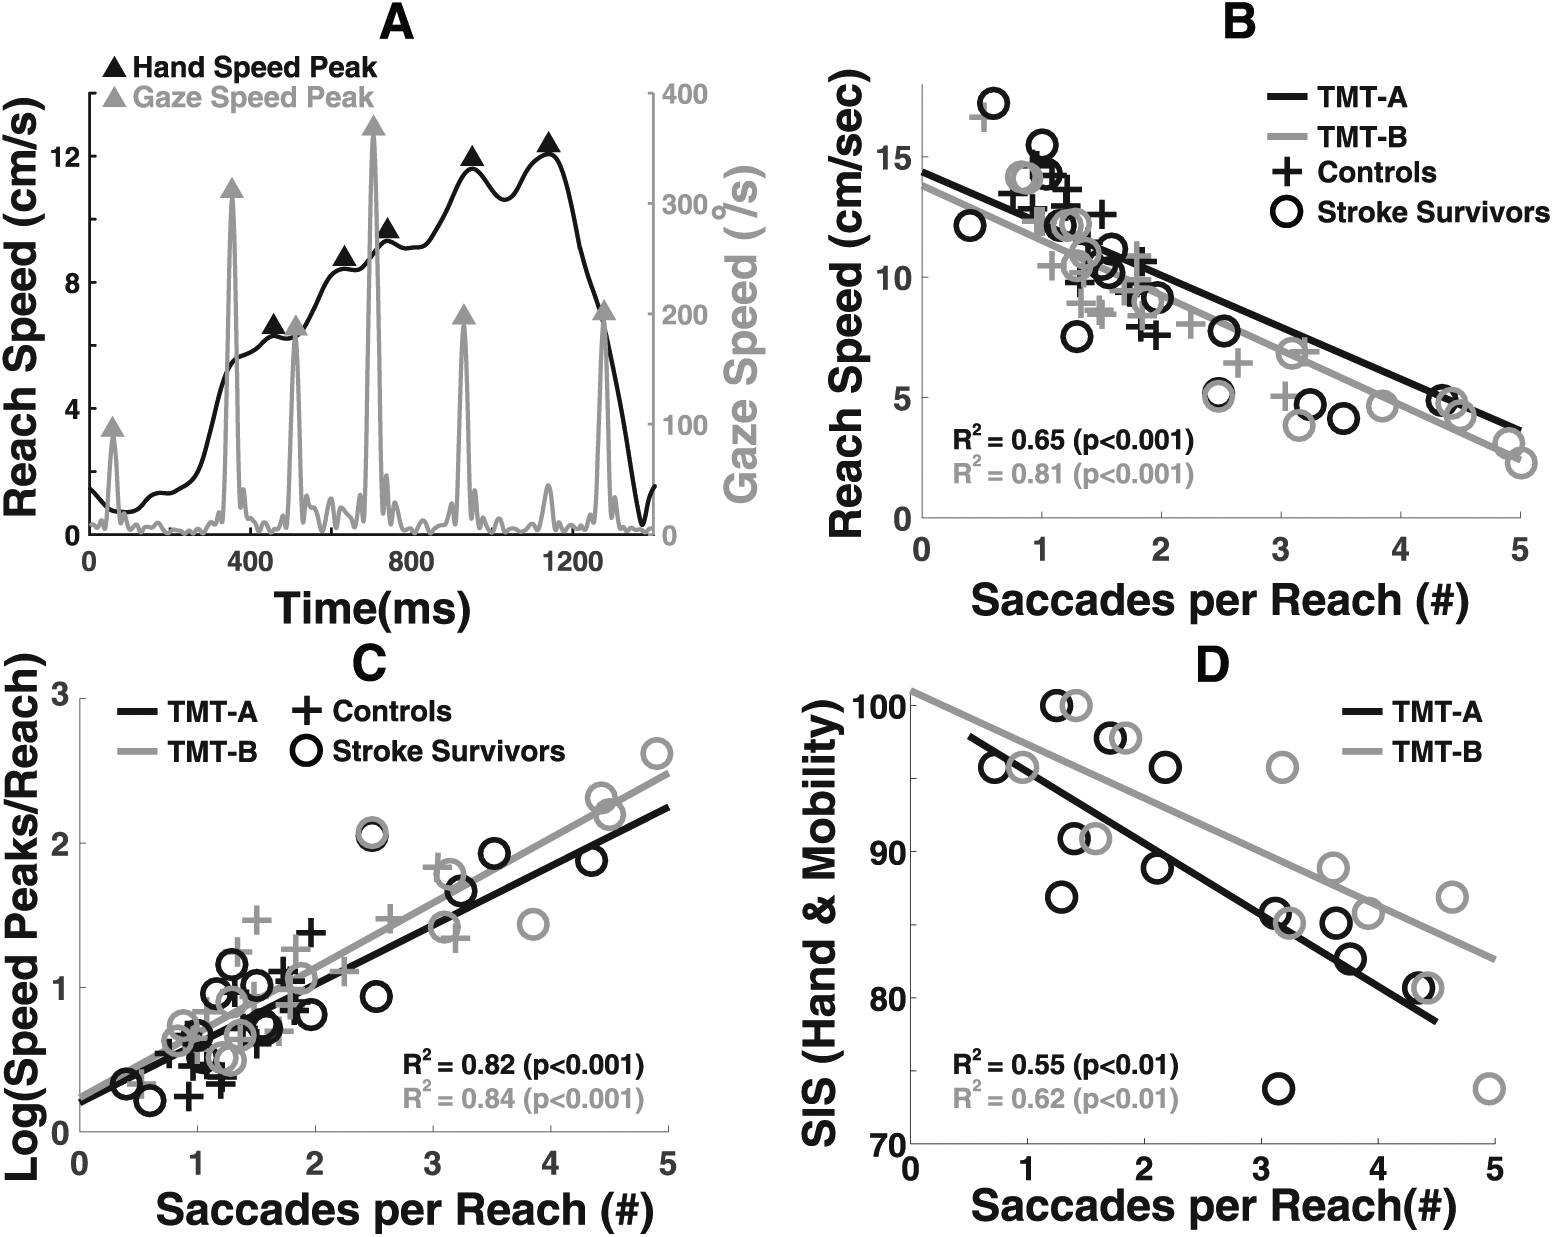
Relationships between saccades, reaching control, and functional tasks. (A) Data from a representative stroke survivor showing that saccades often precede local hand speed peaks (transient decelerations). (B-D) Saccades per Reach are negatively correlated with Mean Reach Speed (B), Speed Peaks per Reach (C), and Stroke Impact Scale (SIS) score (D).
Relationships Between Visual Search and Reaching Control
We examined the relationships between Saccades per Reach, Mean Reach Speed, and Speed Peaks per Reach to test our hypothesis that increases in saccades during reaching would be strongly associated with decreases in reaching speed and smoothness. Figure 4 shows that Saccades per Reach were strongly correlated with Reach Speed (see Figure 4B; TMT-A, r2 = 0.65; TMT-B, r2 = 0.81) and Speed Peaks per Reach (see Figure 4C; TMT-A, r2 = 0.82; TMT-B, r2 = 0.84). To confirm that saccades were not used to look at or follow the hand during reaching movements, we also correlated Speed Peaks per Movement with the number of fixations and smooth pursuits of the hand. Our participants made very few fixations or smooth pursuits of the hand, and those that they made were not correlated with Speed Peaks per Movement (ρ = 0.17, P > .05).
Relationships Between Visual Search and Functional Difficulties
We finally tested our hypothesis that increases in saccades during reaching would be strongly associated with increased difficulty performing functional tasks involving hand function and mobility. Figure 4D shows that Saccades per Reach were strongly correlated with SIS Scores (Figure 4D; TMT-A, r2 = 0.55; TMT-B, r2 = 0.62).
Influence of Errors on Findings
We conducted 3 different analyses to investigate the influence of errors on our findings. First, we used stepwise regression to examine if Number of Errors was a strong predictor of Total Time (Supplementary Table S1, available in the online version of the article). We found that Number of Errors was a weak predictor of Total Time compared to Dwell and Movement Time, indicating that it was unlikely that errors meaningfully influenced our findings. Second, we removed all error segments from each trial and recomputed Total Time w/o Errors, Mean Reach Speed without Errors, Speed Peaks per Reach without Errors, and Number of Saccades without Errors (see Supplementary Tables S2 and S3, available in the online version of the article). Descriptive data and statistical results with error segments removed mirrored our previous results with errors, indicating that errors did not meaningfully influence our findings or our interpretation of the findings. Third, we looked at the Number of Errors, Number of Saccades, and Mean Reach Speed as a function of overall progression in a trial (first half vs second half) using paired t tests. We found no significant differences in Number of Errors, Number of Saccades, and Mean Reach Speed between the 2 halves for either group.
Discussion
Role of Interference Between Saccades and Motor Control
The findings from our first objective provide evidence that impaired visual search after stroke may interfere with motor control during visuomotor tasks with substantial perceptual or cognitive demands. First, our stroke survivors made an abnormally large number of saccades during reaching phases of TMT (Table 2). Second, saccades during reaching often preceded and rarely followed transient decelerations in reaching speed (Figure 4A and Table 2). Third, increased saccades during reaching were highly predictive of decreases in reaching speed (Figure 4B) and smoothness (Figure 4C). Finally, both stroke survivors and controls performed worse on all measures in TMT-B than TMT-A (Table 2), suggesting that greater cognitive demands resulted in more saccades and greater decreases in reaching speed and smoothness in both groups.
Previous studies have attributed poststroke decreases in reaching speed and smoothness to impaired motor function based on correlations between clinical scores of motor impairment and measures of reaching speed and smoothness. 18 Although our study was also correlational, our findings suggest that decreases in reaching speed and smoothness may be attributed to impaired visual search in stroke survivors who often make saccades during ongoing movements. Notably, we observed that saccades often preceded and rarely followed local peaks in hand speed. Although we did not observe significant differences between groups for Saccades before Peaks and Saccades after Peaks (see Table 2), this does not indicate that saccades may have equally interfered with reaching in both groups. Specifically, stroke survivors made more saccades per reaching movement (Table 2), and that may have resulted in a higher likelihood of inducing more speed peaks and slower movements than controls.
We previously showed that abnormal increases in saccades during TMT are related to impaired cognitive organization of visual search after stroke. 10 Here we found a strong relationship between unorganized visual search and decreases in reaching control. This suggests that increasing the cognitive demands of a task may contribute to poststroke difficulties with simultaneously performing visual search and limb movements. This also implies that stroke-induced declines in neural processing could concurrently impair visual search and motor skill performance and may also explain previous results linking abnormal cognitive planning with decreased reaching smoothness. 37
It is perhaps somewhat surprising that none of our measures showed an interaction effect between Group and Task, suggesting that both groups dealt similarly with higher cognitive demands in TMT-B. However, scores on the Visual Cognition Assessment were similar in both groups, suggesting that we should not have expected an interaction effect between Group and Task. In contrast, we found significant interactions between group and task for Total Time, Errors, and Total Number of Saccades in our previous study in which several stroke survivors scored poorly on the Visual Cognition Test. 10
Role of Interference Between Saccades and Functional Performance
Assessments of motor impairment used in research, such as the Fugl-Meyer Assessment (FMA), are not designed to assess visuomotor impairments. In fact, a recent study demonstrated that many stroke survivors with little or no motor impairment on the FMA report difficulties with hand function (SIS). 20 This suggests that impairments not measured by the FMA may contribute to functional difficulties and highlights the need for additional studies designed to investigate other impairments that may contribute to functional difficulties.
The findings from our second objective provide evidence that impaired visual search may interfere with functional performance after stroke. Notably, increases in saccades during reaching were highly predictive of difficulties performing functional activities (Figure 4D). This demonstrates a need for developing clinical tests that can provide valid and reliable assessment of impaired visual search after stroke. This also suggests that treatments for poststroke impairments of visual search may produce improvements in motor function. Several studies have provided evidence that visual search and eye movement training produce improved performance on sporting and occupational activities in normal adults38,39 and on functional activities in clinical populations.40-43 This indicates that interventions designed to treat impaired visual search in stroke survivors may produce improvements in functional performance.
Even combining assessments of functional performance like the SIS with assessments of motor impairment like the FMA would not be able to identify impairments underlying functional difficulties. Our results suggest that it is important that clinical researchers and practitioners of assessment and treatment of motor function collaborate with vision rehabilitation and cognitive rehabilitation specialists to devise targeted assessments and interventions for visuomotor deficits in stroke survivors.
Potential Mechanisms Underlying Interference Between Saccades and Movement
If vision contributes to feedback control of movement, unwanted saccades during reaching should interfere with reaching. Studies of eye-hand coordination indicate that gaze normally remains anchored at the target of a reaching movement until shortly before the reach arrives on target.14,15 This indicates that suppressing saccades during reaching may prevent saccades from interfering with feedback control of reaching. Our findings further suggest that stroke-induced brain damage impairs normal suppression of saccades, resulting in saccades that interfere with feedback control of reaching.
If vision is primarily used for feedforward control, unwanted saccades during reaching should have little effect on reaching control. However, saccades could indirectly influence reaching if common neural processes underlie planning and control of saccades and reaching. Specifically, planning of saccades would engage common neural processes that would alter ongoing reaching movements. In contrast, saccades should not interfere with reaching if independent neural processes underlie planning and control of saccades and reaching. Several studies have examined common versus independent control of saccades and reaching without a clear consensus.44-47
The serial information-processing framework, which is often used to interpret studies of information processing, posits that information is serially processed by the perceptual, cognitive, and motor systems. 48 This framework predicts that participants will hold their hand at target “n” while searching for target “n + 1,” then reach to target “n + 1” while their gaze remains anchored at target “n + 1” during TMT. In contrast, we found that saccades were continuously performed during the dwell and reach phases. This framework also predicts that higher cognitive demands will not influence motor processes because cognitive and motor processing are relatively independent. However, reach times were significantly longer in TMT-B than TMT-A for both groups, suggesting similar interference between cognitive and motor processes. Similar to studies using dual-task paradigms,49,50 our findings argue against the serial-information processing framework.
Limitations
A key limitation of this study is that much of our evidence was correlational. Our finding that saccades frequently preceded and rarely followed transient decelerations in hand speed suggest that saccades may have caused the decelerations in hand speed and not the other way around. Our results justify future studies designed to address causality by using, for example, salient stimuli or neurostimulation to elicit unwanted saccades at various times during dwell and reaching.
Another limitation is that we did not investigate the neural mechanisms linking increased saccades during reaching with decreased reaching control. Our results indicate that damage to brain networks involved in organizing visual search may disrupt reaching control in the absence of damage to brain networks involved in reaching control. Neuroimaging and neurostimulation studies designed to investigate the underlying neural mechanisms are well justified.
A final limitation was that we used the SIS to measure perceived functional ability rather than using a measure of functional performance. Although many tests of functional performance use criteria-based scores that are not adequately sensitivity for research, the Wolf Motor Function Test and Action Research Arm Test may have provided additional insights. Robotics, motion capture and wearable technologies may also provide valuable measures of functional performance in the future. However, the SIS is a valid, reliable and sensitive measure of functional ability, thus it was well suited for the current study.
Supplemental Material
Supplemental_Materials – Supplemental material for Eye Movements Interfere With Limb Motor Control in Stroke Survivors
Supplemental material, Supplemental_Materials for Eye Movements Interfere With Limb Motor Control in Stroke Survivors by Tarkeshwar Singh, Christopher M. Perry, Stacy L. Fritz, Julius Fridriksson and Troy M. Herter in Neurorehabilitation and Neural Repair
Footnotes
Supplementary material for this article is available on the Neurorehabilitation & Neural Repair website along with the online version of this article.
Declaration of Conflicting Interests
The authors declared no potential conflicts of interest with respect to the research, authorship, and/or publication of this article.
Funding
The authors disclosed receipt of the following financial support for the research, authorship, and/or publication of this article: This research was partially supported by ASPIRE Grants from the University of South Carolina.
References
Supplementary Material
Please find the following supplemental material available below.
For Open Access articles published under a Creative Commons License, all supplemental material carries the same license as the article it is associated with.
For non-Open Access articles published, all supplemental material carries a non-exclusive license, and permission requests for re-use of supplemental material or any part of supplemental material shall be sent directly to the copyright owner as specified in the copyright notice associated with the article.