
Abstract
Changes in the control of the lower extremities poststroke lead to persistent biomechanical asymmetries during walking. These asymmetries are associated with an increase in energetic cost, leading to the possibility that reducing asymmetry can improve walking economy. However, the influence of asymmetry on economy may depend on the direction and cause of asymmetry. For example, impairments with paretic limb advancement may result in shorter paretic steps, whereas deficits in paretic support or propulsion result in shorter nonparetic steps. Given differences in the underlying impairments responsible for step length asymmetry, the capacity to reduce asymmetry and the associated changes in energetic cost may not be consistent across this population. Here, we identified factors explaining individual differences in the capacity to voluntarily reduce step length asymmetry and modify energetic cost during walking. A total of 24 individuals poststroke walked on a treadmill, with visual feedback of their step lengths to aid explicit modification of asymmetry. We found that individuals who took longer paretic steps had a greater capacity to reduce asymmetry and were better able to transfer the effects of practice to overground walking than individuals who took shorter paretic steps. In addition, changes in metabolic cost depended on the direction of asymmetry, baseline cost of transport, and reductions in specific features of spatiotemporal asymmetry. These results demonstrate that many stroke survivors retain the residual capacity to voluntarily walk more symmetrically on a treadmill and overground. However, whether reductions in asymmetry reduce metabolic cost depends on individual differences in impairments affecting locomotor function.
Introduction
One of the primary goals of poststroke rehabilitation is to improve walking ability.1,2 After a stroke, individuals use about twice as much energy as healthy individuals to walk the same distance.3-5 This increased energy cost has been associated with slower walking speed,4,6,7 increased work to lift the center of mass,4,8 increased work performed by the paretic leg, 9 and step time and step length asymmetry.10,11 Although all these factors are likely to contribute to the increased energetic cost of walking poststroke, it is of particular interest to understand the effects of step length asymmetry on energetic cost because asymmetry is a standard metric of gait impairment in laboratory-based studies and clinical trials.12,13 The increased cost associated with heightened step length asymmetry may be partly a result of suboptimal coordination of leading limb contact and trailing limb push-off forces.9,14 Therefore, reducing step length asymmetry may reduce the metabolic cost of walking poststroke.
Because of heterogeneity in the types of motor impairments that occur poststroke, the direction and magnitude of step length asymmetry are not uniform across the entire poststroke population. Whereas most individuals shorten stance time and increase swing time on the paretic side,15-17 the direction of step length asymmetry is highly heterogeneous.18-20 Reductions in paretic propulsion18,19 and hip extension 21 may manifest as shorter nonparetic steps, whereas dominant impairments with paretic limb advancement18,22 may result in shorter paretic steps. Therefore, the capacity to reduce asymmetry may not be consistent across the entire poststroke population. Moreover, these differential impairments may influence how metabolic cost changes in response to reductions in asymmetry: individuals with shorter nonparetic steps may only need to increase paretic stance duration, 23 whereas individuals with shorter paretic steps may rely on strategies such as hip hiking and circumduction to advance the paretic limb, which could further increase metabolic cost.4,7,24-26
Here, we sought to determine the following: (1) whether visual feedback of actual and desired step lengths is an effective approach to modify step length asymmetry during walking in people poststroke, (2) the factors that predict whether people poststroke retain the capacity to reduce step length asymmetry, (3) how changes in asymmetry affect metabolic cost, and (4) whether voluntary attempts to reduce asymmetry during treadmill walking transfer to overground walking. We addressed these aims through the use of a single session, biofeedback-based, treadmill walking paradigm. We hypothesized that individuals poststroke would reduce step length asymmetry using visual feedback. We also hypothesized that the baseline direction of asymmetry would influence the capacity to reduce asymmetry. Specifically, we expected that participants who took shorter paretic steps would reduce asymmetry less than participants who took longer paretic steps. We also hypothesized that reductions in asymmetry would be correlated with reductions in metabolic cost and that these reductions in cost would be greater in participants who took longer paretic steps given their hypothesized greater reductions in asymmetry. Finally, we hypothesized that the reductions in asymmetry would transfer to overground walking. Ultimately, a better understanding of the relationship between motor impairments, step length asymmetry, and metabolic cost can facilitate the design of personalized interventions to improve locomotor function and reduce the energetic burden of walking poststroke.
Methods
A total of 24 chronic stroke survivors (Table 1) participated in this study. Study inclusion criteria were the following: (1) chronic hemiparesis (time since stroke >6 months) caused by a single stroke, (2) ability to walk on the treadmill continuously for 5 minutes, (3) ability to walk overground independently or with use of a cane, (4) no concurrent neurological disorders or orthopedic conditions that interfered with their ability to walk, and (5) the ability to provide informed consent. Consistent with previous studies,27,28 participants were instructed to lightly touch a handrail placed in front of them to aid balance and prevent drift on the treadmill. All procedures conformed to the principles set forth in the Declaration of Helsinki and were approved by the University of Southern California’s Institutional Review Board.
Participant Demographics. a
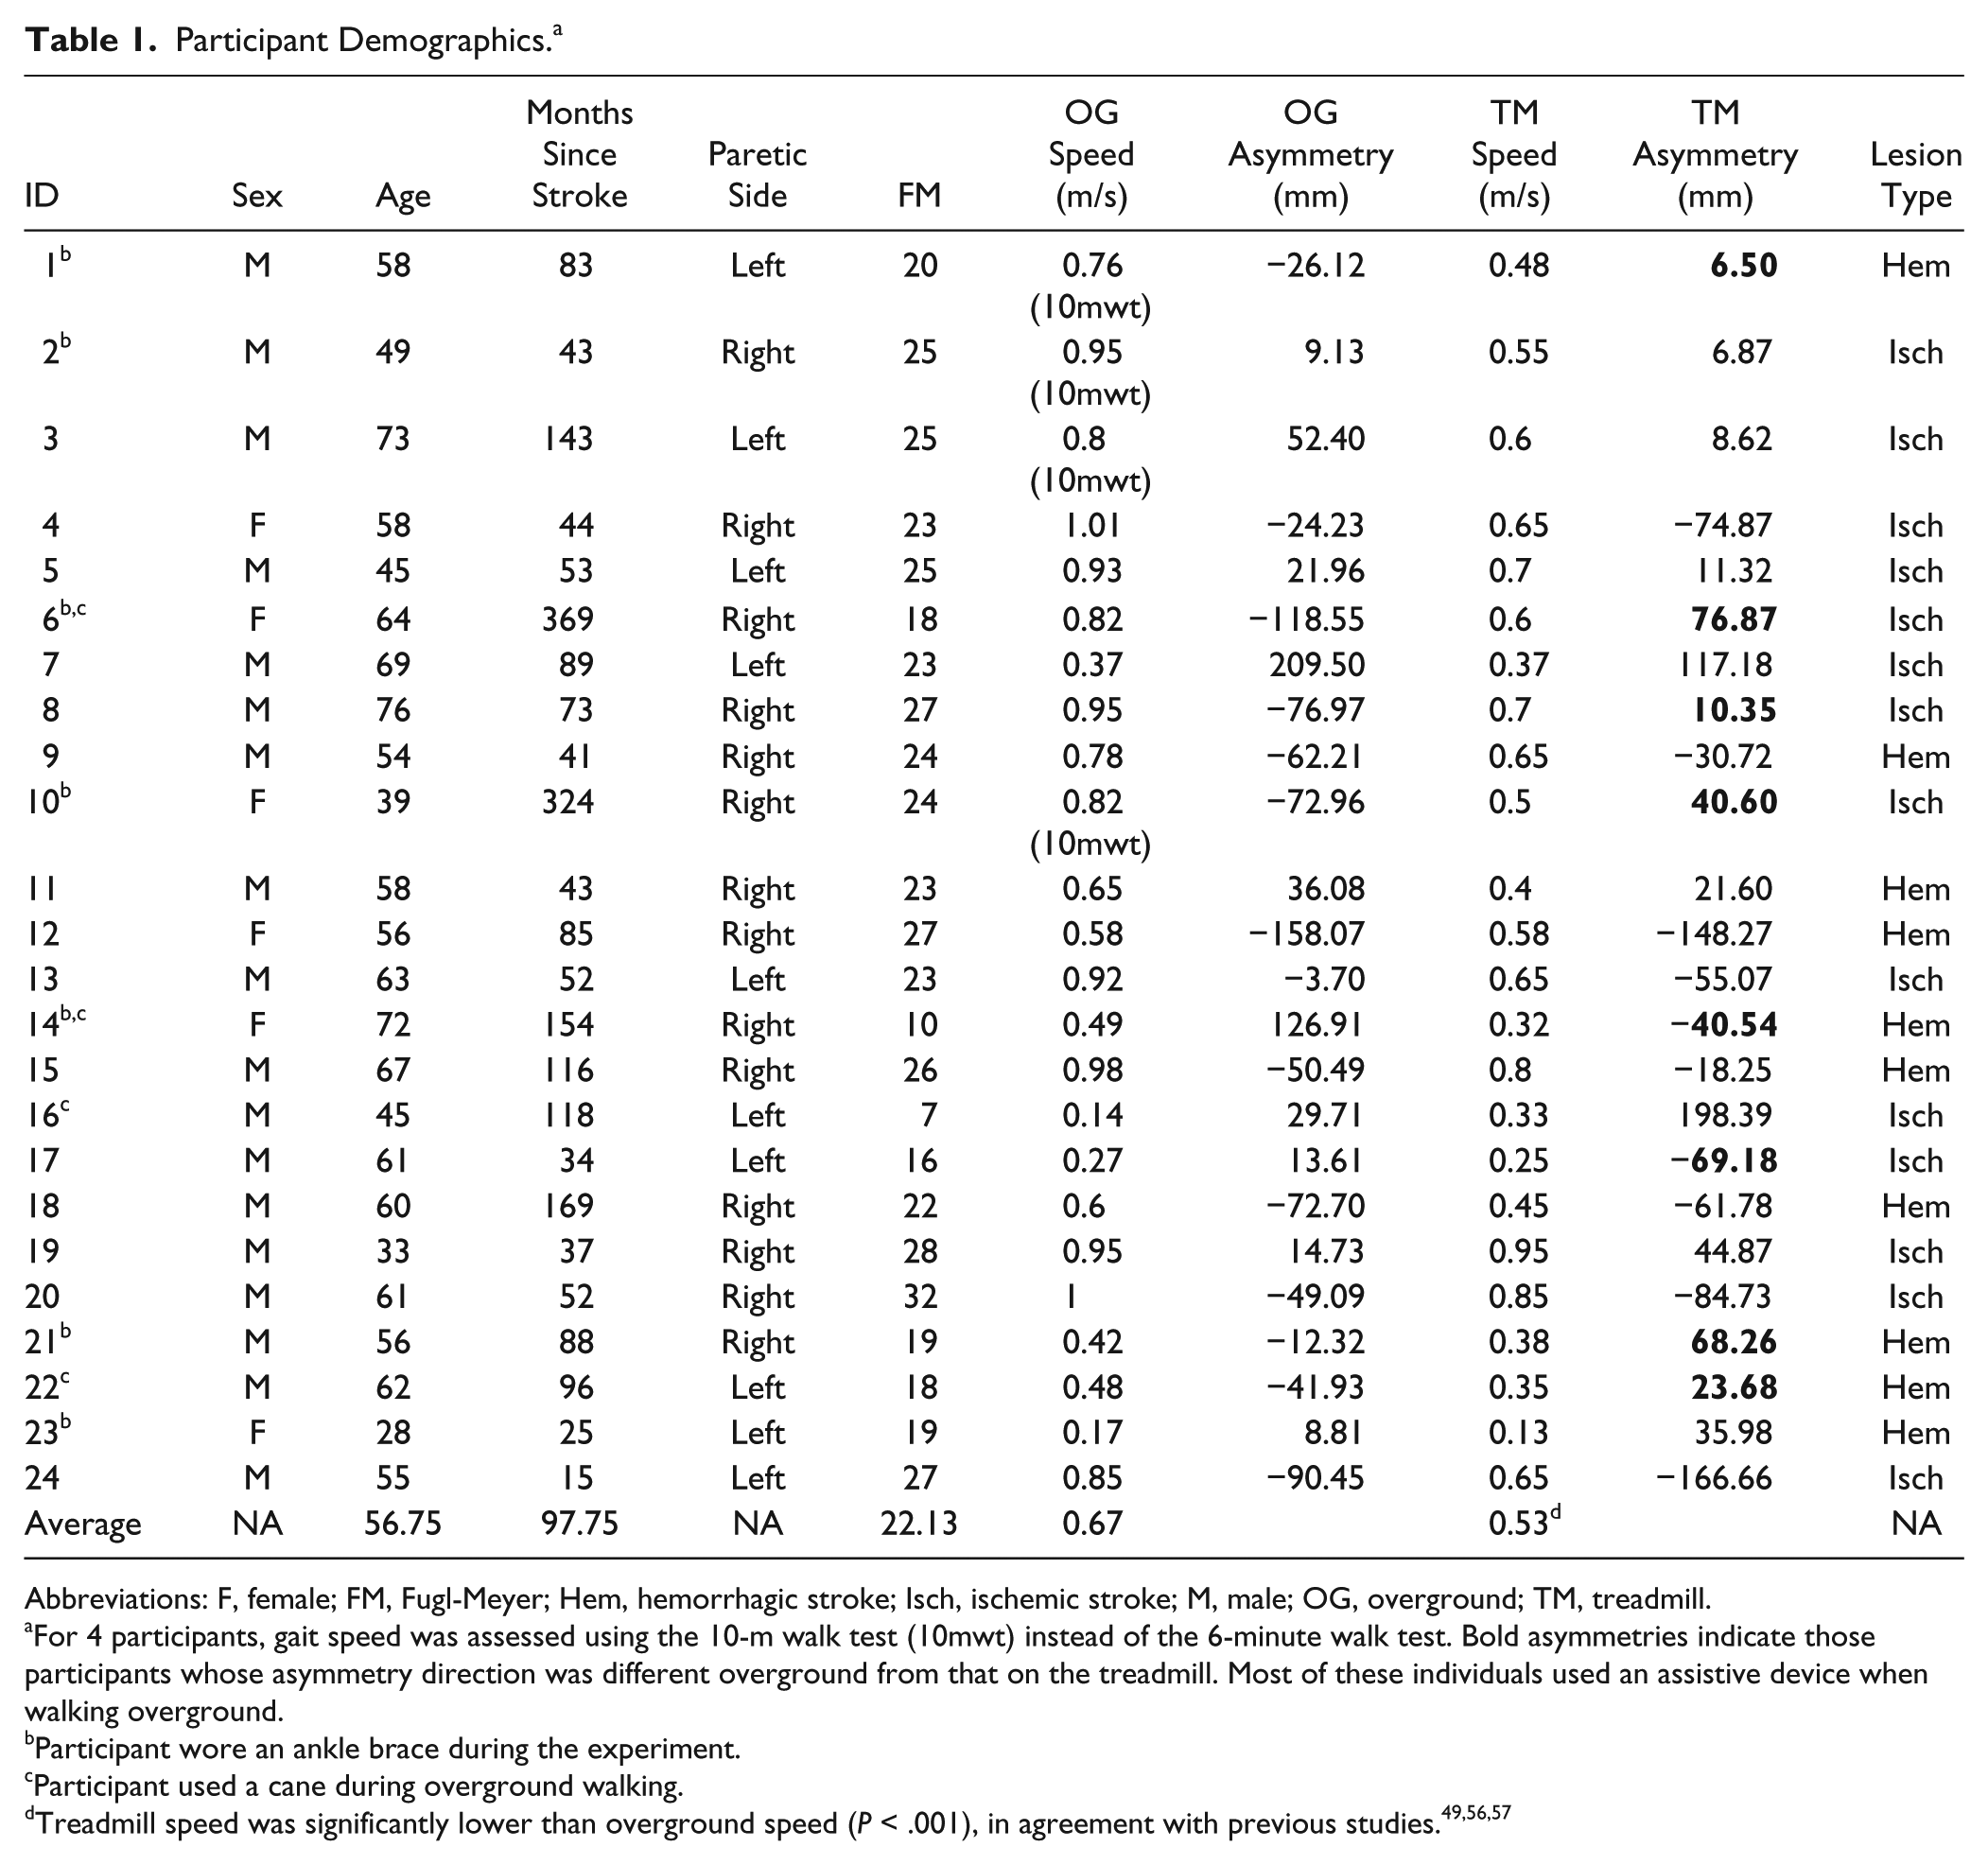
Abbreviations: F, female; FM, Fugl-Meyer; Hem, hemorrhagic stroke; Isch, ischemic stroke; M, male; OG, overground; TM, treadmill.
For 4 participants, gait speed was assessed using the 10-m walk test (10mwt) instead of the 6-minute walk test. Bold asymmetries indicate those participants whose asymmetry direction was different overground from that on the treadmill. Most of these individuals used an assistive device when walking overground.
Participant wore an ankle brace during the experiment.
Participant used a cane during overground walking.
Experimental Protocol
The full protocol consisted of a set of clinical assessments and a combination of trials overground and on the treadmill (Figure 1). The lower-extremity portion of the Fugl-Meyer (FM) assessment 29 was performed to assess lower-extremity motor impairment. Initial evaluation of walking function was done using the 6-minute walk test.
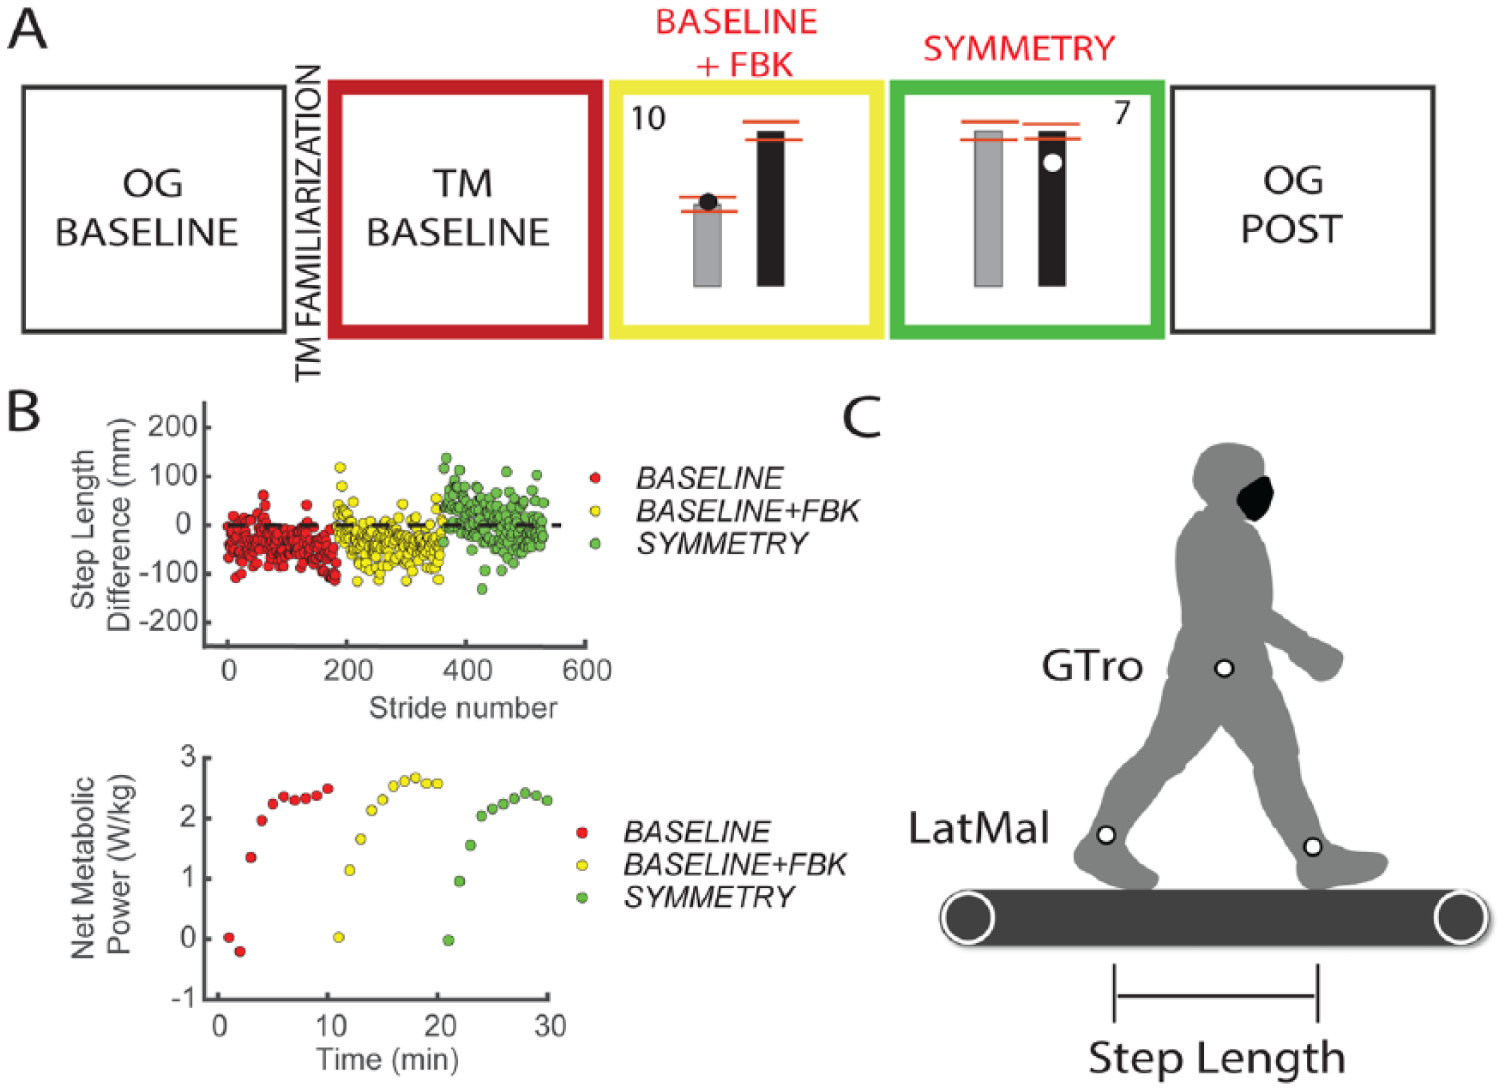
Experimental protocol and experimental setup: A. Experimental protocol and example of visual feedback. The red lines indicate the target window for the visual feedback trials, which was defined as twice the SD of the step length difference measured during BASELINE. An example of the score is provided on the top left and right corners of the window. This score was a function of the distance of the marker to the target window at foot strike. The score was updated on each side for every step. B. Raw step length difference data and metabolic power during TM trials for a single participant; data are color matched to the trials in the experimental protocol. Metabolic data were measured only for TM trials during BASELINE, BASELINE+FBK, and SYMMETRY. All treadmill trials lasted 5 minutes to ensure a steady metabolic cost. C. Experimental setup and marker locations.
The experiment began with 4 to 6 passes over a 10-m walkway at each participant’s self-selected speed (OG BASE). This was followed by a treadmill familiarization trial, where the speed of the treadmill was gradually adjusted using the staircase method 30 until participants achieved their comfortable walking speed, which they maintained for 3 minutes. In the final minute of this trial, we introduced the visual feedback, and participants practiced matching step length targets for 1 minute. They subsequently completed a 5-minute walking trial on the treadmill (BASELINE), where we measured their baseline metabolic cost and step lengths. During all treadmill trials, participants wore a harness to prevent falls, without providing any body weight support.
After BASELINE, participants performed 2 trials using real-time visual feedback of their actual and desired step lengths. In the BASELINE+FBK (feedback) trial, participants matched their step lengths to the average step lengths measured during the BASELINE trial. The goal of this trial was to measure potential changes in metabolic cost and spatiotemporal variables resulting from participants’ efforts to attend to the feedback and make precise foot placements.31,32 For the subsequent SYMMETRY trial, participants were instructed to walk with equal step lengths, by lengthening their shorter step to match their longer step. Finally, participants transitioned to walking overground to assess transfer (OG POST). Sitting breaks of at least 5 minutes were provided between all trials, and blood pressure and heart rate were measured for safety and to ensure that resting conditions were achieved before beginning the next trial.
Participants were provided with visual feedback of their step lengths via a display (Figure 1A) that was controlled by custom software written in Vizard (Worldviz, Santa Barbara, CA). The real-time location of markers placed on their ankles was projected onto vertical bars representing the desired step lengths. During BASELINE+FBK and SYMMETRY, participants were instructed to walk such that the position of the ankle marker coincided with the top of the bars on the corresponding side at foot strike. Points were awarded to participants as follows (rounded to the nearest integer):
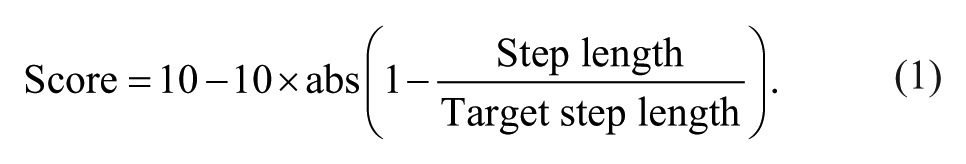
Participants were verbally encouraged to obtain 10 points for every step on each side. Points were provided on each side to prevent participants from shortening their longer step. For trials with no visual feedback (BASELINE, OG BASE, and OG POST), participants were asked to walk naturally, and no explicit instructions to lengthen their shorter step were provided.
Data Acquisition
Kinematic Data
Kinematic data for passive markers placed bilaterally on the lateral malleoli and greater trochanters were collected using a 10-camera Qualisys Oqus system (QTM, Sweden). Foot strike and lift-off were estimated from peak anterior and posterior lateral malleoli excursions, respectively. 33
Metabolic Cost
Metabolic cost was assessed using expired gas analysis. Inspired oxygen (O2) and expired carbon dioxide (CO2) volumes were sampled on a breath-by-breath basis using a TrueOne 2400 system (Parvomedics, UT). Substrate use during the experiment was determined using the respiratory exchange ratio (RER), which is the ratio of CO2 produced to O2 consumed (VCO2/VO2). VO2 and VCO2 were used to calculate metabolic power using a standard equation. 34 The average metabolic power from a standing baseline trial was subtracted from measurements made during all subsequent walking periods to yield net metabolic power. Net metabolic power for each treadmill trial was averaged over the last 2 minutes of walking. Metabolic data were supplemented with self-reported ratings of perceived exertion (RPEs), 35 which were collected after each trial in 18 of 24 participants.
Data Processing and Analysis
Step Length Asymmetry
Individual step lengths were defined as the fore-aft distance between the lateral malleoli markers at the time of the respective limb’s footstrike.28,36,37 We characterized step length asymmetry by the magnitude of the difference in step lengths, |SLDiff|, and the direction of this difference. Participants who took longer paretic steps had a negative asymmetry, and participants who took shorter paretic steps had a positive asymmetry. Average values of SLDiff were obtained for the last 2 minutes of walking, and the sign of this average was used to define the direction of asymmetry.
We included participants in our study with marked step length asymmetries as well as participants whose asymmetry fell within the variability observed in healthy individuals.38-40 Participants with negligible asymmetries were included because taking steps of relatively equal length does not necessarily imply symmetric foot placement and timing.20,36 Because the use of visual feedback could change foot placement and timing, we considered it essential for participants with negligible asymmetries to be included in our sample. In addition, because our primary analyses relied on regression, including participants with negligible asymmetries provided observations throughout the full range of the model. Finally, the inclusion of participants with negligible step length asymmetry allowed us to determine the effects of fatigue. If we observed reductions in asymmetry, but no changes in metabolic cost in participants with marked asymmetries and increased metabolic cost in participants with negligible asymmetries, then this would imply that fatigue outweighed the effects of reducing asymmetry.
Spatial and Temporal Contributions to Step Length Asymmetry
Step length asymmetry (Equation 2) stems from differences between where the feet are placed relative to the pelvis at foot strike (step position contribution, Equation 3), differences in step timing (step time contribution, Equation 4), and differences in the speed at which the body progresses over the supporting leg (velocity contribution, Equation 5).36,41 We separately identified these contributions because previous work has shown that the variance in the metabolic cost of walking poststroke can be partially explained by the step position contribution 41 :
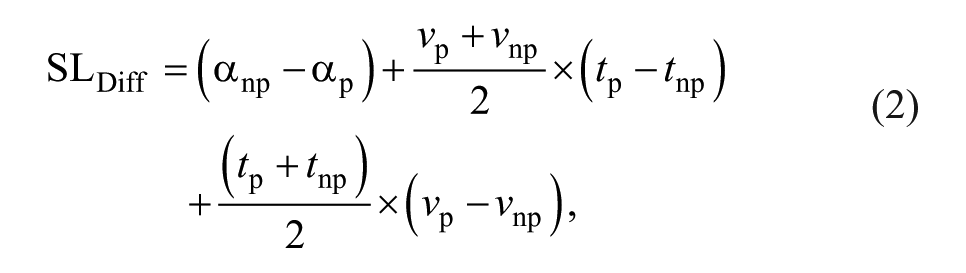


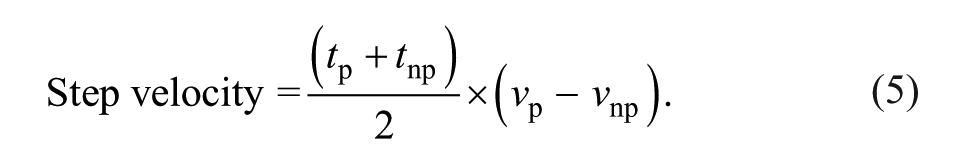
Here, αnp indicates the difference in how far the nonparetic foot is placed in front of the body relative to the previous paretic foot placement, and αp indicates the difference in how far the paretic foot is placed in front of the body relative to the previous nonparetic foot placement; vnp and vp are the speed of the body relative to the nonparetic and paretic feet during stance, respectively; and tnp and tp are the nonparetic and paretic step times, where tnp is the time from nonparetic foot strike to paretic foot strike, and vice versa for tp. A detailed derivation of these equations can be found elsewhere. 36 Average values for each variable were calculated for the last 2 minutes in each trial.
Cost of Transport
The net metabolic power and RER corresponding to BASELINE, BASELINE+FBK, and SYMMETRY were calculated from the averages of VO2 and VCO2 during the last 2 steady-state minutes of each trial, consistent with the period over which spatiotemporal variables were analyzed. All measures of metabolic power were normalized by body mass and treadmill speed to obtain the net metabolic cost of transport (CoT), expressed in joules per kilogram per meter.
Statistical Analyses
All statistical analyses were performed in Matlab R2016b (Mathworks, Natick, MA). Data were tested for normality using the Kolmogorov-Smirnov test. If the data satisfied the normality test, repeated-measures analyses of variance (RM-ANOVA) were used to determine whether the values of the following variables differed across BASELINE, BASELINE+FBK, and SYMMETRY trials: |SLDiff|, individual step lengths, stance duration, swing duration, stride length, position, time and velocity contributions to SLDiff, CoT, RER, and RPE. The direction of asymmetry was defined as a between-subjects effect in the RM-ANOVA. If the interaction between trial and asymmetry direction was significant, we then conducted separate post hoc analyses comparing values of our dependent variables between trials for participants who took longer paretic and shorter paretic steps separately. If the data did not satisfy the normality requirement, the Wilcoxon signed-rank test for paired data or the Friedman test were used instead. Sphericity was assessed using the Mauchly test. If the sphericity assumption was not satisfied, we used the Huyn-Feldt corrected P value. Post hoc comparisons were performed using the Tukey-Kramer correction for multiple comparisons. A paired-samples t-test between OG BASE and OG POST was used to determine if the practice of a more symmetric pattern on the treadmill led to reductions in asymmetry during overground walking. The significance level for all tests was set at P =.05. We used independent-samples t-tests to assess differences between FM and spatiotemporal variables for participants who took longer paretic and shorter paretic steps. We examined associations between FM and SLDiff, and FM and reductions in SLDiff using Pearson’s correlation coefficient.
Regression Analyses
Multiple linear regression was implemented using robust regression to determine the behavioral variables associated with the capacity to reduce asymmetry and change CoT. We first explored whether the change in step length asymmetry during SYMMETRY relative to BASELINE+FBK (ΔSLDiff) was associated with the following independent variables: the magnitude of baseline SLDiff, step position, step time, and step velocity contributions to SLDiff and the direction of asymmetry. We defined AsymPositive as a categorical variable with a value of 0 for longer paretic steps and a value of 1 for shorter paretic steps.
We next determined whether the change in metabolic cost (ΔCoT) was associated with ΔSLDiff, the change in each contribution to SLDiff, AsymPositive, or baseline CoT (CoTBase). We also used regression analysis to determine if the change in SLDiff from OG BASE to OG POST was associated with overground baseline asymmetry direction, asymmetry magnitude, or the changes in spatiotemporal variables observed during the SYMMETRY trial.
For each regression analysis, we first calculated variance inflation factors (VIFs 42 ) to determine the candidate variables considered for inclusion in the model. If the VIF for a given variable was greater than 4, the variable was removed from the model to avoid multicollinearity. Once the set of candidate variables for each model was determined, we fit a separate model for each possible combination of intercept, main effects, and interactions between asymmetry direction and all candidate variables and selected the final set of predictors using best subset selection. 43 Briefly, we obtained the p models that had the lowest AIC, where p is the number of candidate predictors. We used the AIC for model selection because this criterion penalizes more complex models to avoid overfitting. We then selected the model with the highest predictive R2 using leave-one-out cross-validation. 43
Results
Between-Trial Differences in Spatiotemporal Variables and CoT
We observed a significant main effect of trial type on the magnitude of step length asymmetry (|SLDiff|, RM-ANOVA, F2,44 = 10.44, P < .001; Figure 2A). As expected, post hoc comparisons indicated no differences in |SLDiff| during BASELINE+FBK compared with BASELINE (P = .437) and a reduction in |SLDiff| in the SYMMETRY trial. Average |SLDiff| during SYMMETRY was 30 ± 32 mm compared with 54 ± 48 mm during BASELINE+FBK (P = .004; Figure 2A). We also observed a marginally significant interaction between trial and asymmetry direction (F2,44 = 3.46; P = .053). For the longer paretic participants, asymmetry was reduced by 36 ± 11 mm (P = .007) during SYMMETRY, whereas for participants who took shorter paretic steps, asymmetry was not significantly different from BASELINE+FBK (average reduction of 14 ± 9 mm, P = .259).
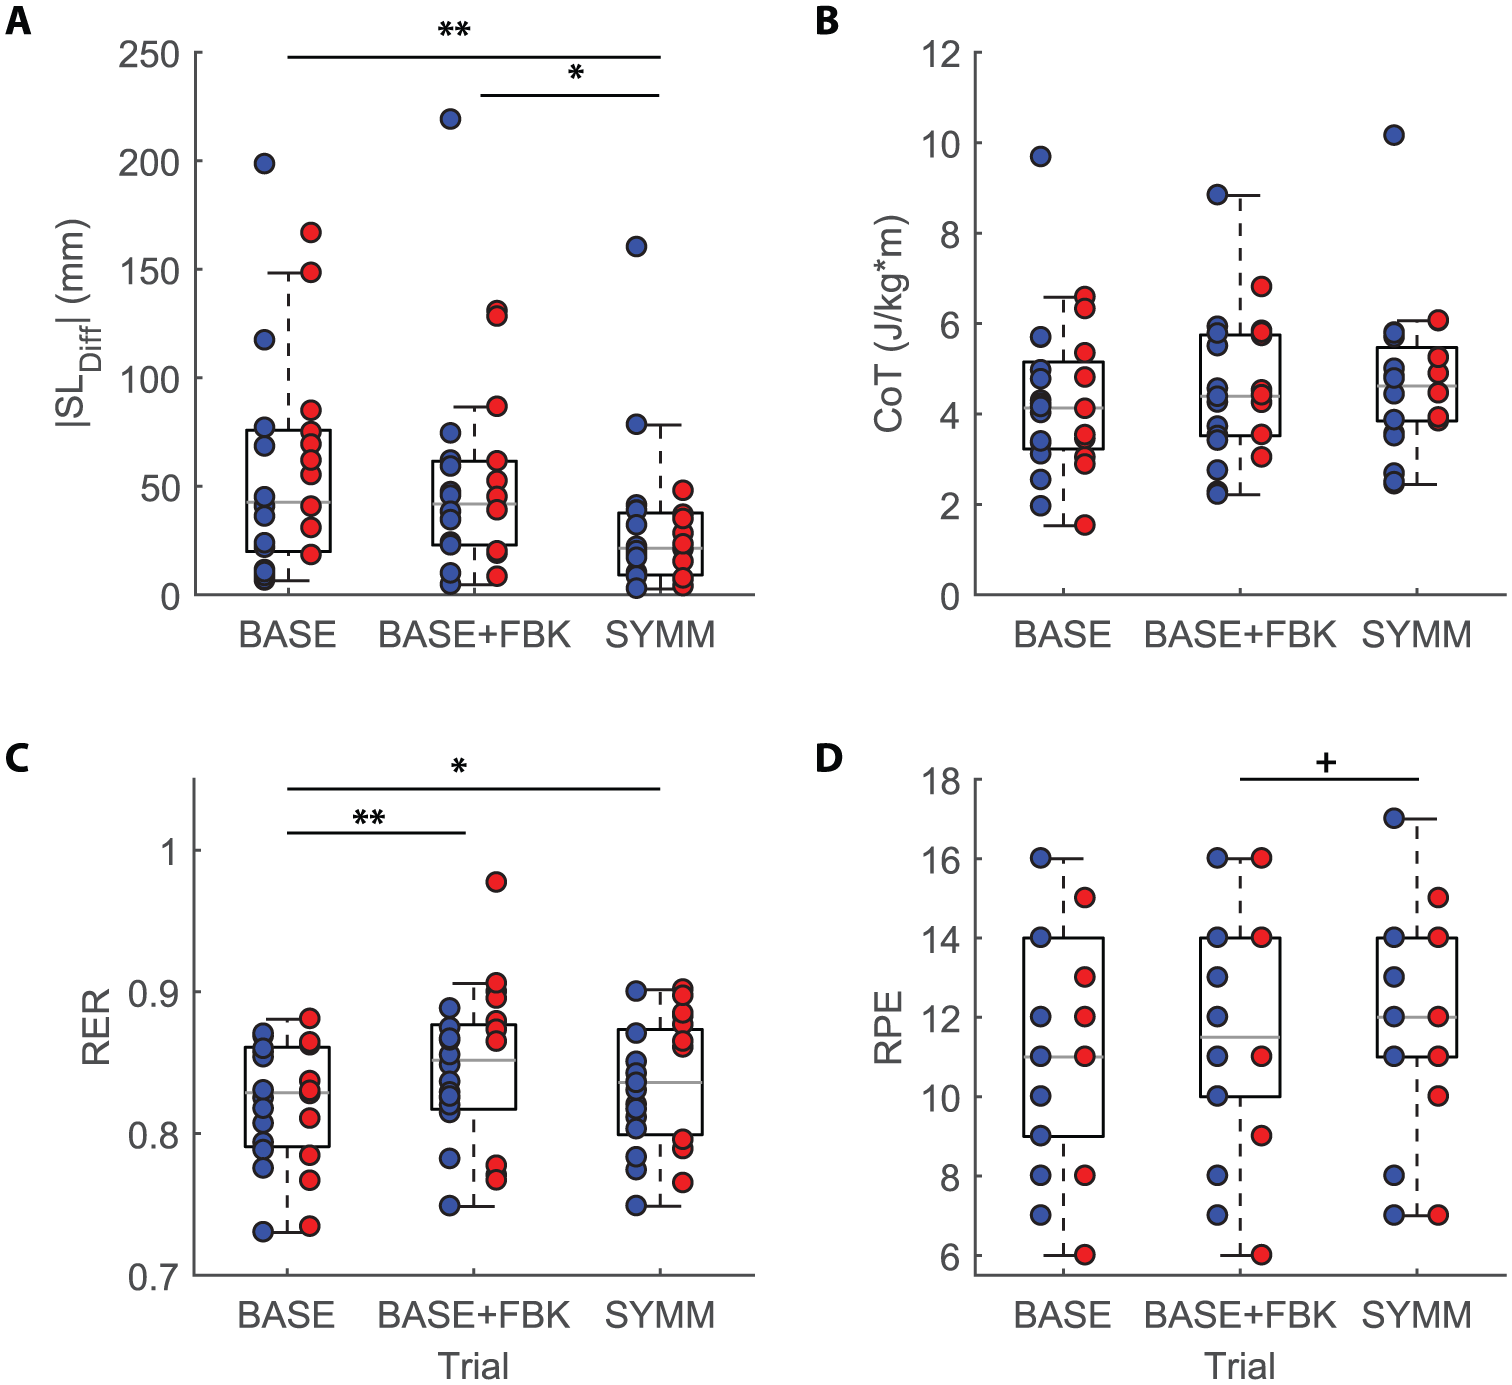
Effects of visual feedback on spatiotemporal control and metrics of energetic cost: individual data are shown over the box plots. Participants in blue took shorter paretic steps, whereas participants in red took longer paretic steps. A. Step length difference (SLDiff) magnitude; there were no significant differences in step length difference between BASELINE and BASELINE+FBK. The feedback during SYMMETRY led to significantly smaller asymmetries compared with BASELINE and BASELINE+FBK. B. Cost of transport (CoT); no group-level differences in CoT were observed across trial types. C. The RER increased because of the added feedback but did not increase further during the SYMMETRY trial. D. The RPE increased marginally when participants were instructed to generate symmetric step lengths. Tukey-Kramer multiple comparisons.a
We next examined whether the added feedback during BASELINE+FBK and SYMMETRY modified individual step lengths. During SYMMETRY, participants could reduce asymmetry by lengthening the short step or by shortening their long step. There was a significant main effect of trial type and a significant interaction between asymmetry direction and trial type on paretic step length (RM-ANOVA: F2,44 = 6.141, P = .008 for trial type; F2,44 = 8.023, P = .002 for the interaction) and nonparetic step length (RM-ANOVA: F2,44 = 22.967, P < .001 for trial type; F2,44 = 6.38, P = .003 for the interaction). Post hoc analyses revealed that there were no differences in paretic step length during BASELINE+FBK compared with BASELINE for participants who took longer paretic (P = .728) steps, but we found a 21 mm reduction in the paretic step length for participants who took shorter paretic steps (P = .012). The nonparetic step length was not significantly different during BASELINE+FBK in participants who took longer paretic steps (P = .487), but it was approximately 22 mm shorter in participants who took shorter paretic steps (P = .026). Therefore, participants in the shorter paretic group seemed to reduce their stride length in the presence of added feedback. During SYMMETRY, participants who took longer paretic steps increased nonparetic step lengths by 53 ± 9 mm compared with BASELINE+FBK (P < .001), whereas the paretic step length did not change (P = .773). Participants who took shorter paretic steps increased their paretic step length by 19 ± 5 mm during SYMMETRY (P = .004), whereas their nonparetic step length did not differ (P = .741). These results show that participants increased the shorter step length in a manner consistent with the feedback provided.
There were no systematic effects of trial type on the step position (RM-ANOVA: F2,44 = 2.546, P = .104), step time (RM-ANOVA: F2,44 = 1.454, P = .244), or step velocity (RM-ANOVA: F2,44 = 0.271, P = .724) contributions to SLDiff. This indicates that participants used multiple, idiosyncratic strategies to reduce asymmetry during the SYMMETRY trial. The remaining spatiotemporal variables (stride length, cadence, and paretic and nonparetic swing time) did not differ between trials, with the exception of stance time, which differed across trials (F2,44 = 20.946; P < .001). Paretic stance time was 0.06 ± 0.02 s longer during BASELINE+FBK (P = .009) and 0.13 ± 0.024 s longer during SYMMETRY (P < .001). Nonparetic stance time also differed across trials (F2,44 = 19.873; P < .001) and was 0.06 ± 0.02 s longer during BASELINE+FBK (P = .026) and 0.13 ± 0.024 s longer during SYMMETRY (P < .001).
No significant differences in CoT were observed across treadmill trials (RM-ANOVA: F2,44 = 2.293, P = .123; Figure 2B). The lack of differences during BASELINE+FBK indicated that there was no added cost resulting from precise foot placement, contrary to previous results in healthy, young participants, where added feedback increased the metabolic cost by 18%. 32 The lack of significant differences in CoT across trials also indicates that there was no group-level change in CoT during SYMMETRY.
Significant main effects of trial type were observed for the RER (RM-ANOVA: F2,44 = 11.319, P < .001; Figure 2C), which was higher during BASELINE+FBK relative to BASELINE (P = .001), indicating that the precise foot placement requirements were associated with increased CO2 production. Finally, there was no significant effect of trial type on the RPE (RM-ANOVA, F2,32 = 2.829, P = .084; Figure 2D), although there was a trend toward participants having a higher perception of effort during SYMMETRY (Figure 2D).
Independent-samples t-tests indicated no differences in FM scores (P = .613), walking speed (P = .394), or stride length (P = .227) between participants who took longer versus shorter paretic steps. It is also worth noting that there was no association between the magnitude of SLDiff and FM score (r = −0.20; P = .344) or between reductions in SLDiff and FM score (r = 0.408; P = .070).
Behavioral Variables Associated With the Capacity to Reduce Asymmetry Voluntarily
Because the direction and magnitude of SLDiff were not homogeneous across our sample, we next explored how these variables influenced participants’ ability to reduce SLDiff magnitude. We found that the capacity to modify asymmetry depended on the magnitude of baseline SLDiff, the position and velocity contributions to SLDiff, and the interaction between position and velocity contributions and asymmetry direction (Table 2, Figures 3A-3C). The model relating these variables to ΔSLDiff had a predictive R 2 of 0.69. For participants who took longer paretic steps (AsymPositive = 0), having a greater position contribution to SLDiff was associated with greater reductions in step length asymmetry, whereas the velocity contribution was negatively associated with the capacity to reduce step length asymmetry. In contrast, for participants who took shorter paretic steps (AsymPositive = 1), the net effects of the step position and velocity contributions were negligible, indicating that their ability to reduce asymmetry is mostly proportional to their baseline step length asymmetry (Figures 3B-3C).
Parameter Values for Model Relating ΔSLDiff a to Baseline Spatiotemporal Variables.
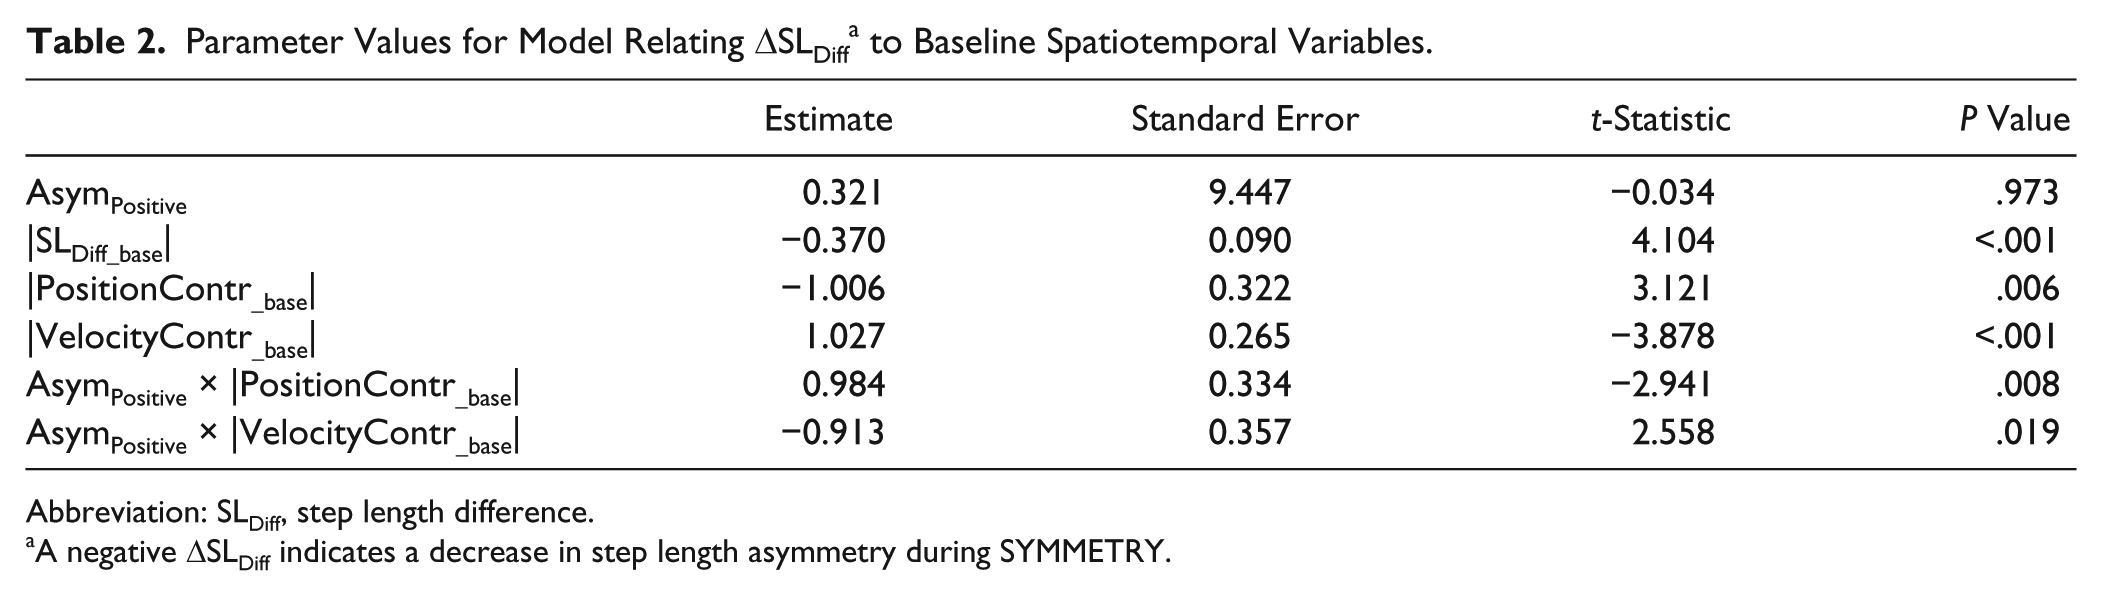
Abbreviation: SLDiff, step length difference.
A negative ΔSLDiff indicates a decrease in step length asymmetry during SYMMETRY.
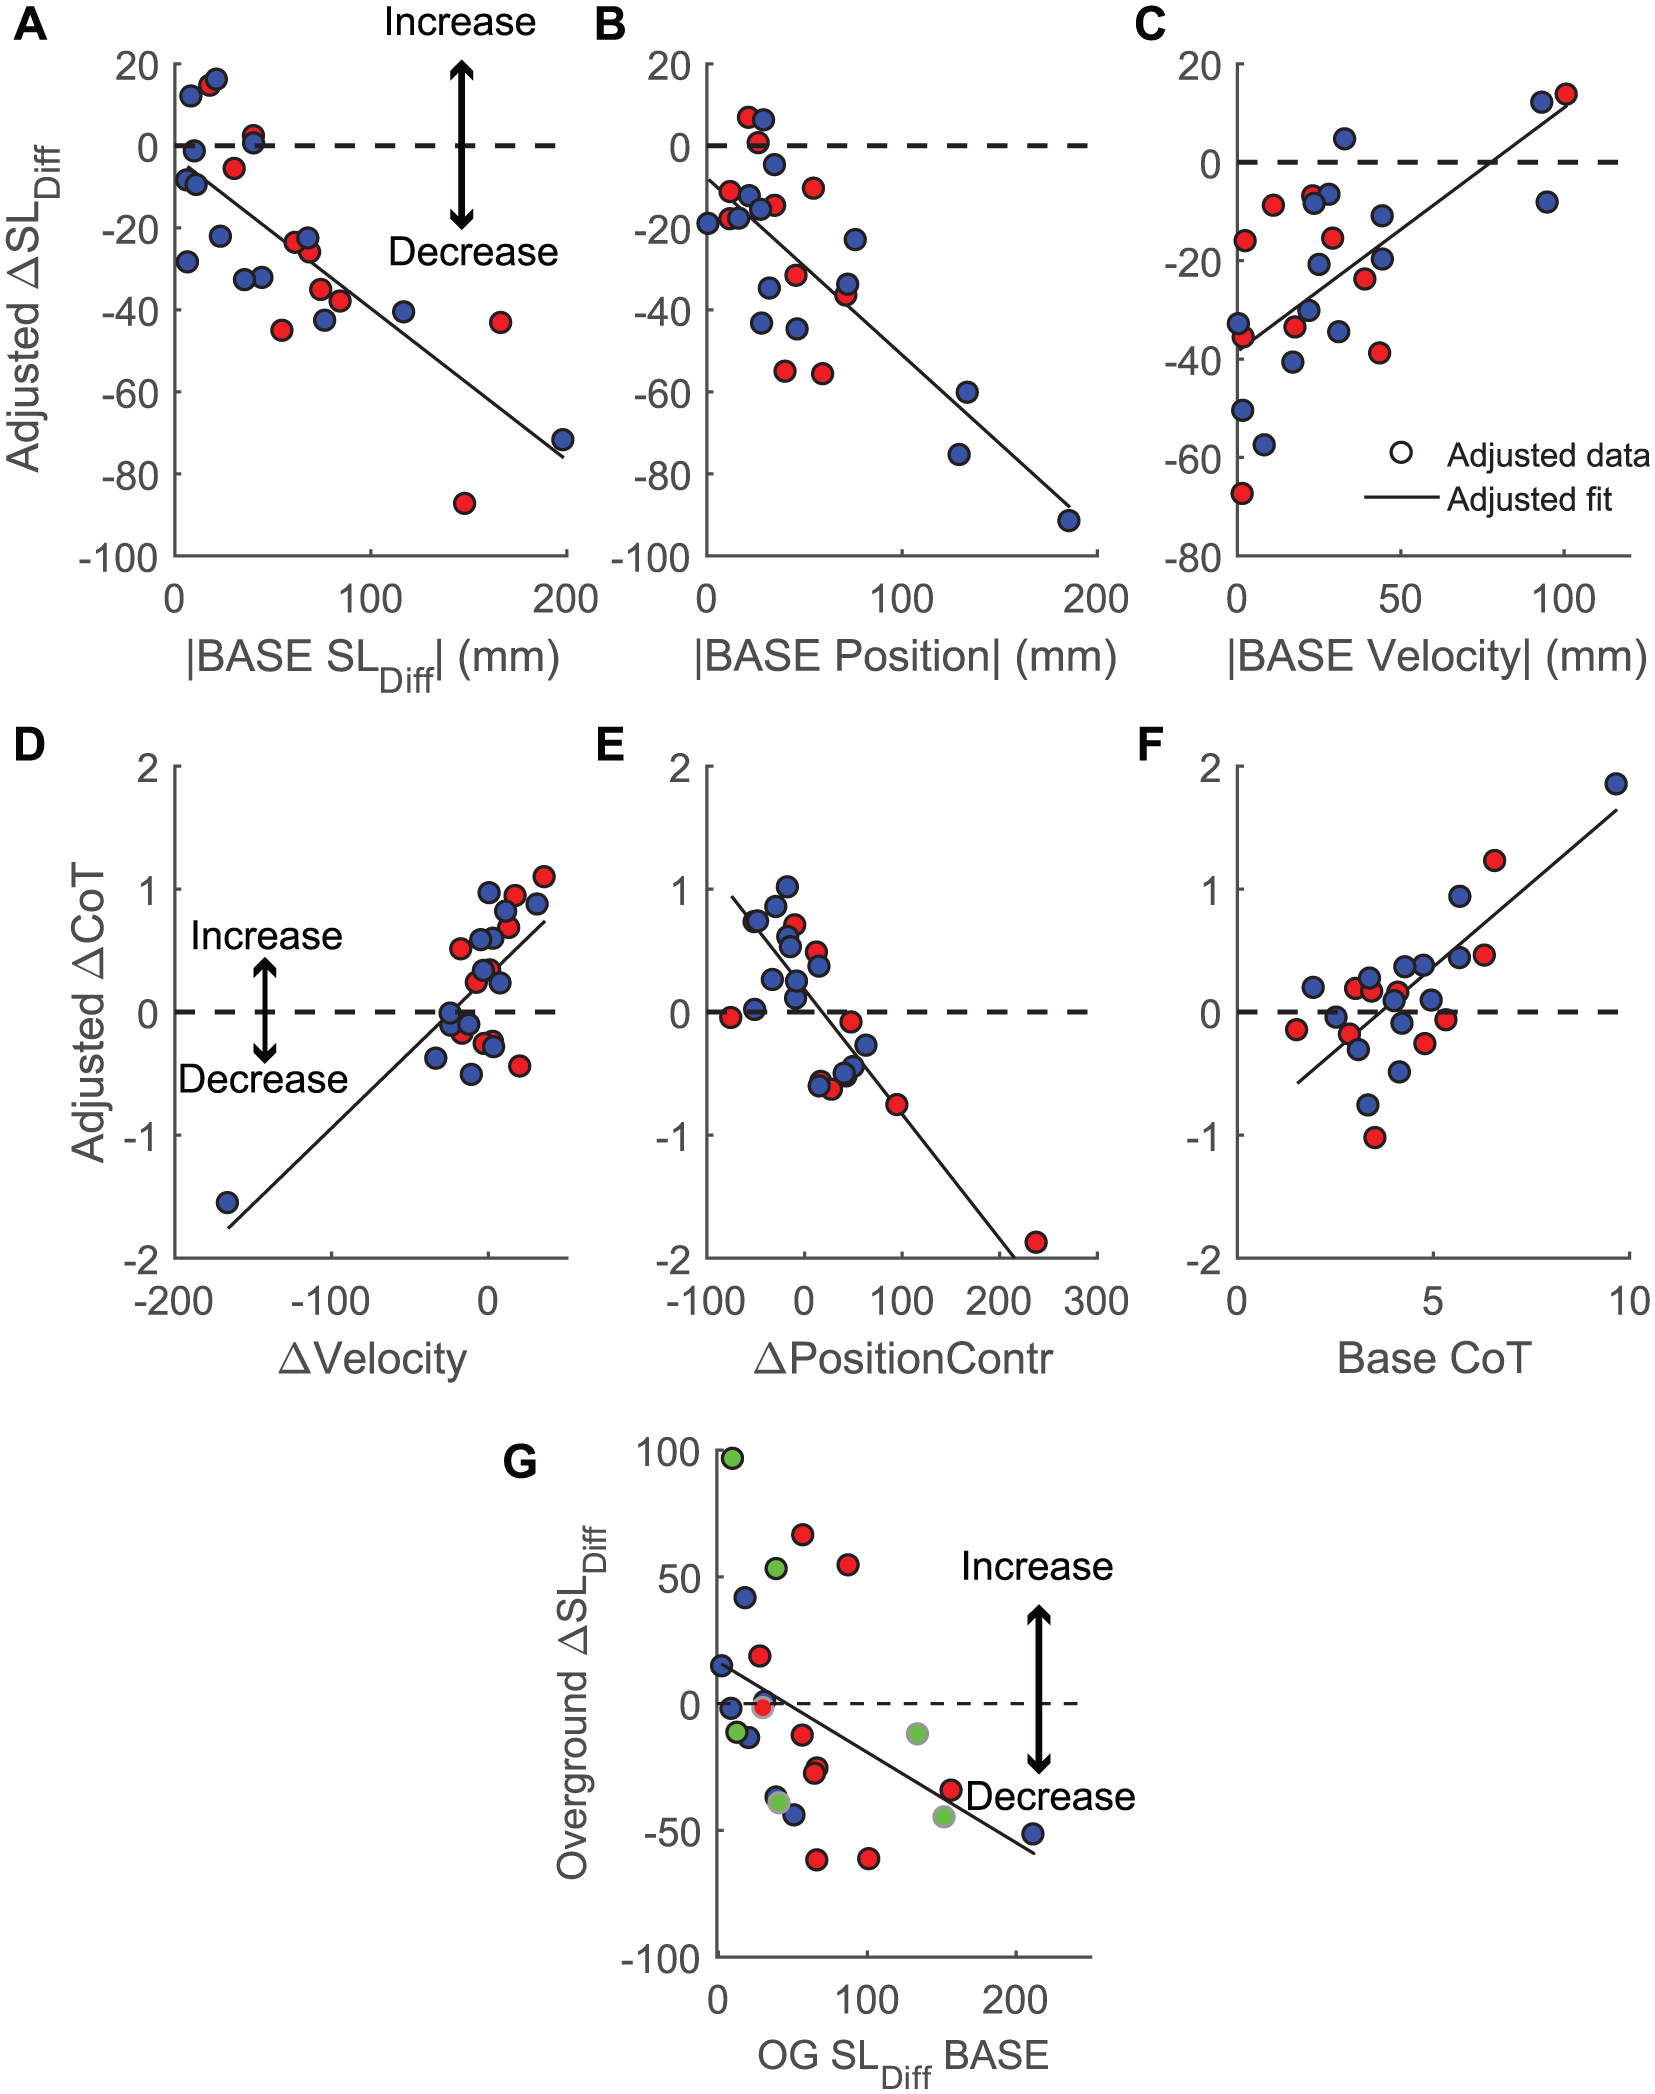
Changes in asymmetry and metabolic cost. (A-C) Adjusted response plots for the individual predictors in the model describing associations between the change in SLDiff and baseline asymmetry magnitude, position, and velocity contributions (Table 2). Adjusted response plots, also known as partial regression plots, show the net effect of the predictor on the x-axis on the response variable in the y-axis when all other variables remain in the model. A negative ΔSLDiff indicates a decrease in asymmetry. Participants who took longer paretic steps are colored in red, whereas participants who took shorter paretic steps are colored in blue. (D-F) Adjusted response plots for the predictors in the model describing associations between ΔCoT and changes in spatiotemporal asymmetry variables (Table 3). A decrease in CoT during SYMMETRY corresponds to a negative ΔCoT. Participants who took longer paretic steps are colored in red, whereas participants who took shorter paretic steps are colored in blue. (G) Change in SLDiff during overground walking after performing the treadmill trials. Participants whose direction of asymmetry differed during overground baseline relative to treadmill baseline are indicated in green. Participants who used canes for overground walking are indicated in the gray outline. Fitted lines are shown in black.
Associations Between Baseline Spatiotemporal Variables and Changes in CoT During SYMMETRY
Contrary to our hypothesis, we did not observe an association between the reduction in step length asymmetry and changes in CoT (Table 3, Figures 3D-3F). However, changes in the CoT were associated with the baseline CoT and changes in the position and velocity contributions to step length asymmetry. In participants who took longer paretic steps (AsymPositive = 0), changes in metabolic cost depended only on their baseline CoT and the change in their velocity contribution to step length asymmetry (ΔVelocityContr). If the change in the velocity contribution was positive, participants were likely to increase the CoT. For participants in the shorter paretic group (AsymPositive = 1), the model was more complex because of the addition of interaction terms. For these individuals, the change in CoT was associated with their baseline CoT, the change in the position contribution to asymmetry (ΔPositionContr), and the change in the velocity contribution. Reductions in CoT were associated with a lower baseline CoT, increases in the position contribution, and reductions in the velocity contribution. The predictive R2 for this model was 0.32. When the outliers in Figures 3D and 3E were removed, the main effect of the velocity contribution was no longer significant. The predictive R2 of this model improved to 0.44.
Parameter Values for Model Relating ΔCoT a to Baseline Spatiotemporal Variables.
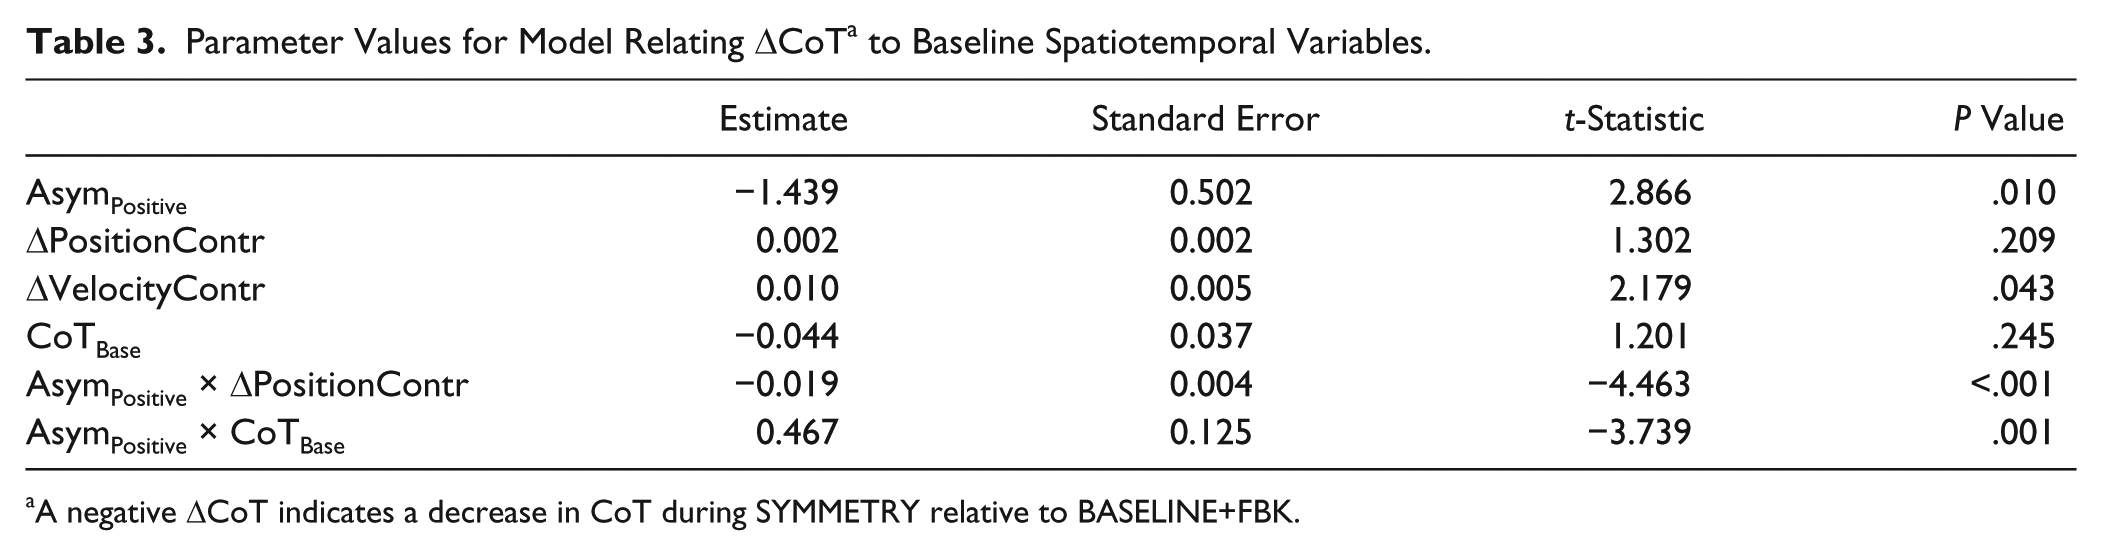
A negative ΔCoT indicates a decrease in CoT during SYMMETRY relative to BASELINE+FBK.
Transfer of Reductions in Asymmetry to Overground Walking
Of the 24 participants, 16 remained less asymmetric during OG POST compared with OG BASE (Figure 3G). At the group level, there were no significant differences in SLDiff magnitude during OG POST compared with OG BASELINE (paired t-test, P = .753), but the change in SLDiff during OG POST varied systematically with the magnitude of OG BASELINE SLDiff. A simple linear model showed that the reduction in SLDiff during OG POST was 25% ± 9% of the OG BASELINE SLDiff (P = .012). However, the predictive R2 of this model was just 0.10. We also observed systematic changes in paretic and nonparetic step lengths during OG POST relative to OG BASELINE. There was a significant increase in paretic step length of 16 ± 31 mm (paired t-test, P = .018) for all participants. Participants who took longer paretic steps also had a significant transfer of the increase in nonparetic step length of 38 ± 45 mm (paired t-test, P = .005), which was the focus of the SYMMETRY trial. No differences in overground speed were found between OG BASELINE and OG POST (paired-samples t-test, P = .405).
Discussion
We sought to determine the factors that predict individual differences in the capacity to voluntarily reduce step length asymmetry and transfer these reductions to overground walking in people poststroke. We also assessed how changes in asymmetry affect the metabolic cost of walking. Our results show that when provided with the proper visual feedback, individuals poststroke demonstrated the capacity to reduce step length asymmetry voluntarily,44,45 and the capacity to reduce asymmetry varied systematically with the direction of baseline asymmetry. Participants who took longer paretic steps had a greater capacity to reduce asymmetry than participants who took shorter paretic steps. Transfer of step length changes to overground walking was also dependent on the baseline direction of the asymmetry, with participants who took longer paretic steps maintaining increases in paretic and nonparetic step lengths, whereas participants who took shorter paretic steps only maintained slight increases in paretic step length.
Asymmetry Direction Influences the Capacity to Voluntarily Reduce Step Length Asymmetry
Many of our participants had sufficient residual capacity to reduce step length asymmetry. However, the extent of this capacity depended on multiple factors. Participants’ ability to reduce asymmetry was positively correlated with their baseline SLDiff because more asymmetric participants have a greater range for asymmetry reduction. Reductions in asymmetry also depended on the baseline step position and step velocity contribution to asymmetry. For participants who took longer paretic steps, the step position and step velocity contributions to asymmetry were, respectively, positively and negatively correlated with the ability to reduce asymmetry. This may result from participants with large step velocity asymmetries having difficulty progressing over the paretic limb, thus limiting their ability to reduce asymmetry. It could be argued that more than half of the participants who took shorter paretic steps had negligible asymmetries, which is why they did not experience significant reductions as a group. However, this was addressed in the regression model through the inclusion of baseline asymmetry magnitude as a predictor. Because no interactions between asymmetry magnitude and direction were observed, this suggests that the effects of asymmetry direction are independent of asymmetry magnitude. Therefore, smaller reductions in asymmetry in individuals who took shorter paretic steps were likely a result of a reduced capacity to lengthen their short paretic step, potentially because of deficits in paretic hip and knee flexion.16,18,20,46
Individual Differences in the Effects of Asymmetry Reductions on Metabolic Cost
Although we did not observe consistent group-level changes in metabolic cost during SYMMETRY or associations between step length asymmetry reduction and CoT, we found that changes in metabolic cost depended on participants’ asymmetry direction, baseline CoT, and changes in position and velocity contributions to asymmetry. Overall, participants who took shorter paretic steps were likely to increase CoT when reducing step length asymmetry, especially if they had a high baseline CoT, which was indicative of slower speed and greater impairment. This is in agreement with previous research that found that participants with who are less impaired have increased residual capacity and are more responsive to gait rehabilitation interventions. 47
In participants who took longer paretic steps, reducing step velocity asymmetry was beneficial for reducing metabolic cost. This suggests that equalizing the velocity with which the trunk progresses over each limb may be beneficial for improving walking economy. Overall, these results demonstrate that reducing step length asymmetry is not a uniformly effective approach to reduce CoT across the entire poststroke population but instead depends on individual differences in the direction of asymmetry and baseline CoT.
The lack of group-level reductions in CoT resulting from reductions in step length asymmetry differs from previous studies showing that reductions in asymmetry resulting from 12 weeks of treadmill training with functional electrical stimulation (FastFES) were associated with reductions in metabolic cost.10,48 One potential explanation for differences between our results and those reported previously is that our participants had reductions in asymmetry that were approximately 4 times greater than those resulting from the FastFES intervention.10,48 Therefore, it is possible that the associations reported previously may not hold for larger reductions in asymmetry. A second potential explanation is that reductions in metabolic cost following FastFES training were a result of training-dependent increases in the functional capacity of the plantarflexors.10,18,46,48 FES training may reduce impairment and increase walking speed, which, in our study, would translate to decreased baseline CoT. Finally, it is possible that CoT reductions do not occur in all participants after a single session of SYMMETRY walking. Whether similar effects would be observed in a longitudinal version of our study remains to be seen.
Transfer of Asymmetry Reductions to Overground Walking
Previous studies have examined the transfer of training from a treadmill to overground walking using resistive forces 49 or using split-belt training. 50 Training with resistive forces led to transfer of increases in short step length to overground walking, but this was accompanied by a decrease in the long step. This is contrary to our results because we saw an increase in paretic step lengths for all participants and an increase in nonparetic step lengths for participants who took longer paretic steps. Our results are more consistent with the transfer observed after split-belt training, with participants also showing an approximately 25% reduction in step length asymmetry after 4 weeks of training, with 6/11 individuals becoming more symmetric after training compared with 16/24 in the current study.
We observed differences in asymmetry magnitude and direction overground compared with on the treadmill for the 4 participants who used canes when walking overground. Two of these participants had no marked asymmetry overground and marked asymmetry on the treadmill, whereas the other 2 participants had asymmetries in different directions overground versus on the treadmill. Surprisingly, the SLDiff during OG POST was equal to or less than during OG BASE for each of these participants (ΔSLDiff of 1, 44, 12, and 38 mm). These reductions in asymmetry may have resulted, in part, from the fact that treadmill walking increased limb extension and led to bilateral changes in activation of knee extensor musculature, as previously reported. 51
One of the main limitations of our protocol is the use of a single session approach, which may not have allowed for participants to become fully familiarized with the novelty of the task. However, we attempted to address this issue by providing a short practice period at the beginning of the session. In addition, by having only a single session, we could not capture the consolidation of the reductions in asymmetry that could have occurred across multiple sessions. 52 Another limitation is the fact that modifying a single gait variable inherently changes other variables. In our case, increasing the shorter step length to match the long step length increases the overall stride length and reduces cadence. It is possible that the increase in metabolic cost resulting from the decreased cadence 53 could have masked any potential reductions in metabolic cost during SYMMETRY.
Another limitation of the study is that participants were required to hold on to a handrail. Given that stability requirements and fall risk were minimized by the use of the handrail and harness, we cannot assess whether the same reductions in asymmetry achieved here would be possible if participants had to control stability actively. There, minimizing fall risk is potentially more relevant to the participant than reducing asymmetry. Finally, step length asymmetry is not necessarily the most important manifestation of locomotor impairment but just one of myriad features that change during gait in individuals poststroke. Given the lack of uniform effects of asymmetry reduction on CoT, other variables that influence the energetic cost of walking such as reduced paretic propulsion, hip hiking, and circumduction should be explored as potential targets for reducing CoT.
In conclusion, we have shown that patient-specific differences in the capacity to voluntarily reduce step length asymmetry can be largely explained by differences in baseline characteristics of their walking pattern. These differences likely stem from the heterogeneity of deficits in support, propulsion, and limb advancement on the paretic limb. The energetic effects of reductions in asymmetry also depended on the patient-specific impairment, such that those individuals who took longer paretic steps were more likely to see reductions in CoT when reducing asymmetry, whereas those individuals who took shorter paretic steps were less likely to benefit from reducing asymmetry. Overall, our results highlight the need to characterize and account for interindividual differences in locomotor function when considering the use of standardized training approaches.54,55
Footnotes
Acknowledgements
We would like to thank all participants for volunteering for this study. We would also like to acknowledge Lindsey Trejo, Chang Liu, and Aram Kim for assistance with data collection. Finally, we would like to thank Dr Carolee Winstein, Dr Sara Mulroy, and Dr Nicolas Schweighofer for their valuable feedback.
Declaration of Conflicting Interests
The authors declared no potential conflicts of interest with respect to the research, authorship, and/or publication of this article.
Funding
The authors disclosed receipt of the following financial support for the research, authorship, and/or publication of this article: This study was funded by the American Heart Association postdoctoral fellowship 16POST29610000 to Natalia Sánchez.