
Abstract
Stroke survivors often have a slow, asymmetric walking pattern. They also walk with a higher metabolic cost than healthy, age-matched controls. It is often assumed that spatial-temporal asymmetries contribute to the increased metabolic cost of walking poststroke. However, elucidating this relationship is made challenging because of the interdependence between spatial-temporal asymmetries, walking speed, and metabolic cost. Here, we address these potential confounds by measuring speed-dependent changes in metabolic cost and implementing a recently developed approach to dissociate spatial versus temporal contributions to asymmetry in a sample of stroke survivors. We used expired gas analysis to compute the metabolic cost of transport (CoT) for each participant at 4 different walking speeds: self-selected speed, 80% and 120% of their self-selected speed, and their fastest comfortable speed. We also computed CoT for a sample of age- and gender-matched control participants who walked at the same speeds as their matched stroke survivor. Kinematic data were used to compute the magnitude of a number of variables characterizing spatial-temporal asymmetries. Across all speeds, stroke survivors had a higher CoT than controls. We also found that our sample of stroke survivors did not choose a self-selected speed that minimized CoT, contrary to typical observations in healthy controls. Multiple regression analyses revealed negative associations between speed and CoT and a positive association between asymmetries in foot placement relative to the trunk and CoT. These findings suggest that interventions designed to increase self-selected walking speed and reduce foot-placement asymmetries may be ideal for improving walking economy poststroke.
Introduction
Hemiparetic gait is characterized by a number of abnormalities relative to able-bodied walking. For example, stroke survivors walk more slowly than healthy individuals 1 and with a higher metabolic cost.2,3 In addition, their gait is typically asymmetric, having different values of spatial-temporal and kinetic variables between the paretic and nonparetic sides. These include left-right differences in stance and swing times, 4 double-support times, 5 joint power, joint excursions,6,7 and step lengths.8-11 Functionally, step length asymmetry is associated with a reduced contribution of the paretic plantar flexors to propulsion 10 and slower self-selected walking speeds. 12 This negative association between spatial-temporal asymmetry and speed and the assumption that asymmetry represents suboptimal behavior often leads to a general conclusion that reducing asymmetry should improve locomotor function.
Indeed, reducing asymmetry is a common goal of rehabilitation poststroke,4,13,14 and this approach implicitly assumes that symmetric gait is somehow advantageous for these individuals. However, only recently have approaches for improving step length symmetry become available. For example, repeated sessions of adaptation to walking on a split-belt treadmill,15,16 fast treadmill training combined with functional electrical stimulation, 17 and unilateral step training 18 can each produce lasting improvements in step length asymmetry. Although reducing asymmetry is a common therapeutic objective, it is possible that an asymmetric walking pattern could be the optimal pattern for certain individuals, perhaps as a compensatory strategy to account for reduced paretic propulsion 9 or as a byproduct of asymmetries in neural control or limb mechanics. 19 Consistent with these explanations, single joint kinematics and kinetics, particularly at the hip, show a positive relationship between asymmetry and gait speed in individuals with stroke. 20 In other words, increasing asymmetry can be beneficial in some instances if gait speed is used as the primary performance criterion.
A potential disadvantage of asymmetry is the possibility of a heightened metabolic cost. Two recent studies have explored this possibility by having participants adapt to walking on a split-belt treadmill where one belt moves faster than the other.21,22 Both studies found that walking on a split-belt treadmill resulted in a higher metabolic cost than walking with the belts moving at the same speeds. Moreover, it was demonstrated that the magnitude of step length asymmetry observed during walking on a split-belt treadmill was positively correlated with metabolic cost. 22 Another study showed that asymmetries in step timing can lead to increases in the mechanical and metabolic cost of walking, potentially as a result of increased power absorption and generation during the double-support and single-support phases of the gait cycle, respectively. 23 However, although these studies provided evidence that asymmetric walking patterns are energetically costly in able-bodied individuals, our understanding of the degree to which asymmetry influences metabolic cost in stroke survivors remains incomplete. This relationship is made more complex by the potential confounding effect of walking speed on the assessment of the metabolic cost of asymmetry. Separate studies have shown that increasing walking speed can improve the symmetry of some spatial-temporal variables 24 and reduce the oxygen cost of transport (CoT). 25 However, whether walking speed and spatial-temporal asymmetry independently influence the metabolic cost of walking poststroke remains unknown.
Recently, Awad et al 17 reported the results of a longitudinal study exploring associations between spatial-temporal asymmetries and the metabolic cost of walking following a 12-week rehabilitation intervention. Although there was no significant association between metabolic cost and step length asymmetry at baseline, pre/post changes in step length asymmetry were a significant predictor of changes in metabolic cost. The observation that changes in step length asymmetry, but not baseline step length asymmetry, were predictive of metabolic cost may result from a masking of the specific aspects of step length asymmetry that are energetically costly. For example, both where the feet are placed relative to the pelvis at foot strike (spatial) and variables related to the timing between foot strikes (temporal) can independently influence step length asymmetry, 11 and these variables may be differentially influenced by interventions that modify overall step length asymmetry. Thus, it is possible that spatial and temporal factors independently affect the metabolic cost of locomotion poststroke. Although the relative spatial and temporal contributions to step length asymmetry poststroke have been documented, 11 the extent to which these contributions affect metabolic cost has not been established.
Here, in a cross-sectional study, we asked whether spatial-temporal asymmetries in individuals poststroke could explain interindividual differences in the metabolic CoT. We considered measures of asymmetry in step lengths, swing times, stance times, double-support time, and spatial and temporal contributions to step length asymmetry because these variables have been suggested to be the most suitable for quantifying asymmetry in stroke survivors.11,26 Identifying the relationship between spatial-temporal measures of asymmetry and the energetic cost of walking is critical for providing a performance-based rationale for improving, ignoring, or perhaps encouraging asymmetric walking patterns in stroke survivors. For example, asymmetries that exhibit a positive association with metabolic cost would make likely targets for interventions aimed at improving walking economy poststroke.
Materials and Methods
Participants
A total of 30 individuals participated in this study, including 15 individuals who were more than 6 months poststroke (4 female, 58 ± 14 years old, Table 1) and 15 age- and gender-matched healthy controls (4 female, 58 ± 11 years old). A portion of the participant-specific spatial-temporal data from the stroke survivors has been reported previously. 11 Potential participants were excluded from the study if they had any other neurological disorders or orthopedic conditions that interfered with their ability to walk. The experimental protocol was approved by the Johns Hopkins Medicine Institutional Review Board and conformed to the standards set by the Declaration of Helsinki. All participants provided written informed consent before testing.
Clinical Characteristics of Stroke Survivors.
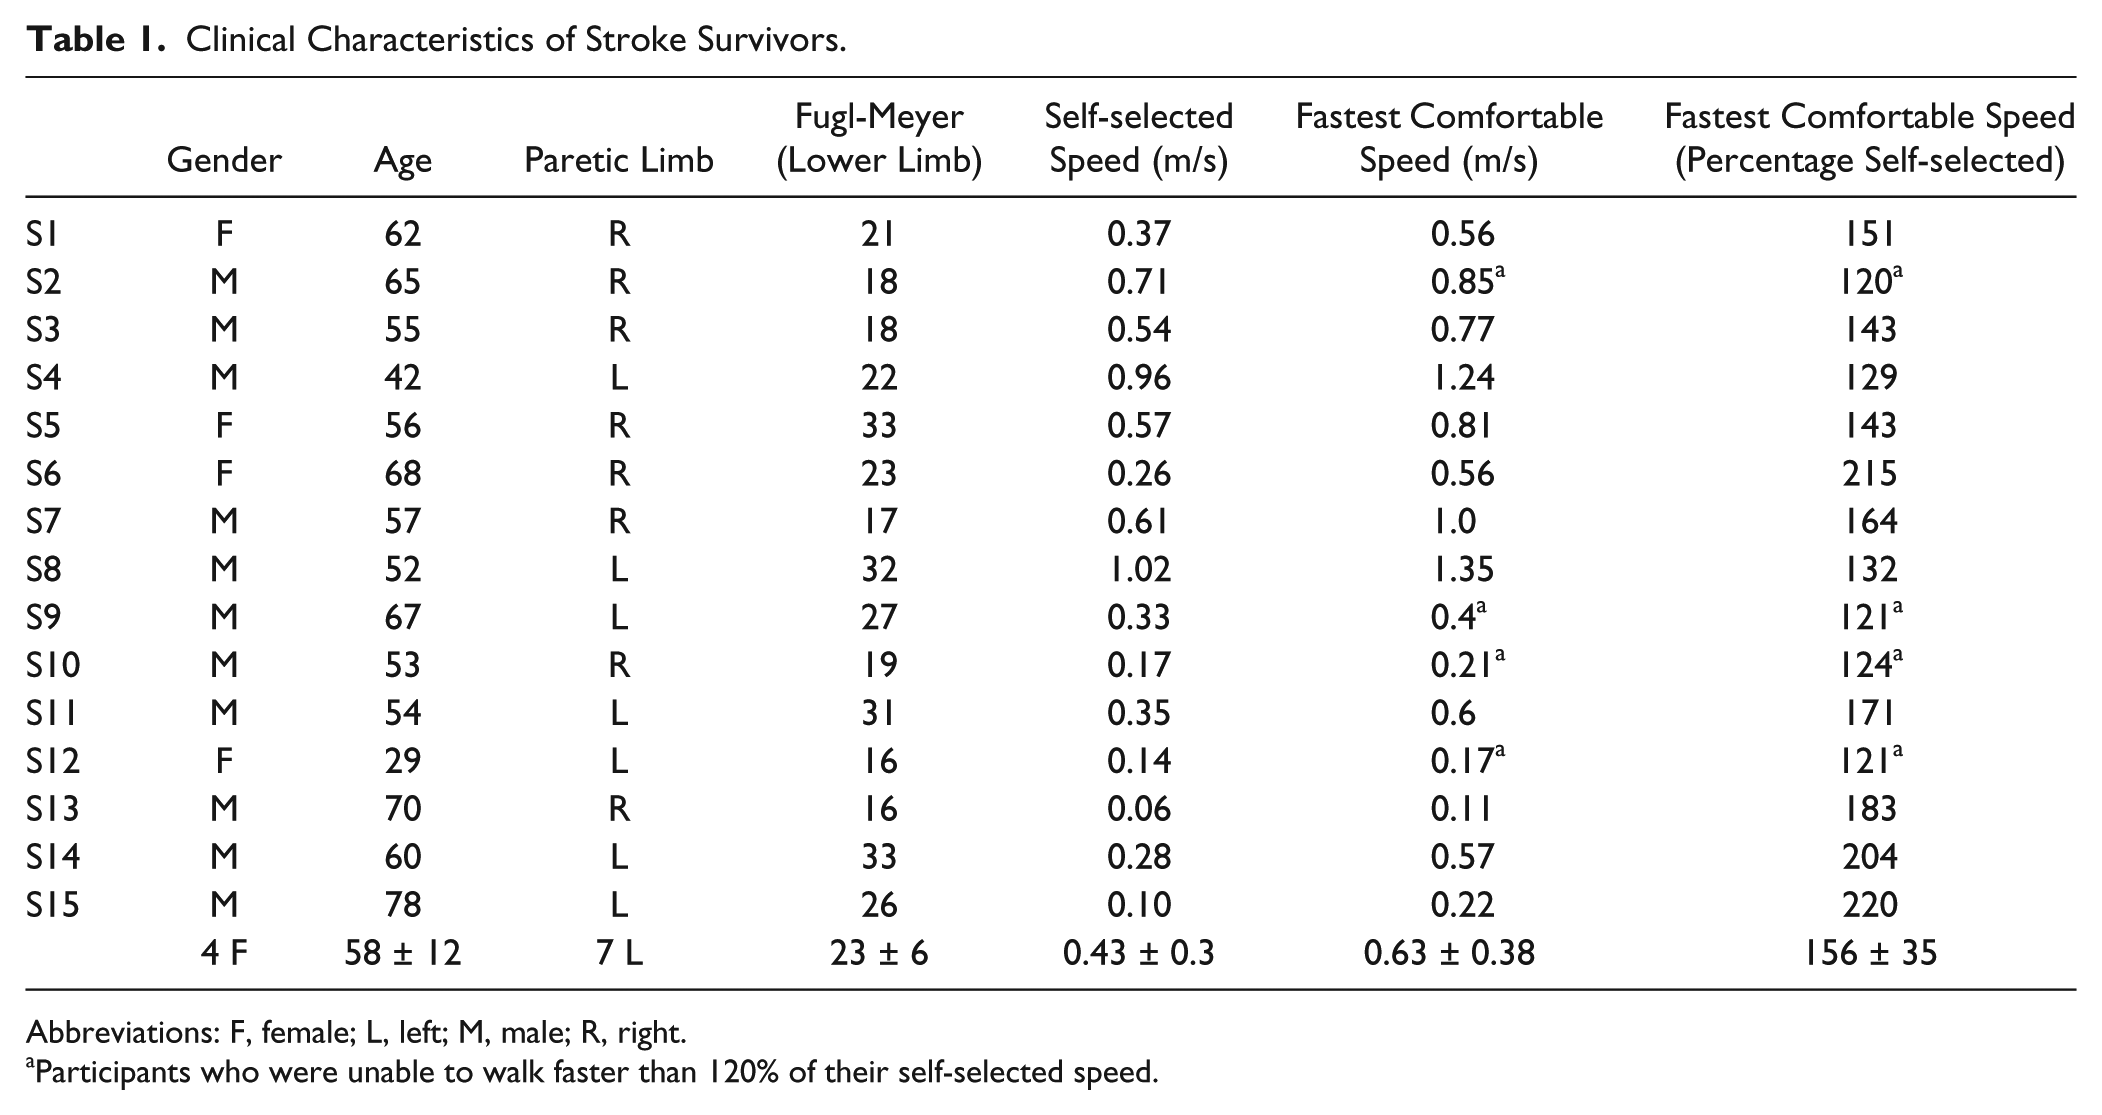
Abbreviations: F, female; L, left; M, male; R, right.
Participants who were unable to walk faster than 120% of their self-selected speed.
Data Collection
Testing Paradigm
The goal of this study was to determine if spatial-temporal variables describing asymmetries between limbs (interlimb asymmetries) could explain the increased energy cost of walking in stroke survivors. Each stroke survivor walked on a treadmill (Woodway USA, Waukesha, WI) for 3 to 4 bouts of 5 minutes each. Each individual’s self-selected speed on the treadmill was determined by progressively increasing treadmill speed until the participant acknowledged that the speed was similar to what they would use on a casual walk. The speed was then increased until the participants felt that they were at the maximum possible speed that they could hold for 5 minutes, and this was considered their maximum comfortable treadmill speed. We then had each individual complete four 5-minute bouts of walking at these 2 speeds as well as 80% and 120% of their self-selected speed. Four individuals were unable to walk faster than 120% of their self-selected speed, and they therefore walked at only 3 different speeds (Table 1). We chose these values to assess walking ability across each person’s feasible range of walking speeds and to broaden our sample for assessing potential associations between spatial-temporal variables and metabolic cost. The speeds were presented in a random order, and each control participant walked for 5-minute bouts at the same set of speeds as the stroke survivor with whom they were matched. We should note that our objective was not to determine if CoT varied between healthy individuals and stroke survivors when each walked at their own self-selected speed. Our control participants walked at the same speed as our stroke survivors to determine the extent to which slow speed alone contributed to the increased CoT post-stroke. All participants (stroke and control) held on to a handrail in front of the treadmill throughout the experiment. They were simply instructed to “hold on to the handrail during all walking bouts” but were not provided with any explicit instruction about how much force to apply to the rails. All participants received rest breaks of approximately 5 minutes between each bout of walking to minimize the effects of fatigue during the study.
Expired Gas Analysis
We measured each participant’s rate of oxygen consumption and carbon dioxide production using a TrueOne 2400 metabolic measurement system (Parvomedics, UT). After the system was allowed to warm up for 30 minutes, the gas analyzer and pneumotachometer were calibrated to manufacturer specifications. Expired gas was sampled on a breath-by-breath basis, and the rates of oxygen consumption and carbon dioxide production were computed. Before the participants began the walking trials, metabolic data were collected for 5 minutes during quiet standing. The average values for this standing baseline were subtracted from the metabolic measurements made during all subsequent walking periods to yield net metabolic rate.
Kinematics
We recorded kinematic data with a digital camera system (Optotrak Certus, Northern Digital Inc, Waterloo, ON) at 100 Hz. Infrared-emitting markers were placed on the following anatomical landmarks bilaterally: the acromion process (shoulder), iliac crest (pelvis), greater trochanter (hip), lateral femoral epicondyle (knee), lateral malleolus (ankle), and fifth metatarsal (toe). Foot-strike and lift-off were determined by the peak anterior and posterior positions of the toe and ankle markers, respectively, on each limb. 27
Data Analysis
Metabolic Cost of Walking
We quantified the metabolic cost of walking by computing metabolic power during the last 2 minutes of each walking bout. Metabolic power was calculated from the rate of oxygen consumption and carbon dioxide production using a standard equation. 28 The metabolic power for standing was subtracted from all subsequent walking values, and the result was normalized to body mass to yield net metabolic power per kilogram. We then computed the net metabolic CoT by normalizing net metabolic power by walking speed.
Spatial-Temporal Variables
Spatial-temporal variables commonly associated with gait asymmetry were calculated using 3D marker positions. These variables included differences in step length, stance time, double-support time, and the spatial and temporal contributions to step length difference. 11 Each of our spatial-temporal variables characterizing asymmetry was computed by subtracting the values on the paretic side from the nonparetic values. Step length was defined as the fore-aft distance between ankle markers at foot strike. Paretic and nonparetic step lengths were measured at foot-strike of the paretic limb and nonparetic limb, respectively. Stance time was defined as the period of time when each foot was in contact with the treadmill. Double-support time was defined as the period of time within each step cycle when both feet were in contact with the ground. Paretic double-support time was defined as the time between foot-strike of the nonparetic limb and toe-off of the paretic limb. Similarly, nonparetic double-support time was defined as the time between foot-strike of the paretic limb and toe-off of the nonparetic limb. Finally, single-support time for the paretic and nonparetic limbs was defined as the time within each step cycle between lift-off and subsequent foot-strike of the contralateral limb.
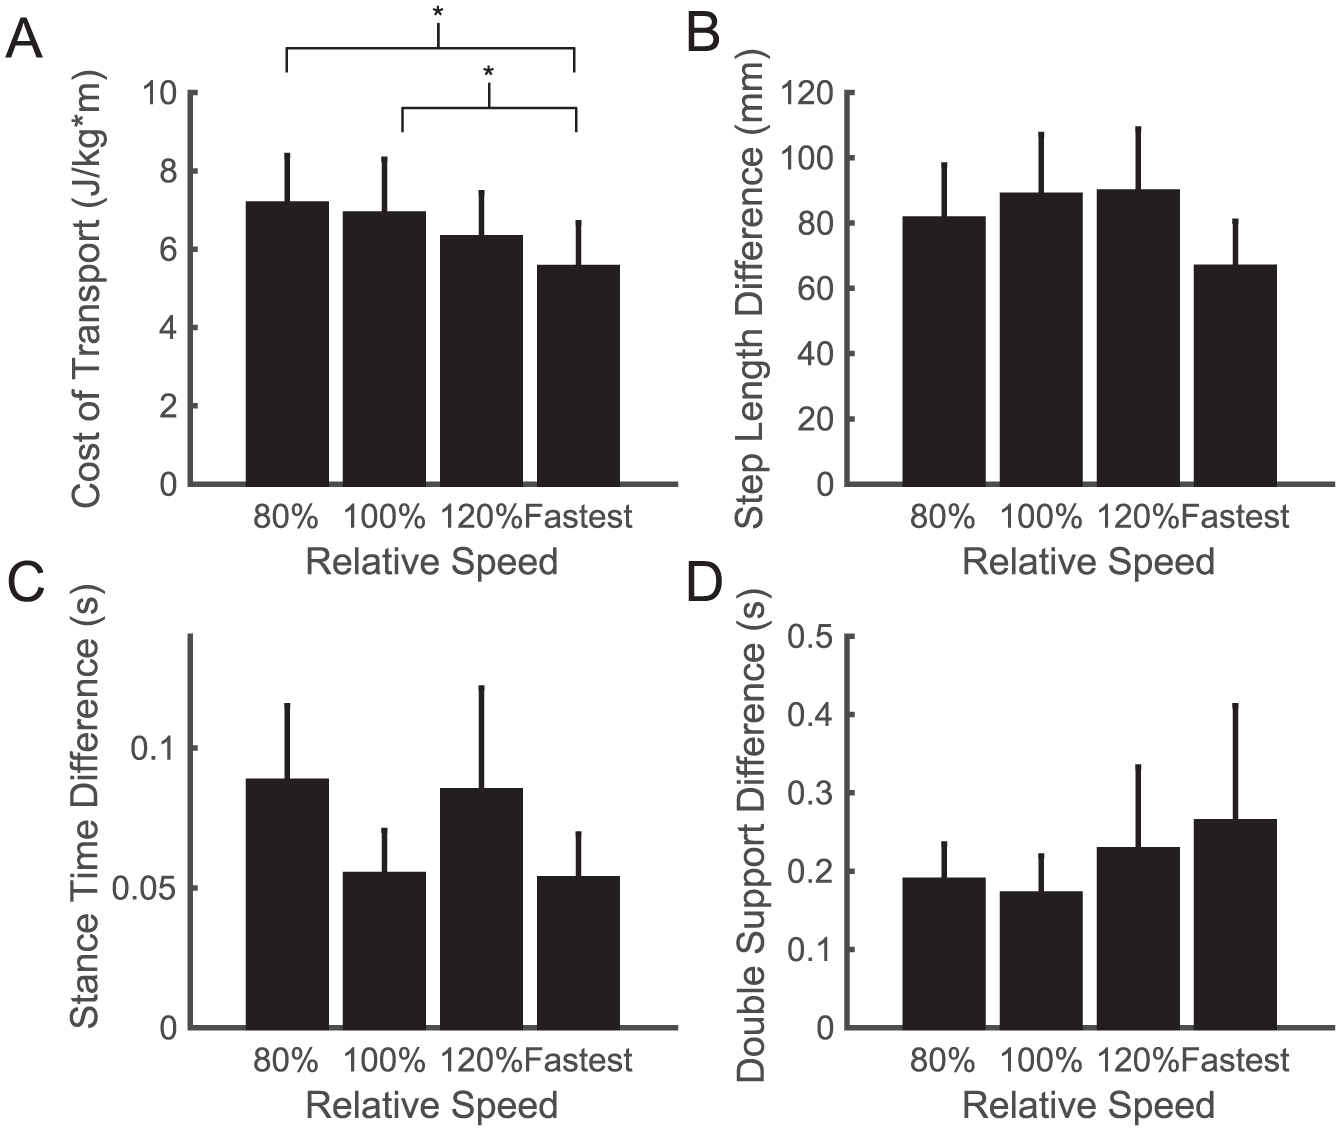
We also characterized contributions to step length asymmetry arising from left-right differences in where the feet are placed relative to the body (step position contribution), differences in the timing between foot-strikes (step time contribution), and differences in the velocity of the body relative to the trailing limb (step velocity contribution), according to the following equations11,29:


Equations 1 and 2 describe the nonparetic and paretic step lengths (SLnp and SLp, respectively) in terms of the following variables: αnp represents the difference in how far the foot is placed in front of the trunk on a nonparetic step relative to the previous paretic step. Similarly, αp represents the difference in how far the foot is placed in front of the trunk on a paretic step relative to the previous nonparetic step. vp and vnp represent the average speed of the body relative to the foot during paretic and nonparetic stance, respectively. tp represents the time elapsed from the paretic to nonparetic foot-strike, and tnp represents the time elapsed from the nonparetic to the paretic foot-strike. By defining step length asymmetry as the difference between nonparetic and paretic step lengths (Equation 3), substituting Equations 1 and 2 into Equation 3 and rearranging terms, we arrive at a representation of step length asymmetry in terms of step position (term 1), step time (term 2), and step velocity (term 3) contributions (Equation 4). The step position contribution reflects asymmetries in leading-limb flexion, whereas the sum of the step time and step velocity asymmetries reflects asymmetries in the location of the trailing limbs relative to the trunk at foot-strike.
Statistical Analysis
We used the Wilcoxon signed rank test to determine if the differences in CoT between controls and individuals with stroke was significantly different from zero because these data were not normally distributed (Lilliefors’ test, P = .001). We also used a 1-way repeated-measures ANOVA with speed and CoT as the independent and dependent variables, respectively, to test whether our sample of stroke survivors chose a self-selected walking speed that minimized their CoT. Linear mixed-effect models were used30,31 to determine if variables characterizing interlimb asymmetry were significant predictors of CoT. Candidate variables for the model included speed, the magnitude of each of the spatial-temporal asymmetries, and the lower-limb Fugl-Meyer score as continuous predictors; group (stroke or control) as a grouping variable; and a random intercept for each participant. We included a random intercept for each participant to account for between-subjects variability in CoT as a result of unobservable factors. We used the magnitudes, and not the signed values, of the spatial-temporal asymmetries as our independent variables to test the specific hypothesis that asymmetry, irrespective of sign, is associated with an increased metabolic cost of walking. We assessed the severity of multicollinearity by computing variance inflation factors (VIFs). We also computed DFBETAs for each participant to identify influential outliers. Finally, we determined if a random-effects model was necessary by testing whether the variance of the random effect was nonzero using an exact likelihood ratio test. 32 All statistical procedures were performed in the R environment for statistical computing (The R Foundation for Statistical Computing, Vienna, Austria).
Results
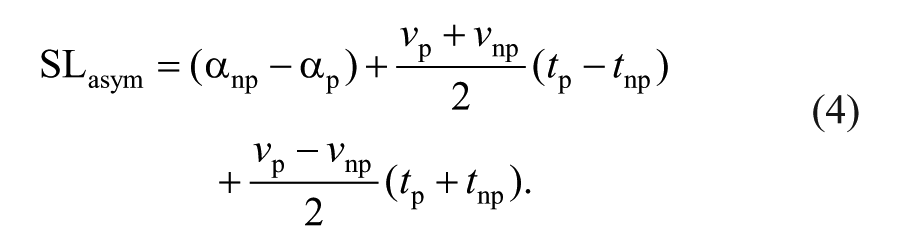
Consistent with previous reports,2,33 we found that stroke survivors walked with a higher energetic cost than healthy, age-matched controls at matched speeds (Figure 1). Across all speeds, the average difference in CoT between stroke survivors and controls was 2.9 ± 0.6 W/kg m (Wilcoxon signed rank test, P < .001), and out of 56 total walking bouts, we only observed 9 bouts where controls had a higher CoT than their matched stroke survivor. For these 9 bouts, there was no discernable association between CoT and speed or impairment to explain why the controls were less economical than the stroke survivors.
Metabolic cost of transport for stroke survivors and age-matched controls for all walking speeds. Each data point represents a single bout of walking, and each line connects matched walking speeds between a stroke survivor and their control. There are 4 pairs of data points for each stroke survivor and control, with the exception of those individuals who only completed 3 bouts of walking. Each color represents a different stroke survivor and control pair.
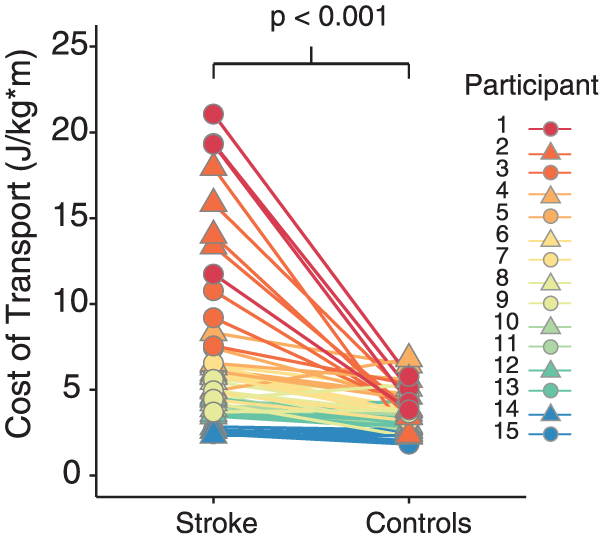
We also found that our stroke survivors did not choose to walk at a speed that minimizes the metabolic CoT (Figure 2A), contrary to typical observations in healthy individuals.34,35 There was a significant effect of speed on the CoT (F3,38 = 3.78; P = .02), and stroke survivors had a lower CoT at their fastest comfortable speed than at their self-selected speed (P = .01) or 80% of their self-selected speed (P = .004). Importantly, this speed dependence was not a byproduct of differences in asymmetry across speeds. A within-subject analysis revealed that there were no statistically significant systematic differences in step length difference (F3,38 = 0.67; P = .57; Figure 2B), double-support difference (F3,38 = 0.47; P = .70; Figure 2C), or stance time difference across speeds (F3,38 = 0.67; P = .58; Figure 2D).
Speed-dependent differences in (A) metabolic cost of transport, (B) absolute step length difference, (C) absolute stance time difference, and (D) absolute double-support time difference across walking speeds for our sample of stroke survivors. For the first 3 conditions, walking speed is expressed relative to each individual’s self-selected speed. Across the group, the fastest comfortable speed represented a variable percentage of each individual’s self-selected speed and is simply denoted “Fastest.” This figure only includes cases when an individual’s fastest speed was greater than 120% of the self-selected speed. Four individuals were unable to walk faster than 120% of their self-selected speed, and therefore, did not have data points for the fastest comfortable speed. Asterisks represent statistically significant differences at the P < .05 level.
We found a wide range of spatial-temporal asymmetries in our sample of stroke survivors (Figure 3). Step length difference ranged from −205 to 211 mm, and the magnitude of this difference had a mean ± SD of 83 ± 65 mm. Only 4 of the 15 participants consistently took longer steps with the nonparetic limb. Two additional participants had longer nonparetic steps when walking at their fastest comfortable speed, but they otherwise took longer steps with the paretic limb. Double-support time difference ranged from −326 to 491 ms, and the magnitude of the double-support time difference had a mean ± SD of 209 ± 324 ms. All but 3 participants had a longer nonparetic double-support time. Finally, stance time difference ranged from −15 to 160 ms, with stance time difference magnitude having a mean ± SD of 72 ± 98 ms.
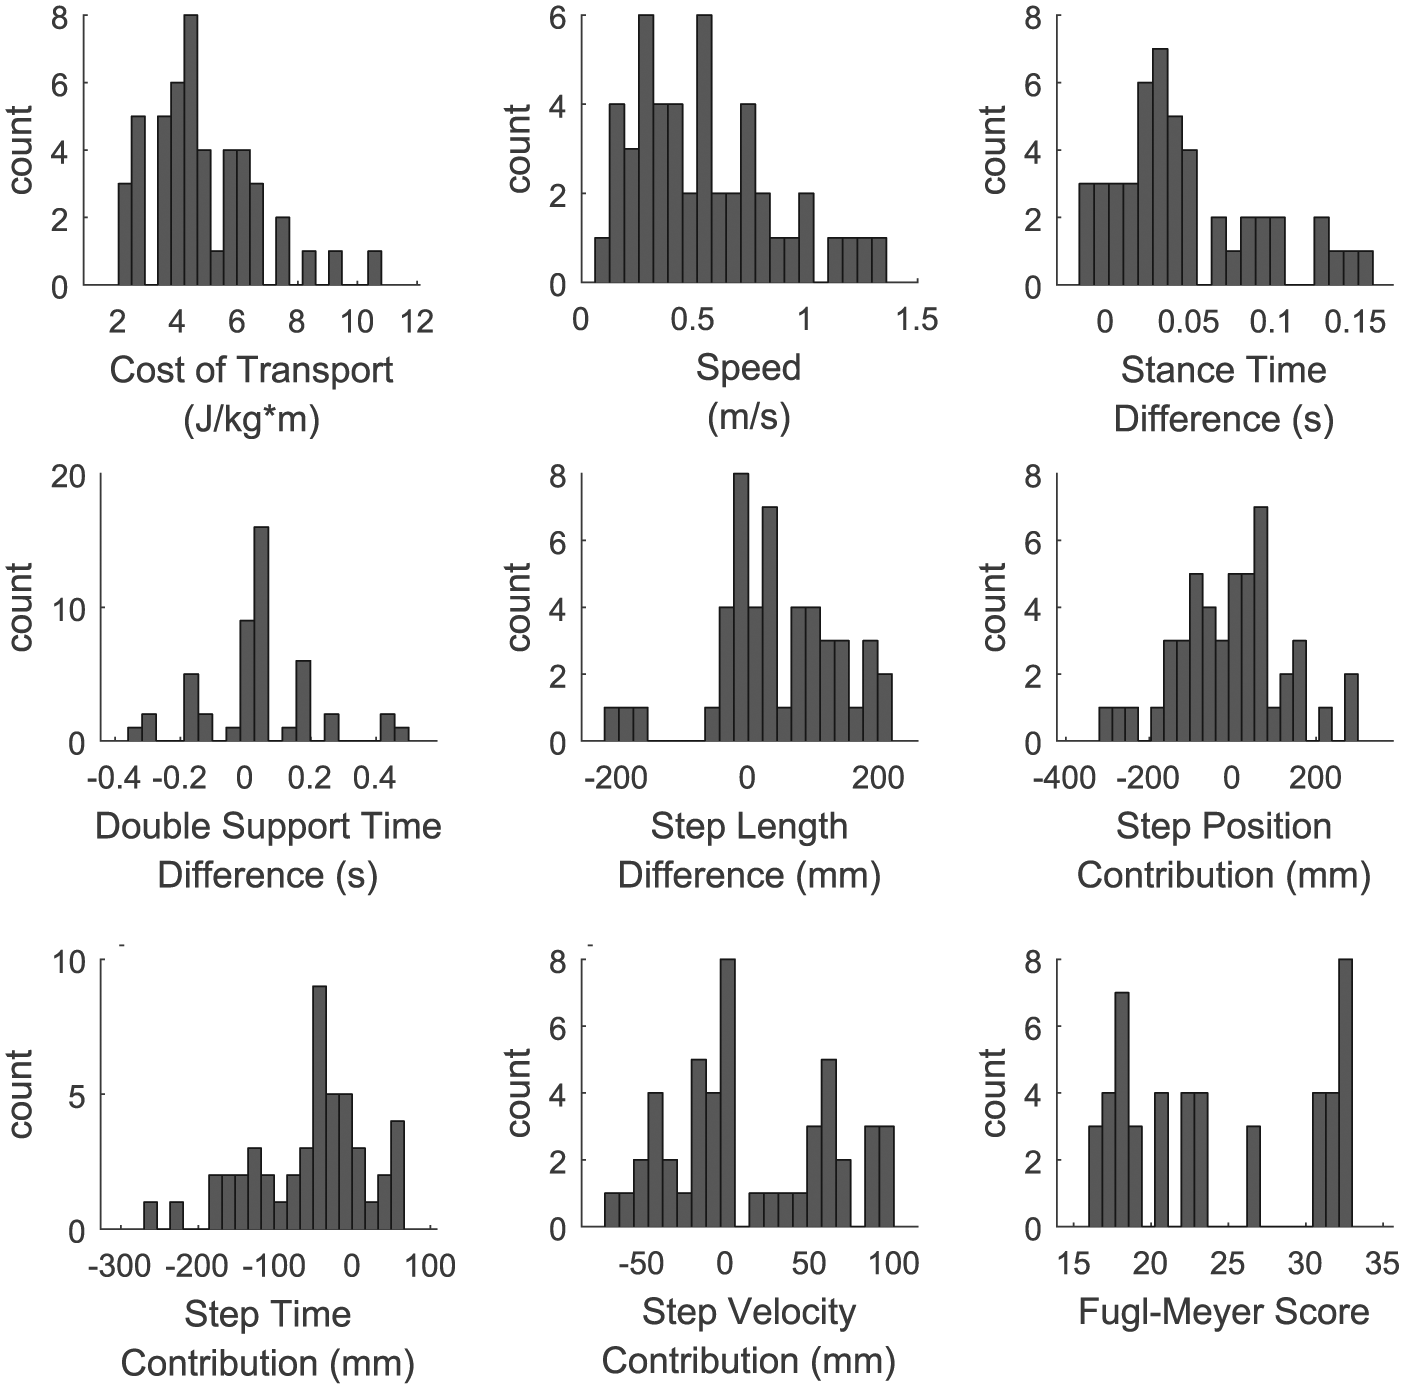
Histograms of the behavioral variables recorded from all participants in our sample of stroke survivors: cost of transport represented the dependent variable, whereas the remaining variables were included as potential fixed effects in the regression model.
Across individuals, the variance in CoT was explained well by a simple linear model that included only 2 variables: speed and the step position contribution to step length difference. The data from 2 participants were identified as outliers (DFBETA > 1.0) and subsequently removed from the regression analysis. On initial inspection of the remaining data, walking speed, double-support time difference, stance time difference, and the step position contribution to step length asymmetry were each correlated with CoT (all |r| > 0.5 and P < .05; Figure 4). The results of our multiple regression analysis revealed that CoT was strongly associated with speed (P = .002) and the step position contribution to step length asymmetry (P = .02). There was no evidence of multicollinearity between our independent variables (all VIF < 5). Overall, 89% of the variance in the CoT was explained by step length difference and the spatial contribution to step length asymmetry (Figure 5). Our test for random effects revealed that the variance of the random effect was statistically different from zero (P < .001, exact likelihood ratio test), and therefore, both random and fixed effects were included in the model. When the data from the 2 outliers were included in the regression analysis, double-support time difference was identified as an additional significant predictor (P = .04), and both speed (P = .002) and the step position contribution to step length difference (P = .04) remained as significant predictors.
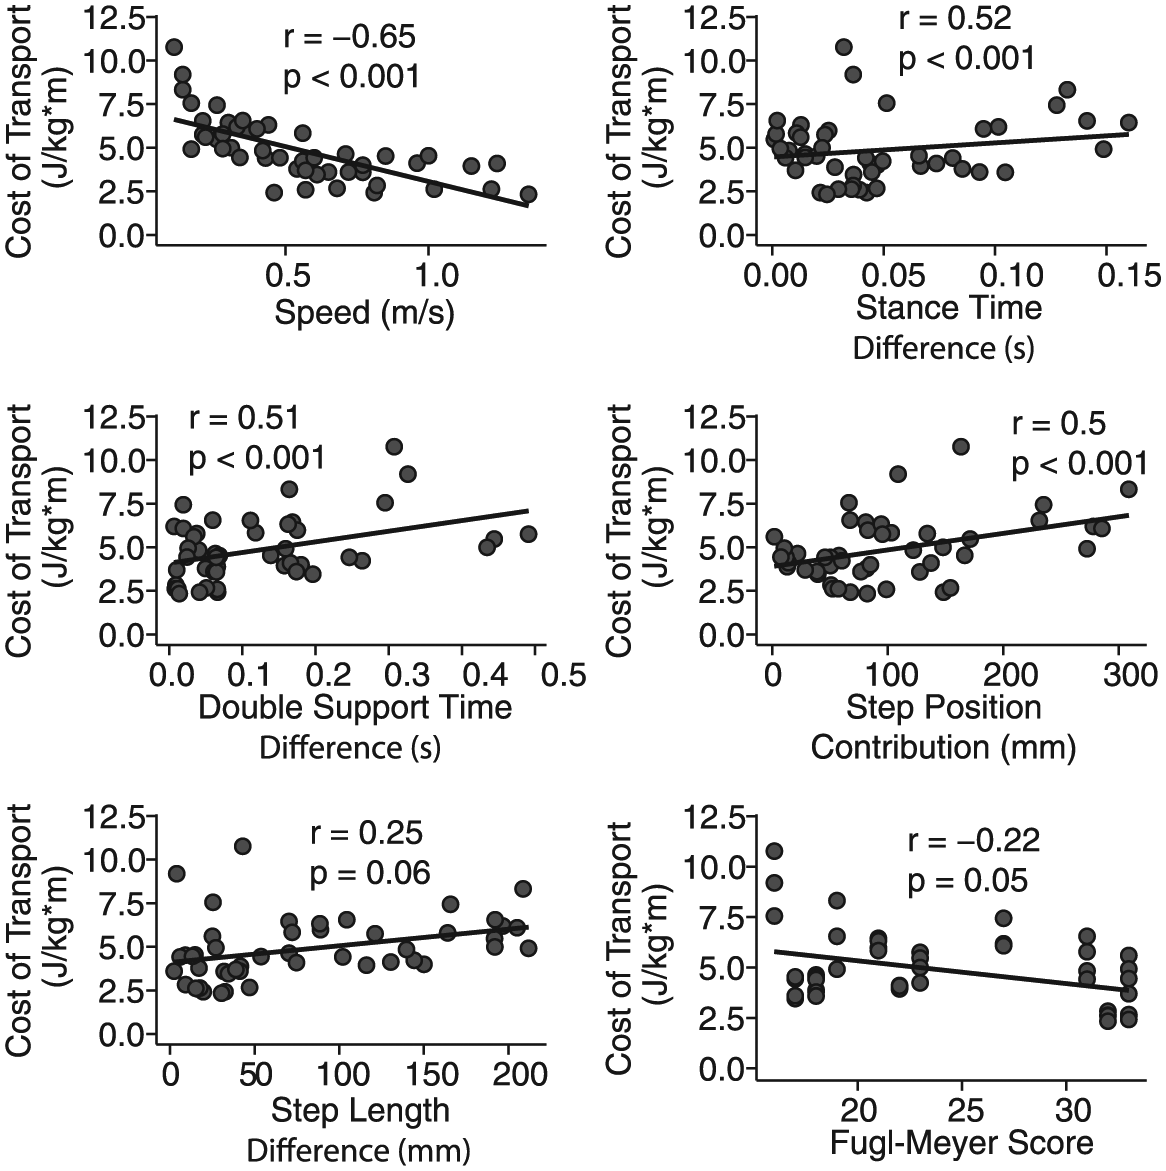
Individual linear fits between the cost of transport and each of the candidate fixed effects: Only the magnitudes of spatial-temporal variables are plotted here because there were no significant associations between the signed values of each variable and the cost of transport. Step length difference and the lower-limb portion of the Fugl-Meyer assessment were the only independent variables whose correlation with the cost of transport was just marginally significant. Each panel includes data pooled across all walking speeds.
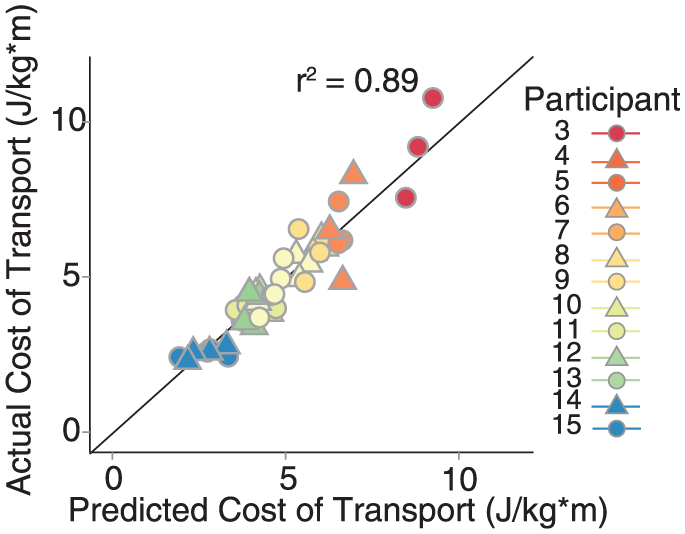
Fit of the full regression model, including speed and the step position contribution to step length difference. The model explained nearly 90% of the variance in the cost of transport within and across individuals. Data points that lie on the diagonal black line indicate that the model predicted the exact cost of transport for that individual. Points above and below the line indicate underestimates and overestimates, respectively.
Discussion
The purpose of this study was to determine if spatial-temporal gait asymmetries were associated with the metabolic cost of walking poststroke. Similar to previous studies, we found that stroke survivors walked with a higher energetic cost relative to healthy age- and gender-matched controls. We also found that the variability in CoT within and across our sample of stroke survivors was predicted well by walking speed and differences in how far the feet are placed in front of the body. These findings suggest potential targets for interventions aimed at reducing the metabolic cost of locomotion in stroke survivors.
This study was largely motivated by recent reports in healthy individuals, which indicated that asymmetries in step length 22 or step time 23 increased the metabolic cost of walking. Although we did not find step time asymmetry to be a significant predictor, we did observe that asymmetry in a specific aspect of step length was an important predictor of metabolic cost. Step length is determined both by how far the leading foot is placed ahead of the body and how far the body proceeds past the trailing foot.11,36 Surprisingly, we found that the asymmetry in the placement of the leading limbs relative to the trunk, and not step length asymmetry per se, was a significant predictor of CoT in our cross-section of stroke survivors. Because asymmetries in the position of the trailing limbs relative to the trunk did not influence metabolic cost, this suggests that interventions targeted toward improving the symmetry of limb placement in front of the trunk may be beneficial for improving economy. This possibility, as well as the generalizability of our findings to stroke survivors who walk faster or slower than the cohort presented here, should be explored more explicitly in future studies.
Our results differ from those of a recent study that found walking speed and swing time asymmetry to be the only significant predictors of the oxygen cost of walking in a cross-section of stroke survivors. 17 One potential explanation for these differences is that we incorporated newly developed variables that decompose step length asymmetry into its fundamental components. Another potential explanation is that we quantified the net metabolic CoT, whereas the previous study used O2 consumption as the primary measure of metabolic cost. Though related, these 2 variables are not equivalent. Finally, they also used a less-impaired sample relative to ours (median self-selected speed: 0.76 vs 0.35 m/s; median Fugl-Meyer: 25 vs 22). Overall, given our findings, it would be interesting to see if the changes in step length asymmetry measured during training in the Awad et al 17 study would still be predictive of improvements in economy if differences in the step position contribution to step length asymmetry were taken into account.
Recent studies have also shown that the angle of the paretic limb during preswing is associated with walking economy poststroke 37 and that increases in paretic limb extension as a result of long-term locomotor training contribute to improvements in paretic propulsion and economy.37,38 This would seem to suggest that our step time or step velocity contributions should be independent predictors of CoT because they are influenced by the position of the trailing paretic limb during double support. However, it should be noted that these previous reports only addressed measures of paretic limb angle and not, for example, trailing limb angle symmetry. It remains to be seen if increases in the symmetry of the trailing limb angles during preswing are associated with improvements in economy.
Why Step Position Asymmetry and Not Step Length Asymmetry?
Step length is determined by the summed effects of flexion of the leading leg and extension of the trailing limb. Our measure of step position asymmetry is a result of differences in the amount of leading-limb flexion between consecutive steps. It is possible that step position asymmetries augment the metabolic cost of walking by increasing the mechanical work necessary to translate the center of mass through space. Inverted pendulum-based models of bipedal locomotion are frequently used to generate predictions about the relationship between spatial-temporal variables of gait, such as step length,39,40 step width, and swing time, and the energetic cost of walking, and many of these predictions have been validated using experimental approaches.41-43 Recently, this model-based approach has been extended to assess the energetic cost of asymmetry. 44 The Harata study, unlike the current study, demonstrated that a period-2 gait, characterized by asymmetries in step length, required more energy than a symmetric gait at comparable speeds. Unfortunately, the model used to evaluate the relationship between asymmetry and energy cost was not designed to dissociate asymmetries in foot placement relative to the trunk from asymmetries in step length. It would be interesting to see if a bias in trunk position relative to the feet at heel-strike affects the mechanics of walking in such a way as to increase metabolic cost; however, to our knowledge, this has yet to be investigated.
Consistent with previous reports, 25 we identified speed as a significant predictor of CoT in our sample of stroke survivors. However, it remains to be seen why slower walkers are less economical. One potential explanation is that the predictive quality of walking speed stemmed from speed-dependent asymmetries in other variables. However, this does not appear to be the case because our analysis of multicollinearity did not indicate that speed was correlated with other variables of asymmetry. Another, perhaps more plausible, explanation is that slower walkers were simply less fit. Measures of cardiorespiratory fitness (VO2 peak) are strongly associated with self-selected walking speed, 45 and individuals with slower self-selected speeds also have lower daily levels of community ambulation.46-48 Slow walking speeds are also commonly associated with balance deficits,48,49 and thus, it is possible that the observed association between speed and CoT was confounded by other variables that were not measured such as balance ability and cardiorespiratory fitness.
Our statistical analysis revealed that 2 of our stroke survivors could be classified as outliers because of their effect on increasing the overall variance in our data set. Although these participants were excluded from the primary regression analysis, we included them in a secondary analysis to see if their inclusion modified the set of significant predictors that we found. Indeed, when the data from these participants were included in our regression model, we found that double-support time asymmetry became a significant predictor of CoT. Given that these individuals had the slowest self-selected walking speeds of our sample, 0.06 and 0.1 m/s, respectively, they may be representative of a subgroup of patients who could benefit from interventions designed to improve temporal symmetry.
In this study, we allowed participants to hold on to a handrail for support during all phases of the experiment. This decision was made largely for safety purposes because many participants would otherwise have had difficulty maintaining their position toward the front of the treadmill, particularly during the trials at their fastest comfortable speed. One potential limitation of this approach is that the support provided by the handrail may have altered participants’ natural gait and influenced our metabolic cost measurements. Handrail support reduces the energy cost of walking in healthy individuals 50 and reduces both energy cost and asymmetry in stroke survivors. 51 Given these findings, it is likely that all of our participants would have had an increase in CoT in the absence of handrail support, and our sample of stroke survivors may have also exhibited larger asymmetries. Whether this would change the coefficients of our regression model or simply increase the mean values of our independent and dependent variables requires further investigation. In addition, because our conclusions were drawn from a sample of 15 individuals, further investigations will be necessary to corroborate our findings in larger-scale studies with more stroke survivors.
In conclusion, our results demonstrate the utility of decomposing step length asymmetry into its requisite spatial and temporal contributions to better understand the functional consequences of gait asymmetry. The demonstrated associations between foot placement asymmetry and the metabolic cost of walking suggest that interventions designed to specifically target foot placement asymmetries, as opposed to step length more generally, may be more effective for improving walking economy in stroke survivors. Importantly, the sign of a patient’s foot placement asymmetries likely reflects specific impairments that could be targeted through rehabilitation. For example, reduced flexion of the paretic limb could result from an insufficient propulsive impulse in the paretic leg or from weakened paretic hip flexors.5,36,52 For patients who have reduced flexion of the paretic limb, interventions focusing on strengthening the paretic hip flexors or improving the propulsive impulse in the paretic limb may be beneficial. Indeed, it was recently demonstrated that training-induced improvements in paretic propulsion are associated with increased economy. 37 In contrast, reduced flexion of the nonparetic limb could be a result of a shortened stance phase on the paretic limb, which would limit the time available for the nonparetic limb to swing through for weight acceptance. These patients might benefit from interventions that improve their capacity to bear weight on the paretic limb because this may provide more time for the nonparetic limb to swing through.
Footnotes
Declaration of Conflicting Interests
The authors have no potential conflicts of interest with respect to the research, authorship, and/or publication of this article.
Funding
The authors disclosed receipt of the following financial support for the research, authorship, and/or publication of this article: This work was supported by National Institutes of Health Eunice Kennedy Shriver National Institute of Child Health and Human Development Grants HD048741, HD007414, and HD073945.