
Abstract
Background. In hemiplegic gait, step length typically differs in magnitude between paretic and nonparetic sides. However, the direction of step-length asymmetry varies across stroke patients. Objective. The study sought to understand directional variations in step-length asymmetry in terms of asymmetries in forward foot placement relative to the trunk and trunk progression. Methods. A total of 10 hemiplegic stroke patients and 9 healthy elderly controls walked at a self-selected comfortable speed while pelvic and heel marker positions were recorded. Step length, forward foot placement relative to the trunk, and trunk progression of paretic and nonparetic steps were quantified, as well as the asymmetries therein. Results. The 3 asymmetry indices in question varied within individual patients and occasionally fell within control reference ranges, whereas directional variations across stroke patients were observed for asymmetries in step length and forward foot placement only. Despite heterogeneity in asymmetry across patients, step-length asymmetry was determined by the sum of asymmetries in forward foot placement and trunk progression. Asymmetries in trunk progression and forward foot placement were negatively correlated. No significant association was observed between step-length asymmetry and any other asymmetry index. Conclusions. Step-length asymmetry was accounted for by asymmetries in forward foot placement and trunk progression, whereas their relative contribution accounted for directional variations in step-length asymmetry. Partitioning of step-length asymmetry further helped to identify individual impairments and compensatory gait strategies. An encompassing hemiplegic gait evaluation should therefore include an assessment of foot positioning relative to the trunk.
Introduction
Asymmetries in spatiotemporal parameters are a symptomatic feature of hemiplegic gait. There is general consensus about the direction of asymmetry for temporal gait measures: hemiplegic stroke patients all show prolonged stance duration on the nonparetic side and increased swing duration on the paretic side. 1-5 The direction of step-length asymmetry, however, varies across stroke patients for both overground 2,6,7 and treadmill walking, 8-10 with the numbers of patients exhibiting larger paretic/nonparetic steps varying from 14/14 2 to as many as 23/4 7 within the cited studies. In these cases, paretic step length represents the fore–after distance between nonparetic and subsequent paretic foot placement positions (vice versa for nonparetic step length). Although a consistent pattern of step-length asymmetry thus seems absent, a majority of hemiplegic stroke patients appears to take shorter nonparetic steps.
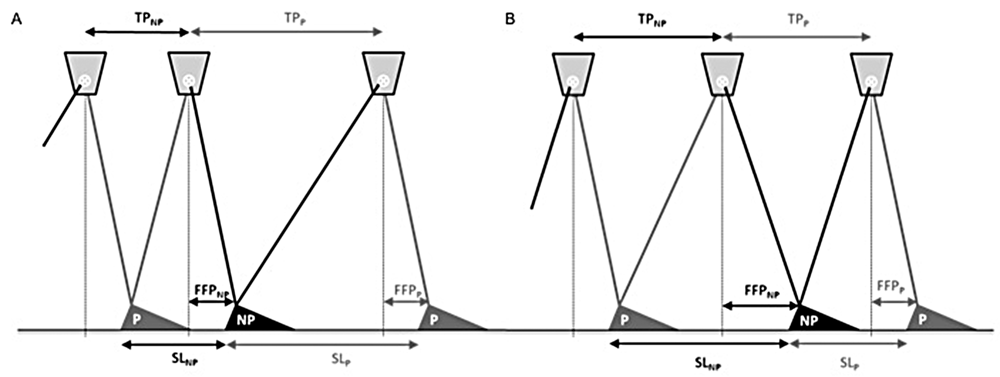
Asymmetries in step length, in particular the relatively shorter nonparetic steps, have been ascribed to weaker propulsive forces generated by the paretic leg, 1,6,7,11 reduced hip extension of the paretic leg, 2,3,7,8 and impaired dorsiflexion of the paretic foot. 1,3 As a result, the trunk does not displace as far forward of the supporting foot during paretic single limb support, resulting in shorter nonparetic than paretic steps (Figure 1A). Hodt-Billington and colleagues 12 recently concluded, however, that footfall and trunk movements reflect different aspects of hemiplegic gait, implying that asymmetries in trunk progression alone may not fully explain the variations observed in step-length asymmetry. 6,7,13 Another contributor to step-length asymmetry may be differences between paretic and nonparetic forward foot placement relative to the trunk at foot-strike: the farther the nonparetic leg is swung forward with respect to the trunk, the larger the nonparetic step (provided that the trunk is advanced equally far forward during paretic and nonparetic steps; Figure 1B). Partitioning step length into trunk progression and forward foot placement components may thus help elucidate the observed directional variation in step-length asymmetry across hemiplegic stroke patients, and possibly help pinpoint underlying impairments and gait compensations.
Determinants of step-length asymmetry
The relative contributions of both components to step-length asymmetry have not been examined to date, perhaps because this requires registration of trunk progression per step in addition to traditionally recorded stride cycle parameters. The present study aims to fill this void by exploring the relationship between step-length asymmetry and asymmetries in trunk progression and forward foot placement relative to the trunk in a heterogeneous group of stroke patients walking at self-selected comfortable speeds. It is expected that the identified components account for the observed asymmetry in step length in an additive (ie, noninteractive) manner and that their relative contribution is responsible for inconsistencies in the direction of step-length asymmetry.
Methods
Trunk kinematic data presented in this study were collected (but not reported) in another study that investigated the effect of acoustic pacing on gait-cycle parameters in a heterogeneous group of stroke survivors. 9 A total of 10 hemiplegic stroke patients with a first-ever ischemic stroke (8 men, 2 women; mean age 63 years, range 46-78 years; 3.1 years poststroke, range 3-104 months; hemisphere of stroke, 7 right, 3 left) and 9 healthy elderly controls (4 men, 5 women; mean age 69 years, range 60-78 years) participated in that study, which was approved by the local ethics committee. Written informed consent was obtained from all participants. Stroke patients all scored category 5 on functional ambulation 14 and were classified as limited (n = 4, 0.4 < self-selected speed < 0.8 m/s) or unlimited (n = 6, self-selected speed >0.8 m/s) community walkers. 15 See Table 1 for additional functional characteristics.
Belt Speed and Mean Step Length, Mean Trunk Progression, and Mean Forward Foot Placement Relative to the Trunk for Paretic (P) and Nonparetic (NP) Steps (Averaged Over the 30 Strides Analyzed for Patients P1 to P10) a
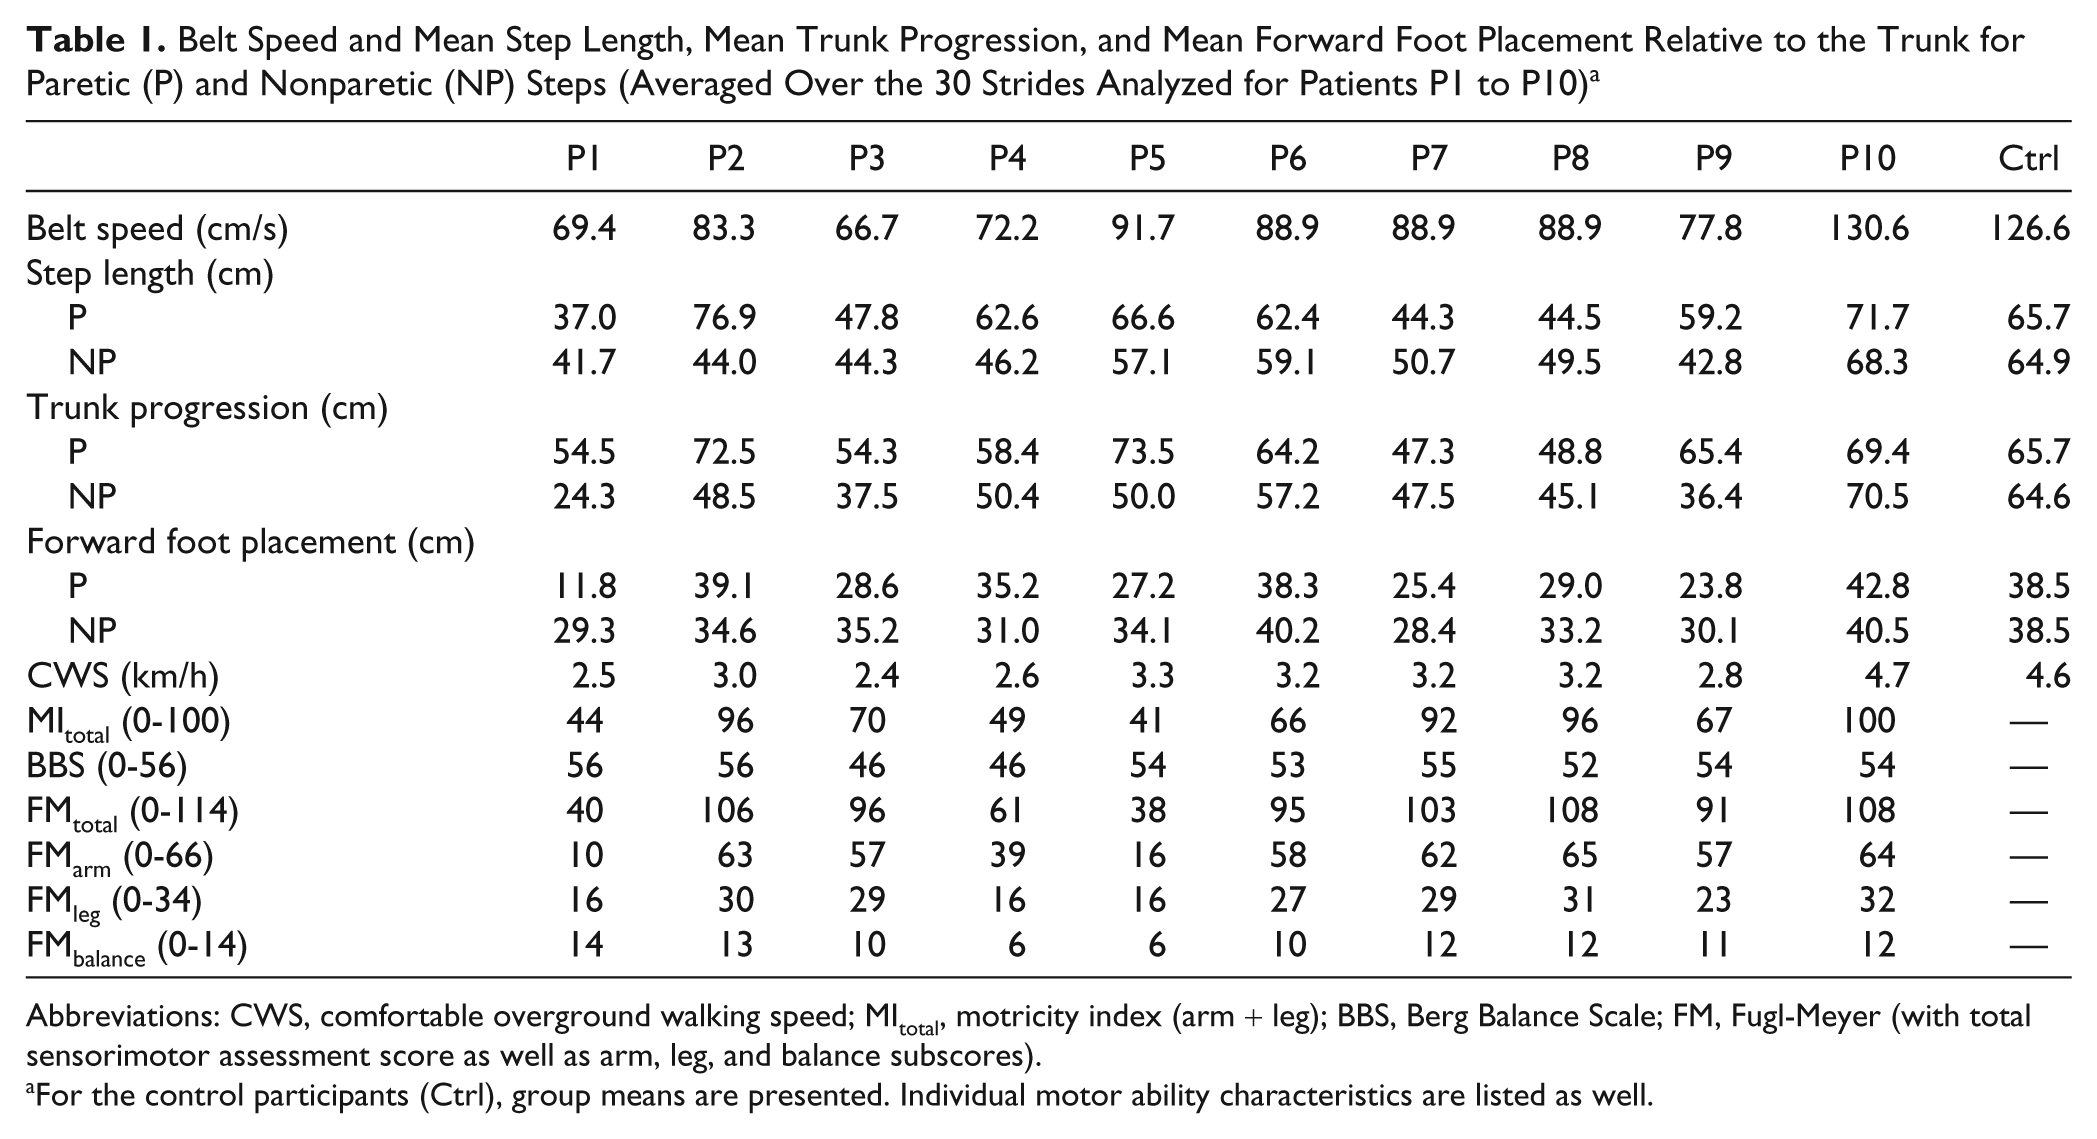
Abbreviations: CWS, comfortable overground walking speed; MItotal, motricity index (arm + leg); BBS, Berg Balance Scale; FM, Fugl-Meyer (with total sensorimotor assessment score as well as arm, leg, and balance subscores).
For the control participants (Ctrl), group means are presented. Individual motor ability characteristics are listed as well.
After becoming familiarized with walking on a large treadmill at different belt speeds, participants walked for 90 seconds at a belt speed corresponding to their comfortable overground walking speed, as determined by a 10-m timed walking test. No support was allowed from handrails, weight bearing, or walking aids. For safety reasons, participants wore a harness and they were accompanied alongside the treadmill by 2 persons. A 3-dimensional active-marker motion registration system (Optotrak 3020, Northern Digital Inc, Waterloo, Canada) recorded the position of cluster markers (ie, triangular frames with light-emitting diodes at each corner) attached to the pelvis and the heels of the participants’ shoes (sampling frequency 60 Hz).
Anterior–posterior marker position data were first transformed to a coordinate system moving with the belt. 16 To this end, for each sample i (ranging from 1 to 5400), i times the ratio of belt speed in cm/s over sampling frequency (Hz) was added to anterior–posterior coordinates of pelvic and heel markers. Subsequently, time indices of heel strikes of the paretic and nonparetic legs were determined by selecting the moment at which the vertical position of the associated heel marker reached its minimum. 17 The last 30 stride cycles, starting with a paretic heel strike, were used to quantify the following 3 gait parameters. First, paretic step length (in cm) was defined as the distance between anterior–posterior positions of paretic heel strikes following nonparetic heel strikes (and vice versa for step length on the nonparetic side). Second, forward paretic foot placement relative to the trunk (in cm) was defined as the anterior–posterior difference between the heel marker of the paretic foot and the pelvic marker at times of paretic heel strike. Likewise, forward nonparetic foot placement was defined as the anterior–posterior distance between nonparetic heel and pelvic markers at times of nonparetic heel strike. In the remainder of the text, forward foot placement relative to the trunk is abbreviated as FFP. Third, trunk progression (in cm) during the paretic step was defined as the anterior–posterior distance traveled by the pelvic marker during the paretic step (ie, the time interval between paretic heel strikes following nonparetic heel strikes). Likewise, trunk progression during the nonparetic step was defined as the distance traveled by the pelvic marker in the time interval between nonparetic heel strikes following paretic heel strikes. In the remainder of the text, trunk progression is abbreviated as TP. See Figure 1 for a schematic representation of these gait parameters.
Asymmetry in the gait parameters of interest was defined as 100% × (V paretic − V nonparetic)/(V paretic + V nonparetic), with V representing step length, FFP, or TP. An index of 0% indicates perfect symmetry; the magnitude represents the degree of asymmetry and the sign indicates the direction of the asymmetry (ie, a positive index indicates a larger step length for the paretic leg or greater TP or FFP during the paretic step).
Asymmetry in step length, TP, and FFP was assessed for each individual patient by comparing each measure with control group reference values. Specifically, individual step length, FFP, and TP values were classified as asymmetric when they fell outside the associated reference range of the control group, defined as mean ± 2SD of a particular asymmetry index. Relationships between mean asymmetry indices were characterized using Pearson’s correlation r.
Results
The 3 Asymmetry Indices Varied Inconsistently Per Individual
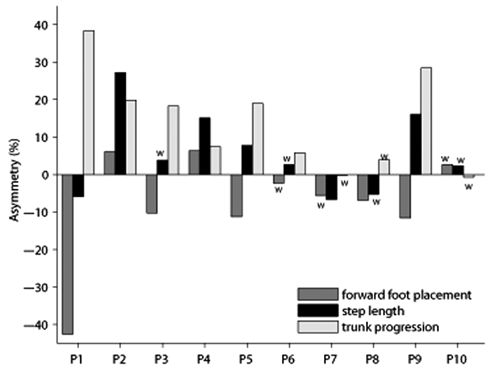
As can be appreciated from Figure 2, the 3 asymmetry indices varied inconsistently within individual patients. Moreover, one or more asymmetry values of an individual patient occasionally fell within reference ranges (ie, mean ± 2SD) for controls. For example, step-length asymmetry of patient P3 was comparable with that of controls, despite relatively large asymmetries in FFP and TP. P6 exhibited a TP asymmetry, whereas asymmetries in step length and FFP fell within corresponding reference ranges for controls. P7’s step length was asymmetric, even though FFP and TP asymmetry values fell within control ranges. Likewise, P8 exhibited an FFP asymmetry, whereas asymmetries in step length and TP were comparable to control values. Finally, none of the 3 asymmetry indices of P10 fell outside control ranges.
Asymmetry indices for stroke patients P1 to P10
Only Asymmetries in Step Length and FFP Varied in Direction
Differences between paretic and nonparetic step lengths and FFP varied in magnitude and direction across patients (Table 1, Figure 2). From the patients with step-length asymmetries, P1, P7, and P8 took shorter paretic steps, whereas P2, P4, P5, and P9 took shorter nonparetic steps (ie, negative and positive step-length asymmetries, respectively). From the patients with an FFP asymmetry, P2 and P4 exhibited greater paretic than nonparetic forward foot placement relative to the trunk, whereas FFP was generally smaller for paretic steps (P1, P3, P5, P8, and P9). TP asymmetry, however, varied only in magnitude across stroke patients, and not in direction. Patients with a TP asymmetry (all patients except P7, P8, and P10) displaced the trunk farther forward during the paretic step (ie, during nonparetic stance; Table 1, Figure 2).
Relations Between Asymmetry Indices
Despite weak positive associations, mean step-length asymmetry was not significantly correlated with mean asymmetries in FFP (r = 0.36; P = .063) or TP (r = 0.34; P = .077), whereas a significant negative correlation was observed between the means of the latter two asymmetries (r = −0.75; P < .001). Note that all associations became significant when asymmetries were correlated over all individual strides (r = 0.37, 0.35, and −0.69, respectively; all Ps <.001).
Discussion
By partitioning step length into 2 components—forward foot placement with respect to the trunk and trunk progression—we sought to gain insight into the frequently reported between-subject variation in the direction of step-length asymmetry in persons poststroke. 1-3,6-10,12,18 First, we found that asymmetry in neither component was significantly correlated with mean step-length asymmetry, indicating that variations in step-length asymmetry cannot be fully explained by the components of trunk progression (TP) and forward foot placement relative to the trunk (FFP) in isolation. Second, Figure 2 clearly shows that step-length asymmetry is, by and large, the sum of asymmetries in TP and FFP. This finding corroborates the expectation that both components contribute to step-length asymmetry in an additive (ie, noninteractive) manner. Third, we found that asymmetries in TP and FFP were negatively correlated overall. Consequently, their individual effects on step-length asymmetry are somewhat annulled (see Figure 1).
It was further expected that their relative contributions are responsible for inconsistencies in the direction of step-length asymmetry. This was clearly the case. For example, P1, P3, P5, and P9 all showed asymmetric TP, with the trunk being displaced farther forward during the paretic than during the nonparetic step. With similar paretic and nonparetic forward foot placement relative to the trunk, increased trunk progression during paretic steps would result in larger paretic steps (Figure 1A). However, for all of these patients the paretic leg was placed less far forward with respect to the trunk than the nonparetic leg (ie, positive FFP asymmetry), thereby to some extent trimming down the larger paretic step induced by the TP asymmetry. That is, P5 and P9 exhibited a larger paretic step because in those patients the FFP asymmetry was smaller than the TP asymmetry (Figure 2). For P1, in contrast, the FFP asymmetry was greater than the TP asymmetry, culminating in a larger nonparetic step (Figure 2). Finally, P3’s step-length asymmetry was largely annulled because the opposing contributing components were of comparable magnitude (Figure 2). Hence, it is fair to conclude that the direction of step-length asymmetry follows from the relative contributions of both components.
Importantly, partitioning of step-length asymmetry may help to identify individual impairments and compensatory strategies. Regarding the identification of individual impairments, reduced trunk progression during paretic stance may reflect an impaired propulsion generating capacity of the paretic leg. 6,7,11,13 The propulsion generating capacity of the paretic leg is often impaired, especially in hemiplegic gait as evidenced by a negative association between paretic leg propulsion and hemiparetic severity. 7,13 Interestingly, stroke patients with impaired paretic leg propulsion were shown to walk asymmetrically with smaller nonparetic steps, 6 which was ascribed to reduced trunk progression during paretic stance (ie, nonparetic step), 6 but the authors did not examine this hypothesis experimentally. Next to a weakened propulsion generating capacity of the paretic leg, the paretic leg swing may be restricted as well, 1,3,6 for example, because of an impaired swing initiation by the hip flexors or an excessive flexion synergy, thereby constraining FFP. Restrictions in paretic leg swing may thus be reflected in reduced forward paretic-foot placement relative to the trunk.
Accordingly, P1, P3, P5, and P9 all showed weaker paretic leg propulsion generating capacity (as evidenced by reduced TP during the nonparetic step) and restricted paretic leg swing (as evidenced by smaller paretic FFP). The direction of step-length asymmetry may then unveil the relative severity of these impairments (Table 1, Figure 2). That is, forward leg swing of the paretic limb was more restricted than its propulsion generating capacity in P1, as evidenced by net smaller paretic steps, whereas the opposite was true for P5 and P9; for P3 restrictions in both aspects were in balance as step-length asymmetry was largely annulled. Partitioning step-length asymmetry may thus help to identify local impairments in propulsion generating capacity and forward leg swing. This potentially allows for more targeted therapeutic interventions, aimed at for example strengthening paretic ankle and hip muscle groups, 1,3,11,19 as their activity proved to be strongly associated with paretic propulsion and swing initiation, respectively. 7
Partitioning step-length asymmetry may, besides impairments, also uncover compensatory gait strategies, as illustrated by P2 and P4. To maintain a stationary walking velocity, propulsion and braking impulses should be in balance. Braking is strongly shaped by passive mechanics; the farther the foot is placed in front of the trunk, the greater the braking. 6,7,13 In this respect, a relatively smaller nonparetic FFP may be viewed as an effective compensatory strategy as it reduces the braking force. The weaker paretic leg then has to generate a relatively smaller propulsion to maintain speed. Likewise, a relatively increased braking associated with a larger paretic FFP can be readily overcome by an increased propulsion generated by the much stronger sound leg. Two patients—P2 and P4—used this compensatory gait strategy, as evidenced by a greater paretic than nonparetic FFP, most likely manifested by a pronounced circumduction strategy. Despite relatively small asymmetries in FFP and TP, their step-length asymmetry was prominent because component asymmetries were, in contrast to the other patients, of similar direction. Given that the legs of hemiplegic stroke patients are equipped with “motors of unequal power on each of its sides,” 4 reducing forward nonparetic foot placement relative to the trunk may be a parsimonious solution to maintain a given speed, as it calls for an unequal output from those motors, optimally adjusted to local propulsion impairments. Comparable compensatory strategies in quiet standing have also been observed after stroke. 20,21
Although partitioning step-length asymmetry into FFP and TP components holds great promise for understanding impairments and compensatory gait, it requires an examination of both trunk and footfall positions, calling for more advanced gait registration and more elaborate data processing, thereby making it less feasible for routine evaluation in therapeutic settings. This limitation notwithstanding, the present study clearly illustrated that judging the quality of hemiplegic gait from the magnitude of step-length asymmetry alone is flawed. First, relatively large step-length asymmetries may be indicative of a parsimonious compensatory strategy (ie, P2 and P4), that is, when asymmetries in TP and FFP are small in magnitude and similar in direction. Second, small step-length asymmetries may misrepresent true gait asymmetry, given that asymmetries in TP and FFP generally tend to offset each other (as evidenced by their significant negative correlation). That is, most patients show (a) reduced trunk progression during the nonparetic step due to reduced propulsion generating capacity of the paretic leg—which in itself leads to smaller nonparetic steps—in combination with (b) reduced forward paretic-foot placement due to restricted forward paretic leg swing—which in itself leads to smaller paretic steps. Thus, paretic and nonparetic steps are of equal length as long as asymmetries in TP and FFP are similar in magnitude but opposite in direction (cf. P3 in Figure 2). This novel insight runs counter to the common perception and interpretation of step-length asymmetry following stroke, and stresses the need to examine foot positioning in relation to trunk movements in hemiplegic gait evaluation.
Footnotes
The author(s) declared no potential conflicts of interests with respect to the authorship and/or publication of this article.
The author(s) disclosed receipt of the following financial support for the research and/or authorship of this article:
This work was supported by the Netherlands Organisation for Health Research and Development (ZonMw Grant No. 1435.0004) and the Hersenstichting Nederland (Grant No. 15.F07.29). The contribution of Melvyn Roerdink was supported by Veni grant 451-09-024 of the Netherlands Organization for Scientific Research (NWO).