
Abstract
Background. Multiple sclerosis (MS) eventually compromises the walking ability of most individuals burdened with the disease. Treatment with neuromuscular electrical stimulation (NMES) can restore some functional abilities in persons with MS, but its effectiveness may depend on stimulus-pulse duration. Objective. To compare the effects of a 6-week intervention with narrow- or wide-pulse NMES on walking performance, neuromuscular function, and disability status of persons with relapsing-remitting MS. Methods. Individuals with MS (52.6 ± 7.4 years) were randomly assigned to either the narrow-pulse (n = 13) or wide-pulse (n = 14) group. The NMES intervention was performed on the dorsiflexor and plantar flexor muscles of both legs (10 minutes each muscle, 4 s on and 12 s off) at a tolerable level for 18 sessions across 6 weeks. Outcomes were obtained before (week 0) and after (week 7) the intervention and 4 weeks later (week 11). Results. There was no influence of stimulus-pulse duration on the outcomes (P > .05); thus, the data were collapsed across groups. The NMES intervention improved (P < .05) gait speed and walking endurance, dorsiflexor strength in the more-affected leg, plantar flexor strength in the less-affected leg, force control for plantar flexors in the less-affected leg, and self-reported levels of fatigue and walking limitations. Conclusion. There was no influence of stimulus-pulse duration on the primary outcomes (gait speed and walking endurance). The 6-week NMES intervention applied to the lower leg muscles of persons with mild to moderate levels of disability can improve their walking performance and provide some symptom relief.
Keywords
Introduction
The loss of mobility experienced by persons with multiple sclerosis (MS) can be partially restored with exercise training,1,2 especially for individuals with Expanded Disability Status Scale (EDSS) scores <4.0. 3 Some evidence suggests, however, that persons with greater levels of disability can experience gains in physical function when exercise training is combined with neuromuscular electrical stimulation (NMES). For example, Coote et al 4 reported that supplementing a 12-week progressive resistance program with NMES (pulse width not reported) augmented the gains in fatigue reduction, muscle endurance, and balance for individuals with MS who used a walking aid most of the time. In contrast, Broekmans et al 5 found similar gains in strength but no changes in clinical tests of mobility for individuals with MS (EDSS = 4.3 ± 02) who performed 20 weeks of strength training exercises of the knee extensors either alone or in combination with NMES (pulse width = 0.4 ms).
One of the factors that contributes to such discrepancies in NMES outcomes is differences in stimulus characteristics. Conventional NMES protocols apply currents of <100 mA between electrodes placed on the skin over a target muscle at stimulus frequencies of 40 to 100 Hz with narrow pulse widths of 0.2 to 0.5 ms.5,6 Recent work has shown that the capacity of NMES to influence the function of the nervous system depends on the duration of each stimulus pulse. Longer stimulus pulses (0.5-1.0 ms)—typically known as wide-pulse NMES—are able to produce more widespread responses in the nervous system than shorter stimulus pulses (0.2-0.4 ms)7-10 even after the stimulation has stopped.11,12 The application of wide-pulse NMES, therefore, might elicit more consistent improvements in motor function and disability status for individuals with MS.
The primary purpose of our study was to compare the effects of narrow- and wide-pulse NMES on gait speed and walking endurance of persons with relapsing-remitting MS. Because of its greater engagement of sensory axons,7,9 wide-pulse NMES was expected to elicit more widespread adaptations in nervous system function and to produce greater gains in walking performance than conventional narrow-pulse NMES. The secondary purpose was to determine the influence of the NMES protocols on the functional capabilities of the stimulated leg muscles and on assessments of disability status.
Because of the critical role of lower-leg muscles in determining walking ability in persons with MS,13-16 NMES was applied to the dorsiflexor and plantar flexor muscles of each leg, and their functional capabilities were assessed. In addition to measuring the strength of the dorsiflexor and plantar flexor muscles in both legs, we measured the fluctuations in force during steady isometric contractions (force steadiness 17 ) to derive an index of the neural drive to muscle. 17
Previous reports suggest that NMES interventions have mixed effects on disability status of persons with MS,4,5 but exercise programs can modulate some measures of disability. We expected that the most likely disability measures to be influenced by the NMES protocols would be the test of manual dexterity (grooved pegboard test),18,19 walking limitations, 20 and level of fatigue.4,21,22
Materials and Methods
Individuals who expressed an interest in the study completed a screening questionnaire in which they affirmed a diagnosis of relapsing-remitting MS, difficulty with walking, stable doses of MS-related medications, and the absence of a relapse within the preceding 3 months, history of seizure disorder, implanted biomedical devices or metal, and skin disease. Participants were recruited from the practice of the Rocky Mountain MS Center and via newsletter distribution along the Front Range of the Rocky Mountains. The study enrolled 32 volunteers who signed a consent form that was approved by the institutional review board at the University of Colorado Boulder.
In a double-blinded, randomized design, participants were assigned to 1 of 2 groups: narrow-pulse group (n = 13; 54.9 ± 4.5 years) or wide-pulse group (n = 14; 50.4 ± 9.0 years). Participants and evaluators were blinded to the type of intervention. Each participant attended 3 evaluation sessions and 18 NMES treatment sessions distributed over 6 weeks. Each evaluation session comprised 2 days of testing. Evaluation sessions were performed before (week 0) beginning the 6-week treatment, within 1 week after finishing the treatment (week 7), and approximately 4 weeks after completing the treatment (week 11).
Evaluation Sessions
On the first day of the evaluation sessions, participants performed the 2 walking tests (25-feet walk and 6-minute walk), took a manual dexterity test (grooved pegboard), completed 3 questionnaires, and were instructed on how to measure daily levels of physical activity. Maximal walking speed was measured as the time it took to walk 25 feet as quickly as possible from a stationary start.20,23 The average of 2 trials was used as the measure of maximal walking speed. Walking endurance was characterized as the distance walked in 6 minutes around a 140-m track. Participants were encouraged to walk briskly, and the distance covered at 1, 2, 4, and 6 minutes was recorded.24,25
The grooved pegboard test, the 3 questionnaires, and the daily levels of physical activity were used to assess disability status. Manual dexterity was quantified as the time taken to complete the grooved pegboard test, which required participants to place 25 pegs into holes on a pegboard as quickly as possible. 26 The questionnaires were the Patient Determined Disease Steps (PDDS), 27 Modified Fatigue Impact Scale (MFIS),25,28 and MS Walking Scale-12 (MSWS-12).29,30 Physical activity was measured with the GENEActive accelerometer (Activinsights Limited, Cambridge, UK) for 7 consecutive days beginning on the second day of evaluations and quantified during at least 24-hour days during that period. Participants were asked to wear the waterproof sensors all the time but were permitted to remove it at night if it disturbed their sleep. The monitor was worn on the same wrist, and the data were sampled at 30 Hz. Custom software (Matlab R2015a, Mathworks, Natick, MA) was used to filter the signals (band pass of 0.2 to 15 Hz), calculate an average gravity-subtracted signal vector magnitude, quantify activity counts per second, and identify nonwear times (>10 hours). Based on norms established for healthy adults, maximal activity category cut-points were set for sedentary (1.4), light (4.0), and moderate (11.3) accelerations per second to estimate the proportion of daily time spent performing different levels of physical activity. 31 The main reason for including this assessment was to quantify the potential negative impact of the intervention on daily levels of physical activity.
On the second day of the evaluation sessions, muscle strength and force steadiness were measured. Participants lay in a supine position, and a strap was placed around the forefoot and connected to a strain-gauge transducer (MLP-300, Transducer Techniques, Tenecula, CA). The measured force was sampled at 2 kHz (Power 1401, Cambridge Electronic Design, Cambridge, UK) and displayed on a monitor that was placed ~1 m in front of the participant. Muscle strength was quantified as the peak torque (N m) achieved by the dorsiflexor and plantar flexor muscles of each leg when participants gradually increased muscle torque up to maximum and sustained it briefly. Participants performed up to 5 trials until 2 maximal values were within 10% of each other; the greater value was designated as the maximal voluntary contraction (MVC) torque. Participants then performed submaximal isometric contractions with the dorsiflexor and plantar flexor muscles to match target forces of 10% and 20% MVC torque with the self-reported less-affected leg. The task was to match the target force displayed on the monitor and then maintain a steady contraction. 32 The protocol comprised two 30-s trials at each target force with each muscle group. Force steadiness was measured as the coefficient of variation for force.
NMES Intervention
The NMES treatments were applied with an FDA-approved clinical device (Vectra Genisys Therapy System, DJO Global) that delivered symmetric, biphasic pulses of current through pairs of electrodes (2 × 3.5 in or 2 × 5 in each) placed on the skin overlying the muscles of each leg (Figure 1). NMES was applied to the dorsiflexor and plantar flexor muscles (10 minutes each muscle, 4 s on and 12 s off) of each leg. NMES was applied to one leg at a time in a counterbalanced order across sessions. Stimulus frequency was set at 100 Hz with a pulse width of 1 ms for wide-pulse stimulation and at 50 Hz with a pulse of 0.26 ms for narrow-pulse stimulation. To reduce the discomfort associated with NMES, the participant was encouraged to contract the involved muscles while the stimulation was being applied.
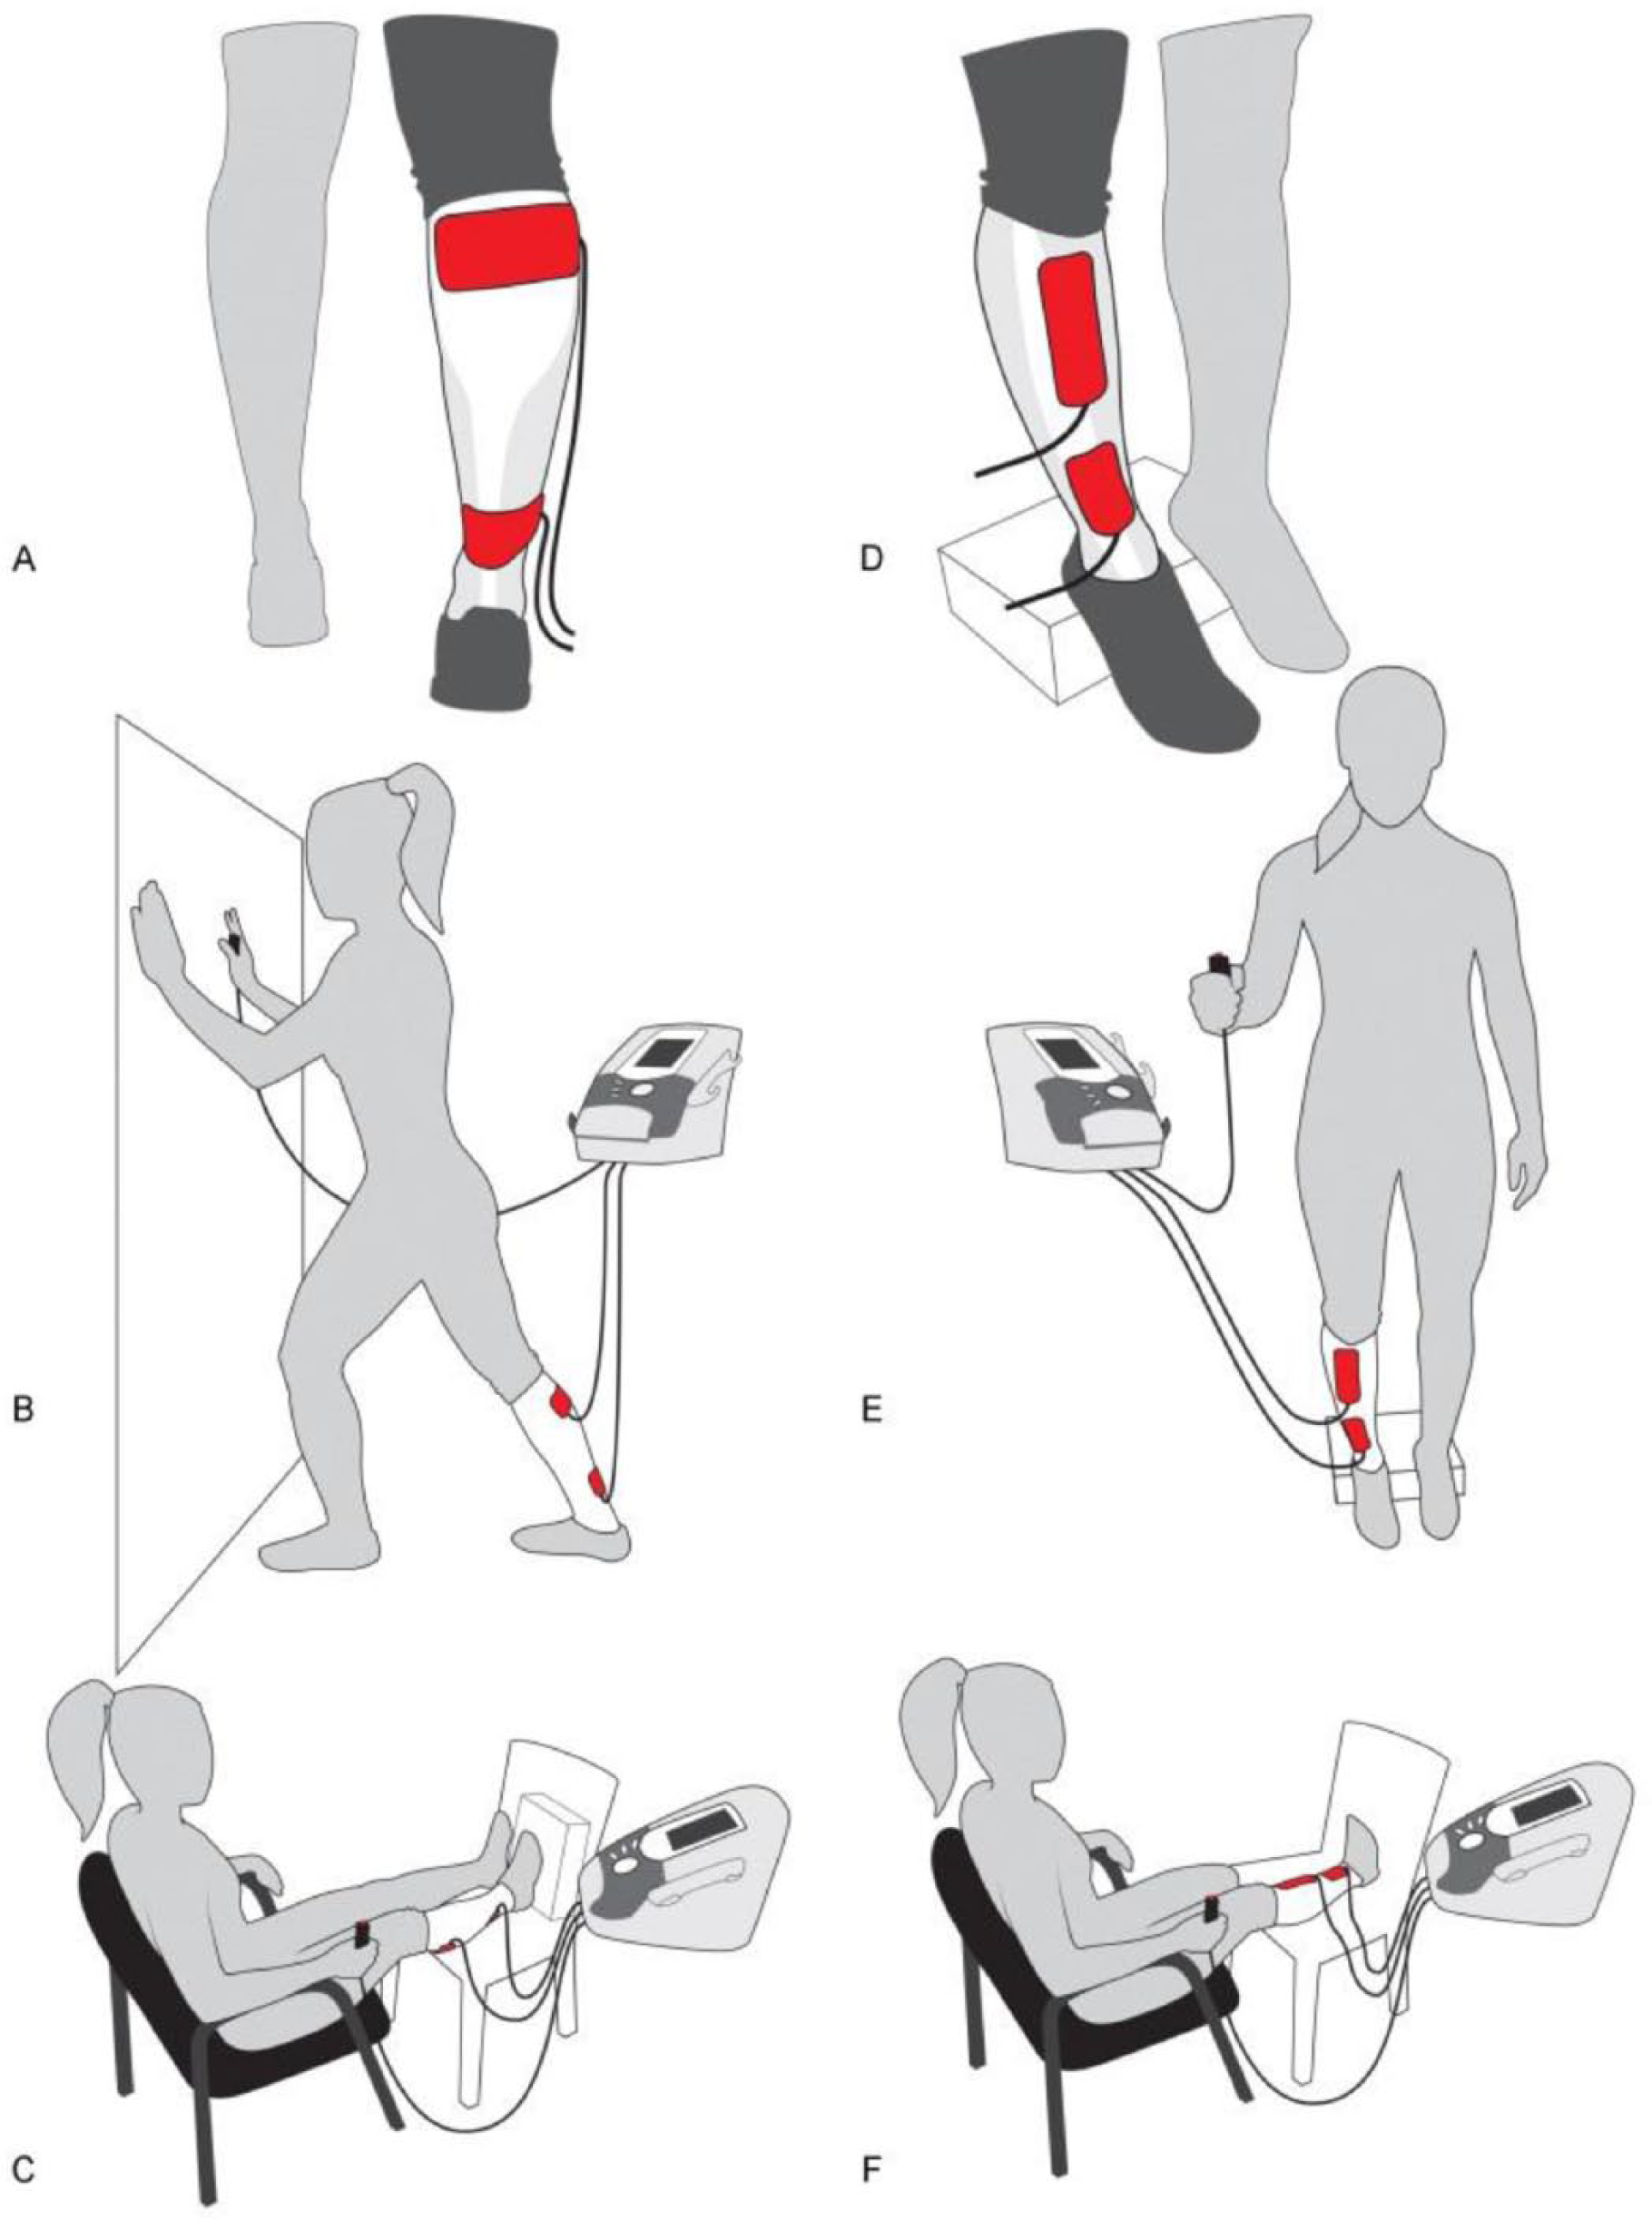
The intervention setup showing the stimulation pad locations over the plantar flexor (A) and dorsiflexor (D) muscles, the standing positions when stimulation was applied to the plantar flexor (B) and dorsiflexor (E) muscles, and the sitting position when stimulation was applied to the plantar flexor (C) and dorsiflexor (F) muscles.
The stimulation was applied while the participant was seated during the first and last 2 weeks (12 sessions) of the intervention and while standing in the middle 2 weeks (6 sessions). In the seated position, the legs were lifted parallel to the floor, and the participant pushed against a restraint during application of NMES. In the standing position, participants stood in a lunge position when NMES was applied to the plantar flexors and with the heels placed on a platform when the NMES was applied to the dorsiflexors (Figure 1). Current was progressively increased across sessions to the maximal tolerable level for each participant and then tapered during the last 3 sessions. After ~19 evoked contractions, the participant performed 3 passive stretching exercises with the involved leg muscles. The treatment sessions were performed or supervised by a physical therapist with clinical experience in providing such treatments. Each treatment session lasted ~50 minutes.
Data Analysis
The data were coded during analysis to maintain blinding. The Shapiro-Wilk test was used to assess normality. Normally distributed data were analyzed with mixed ANOVA, and nonnormally distributed data were analyzed with the Kruskal-Wallis test. Comparisons across time were examined with either 1-way repeated-corrections ANOVA (parametric) or Friedman’s test (nonparametric) with Bonferroni adjustments. When group differences reached significance, post hoc comparisons were performed with either paired, independent t (parametric data), Wilcoxon sign ranked, or Mann-Whitney U tests (nonparametric data). Post hoc comparisons were made within groups, which involved 3 statistical comparisons.
Effect size for group differences were quantified as η2 (parametric data) or as
Results
Of the 32 individuals who were enrolled in the study, 5 were unable to complete the protocol because of time commitments or an unrelated injury. Thus, 27 persons (mean ± SD; 52.6 ± 7.4 years) completed the protocol. There were no statistically significant differences between the 2 groups in the baseline values for the outcome measures (walking performance, leg muscle function, and disability status; Table 1). The average scores (both groups combined) for the 3 self-reported assessments indicate that the participants exhibited a range of disabilities: PDDS (range = 0-6), MFIS (range = 0-76), and MSWS-12 (range = 17-57). Based on the PDDS criteria, most participants were classified as either with gait disability (n = 13) or early cane (n = 8), but 1 person self-reported a score of 0 (normal), and 2 were essentially confined to a wheelchair.
Descriptive Statistics for the 2 Groups and Combined Group of Participants Prior to Beginning the Intervention. a
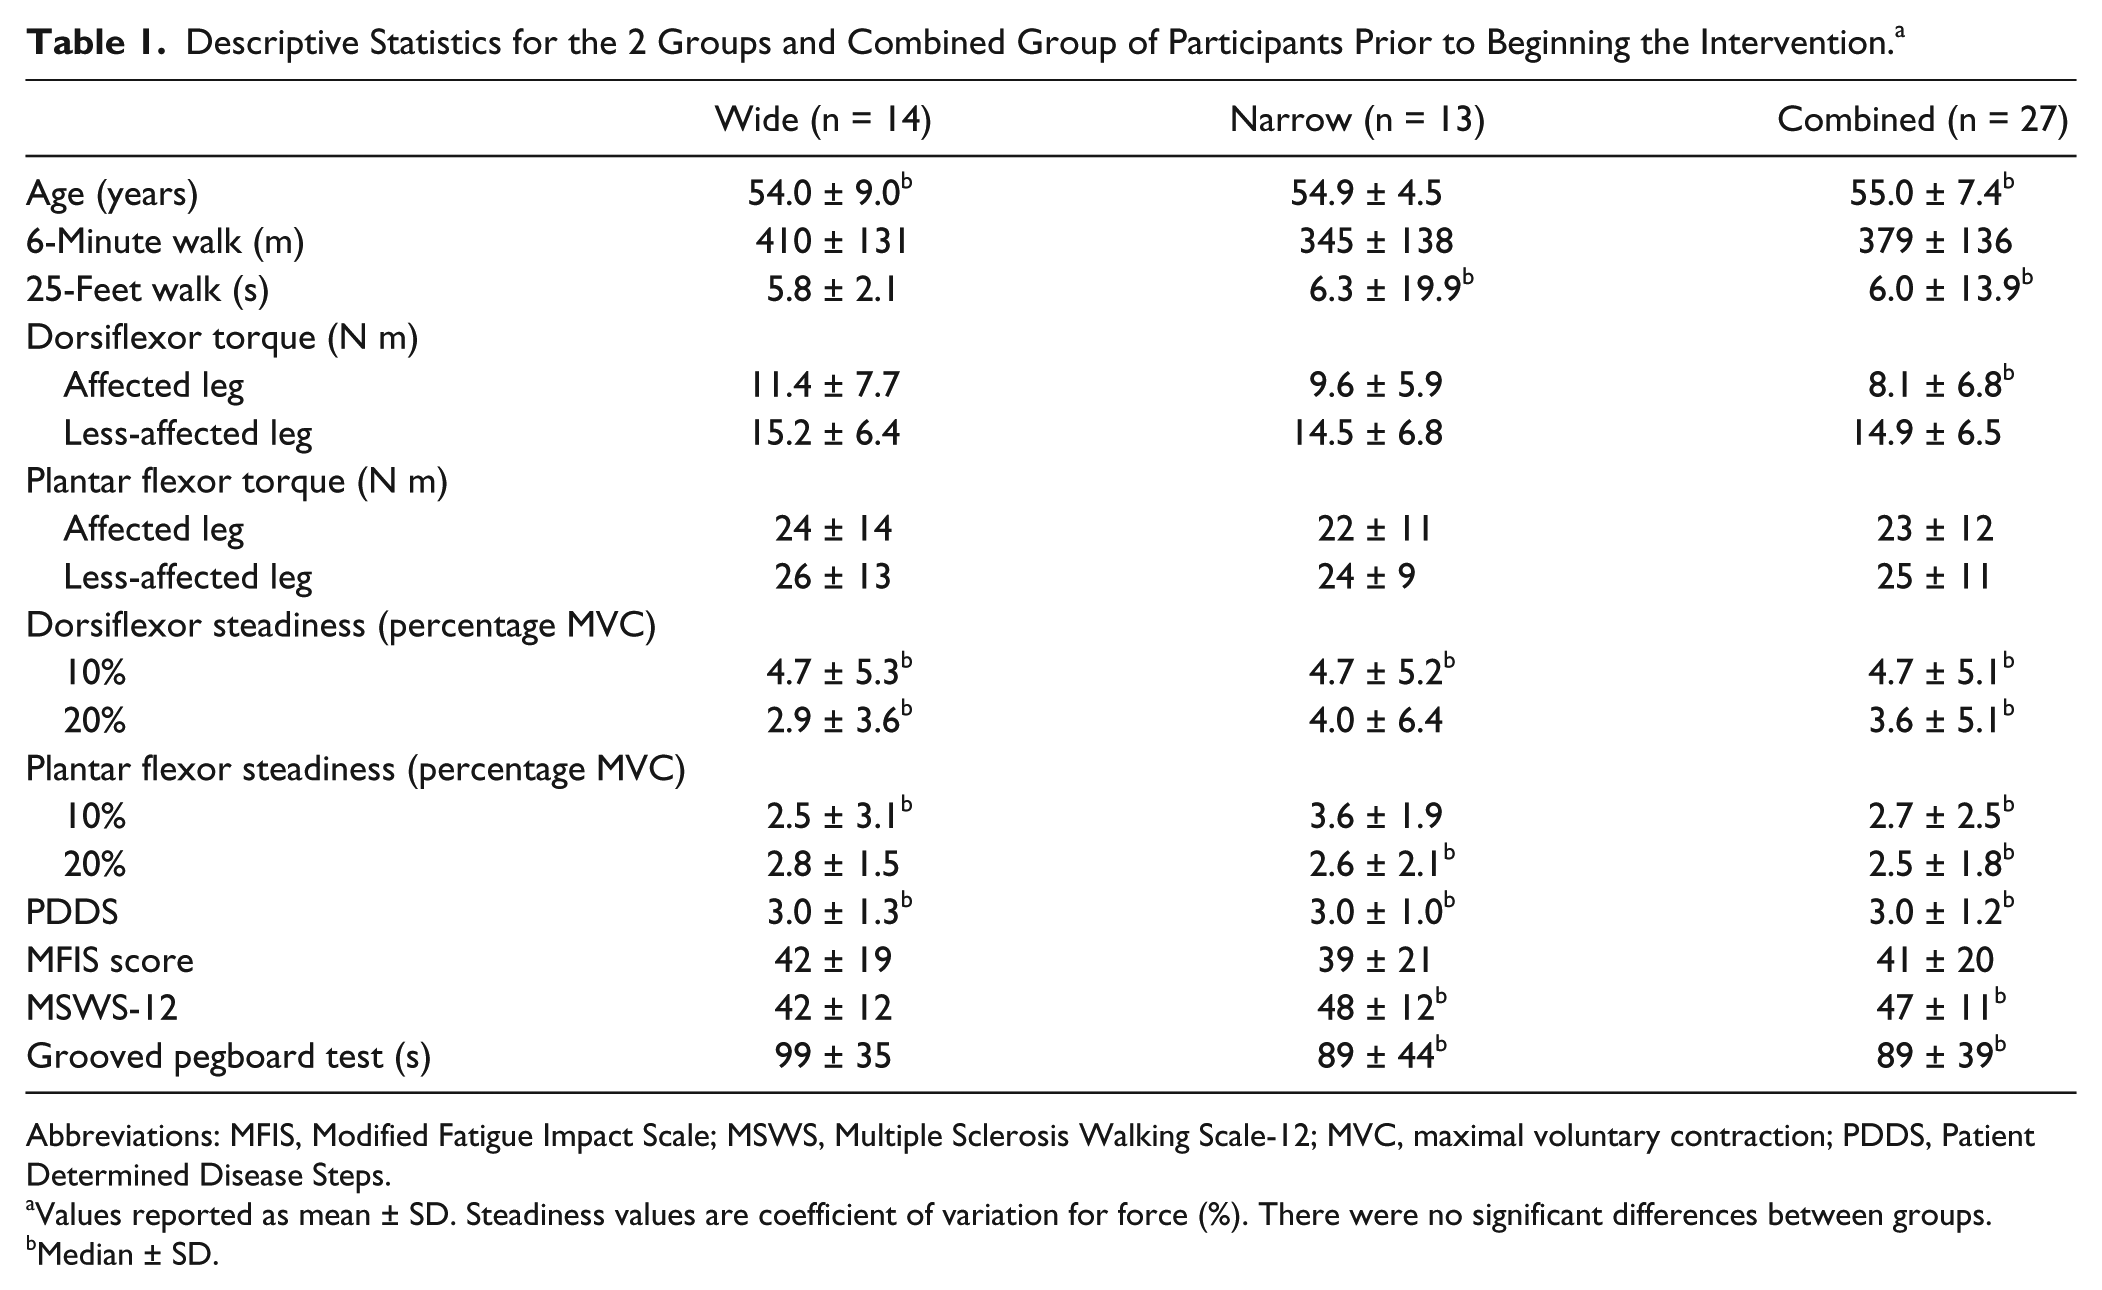
Abbreviations: MFIS, Modified Fatigue Impact Scale; MSWS, Multiple Sclerosis Walking Scale-12; MVC, maximal voluntary contraction; PDDS, Patient Determined Disease Steps.
Values reported as mean ± SD. Steadiness values are coefficient of variation for force (%). There were no significant differences between groups.
Median ± SD.
There was no difference (Kruskal-Wallis test) between the 2 groups (wide- and narrow-pulse NMES) in the gains in the 2 primary outcome variables: 25-feet walk speed (χ2 = 4.85; df = 3; P value = .18) or 6-minute walk distance (χ2 = 0.25; df = 3; P = .94). However, both groups exhibited an effect of time (weeks 0, 7, and 11), which was quantified by combining the data for the 2 groups.
Walking Performance
25-Feet Walk
Friedman’s test with Bonferroni adjustment for post hoc comparison and adjusted P value (Table 2) indicated significant improvements (P = .003 [effect size = 0.38]) in the 25-feet walk test at week 7 (7.9 ± 11.1 s, P = .043 [0.304]) and week 11 (7.8 ± 11.9 s, P < .01 [0.43]) compared with week 0 (8.8 ± 13.9 s). The decrease in time it took to walk 25 feet relative to week 0 was −0.90 ± 3.1 s (5% ± 16%) at week 7 and −1.0 ± 2.3 s (8% ± 15%) at week 11. Despite the variability in the changes in walking performance among participants, Figure 2 indicates a relatively consistent relation between the gains in the 2 walking tests observed immediately after the intervention (week 7) and 4 weeks later (week 11).
Measures of Walking Performance and Disability Status at the 3 Time Points During the 6-Week Intervention. a
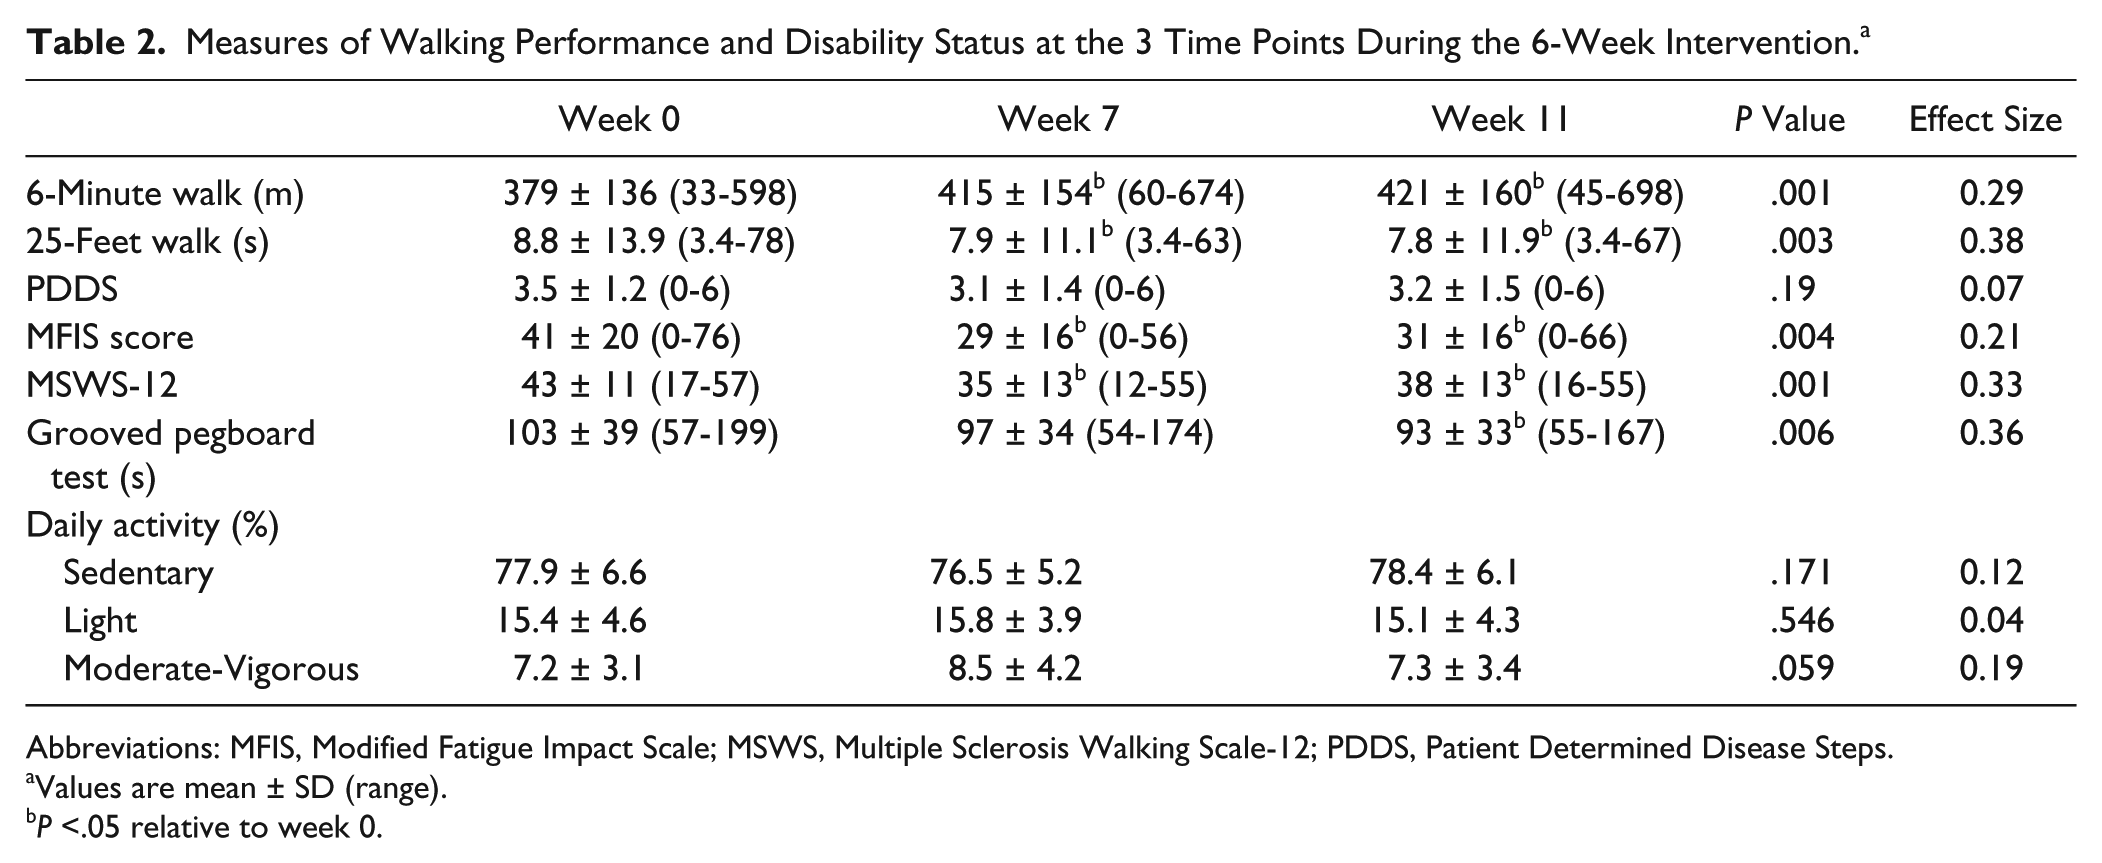
Abbreviations: MFIS, Modified Fatigue Impact Scale; MSWS, Multiple Sclerosis Walking Scale-12; PDDS, Patient Determined Disease Steps.
Values are mean ± SD (range).
P <.05 relative to week 0.
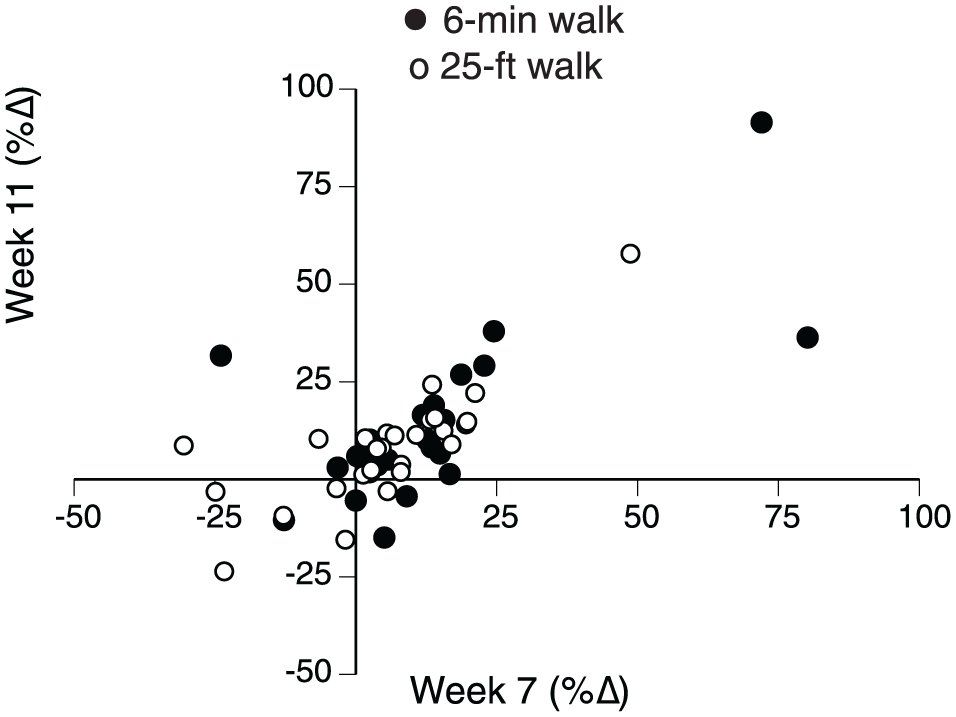
The relative (%) improvement in the distance walked in 6 minutes and time taken to walk 25 feet immediately at weeks 7 and 11.
6-Minute Walk
One-way repeated-measures ANOVA with Bonferroni adjustment indicated significant improvements (P = .001 [0.29]) in the 6-minute walk distance (Table 2). The increase (mean ± SD) in the distance walked in 6 minutes relative to week 0 was 37 ± 51 m (12% ± 21%) at week 7 and 43 ± 66 m (13% ± 21%) at week 11.
The gains in 6-minute distance and 25-feet time at week 7 were not significantly different from those at week 11, whether the improvements were examined as either absolute (6-minute: P = .27 [0.14]; 25-feet: P = .33 [0.13]) or relative (6-minute: P = .5 [0.09]; 25-feet: P = .23 [0.16]) changes.
Leg Muscle Function
Muscle Strength
Friedman’s test and 1-way repeated measures ANOVA with Bonferroni correction for post hoc comparisons indicated significant improvements in the MVC torque (N m) for 2 of the 4 tested muscle groups. The strength of the dorsiflexors in the affected leg (Table 3) increased (P = .016 [0.32]) at week 11 (13.5 ± 7.8 N m, P = .02 [0.38]), but not at week 7 (12.7 ± 7.4 N m, P = .08 [0.29]), compared with week 0 (10.5 ± 6.8 N m). The increase in dorsiflexor strength relative to week 0 was 66% ± 167% at week 7 and 71% ± 148% at week 11.
Strength for Muscles in the More-Affected and Less-Affected Legs and Force Steadiness for the Less-Affected Leg at the 3 Time Points During the 6-Week Intervention. a
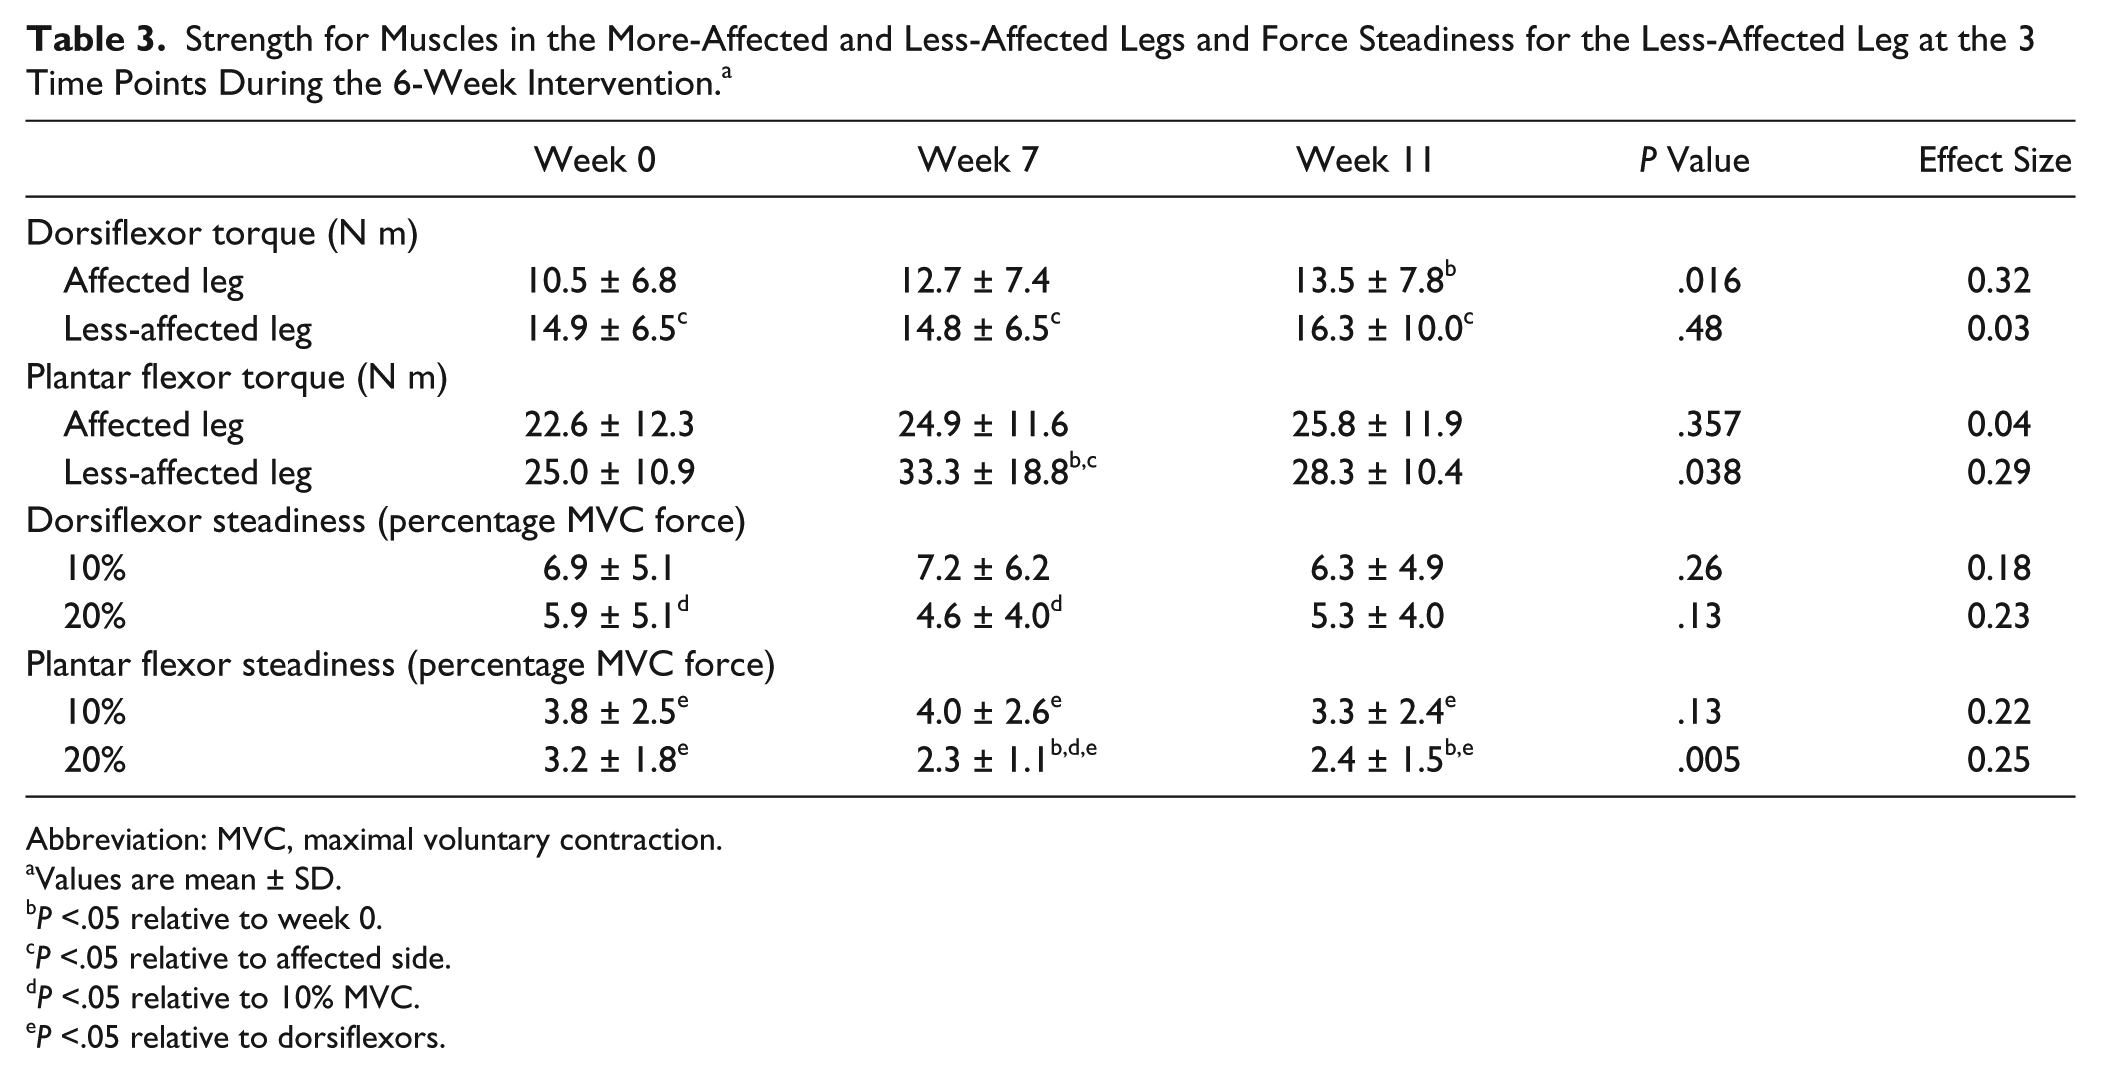
Abbreviation: MVC, maximal voluntary contraction.
Values are mean ± SD.
P <.05 relative to week 0.
P <.05 relative to affected side.
P <.05 relative to 10% MVC.
P <.05 relative to dorsiflexors.
Similarly, the strength of the plantar flexors in the less-affected leg (Table 3) increased (P = .038 [0.29]) at week 7 (33.3 ± 18.8 N m, P = .04 [0.34]), but not at week 11 (28.3 ± 10.4 N m, P = .2 [0.25]), compared with week 0 (25.0 ± 10.9 N m). The increase in plantar flexor strength relative to week 0 was 39% ± 54% at week 7 and 26% ± 58% at week 11. There were no statistically significant changes in the dorsiflexor torque of the less-affected leg (P = .48 [0.03]) or the plantar flexor torque of the affected leg (P = .36 [0.04]).
These selective changes in muscle strength influenced the between-limb differences in muscle strength. Although the dorsiflexor muscles in the affected leg were stronger after intervention, they remained weaker than those in the less-affected leg (Table 3) at week 0 (P = .003 [0.31]), week 7 (P = .048 [0.15]), and week 11 (P = .045 [0.16]). In contrast, it was the plantar flexor muscles in the less-affected leg that gained strength during the intervention (Table 3), which made them even stronger than those in the affected leg (P = .001 [0.47]).
Force Steadiness
The coefficient of variation for force during the steady isometric contractions (force steadiness) differed with target force (10% and 20% MVC), muscle group in the less-affected leg (dorsiflexors and plantar flexors), and after the intervention. Force was more steady (lower coefficients of variation values) for the dorsiflexor muscles at 20% than at 10% MVC (Table 3) both at week 0 (P = .039 [0.32]) and week 7 (P = .003 [0.46]), but not at week 11 (P = .18 [0.21]). The plantar flexors were steadier at 20% than at 10% MVC (Table 3), but only at week 7 (P = .004 [0.44]) and not at week 0 (P = .31 [0.16]) or at week 11 (P = .058 [0.29]). The plantar flexors were steadier than the dorsiflexors across all time points and at both target forces: 10% MVC, week 0 (P < .001 [0.53]), week 7 (P = .021 [0.36]), and week 11 (P < .001[0.52]); 20% MVC, week 0 (P = .008 [0.41]), week 7 (P < .001 [0.58]), and week 11 (P < .001[0.57]). Force steadiness improved (P = .005 [0.25]) for the plantar flexors at 20% MVC, but not at 10% MVC, at week 7 (2.3% ± 1.1%, P = .027) and at week 11 (2.4% ± 1.5%, P = .028) compared with week 0 (3.2% ± 1.8%). There were no statistically significant changes in force steadiness for the dorsiflexors.
Disability Status
Grooved Pegboard Test
Friedman’s test with Bonferroni adjustment for post hoc comparisons indicated significant differences (P = .006 [0.36]) across the intervention (Table 2), with significant differences (P = .005 [0.43]) between week 0 (103 ± 39 s) and week 11 (93 ± 33 s) but not (P = .088 [0.29]) at week 7 (97 ± 34 s). This result indicates a main effect for time on the grooved pegboard times.
Self-reported Assessments
MFIS (P = .004 [0.212]) and MSWS-12 (P = .001 [0.33]) scores were improved at weeks 7 and 11 (Table 2), but the change in PDDS score at week 7 and 11 were not statistically significant when compared with that at week 0 (P = .19 [0.07]). However, there was a statistically significant correlation (P < .05) between PDDS score and the increase in distance (m) walked in 6 minutes at week 7 (r = −0.40); participants with greater PDDS scores experienced lesser gains in 6-minute distance.
Daily Levels of Physical Activity
There were no statistically significant changes in the daily levels of physical activity at week 7 or at week 11 in any of the 3 categories of physical activity (Table 2): sedentary (P = .17 [0.12]), light (P = .55 [0.04]), and moderate-vigorous (P = .06 [0.19]). The intervention, therefore, did not compromise the daily levels of physical activity of the participants.
Discussion
In a double-blind, randomized comparison of narrow- and wide-pulse NMES, individuals whose mobility was impaired by MS showed clinically significant improvements in walking endurance and maximal walking speed after the 6-week NMES intervention. In contrast to the hypothesis, however, there was no influence of stimulus-pulse duration on the primary outcomes.
The hypothesis was derived from studies that have demonstrated a gradual increase in the torque evoked in lower-leg muscles by wide-pulse NMES relative to the same initial level of torque elicited by narrow-pulse NMES.7,9 The increase in torque is attributed to the progressive recruitment of motor neurons resulting from the widespread distribution of sensory input associated with wide-pulse NMES.10,11,33 The relative activation of sensory and motor axons, however, is influenced by the placement of the NMES electrodes. When the electrodes are placed over a peripheral nerve, wide-pulse NMES engages a greater proportion of sensory axons compared with when the electrodes are placed over the muscle belly. 7 The results of our study, however, suggest that pulse width had no influence on the adaptations elicited by NMES when the electrodes were placed over the dorsiflexor and plantar flexor muscles of the study participants. 34
Some of the findings from our study are similar to those reported in other NMES interventions, but there are some significant differences. Coote et al 4 found that supplementing a 12-week home-based resistance program with NMES applied to the quadriceps muscles of individuals who were moderately disabled by MS augmented the gains in muscle endurance and self-reported level of fatigue (MFIS). Critically, the NMES was applied to the weaker leg while the participants performed the prescribed exercises. In contrast, the current study found that the 6-week NMES protocols applied to lower-leg muscles (dorsiflexors and plantar flexors) while the participants performed isometric contractions in seated and standing positions improved gait speed, walking endurance, some measures of muscle strength and force steadiness, fatigue (MFIS), and self-reported levels of walking disability (MSWS-12 score).
The decrease in time to walk 25 feet (8.8 ± 13.9 to 7.9 ± 11.1 s) corresponds to a clinically significant improvement (week 7: −5% ± 16%; week 11: −8% ± 15%) in maximal gait speed (<8 s to walk 25 feet). 35 However, the 25-feet walk test at a fast speed is less responsive to changes produced by rehabilitation than the longer walk tests. 20 Consistent with this conclusion, the improvement in 6-minute walk distance (379 ± 136 to 415 ± 154 m) represents an improvement (week 7: 12% ± 21%; week 11: 13% ± 21%) that exceeded the minimally important change of 22 m. 20 Moreover, the decline in MSWS-12 score (maximum = 60 points) at week 7 (7.6 ± 8.4 points) was similar to the 8-point reduction deemed to indicate a meaningful improvement in walking disability, 30 but the improvement began to dissipate at week 11 (5.4 ± 9.5 points).
As expected, the NMES intervention produced some limited improvements in measures related to disability status. In addition to the decrease in the MSWS-12 score, the self-reported level of fatigue (MFIS) declined by 11 ± 17 (maximum = 53) points at week 7 and by 8 ± 16 points at week 11. As a symptom, an individual’s level of fatigue is derived from 2 domains: performance fatigability and perceived fatigability. 36 The fatigue experienced by persons with MS appears to be minimally influenced by performance fatigability and appears to depend more on perceived fatigability, 37 which depends on the psychological state of the individual and the capacity to accommodate challenges to homeostasis. 36 Our findings suggest that an NMES intervention is able to modulate at least 1 mechanism related to either psychological state or homeostasis that contributed to perceived fatigability in persons with MS.
In contrast, the NMES intervention did not produce a statistically significant change in PDDS score, although there was an inverse relation between the increase in 6-minute walk distance and the initial PDDS score. This association suggests that the impact on the NMES protocol was greater for those participants who were mildly disabled. However, the statistically significant decreases in grooved pegboard times are consistent with central adaptations produced by the 6 weeks of NMES. Moreover, the intervention did not compromise the daily levels of physical activity as measured with a wrist-worn accelerometer. Because of the association between habitual walking performance and disability status, 38 the absence of change in the daily levels of physical activity is consistent with no change in the PDDS score.
The current results provide some insight into adaptations that likely contributed to the improvements in walking performance. In a 2-year longitudinal study, Zackowski et al 39 reported that the decrease in strength of the ankle dorsiflexor muscles (3.3 lb/year) for persons with MS was associated with an increase in the time it took to walk 25 feet; time changed by 0.19 s for each 1 lb decline in strength. We found that 18 sessions of NMES applied to the dorsiflexor and plantar flexor muscles of both legs increased the strength of the dorsiflexor muscles in the affected leg and elicited a transient increase in strength of the plantar flexors in the less-affected leg. Given the critical role of the dorsiflexor muscles in limiting walking performance in persons with neurological disorders,13-15 it seems likely that at least some of the improvements in walking endurance and maximal walking speed in our study can be attributed to the increase in strength of the dorsiflexor muscles of the affected leg.
Consistent with previous reports on healthy individuals in which force steadiness is usually worse in weaker muscles,40,41 the fluctuations in force during submaximal isometric contractions with the dorsiflexors were greater in our study than those for the plantar flexors at both target forces. Compared with healthy individuals, however, the force fluctuations (coefficient of variation for force) for the dorsiflexors in the current study (5.9% ± 5.1%) were much greater than those for both young (1.20% ± 0.62%) and older adults (1.74% ± 0.69%). Similarly, force steadiness for the plantar flexors was greater for individuals with MS (3.8% ± 2.5% at 10% MVC and 3.2% ± 1.8% at 20% MVC) than for healthy adults (mean ± SE at 10% MVC force = 0.93% ± 0.13%). 42 These comparisons indicate that the neural drive to the dorsiflexor and plantar flexor muscles during submaximal isometric contractions is more variable for individuals with MS relative to healthy adults. Moreover, force steadiness for the plantar flexors at 20% MVC, but not the dorsiflexors, improved after the NMES intervention, which suggests an adaptation in the neural drive to these muscles that likely has consequences for motor function.40-42
In contrast to expectations, there was no influence of the NMES stimulus-pulse duration on the primary outcomes (gait speed and walking endurance), and the data were combined into a single group to examine the influence of the NMES intervention. The 6-week intervention elicited clinically significant improvements in the primary outcomes and several secondary outcomes in individuals whose mobility was compromised by MS. A major limitation, however, is that the actual influence of NMES could not be evaluated, because of the absence of a control group that would have assessed a potential placebo effect. In addition, we were unable to assess the outcomes during the intervention and for a longer follow-up period. Secondary outcomes suggest that the improvements in mobility likely involve increases in muscle strength and the control of muscle force for some of the involved muscles. These findings suggest that several weeks of NMES applied to the lower-leg muscles can improve walking performance and provide some symptom relief for persons with mild to moderate levels of disability caused by MS.
Footnotes
Acknowledgements
Authors’ Note
Trial registry name: Neuromuscular Electrical Stimulation and Mobility in Multiple Sclerosis. ClinicalTrials.gov Identifier: NCT02152085; https://clinicaltrials.gov/ct2/show/NCT02152085?term=nct02152085&rank=1.
Declaration of Conflicting Interests
The authors declared no potential conflicts of interest with respect to the research, authorship, and/or publication of this article.
Funding
The authors disclosed receipt of the following financial support for the research, authorship, and/or publication of this article: The Eunice Kennedy Shriver National Institute of Child Health & Human Development of the National Institutes of Health provided support for the project (R03HD079508). Chattanooga Inc. kindly loaned us 3 Vectra Genesys 2-channel systems that are Food and Drug Administration approved for the delivery of neuromuscular electrical stimulation to human volunteers. Almuklass was supported by a scholarship from the King Saud bin Abdulaziz University for Health Science in Saudi Arabia.