
Abstract
Background. Parkinson’s disease (PD) can be classified into tremor dominant (TD) and postural instability and gait difficulty (PIGD) subtypes with TD considered as the benign subtype. The neural alterations of the 2 subtypes in the early stages before administration of medications remain elusive. Objective. This study assessed the subtype-related white matter (WM) microstructural features in newly diagnosed and drug-naive PD patients from the Parkinson’s Progression Markers Initiative (PPMI). Methods. Sixty-five early PDs with stable subtypes (52 TD and 13 PIGD patients) and 61 controls underwent diffusion tensor imaging (DTI) scanning and clinical assessment. Tract-based special statistics (TBSS), graph-theoretical and network-based analyses were used to compare WM regional and network features between groups. Results. No differences in disease stages and duration were found between the 2 patient groups. TD patients showed increased fractional anisotropy (FA), but decreased radial and axial diffusivities (RD and AD) in several projection, association, and commissural tracts, compared with PIGD patients and controls. Motor severity had mild-to-moderate correlations with FA and RD of the corpus callosum (genu) in TD, but strong correlations with FA and RD of multiple association tracts in PIGD. Conversely, no significant network changes were noted. Conclusions. TD patients showed regionally increased FA but decreased diffusivities, implying neural reorganization to compensate PD pathology in early stages. PIGD patients, despite having similar disease stages and duration, exhibited more WM degradation. These results demonstrate differential WM regional features between the 2 subtypes in early PD and support the notion of TD being a benign subtype.
Keywords
Introduction
Parkinson’s disease (PD) is a progressive neurodegenerative disorder, characterized by cardinal motor symptoms, including rigidity, bradykinesia, resting tremor and postural instability, as a result of striatal dopamine deletion.1,2 Despite the well-recognized motor symptoms, PD is a heterogeneous syndrome with varied clinical manifestations. One of the commonly used subtypes in clinical studies is the classification of tremor dominant (TD) and postural instability and gait difficulty (PIGD) subtypes.3,4 Previous studies have shown that these 2 subtypes differ not only in their dominant motor symptoms, but also in nonmotor symptoms. For instance, PIGD patients are more likely to have impaired cognitive function, faster disease progression and poorer quality of life, as compared with TD patients.5-9 Because of the devastating effects observed in PIGD, TD is considered a benign subtype. 10
Different clinical presentations and progression of the 2 motor subtypes suggest distinct neural mechanisms that underlie these subtypes. Previous functional magnetic resonance imaging (fMRI) studies have demonstrated that tremor symptoms in PD are associated with increased activity or connectivity within the cerebello-thalamo-cortical circuit, which are partially driven by the basal ganglia.11-17 Notably, among de novo patients, differential dopamine transporter (DAT) availability was noted between motor subtypes. Specifically, patients with non-TD subtype exhibited lower DAT levels in the putamen, but comparable DAT levels in the caudate, as opposed to TD patietns. 18 However, the white matter (WM) pathogeneses of TD and PIGD remain unclear. Diffusion tensor imaging (DTI) is a noninvasive neuroimaging technique that can encode information about the orientation of water molecular movements within the brain WM tracts. Existing DTI studies, though few in number, have revealed that PIGD patients had greater diffusivities and greater reduction of WM integrity in both basal ganglia and extra-nigrostriatal tracts, compared with TD patients.19-22 Yet, contrary findings have also been reported.19,23
Most of the previous DTI studies used a region-of-interest (ROI) approach that examined only a few preselected brain regions, thereby providing no information about the unselected regions. In addition, none of these studies clearly addressed how head motion was controlled for in their analyses. Head motion, common in PD patients, may produce spurious group differences and hence false positive findings in DTI analysis.24-26 Furthermore, to date, there are no known studies assessing the alterations of WM networks in TD and PIGD. The human brain can be conceptualized as an integrated large-scale network. The current focus in neuroimaging research is on the study of integrated models of brain structure and function rather than a set of independently operating brain areas. 27 Graph-theoretical approaches allow one to characterize the segregation and integration within the nodes (ie, brain regions) of the structural network. 28 Network-based statistics (NBS) offer complementary information about specific features within a network that can be applied to elucidating the structural and functional organization of the brain. 29
In the current study, we examined the WM regional and network alterations relating to TD and PIGD in the early stages before administration of medications. We hypothesized that in the early disease stages, TD and PIGD subtype-related WM differences would be present at a small-scale level (regional alterations), but not a large-scale level (network changes).
Methods
Participants
All participants, including newly diagnosed untreated PDs and matched healthy control (HCs), in the current study were obtained from the Parkinson’s Progression Markers Initiative (PPMI, http://www.ppmi-info.org/). The PPMI is an observational, international, multicenter study designed to identify PD progression biomarkers. The study was approved by the institutional review board of all participating sites. Written informed consent was obtained from all participants before study enrollment. The study was performed in accordance with relevant guidelines and regulations. To be enrolled into the PPMI study, all patients were required to fulfill the following criteria: (1) met the standard diagnostic criteria for PD, (2) diagnosed within 2 years before the initial visit, (3) Hoehn and Yahr (H&Y) stage ≤2 at baseline, (4) demonstrated deficits of DATs on single-photon emission computed tomography (SPECT) imaging, and (5) not on any PD medication at baseline. All HCs were required to have normal DATs and be free of any significant neurological disorders and medications that might interfere with the results of DAT SPECT imaging. For all participants, only those with quality DTI at baseline (see the Image Preprocessing section for detailed descriptions) and additionally for PD patients, those with stable subtypes (ie, patients were classified into the same subtypes at baseline and at 1-year follow-up) were included in the current study. This was because a recent study has indicated substantial variability in motor subtype classification in de novo PD patients. 30 The subtype classification was based on a previously established method. 31 using the Movement Disorder Society-sponsored revision of the Unified Parkinson’s Disease Rating Scale (UPDRS) II and III, 32 such that if the ratio (tremor score/PIGD score) ≥1.15 or if PIGD score = 0 and TD score >0, then the subject is TD, if the ratio is ≤0.9, the subject is PIGD, and if ratio >0.9 or <1.15 or both tremor and PIGD scores = 0, the subject is classified into the indeterminate subtype.
Clinical Assessment
After initial screening, all subjects were comprehensively assessed at the baseline visit for clinical performance on motor and nonmotor functions by the site investigators. General motor severity was evaluated using UPDRS-III. 32 All patients at baseline and the majority of patients at 1-year follow-up were assessed in the off-medication state. Global cognitive function was assessed using the Montreal Cognitive Assessment (MOCA). 33 Neuropsychiatric assessment was performed using the 15-item Geriatric Depression Scale (GDS). 34 Moreover, cardiovascular burden was determined by the presence or absence of hypertension, diabetes mellitus, and hypercholesterol, and use of antihypertensive medications as well as body mass index (BMI), and supine and standing systolic blood pressure.
Baseline MRI Acquisition
MRI was performed using a standardized protocol on 3T Siemens scanners (all Siemens Healthcare, Malvern, PA). Details of the MRI acquisition can be found in the MRI technical operations manual at http://www.ppmi-info.org/. In brief, a 2-dimensional echo-planar DTI sequence was acquired for each subject using the following parameters: repetition time/echo time (TR/TE) = 900/88 ms, flip angle = 90°, voxel size = 2 × 2 × 2mm3, 72 slices, 64 gradient directions with a b-value of 1000 s/mm2. One nongradient volume (b = 0 s/mm2) was also acquired. The MRI protocol was distributed to each recruiting site to ensure consistent installations.
Image Preprocessing
All DTI data was preprocessed using FSL 5.0.7 (http://fsl.fmrib.ox.ac.uk/fsl). Eddy currents and head motion were corrected by affine registration to the first b0 image using the “eddy_correct” function in FSL. The movement of each participant in terms of x, y, and z coordinates was computed based on the output of eddy_correct. A brain mask was created using the fractional intensity threshold of 0.3 to ensure that only diffusion tensors inside the brain were computed. The diffusion tensors were then linearly fitted to the diffusion-weighted images using the “dtifit” tool in FSL, to generate maps of fractional anisotropy (FA), mean diffusivity (MD), axial diffusivity (AD), and radial diffusivity (RD). MD and FA quantify the overall diffusivity and the extent of diffusional directionality, respectively. 35 Apart from MD and FA, AD and RD, referring to the diffusivity along the axon and perpendicular to the axon, have shown greater sensitivity to underlying axonal and myelin alterations.36,37 All output images were visually inspected to ensure the absence of artifacts.
In addition, a measure of volume-to-volume displacement was obtained for each participant using the output file of the “eddy_correct” motion correction function. To reduce the effect of excessive head motion during DTI acquisition, only participants who showed limited head movement during imaging acquisition (ie, translation <3 mm; rotation <2°; maximum absolute head motion <4 mm) were included in the study.
Tract-Based Spatial Statistics Analysis
Tract-based spatial statistics (TBSS) 38 was used to perform voxel-wise comparisons of DTI measures between groups following the methods described in our previous work. 39
Network Construction
A brain network can be described as a graph, where the nodes are brain regions and the edges are the connections between nodes. Here, the nodes were defined using the Automated Anatomical Labeling (AAL) atlas that included a total of 116 cortical and subcortical regions. 40 The DTI data were first reconstructed in the Montreal Neurological Institute (MNI) space using q-space diffeomorphic reconstruction (QSDR) to obtain the spin distribution function. A diffusion sampling length ratio of 1.25 was used. 41 Whole-brain deterministic tractography was performed in DSI Studio (http://dsi-studio.labsolver.org). Fiber tracking was stopped if the reconstructed fiber entered a voxel with quantitative anisotropy (QA) of less than 0.2 and if the streamline made a turn with a curvature angle of more than 45°. Tracts with length less than 30 mm were discarded. The overall pattern of WM connections between each pair of brain nodes was computed using binary matrices with P < .001 as the threshold. In the binary matrices, each edge represented the number of tracts that connect the 2 nodes. The connectivity matrices and graph theoretical analysis were conducted with the DSI Studio and Brain Connectivity Toolbox. 28 The following global network metrics were investigated: network density, clustering coefficient, network characteristic path length, small-worldness, global efficiency, local efficiency, and assortativity coefficient.
NBS 29 was used to further localize specific pairs of brain regions where WM structural connectivity was altered in TD and PIGD. Two-sample t tests were used to examine the mean difference in connectivity strength (defined by QA) of any connected components between groups. A corrected P value was calculated for each component, using the null distribution of maximal connected component size derived with a nonparametric permutation method.
Statistical Analysis
Demographical and clinical data, and head motion during DTI acquisition were analyzed using IBM Statistical Package for Social Sciences software (version 21; IBM Corp, Armonk, NY). For continuous variables, 1-way analysis of variance (ANOVA) and independent-sample t tests were used to compare group differences where appropriate. Pearson’s chi-square or Fisher’s exact tests were used to compare categorical variables.
One-way ANOVA was performed in a general linear model using “randomize” in FSL to test overall group differences in FA, MD, RD, and AD, and differences between any 2 of the TD, PIGD, and HC groups, while controlling for age, gender, and education. This program used permutation-based testing with 5000 permutations and statistical inference by applying threshold-free cluster enhancement (TFCE) 42 with a threshold of P < .05, corrected for multiple comparisons. Any regions on the whole-brain FA skeleton that showed significant group differences in FA, MD, RD, or AD were localized using the Johns Hopkins University ICBM-DTI-81 White Matter labels and White Matter Tractography atlases in FSL. To determine the clinical significance of DTI findings, DTI information of tracts showing significant group differences were extracted and correlated with general motor severity, global cognitive function, and depression severity using Pearson’s correlation with significance defined at P < .05 (Bonferroni corrected) for patients only.
The comparisons of global network metrics between groups were examined using ANOVA with P < .05 being considered significant. To determine the significance levels of altered connectivity networks in NBS analysis, we performed a 2-sample test at each edge independently to test for group differences in connectivity. A threshold (P = .05) was used to form a set of suprathreshold edges among which any connected components and their size (number of edges) could be determined. The statistical significance of the size of each observed component was assessed with regard to an empirical null distribution of maximal component sizes obtained under the null hypothesis of random group membership (10 000 permutations). Significant subnetworks were determined at P < .05 (corrected).
Results
Demographic and Clinical Findings
DTI data of 222 participants were initially downloaded. 10 participants’ images were subsequently excluded due to either excessive head motion or artifacts. Among the remaining subjects with quality DTI, only 126 participants (61 HCs, 52 TDs, and 13 PIGDs) recruited from 11 different centers were included in this study as they had UPDRS-II and III data at both baseline and 1-year follow-up and for patients, they showed stable subtypes at the 2 time-points. None of the participants had the diagnosis of dementia at study entry. There were no statistically significant differences in demographic and clinical variables, including cardiovascular burden, between groups (Ps >.05). As expected, a significant group difference in general motor severity at both baseline and follow-up was noted (Ps <.001). Post hoc analysis indicated that both TD and PIGD groups had higher motor scores than HCs (Ps <.001); however, the 2 PD subgroups showed similar motor severity (Ps >.05). In addition, no significant differences between the 2 subtypes in disease duration, H&Y staging, and symptom dominant side were noted. Detailed demographic and clinical data and statistics are presented in Table 1.
Demographic and Clinical Characteristics (All Analyses 1-Way Analysis of Variance, unless otherwise specified).
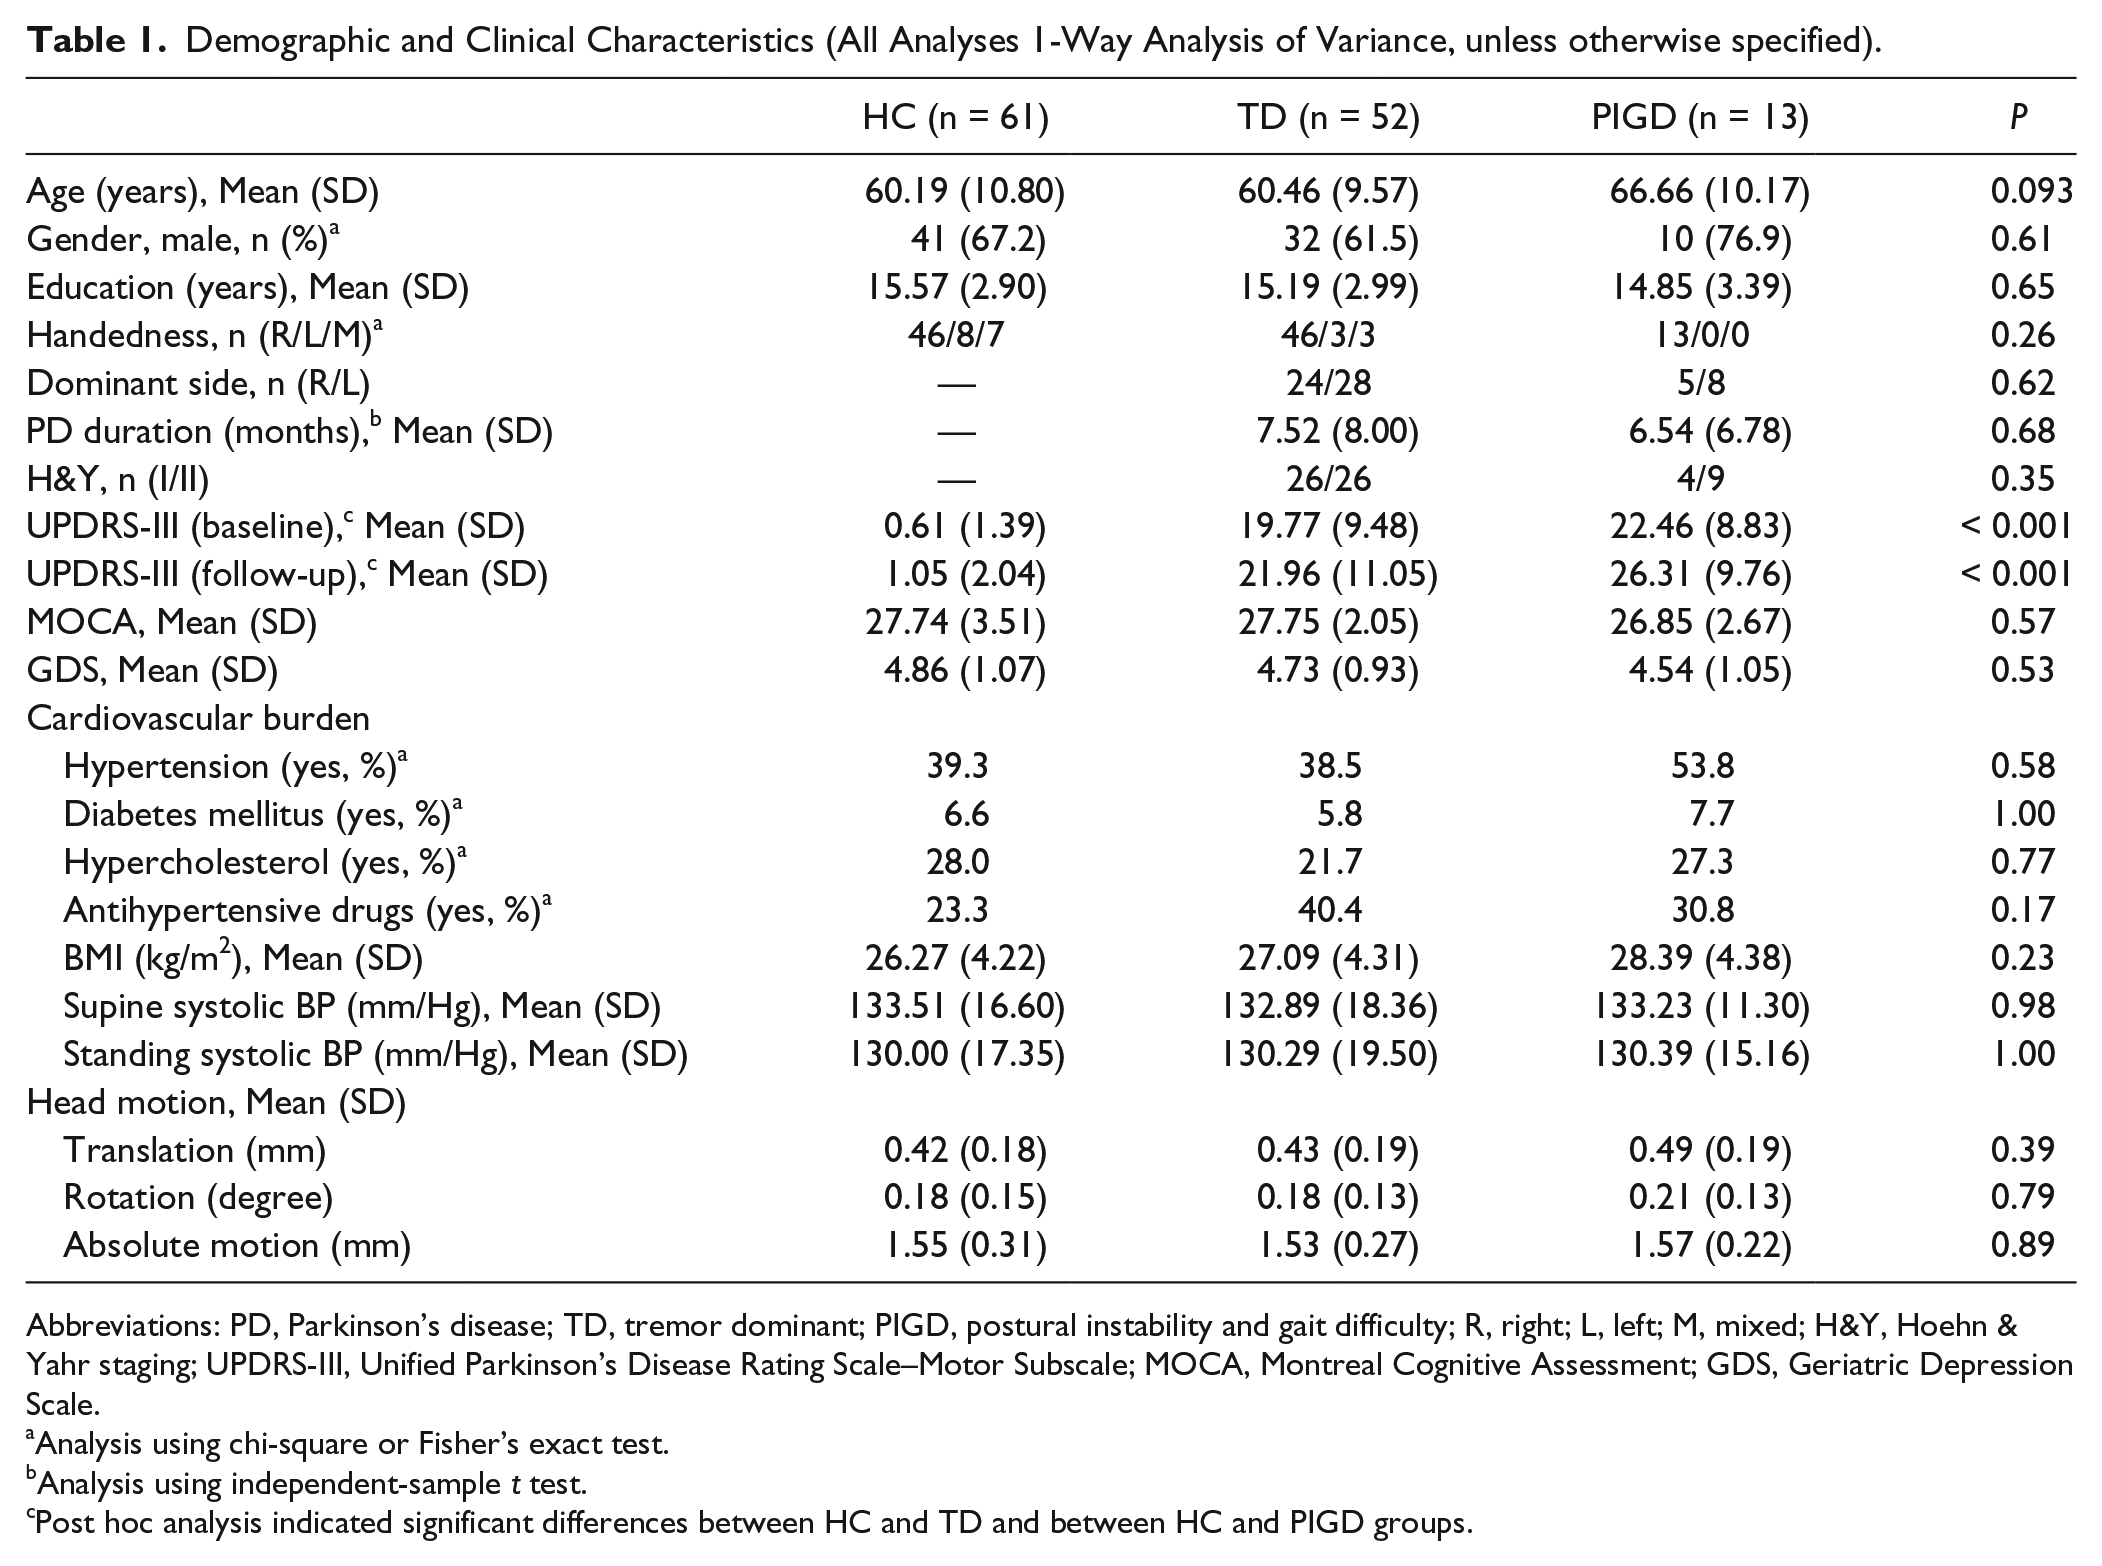
Abbreviations: PD, Parkinson’s disease; TD, tremor dominant; PIGD, postural instability and gait difficulty; R, right; L, left; M, mixed; H&Y, Hoehn & Yahr staging; UPDRS-III, Unified Parkinson’s Disease Rating Scale–Motor Subscale; MOCA, Montreal Cognitive Assessment; GDS, Geriatric Depression Scale.
Analysis using chi-square or Fisher’s exact test.
Analysis using independent-sample t test.
Post hoc analysis indicated significant differences between HC and TD and between HC and PIGD groups.
TBSS Analysis
There were no significant group differences in the degree of head motion (Ps >.05, see Table 1).
Compared with HCs, TD patients showed increased FA in several projection, association, limbic, and commissural tracts (P < .05), such as the left anterior thalamic radiation and inferior fronto-occipital fasciculi, bilateral superior and inferior longitudinal fasciculi, and sagittal stratum, as well as the right cingulum and corticospinal tract. Similarly, TD patients showed increased FA in multiple areas belonging to commissural tracts (eg, corpus callosum and forceps minor), projection tracts (eg, bilateral thalamic radiation), and association tracts (eg, bilateral superior and inferior longitudinal fasciculi, and left sagittal stratum), when compared with PIGD patients (P < .05). In contrast, there were no tracts indicating increased FA in the HC and PIGD groups as opposed to the TD group. There was also no significant FA difference between HCs and PIGD patients.
For diffusivity measures, there was no significant group difference in MD. However, for RD, we found that TD patients had significantly attenuated RD compared with HC and PIGD groups (P < .05), but there was no significant difference between the latter 2 groups. Compared with TDs, HCs exhibited greater RD in several association, projection and limbic tracts, while PIGDs showed greater increase of RD widely distributed in not only the aforementioned tracts showing differences between TD and HC, but additionally in multiple commissural tracts, such as the corpus callosum (genu), forceps major and minor. With regard to AD, the PIGD group showed significantly greater AD than the HC and TD groups (P < .05), while no significant difference between HCs and TDs was found. Tracts indicating greater AD in the PIGD group than in the HC group were localized in the anterior commissural, projection, and association tracts. Compared with the TD group, patients with PIGD presented greater AD in more tracts of the commissural, projection, and association WM systems; many of which were also observed in the comparison between PIGD versus HC groups. Figure 1 and Table 2 present the WM tracts showing significant group differences in FA, AD, and RD.
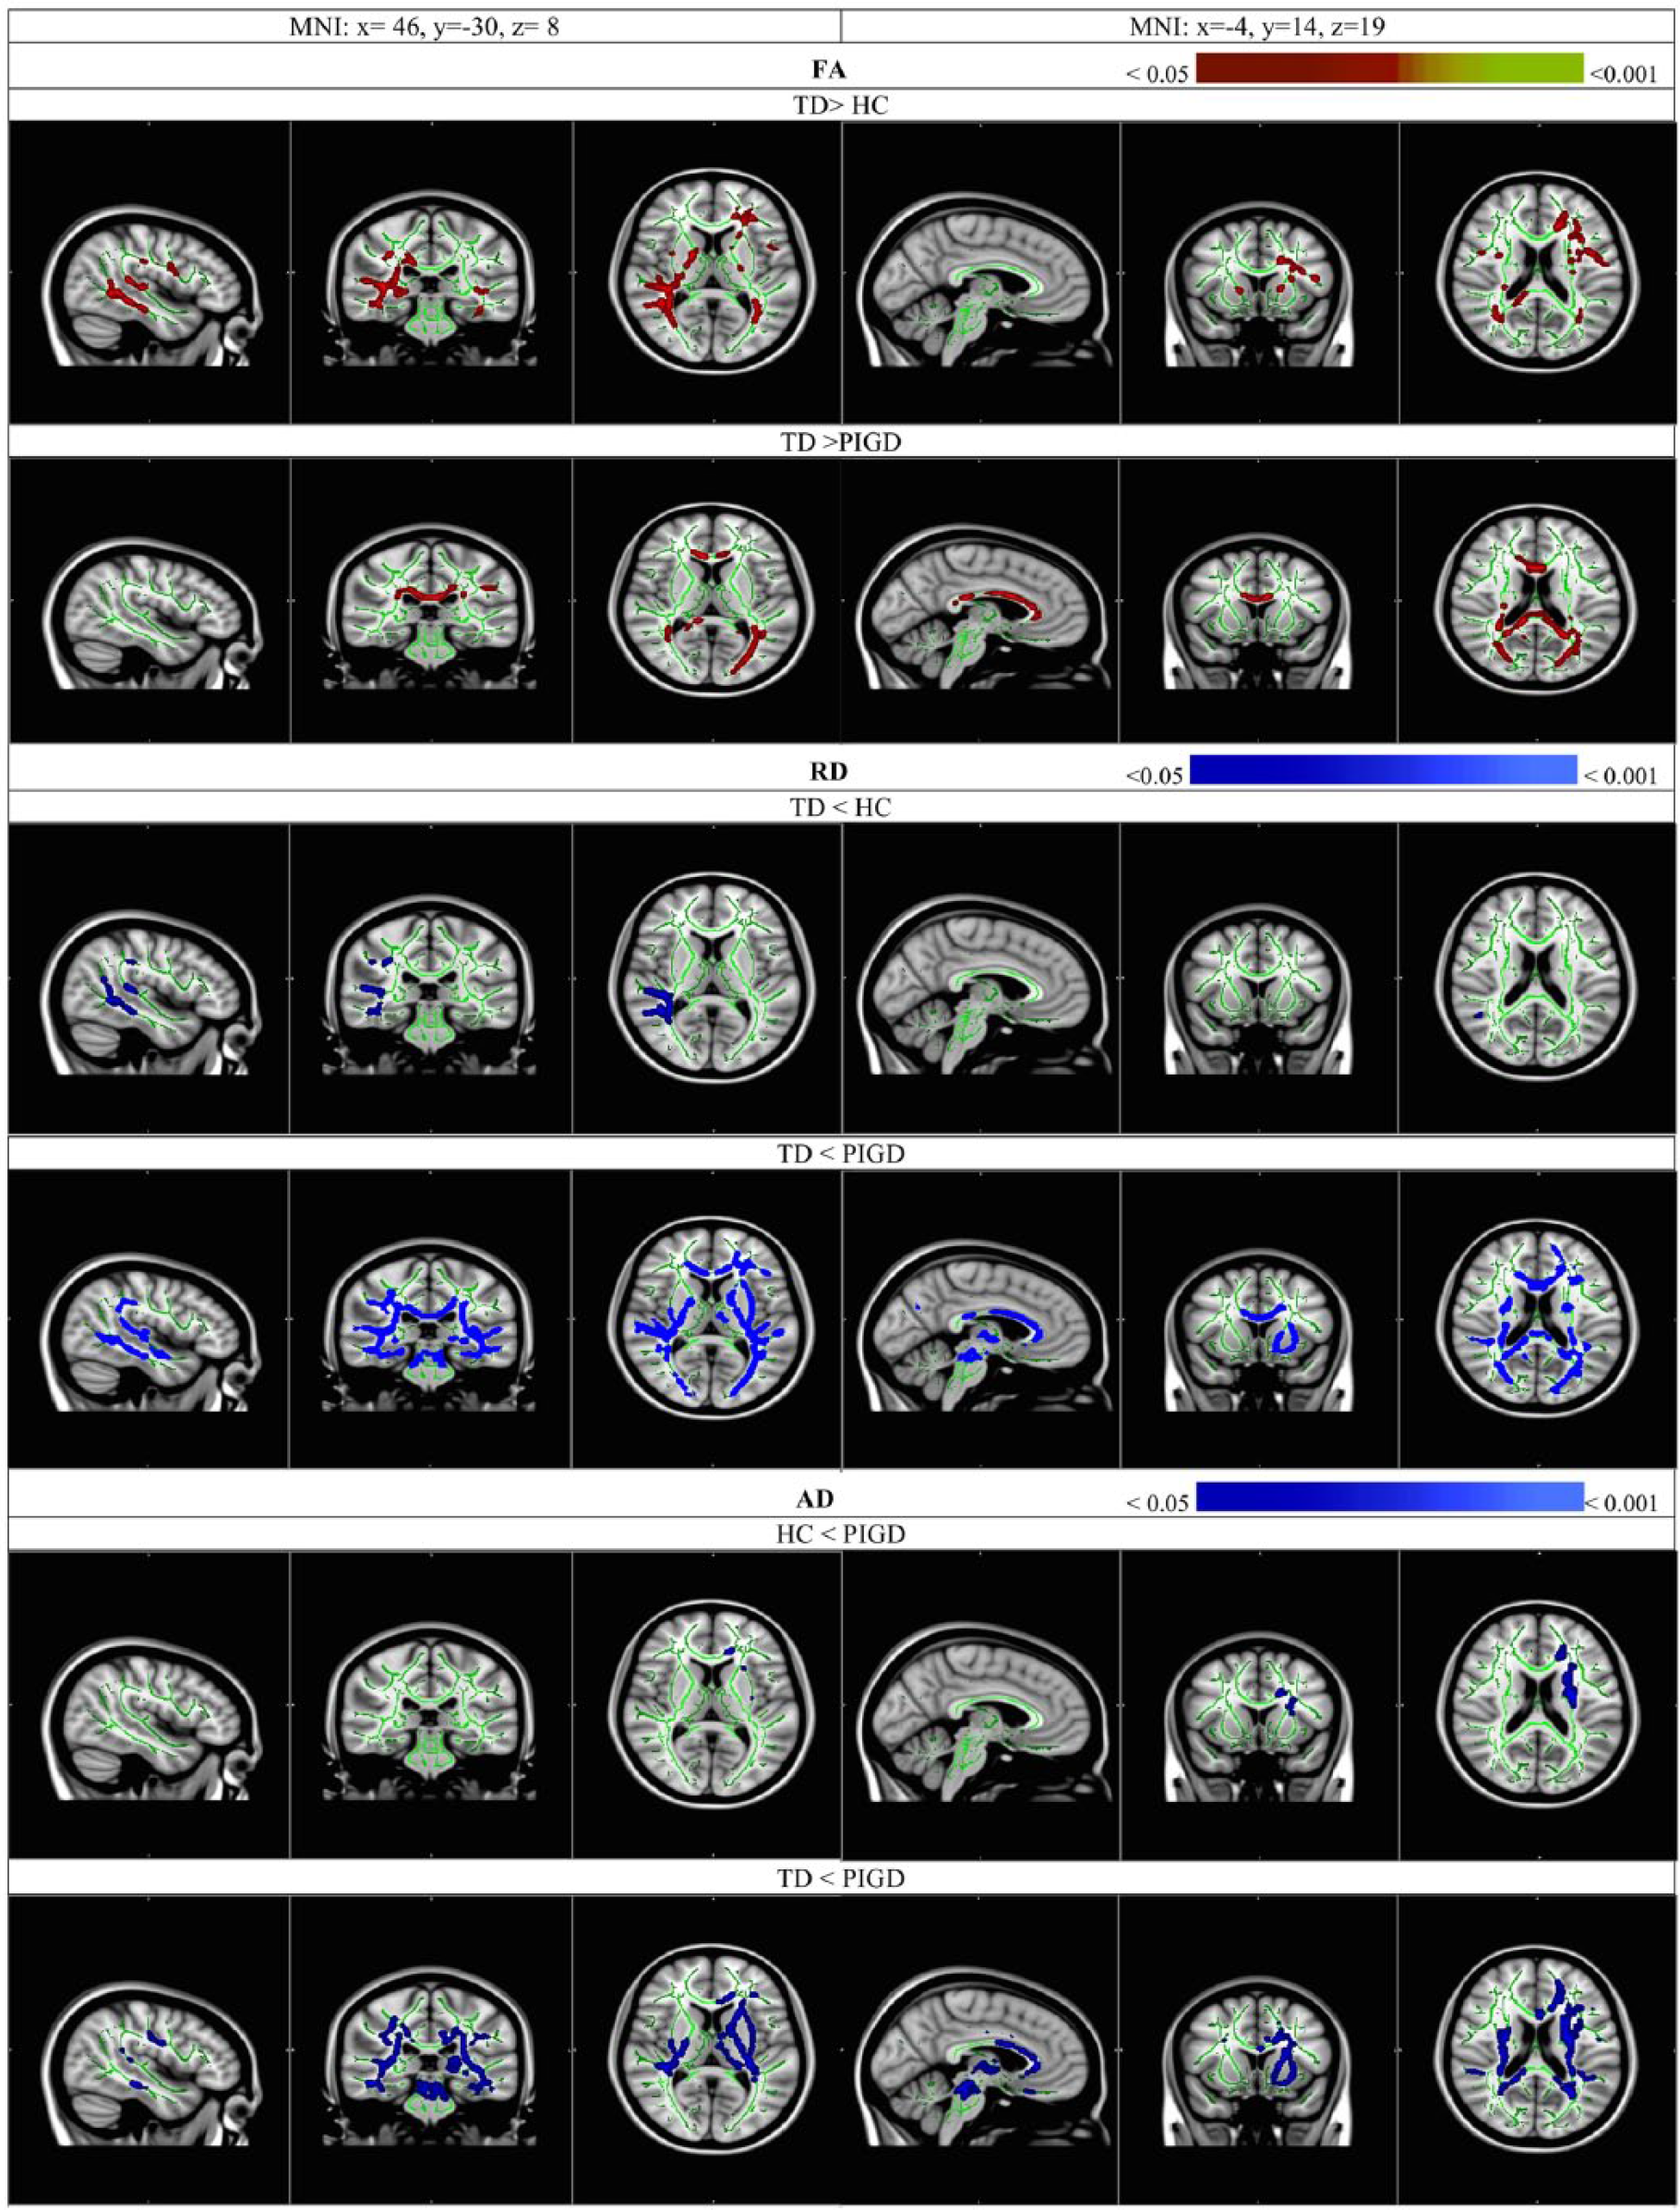
Increased FA (red-yellow), decreased RD and AD (blue–light blue) in the WM tracts in TD overlaid on the study-specific mean FA skeleton (green), compared with HC and PIGD (P < .05, corrected for multiple comparisons using TFCE). Images are in radiological display. Colour bars refer to P-value ranges. FA, fractional anisotropy; RD, radial diffusivity; AD, axial diffusivity; WM, white matter; TD, tremor dominant; HC, healthy controls; PIGD, postural instability and gait difficulty; TFCE, threshold-free cluster enhancement.
White Matter Tracts Showing Significant Group Differences in Fractional Anisotropy (FA), Radial Diffusivity (RD), and Axial Diffusivity (AD).
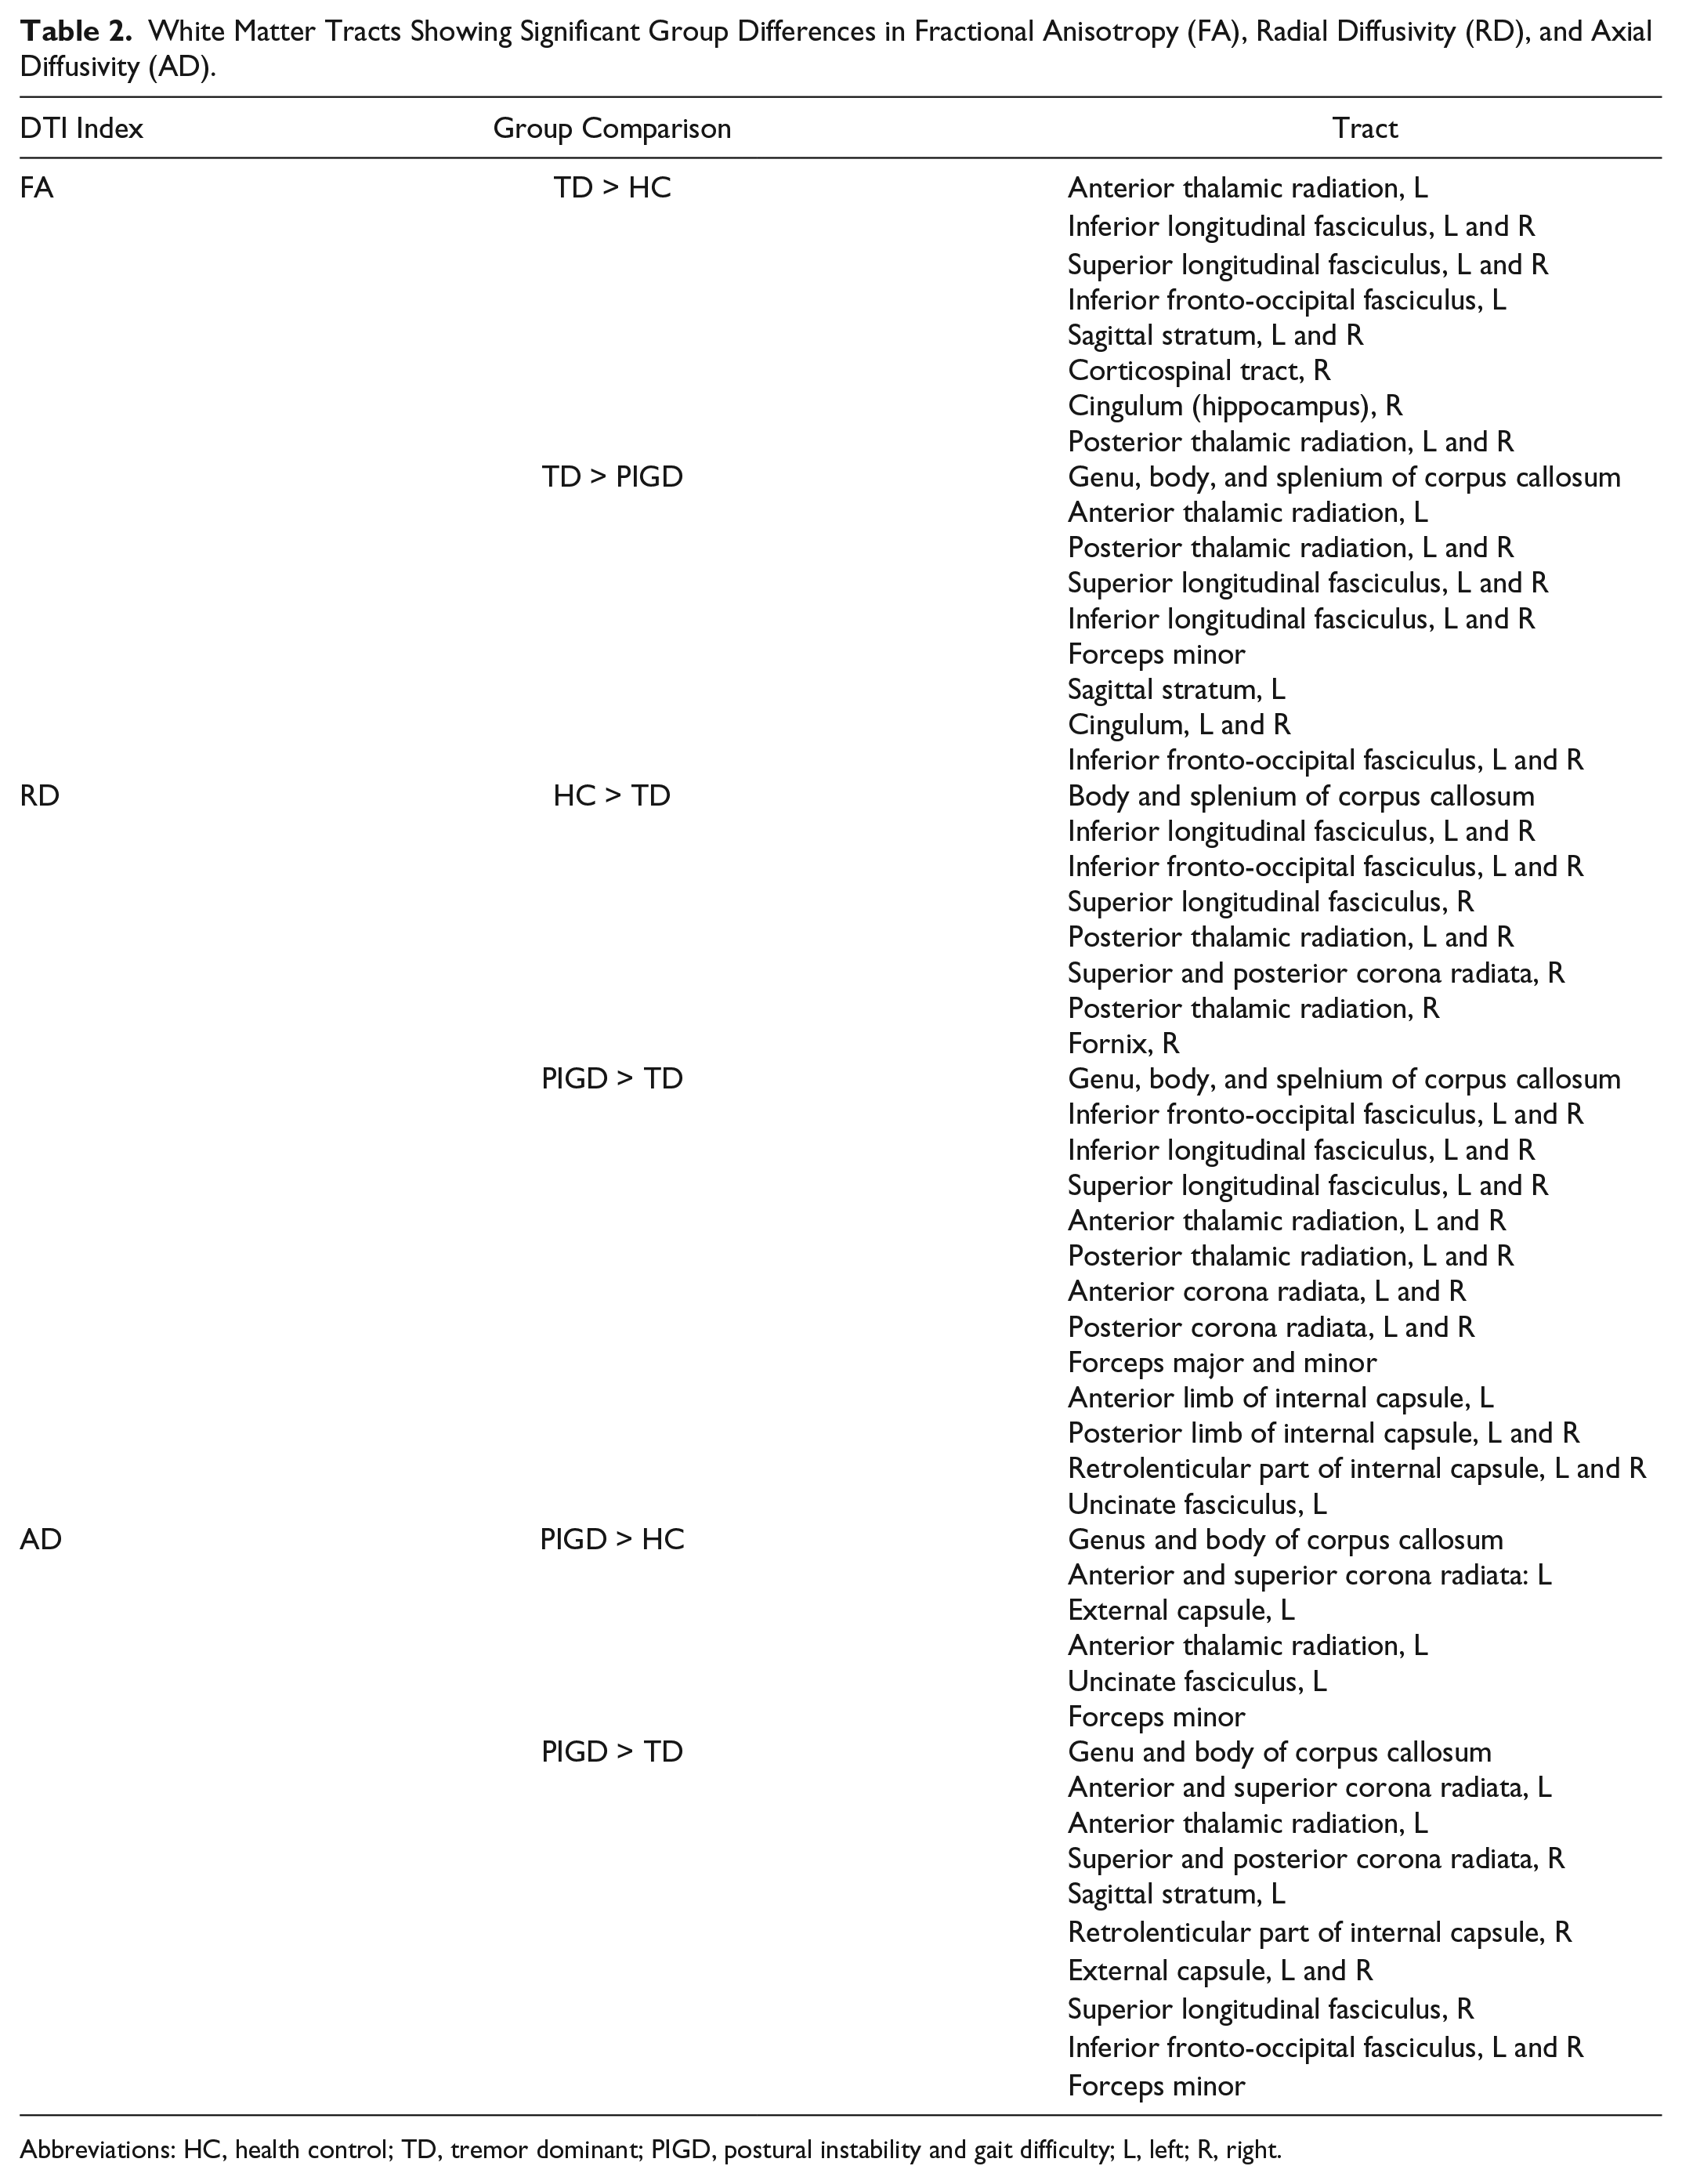
Abbreviations: HC, health control; TD, tremor dominant; PIGD, postural instability and gait difficulty; L, left; R, right.
Evaluation of Clinical Significance of DTI Alterations
Extracting FA values from the aforementioned significant tracts to correlate with general motor severity, indicated by the total UPDRS-III score, among patients revealed that while a mild-to-moderate correlation between FA in the genu of the corpus callosum and motor severity was found in TD (r = −0.41, P = .048), stronger correlations between FA and motor severity were noted in multiple tracts of PIGD patients, including the bilateral inferior longitudinal fasciculi (left, r = −0.79, P = .016; right, r = −0.76, P = .048) and right posterior thalamic radiation (r = −0.78, P = .032). Likewise, correlating RD values extracted from the significant WM tracts showing group differences with general motor severity indicated a mild-to-moderate correlation between the genu of the corpus callosum and motor severity in the TD group (r = 0.47, P = .006). In contrast, motor severity was found to be strongly correlated with multiple WM tracts, including the bilateral inferior longitudinal fasciculi (left, r = 0.82, P = .024; right, r = 0.76, P = .048), inferior fronto-occipital fasciculi (left, r = 0.78, P = .048; right, r = 0.86, P = .004), and posterior thalamic radiation (left, r = 0.82, P = .024; right, r = 0.83, P = .01) in the PIGD group. Applying the same method to AD did not show any significant tract correlated with motor severity in TD (P > .05), while for PIGD, there were strong correlations of motor severity with the left sagittal stratum, including the inferior longitudinal fasciculus and inferior fronto-occipital fasciculus (r = 0.75, P = .069) and with the right inferior longitudinal fasciculus (r = 0.73, P = .092), respectively, although the correlations only approached significance after correcting for multiple comparisons. Figure 2 plots the significant correlations between the DTI values of the significant tracts and general motor severity in each of the PD subgroups.
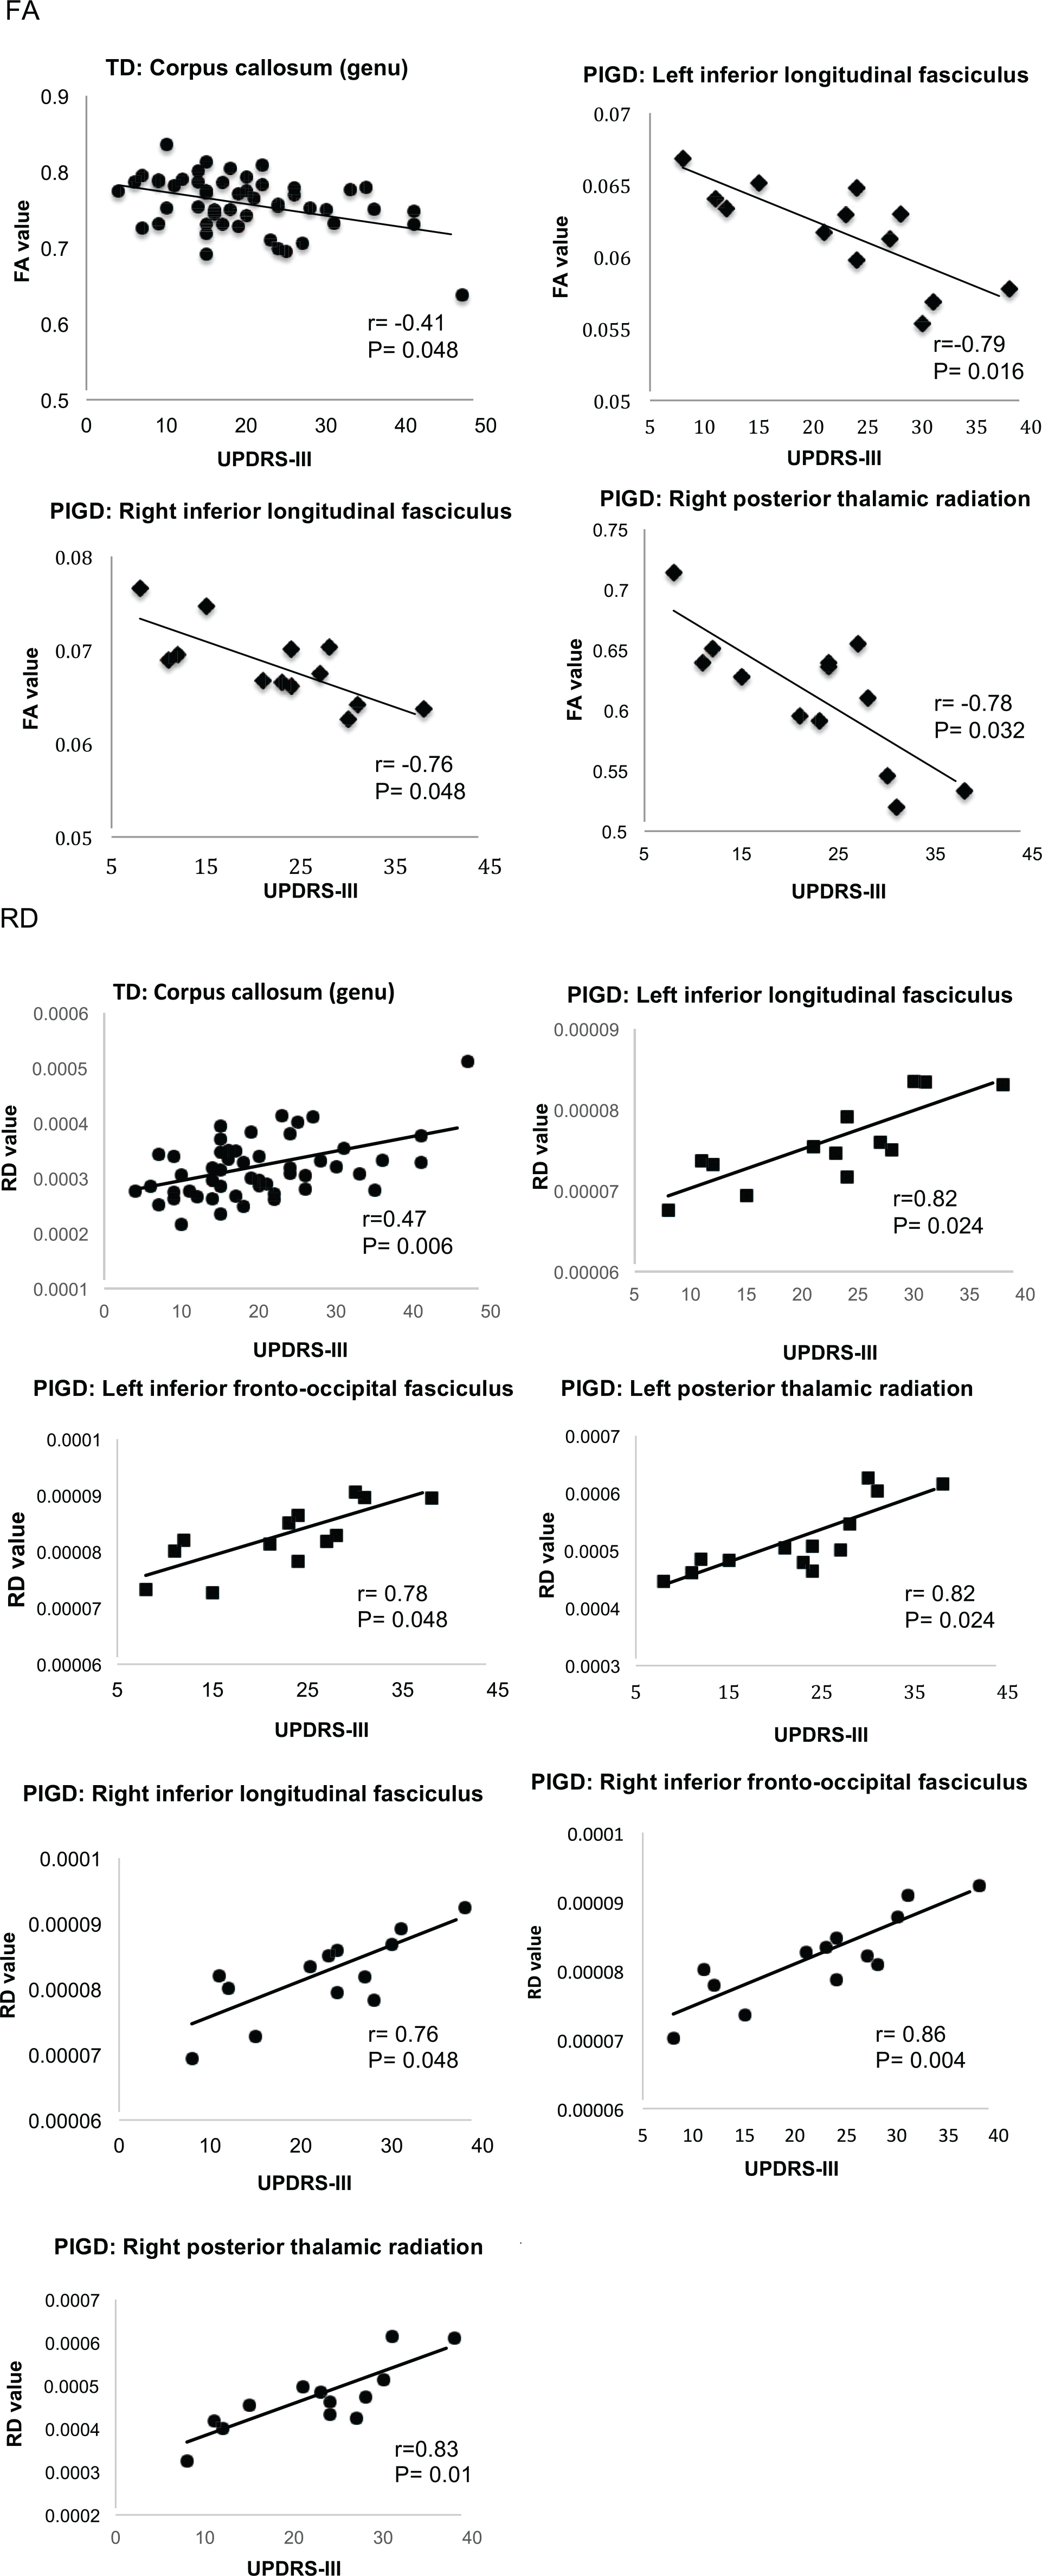
Scatterplots of WM tracts showing inverse relationships between UPDRS-III and FA and positive relationships between UPDRS-III and RD in PD. Correlation coefficients (rs) and P values (corrected) are presented. WM, white matter; UPRDS-III, Unified Parkinson’s Disease Rating Scale–III; FA, fractional anisotropy; RD, radial diffusivity; PD, Parkinson’s disease.
Moreover, FA, RD, and AD of the significant tracts did not correlate with MOCA and GDS scores in both subtype groups (Ps >.05).
Brain Network
The results of the analysis of graph-theoretic topologic properties are shown in Table 3. There were no significant differences in the global network metrics based on graph-theoretical framework. Similarly, NBS analysis did not reveal any subnetworks with connectivity differences between groups.
Global Topologic Network Properties of TD, PIGD, and HC Participants.
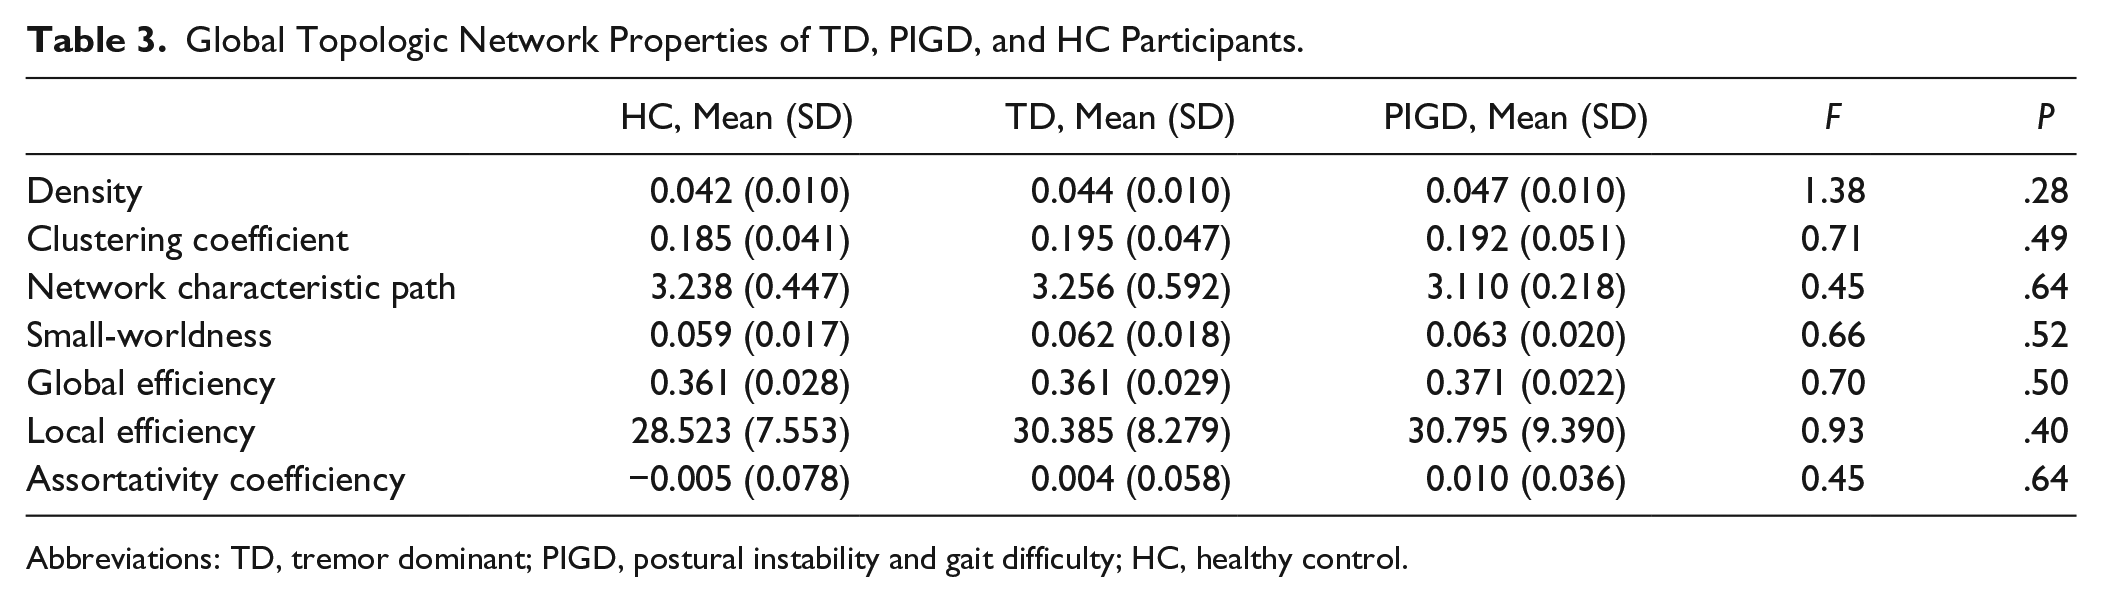
Abbreviations: TD, tremor dominant; PIGD, postural instability and gait difficulty; HC, healthy control.
Discussion
This study used unbiased whole-brain analysis to examine the WM features of early drug-naive PD patients who were prospectively followed up to ensure that they were stable TD or PIGD subtypes. We found that at the small-scale (regional) level, TD patients showed greater FA and attenuated RD and AD, suggesting greater WM integrity and less axonal degeneration and demyelination, when compared with HCs or PIGD patients. In contrast, PIGD patients, though similar in disease stages and duration as TD patients, had more WM deterioration, reflected by decreased FA but increased RD and AD, compared with TD patients or HCs. Although motor severity was inversely correlated with FA and positively correlated with RD in both subtypes, more tracts of the PIGD group were involved in the associations with motor severity as opposed to the TD group. Also, the correlations of DTI with motor severity were stronger in the PIGD group than in the TD group. At the large-scale level, no significant network alterations were noted in early TDs and PIGDs, compared with HCs.
Unlike previous studies, our voxel-wise analysis revealed that de novo TD patients had greater WM integrity and less axonal and myelin damage, when compared with demographically and cognitively well-matched HCs. This implied neural reorganization to compensate for the impact of dopamine deficits in TD. Prior postmortem studies have demonstrated that PD patients with TD subtype had less cell loss in the dopaminergic and nondopaminergic neural circuits than nontremor PD patients.43,44 A recent clinical study similarly indicated increased pallidal gray matter (GM) volume in PD patients with TD subtype than in HCs. 45 The increased cerebral compensation may explain why TD patients have a more benign disease course. 10 Building on prior work, our study is, to our best knowledge, the first to show potential neural compensation in TD subtypes that is demonstrated by WM enhancement outside the nigro-striatal regions.
Previous studies indicated similar WM microstructural properties between TD and HC,19,22 which was different from what we observed in the current study. The seemingly discrepant results could be related to the different disease stages of TD patients. Previous studies examined TD patients with disease duration exceeding 5 years and with slightly more advanced disease stages,19,22 compared with the patients in our study. In effect, it is reasonable to expect that as the disease progresses, more neural resources may diminish, which could cause the dissipation of neural enhancement and eventually lead WM properties to returning to the level similar to that of HCs.
Although there were previous reports on GM differences between different subtypes,19,45-48 the differences were mainly detected with ROI analyses, except the work by Rosenberg-Katz and colleagues. 46 Of note, none of these studies examined subtype-related GM changes in newly diagnosed PD patients, making it unclear whether GM features in the early stages can differentiate between the TD and PIGD subtypes. WM alterations may be more marked before any significant GM changes in PD as indicated previously49,50 and thus serve as a better biomarker for differentiating the subtype pathology. Furthermore, since we also found motor severity of TD patients to be associated with WM properties of the corpus callosum (genu), it may be speculated that the WM alterations in early TD patients occur outside the nigrostriatal loop and that the anterior commissural WM might be key to the motor pathology of early TD patients.
Our findings also revealed more marked WM degradation in patients with the PIGD subtype relative to those with TD subtype and HCs, despite no differences in disease duration, staging, severity, and dominant sides between the 2 patient groups, and no demographic, cognitive and psychiatric differences between PIGD, TD, and HC groups. Our findings were generally in agreement with the literature.19-22 Decreased FA in several major WM tracts of the PIGD group suggested more widespread WM microstructural decline in PIGD than in TD or HC. More WM pathology in PIGD, but not in TD, was previously noted in studies examining WM lesions on fluid-attenuated inversion recovery (FLAIR) images.51-53 Findings from our current study further demonstrated that the WM microstructural alterations occurred even in early and drug-naive PIGD patients. While we observed significant group differences in WM voxel-wise properties from TBSS analysis, we did not find any network changes in this early PD cohort. These findings suggest that small-scale (region) changes predate large-scale (network) changes in the early disease stages. Notably, the observed WM alterations in TD versus PIGD might be exclusively related to the motor pathology, as we did not find any of the DTI changes to be associated with nonmotor symptoms.
Although literature has demonstrated reduced FA but increased diffusivities in PD than HC,54,55 our current study showed WM degradation, mainly in the association tracts, to be more related to motor severity of patients with PIGD subtype. As the association tracts link the anterior and posterior parts of the brain, their involvement may suggest widespread pathologic changes in PIGD. This view has been appreciated by previous studies using whole-brain analysis.19,46 In contrast, the motor severity of TD patients was only mildly to moderately correlated with WM changes in the genu of the corpus callous. This is an interesting observation, indicating that although both subtypes had similar motor severity, the alterations of WM tracts in PIGD patients had a greater impact on motor function. These observations may suggest different therapeutic approaches for the 2 subtypes. For instance, TD patients may benefit more from neurorehabilitative programs, especially in the early stages, while PIGD patients may need more assistance to cope with functional impairment relating to greater WM degradation.
The strengths of the study were as follows: First, we carefully controlled for head motion and further made sure that no group differences existed in head motion to avoid the spurious positive findings caused by excessive head motion. Second, we included only early drug naive PD patients with stable subtypes to minimize the effects of medications and subtype misclassification as greater variability in subtype presentations can be present in early disease stages, according to a recent study. 30 However, because of the rigorous selection of patients, we had a small sample of the PIGD patients, which could potentially confine the generalizability of our findings and hence be the limitation of the study. Moreover, for some patients, the follow-up motor assessment was conducted only in the on-medication state, which might bias the subtype presentation. Nonetheless, prior work involving the same PPMI cohort indicated that the classification was not affected by dopaminergic treatment in early PD. 30 Finally, although the AAL is a widely used atlas in studies relating to neural networks, 56 it is based on an anatomical parcellation of the MNI single-subject brain and may be prone to interindividual anatomical variability, 40 thereby being a limitation of our study. Future works should test our findings with more refined parcellation systems.
Conclusion
To the best of our knowledge, this is the first study demonstrating WM regional enhancement in de novo TD patients, therefore supporting the notion that TD is a benign subtype of PD. Despite having similar disease severity and duration to those of TD patients, PIGD patients suffered more WM regional degradation that was highly correlated with motor severity. However, WM network alterations were not significant in early TDs and PIGDs. These findings imply fundamental differences in neural mechanisms between the 2 subtypes in early PD and accordingly suggest different therapeutic approaches for patients with different subtypes. Longitudinal studies on large cohorts are needed to better understand the long-term impact of these subtypes.
Footnotes
Acknowledgements
We would like to thank Dr Gerald M. Liew for his assistance with data preparation.
Authors’ Note
Data used in the preparation of this article were obtained from the Parkinson’s Progression Markers Initiative database (www.ppmi-info.org/data). For up-to-date information on the study, visit http://www.ppmi-info.org. PPMI, a public-private partnership, is funded by the Michael J. Fox Foundation for Parkinson’s Research and funding partners, including Abbott, Avid Radiopharmaceuticals, Biogen Idec, Bristol-Myers Squibb, Covance, GE Healthcare, Genentech, GSK-GlaxoSmithKline, Lundbeck, Lilly, Merck, MSD-Meso Scale Discovery, Pfizer, Piramal, Roche, Sanofi Genzyme, Servier, Teva, and UCB (![]() ).
).
Declaration of Conflicting Interests
The authors declared no potential conflicts of interest with respect to the research, authorship, and/or publication of this article.
Funding
The authors disclosed receipt of the following financial support for the research, authorship, and/or publication of this article: This study was supported by the Singapore Ministry of Health’s National Medical Research Council (Grant Nos. TCR12dec010 and NMRC/CNIG/1160/2016).