
Abstract
Background. Evolution of motor function during the first months after stroke is stereotypically bifurcated, consisting of either recovery to about 70% of maximum possible improvement (“proportional recovery, PROP”) or in little to no improvement (“poor recovery, POOR”). There is currently no evidence that any rehabilitation treatment will prevent POOR and favor PROP. Objective. To perform a longitudinal and multimodal assessment of functional and structural changes in brain organization associated with PROP. Methods. Fugl-Meyer Assessments of the upper extremity and high-density electroencephalography (EEG) were obtained from 63 patients, diffusion tensor imaging from 46 patients, at 2 and 4 weeks (T0) and at 3 months (T1) after stroke onset. Results. We confirmed the presence of 2 distinct recovery patterns (PROP and POOR) in our sample. At T0, PROP patients had greater integrity of the corticospinal tract (CST) and greater EEG functional connectivity (FC) between the affected hemisphere and rest of the brain, in particular between the ventral premotor and the primary motor cortex. POOR patients suffered from degradation of corticocortical and corticofugal fiber tracts in the affected hemisphere between T0 and T1, which was not observed in PROP patients. Better initial CST integrity correlated with greater initial global FC, which was in turn associated with less white matter degradation between T0 and T1. Conclusions. These findings suggest links between initial CST integrity, systems-level cortical network plasticity, reduction of white matter atrophy, and clinical motor recovery after stroke. This identifies candidate treatment targets.
Introduction
The evolution of motor function after stroke typically follows 2 divergent paths.1,2 Patients will either recover about 70% of maximum possible improvement (“proportional recovery, PROP”) or show little to no improvement (“poor recovery, POOR”). There is currently no evidence that any available rehabilitation treatment for stroke patients will prevent POOR and favor PROP. Thus, there is a critical need to better understand the mechanisms underlying PROP so that new therapeutic strategies can be developed for improving outcome in patients with severe motor impairment.
All patients with light to moderate initial motor deficits, as quantified with the Fugl-Meyer Assessment (FMA; although the precise cutoff varies across studies), evolve according to the PROP pattern. Conversely, about half of patients with severe initial deficits will show POOR.1,2
Recent studies have revealed that anatomical and physiological measures of corticospinal tract (CST) integrity are important predictors of the likelihood of PROP or POOR patterns in individual patients. The presence of severe initial motor impairment combined with large CST lesion loads identified using diffusion tensor imaging (DTI) is highly predictive of POOR.3,4 Alternatively, the absence of motor-evoked potentials in the affected limb induced by transcranial magnetic stimulation of the ipsilesional primary motor cortex is highly predictive of POOR, irrespective of the initial impairment magnitude. 5 However, it is not known whether this finding is specific to the CST or is also influenced by the extant integrity of other perilesional white matter tracts. Moreover, it is unclear whether PROP and POOR patients also diverge with regard to secondary white matter degradation occurring during the weeks after the acute lesion. While it is known that secondary antero- and retrograde Wallerian degeneration of the CST can take place during the first weeks after stroke in patients with severe motor deficits,6-8 these degenerative processes have so far not been clearly linked to the PROP versus POOR pattern dichotomy.
Furthermore, it is currently unclear whether changes in functional neural network activity in first weeks and months following stroke are predictive of PROP. 9 We know from animal models that cortical reorganization beyond the CST can be necessary for recovery.10-13 Furthermore, there is evidence that this reorganization is reflected by coincident changes in brain structure and function.14,15 Thus, identification of functional correlates of recovery in humans should provide additional crucial information about mechanisms underlying PROP recovery patterns and assist in the identification of new therapeutic approaches.
We addressed these questions by performing a longitudinal and multimodal assessment of functional and structural changes in brain organization associated with PROP. Sixty-three patients with hemispheric stroke underwent evaluations during the critical time period for brain plasticity after stroke, that is, at 2 to 4 weeks and at 3 months after stroke.
Assessment of the microstructural integrity of cerebral white matter tracts was performed with DTI using tract-based spatial statistics. 16 This allowed us to examine not only the CST, but the entire brain, for white matter differences associated with recovery. Furthermore, we investigated longitudinal changes in white matter integrity using a method that is particularly robust to misalignment artifacts in longitudinal studies. 17
Findings from animal models suggest that changes in structural network connectivity following stroke are accompanied by increased coherent neural oscillations between perilesional and surrounding cortical areas.14,15 We previously used high-resolution electroencephalography (EEG) in human stroke patients to identify a pattern of cortical neural network interactions, which was predictive of clinical improvement during the first months after stroke. 18 Greater coherence of spontaneous (ie, resting-state) oscillatory neural activity between the perilesional motor area and other regions during the first weeks after stroke was associated with greater clinical motor recovery observed in subsequent months. Similarly, functional resonance imaging studies showed that the magnitude of neural interactions between ipsilesional primary, supplementary, and premotor areas during motor tasks correlated with clinical motor recovery.19,20
Here, we examined the multivariate relationship between structural and functional correlates of PROP recovery patterns by testing whether coherent neural interactions are related to microstructural integrity of white matter tracts. First, we hypothesized that greater coherence of brain oscillatory activity during the first weeks after stroke facilitates PROP. Second, we hypothesized that combined structural and functional features of brain network organization would give insight into the differences underlying proportional rather than poor motor recovery following stroke.
Methods
Patients
Sixty-three stroke patients gave written informed consent to all study procedures. Patients were recruited from our inpatient rehabilitation unit. Inclusion criteria were (a) clinical diagnosis of stroke involving the territory of the middle cerebral artery as demonstrated by structural magnetic resonance imaging (MRI) and (b) at least mild motor impairment at the beginning of rehabilitation. Patients with presence of metallic objects in the brain, or skull breach were excluded. We report all patients with motor deficits available in our database, that is, no further patient selection was performed after these criteria. Their mean age was 64 years (range 28-85 years; 27 females) and 24 had left hemispheric stroke. Mean National Institute Stroke Scale (NIHSS) on admission was 13 (range 2-27). All patients received standard therapy at the stroke unit during the acute phase, and an individually tailored multidisciplinary rehabilitation program in the subacute and chronic phases. All patients received 2 times 30 minutes of physical therapy per day on 5 days per week and 5 times 30 minutes of occupational therapy per week on an inpatient basis for 8 to 16 weeks, followed by outpatient treatment of 1 to 4 hours of physical and occupational therapy per week. Data from 20 of these patients have been previously reported for unimodal structural assessments 3 and data from 39 patients for unimodal functional assessments. 18 Procedures were approved by the Geneva Ethics Committee and conducted according to the Declaration of Helsinki.
Clinical Assessments
Trained physical or occupational therapists obtained standardized clinical assessments of upper extremity motor function at 2 to 4 weeks (T0) and 3 months (T1) after stroke using the upper extremity items of the FMA.21,22
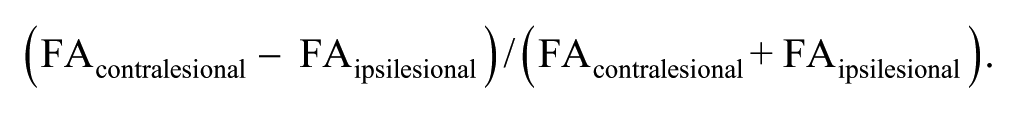
Patients were attributed to PROP or POOR groups based on hierarchical clustering 2 of clinical scores at T0 and T1 using average Euclidean distances and a maximum of 2 clusters. The goodness of fit was verified with a cophenetic correlation analysis. To estimate the proportion of recovery in our PROP sample, we then performed a linear regression of the observed improvement against the initial impairment of patients in the PROP group 1 :

where β is the proportion of impairment at T0 that was recovered and C is a constant.
In addition, we cross-validated the proportional model proposed previously in our independent dataset. For this, we applied the previously reported model parameters (β ≈ 0.7 and C ≈ 0, rounded)1,2 to all patients of our sample. Model error was then calculated as the difference between predicted and observed improvement from T0 to T1. 3
Patients and therapists were blinded to the model and its predictions.
Diffusion Tensor Imaging
Longitudinal DTI imaging was obtained at T0 (n = 55) and T1 (n = 46). Missing images at T0 were due to medical contraindications to MRI, missing images at T1 due to patient intolerance or refusal. Whole brain, single-shot echo-planar (EPI) diffusion-weighted volumes (30 noncollinear directions; b = 1000 s/mm2; 64 slices; voxel size 1.8 × 1.8 × 2.0 mm3; echo time/repetition time = 82 ms/8.2 s; acquisition time = 4 min 40 s) plus one volume without diffusion weighting (b = 0 s/mm2) were acquired parallel to a line intersecting the anterior and posterior commissure on a 3.0-T Siemens Trio TIM 3.0T scanner using a 64-channel coil. High-resolution structural T2-weighted (echo time/repetition time = 376 ms/5.0 s; voxel size = 0.45 × 0.45 × 0.90 mm3) volumes were also acquired.
Preprocessing of the diffusion-weighted images was performed via the TORTOISE software package (https://science.nichd.nih.gov/confluence/display/nihpd/TORTOISE). 23 Diffusion-weighted images were first corrected for motion and eddy current distortions, 24 including proper reorientation of the b-matrix to account for the rotational component of the subject rigid body motion. 25 In addition, B0 susceptibility-induced echo planar image distortions were corrected with an image registration-based approach using B-splines. 26 All corrections were performed in the native space of the diffusion-weighted images. A robust nonlinear diffusion tensor model (RESTORE 27 ) was then fit to the corrected data.
To transform individual images of each patient to a common template space, we used a nonparametric, nonlinear diffeomorphic deformable image registration pipeline implemented in DTI-TK (www.nitrc.org/projects/dtitk/), which incrementally estimates its displacement field using a tensor-based registration formulation. 28 This pipeline takes advantage of whole tensor similarity measures via explicit optimization of tensor reorientation, and includes appropriate reorientation of the tensors following deformation. Tracts of patients with left-hemispheric lesions were flipped to the right side before template registration to achieve common lesion lateralization. For longitudinal analyses of differences across the 2 time points, a within-subject template was first obtained for each patient by aligning the log-Euclidean mean of the 2 diffusion tensor images to a template that was iteratively refined for each patient. Then, a group-level atlas was created by aligning the within-subject template to the group target using the same iterative method. This procedure minimized alignment artifacts. 17 The IXI aging template 29 was used as the target for this spatial registration pipeline. Fractional anisotropy (FA) maps were derived for each patient and each time point.
Tract-based spatial statistics were performed by skeletonizing the mean of all aligned FA images via thresholding at 0.2. Each aligned FA image was projected onto the skeleton by filling the skeleton with FA values from the nearest relevant tract center. 16 For longitudinal analyses, skeletonized images from T0 were subtracted from T1 images. Finally, voxel-wise permutation statistics 30 were applied on the skeleton-space FA data using unpaired comparisons between PROP and POOR groups. Significant voxel clusters were labeled using the “JHU ICBM-DTI-81 white-matter atlas.” 31
In addition, we defined regions-of-interest in the right and left CST using binary masks. In order to reduce partial volume effects or small misalignments in the registration, the masks were further refined by only considering voxels that were found in at least 75% of the individual maps for the patient group. Mean FA values were then determined for both the ipsilesional and contralesional CST in each patient. CST asymmetry was calculated from the mean FA of the CST 32 :
Electroencephalography
EEG data were collected with a 128-channel Biosemi ActiveTwo EEG-system (Biosemi BV, Amsterdam, Netherlands). Spontaneous activity in a task-free state was recorded with a sampling rate of 512 Hz. Participants were instructed to keep their eyes closed and to remain relaxed but awake. Data segments with artifacts or signs of reduced vigilance were excluded by visual inspection. Five minutes of artifact-free data were recalculated against the average reference.
EEG source functional connectivity (FC) was calculated in Matlab (The MathWorks Inc, Natick, MA, USA) with the open-source toolbox NUTMEG (http://nutmeg.berkeley.edu) 33 and its functional connectivity mapping (FCM) toolbox as described previously. 34 The lead-potential with 10-mm grid spacing was computed using a boundary element model (BEM), based on each patient’s individual 3D T1-weighted structural MRI. The BEM model was created with the Helsinki BEM library (http://peili.hut.fi/BEM/) 35 and the NUTEEG plugin of NUTMEG. Artifact-free EEG segments were bandpass filtered between 1 and 20 Hz (using an elliptic temporal filter with zero phase distortion) and projected to gray matter voxels with an adaptive spatial filter (scalar minimum variance beamformer). 36 FC was defined as the absolute imaginary component of coherence 37 in the beta frequency band (13-20 Hz) between estimated source time series at each voxel and all other voxels. 18 This approach avoids overestimation or distortion of functional connectivity due volume conduction or spatial leakage of the inverse solution. 38 Next, we computed the weighted node degree (WND) 39 at each voxel as the sum of its FC with all other cortical voxels. WND characterizes the relative importance of a given brain region in the network.40,41 Additionally, we investigated connectivity between an anatomically defined seed motor region 42 and other brain areas.
Between-subject variation in FC magnitude (and hence WND) can be due to variations in signal-to-noise ratios of the recordings. To avoid this potential confound, we z-score normalized WND maps for each subject by subtracting the mean across all voxels and dividing by the standard deviation.18,43,44. Z-score maps were spatially normalized to canonical Montreal Neurological Institute (MNI) space using SPM8 (http://www.fil.ion.ucl.ac.uk/spm/software/spm8/). Ischemic lesions were masked during spatial normalization to avoid distortions.
Voxel-wise differences between groups were tested against the null-hypothesis of zero difference with statistical nonparametric mapping (SnPM). A correction for testing multiple voxels was obtained by defining a cluster-size threshold based on the cluster size distribution obtained after 10 000 random permutations of original data. 45 In addition, we defined the ipsilesional primary motor cortex, supplementary motor area, dorsal and ventral premotor areas as regions of interest (ROIs) with anatomical templates 42 and computed unpaired t tests on the normally distributed average of voxels within each ROI. A Bonferroni correction was used to correct for testing 4 ROIs.
Multivariate Prediction and Structure-Function Relationships
To verify whether structural and functional markers were independently predictive of PROP and to account for baseline differences in lesion extension and clinical severity between groups, we performed a multivariate linear regression analysis with initial (T0) FMA impairment, lesion extent (T0), CST damage, and beta-band FC between the ventral premotor ROI and the rest of the brain as predictors for the errors in the proportional recovery model. Lesion extent was quantified in mm3 from structural imaging and log transformed to achieve normal distribution. Furthermore, we performed a support vector classification. Predictors were entered in a support vector classifier using a linear kernel as implemented in the Matlab SVM toolbox (http://www.isis.ecs.soton.ac.uk/resources/svminfo/). 46 The accuracy in classifying a patient as PROP or POOR was determined with a leave-one-out cross-validation procedure. These analyses were based on a subset of 55 patients with complete functional and structural imaging datasets at T0.
Moreover, we investigated bivariate structure-function relationships between initial CST damage and beta-band coherence, as well as between beta-band coherence and secondary white matter degradation using Pearson correlations.
Results
Clinical Recovery
Hierarchical clustering segregated all patients into two different recovery groups (cophenetic correlation coefficient = 0.83). A first cluster of patients (n = 31) showed clinical improvement that was proportional to initial impairment (PROP; Figure 1A; filled squares). A second cluster (n = 32) exhibited poor, nonproportional recovery (POOR; Figure 1A; unfilled circles). A linear regression of the observed improvement against the initial impairment of patients in the PROP group yielded similar parameters as previously reported,1,2 see Table 1.
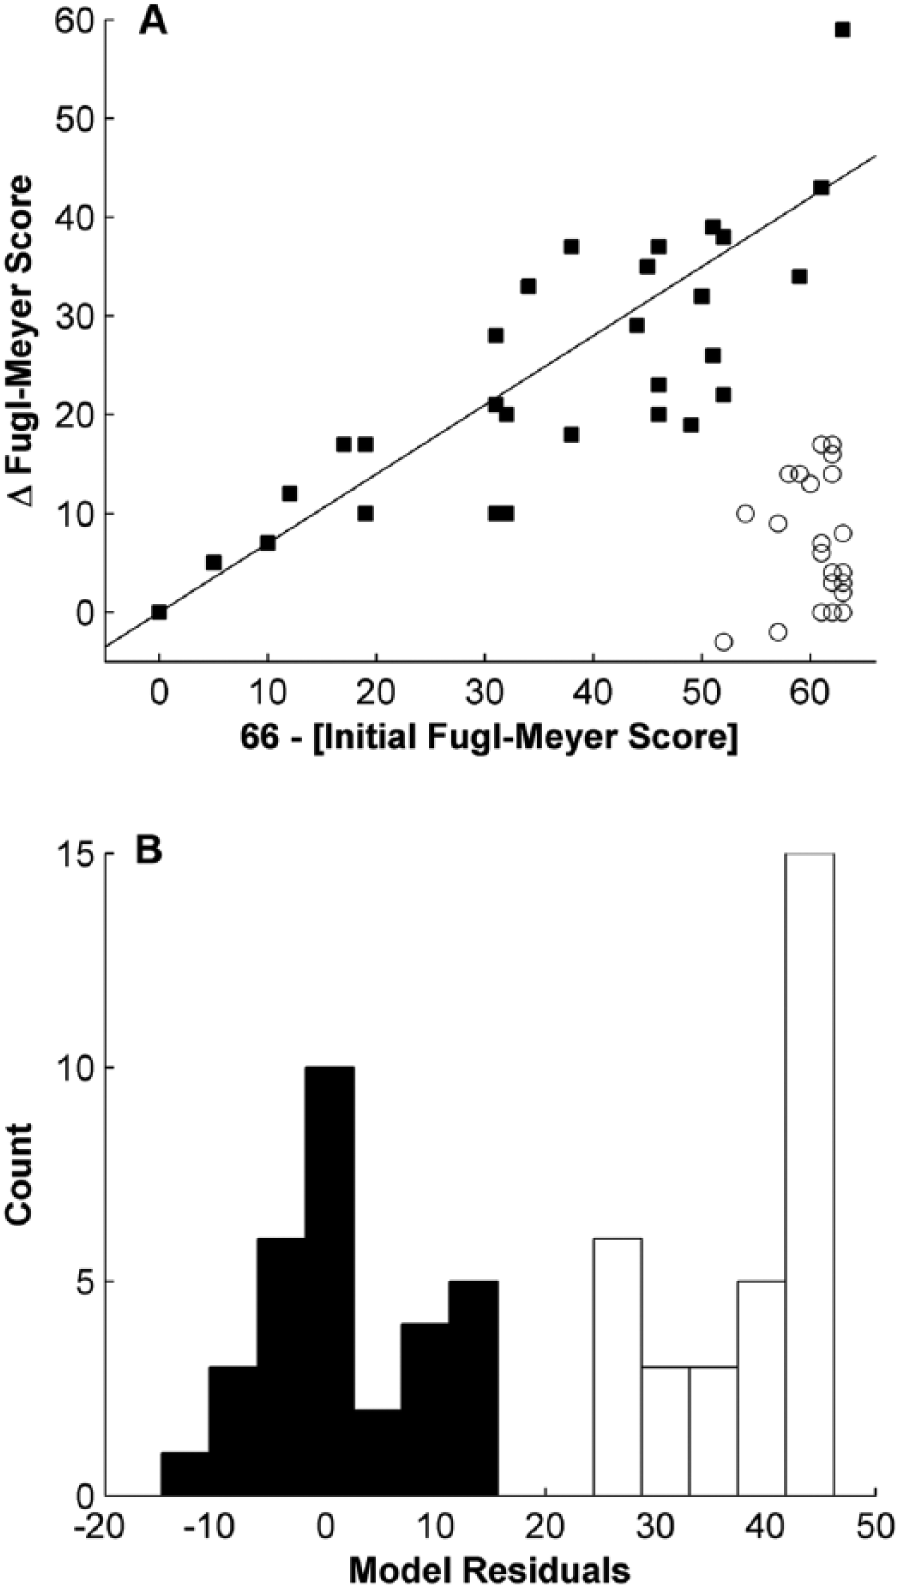
The evolution of motor function after stroke follows two strictly different paths. Hierarchical clustering separated patients into 2 different clusters of recovery. Patients with filled squares recovered a fixed proportion of their initial motor impairment (proportional recovery, PROP), while patients with empty circles showed no or very little improvement (POOR). The straight line represents the proportional recovery model predicting a recovery of 70% of initial impairment (A). A histogram of the deviation from proportional recovery again demonstrates the clear separation into 2 groups (B).
Univariate Linear Regression Between FMA Impairment (66-FMA at T0) and Change in FMA From T0 and T1. a
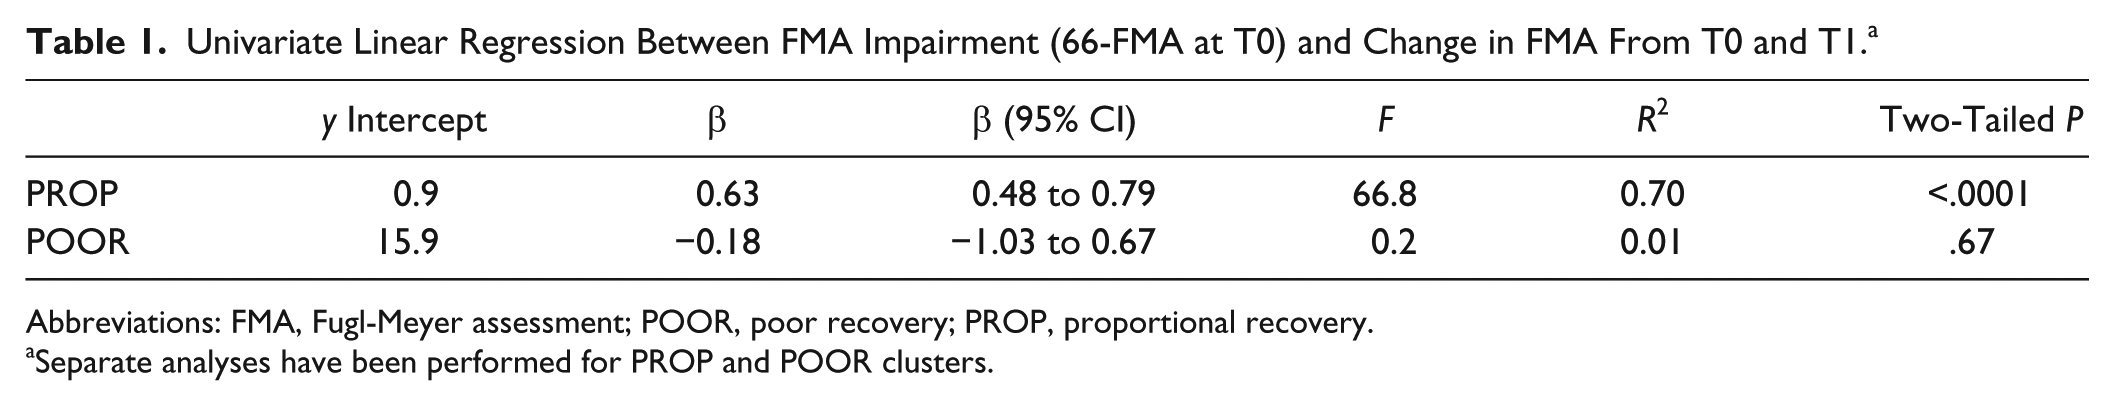
Abbreviations: FMA, Fugl-Meyer assessment; POOR, poor recovery; PROP, proportional recovery.
Separate analyses have been performed for PROP and POOR clusters.
We then cross-validated the previously reported parameters (β = 0.70 and C = 0) of the proportional recovery model1,2 in our data set. This accurately predicted the amount of motor improvement in the PROP group (mean model error 1, range ±15 points on the FMA scale), while a large difference between predicted and observed improvement was found in the POOR group (mean model error 38, range 26-46). Figure 1B demonstrates that once again, model errors sharply delineate two different patient groups. Moreover, the same group attribution was found for individual patients as with hierarchical clustering.
Age (P = .90), gender (P = 1.0), and lesion laterality (P = .31) were comparable across groups. However, the POOR group had larger lesion volume (P = .006) and lower FMA scores (P < .0001) at T0 than the PROP group. The lesion maps of the 2 groups are shown in Supplementary Figure 1.
Structural Imaging
We asked whether the 2 groups showed structural differences in their white matter tracts at T0. The POOR group was characterized by greater damage to the CST (P < .05, cluster corrected, Figure 2). The present study extended this comparison to all cerebral white matter on a voxel-wise basis, and found clusters that differed significantly in FA along the entire cerebral trajectory of the CST (from the corona radiata through the anterior and posterior limbs of the internal capsule to the cerebral peduncle), and in parts of the external capsule. No other white matter tracts showed significant differences. Therefore, the observation is robust and fairly specific to the CST.
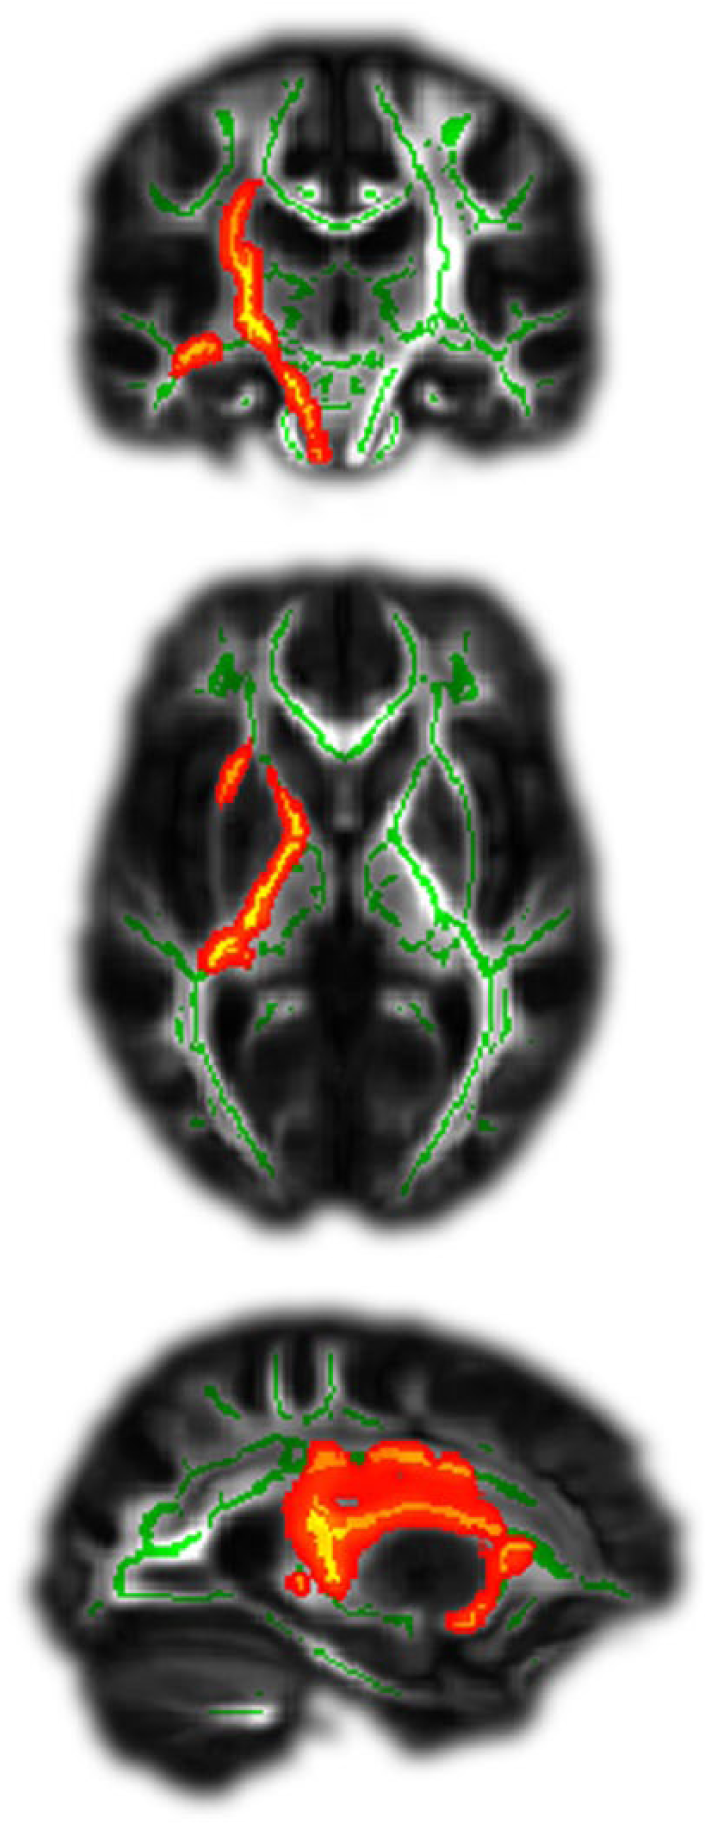
Patients with POOR (poor recovery) showed significantly greater damage of the corticospinal tract (CST) at T0. Green lines indicate examined tracts, red/yellow colors significant differences between groups. All stroke lesions are aligned to the right hemisphere (shown left).
Next, we examined longitudinal white matter tract changes occurring between T0 and T1. The POOR group displayed a significant decrease in FA of the corona radiata, the internal capsule, the corpus callosum, and the superior longitudinal fascicule of the affected hemisphere (Figure 3, blue colors, P < .05, cluster corrected), while no significant change could be observed in the PROP group. The difference between the 2 groups was significant (Figure 3, red-yellow colors, P < .05, cluster corrected). An analysis of variance including initial FMA impairment and initial CST damage as confounding covariates confirmed that the average FA change across all significant tracts in the affected hemisphere remained significantly greater in POOR than PROP (F1,41 = 15.6, P = .003), hence confirming that secondary degradation in POOR is not merely a consequence of initial clinical and lesion severity.
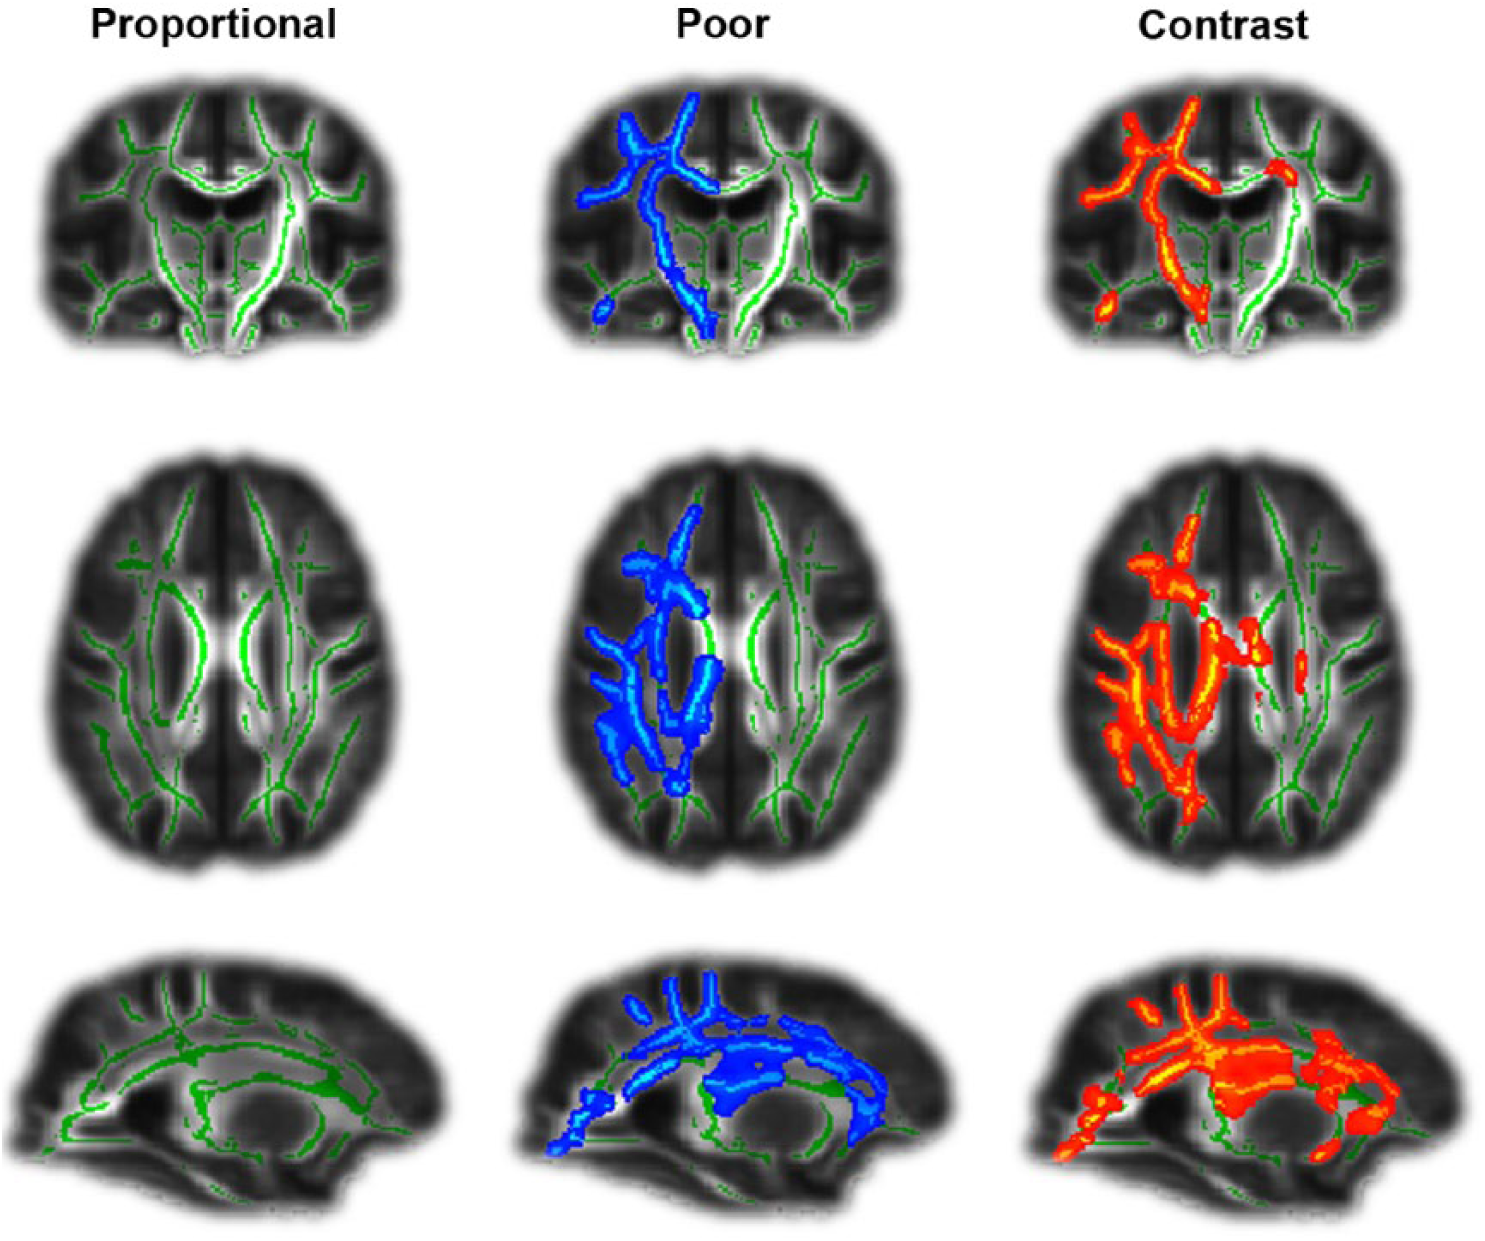
Longitudinal diffusion tensor imaging (DTI) correlates of proportional motor recovery. Patients with POOR (poor recovey) suffered from a degradation of white matter tracts (in blue) in the affected hemisphere during the first 3 months after stroke. This was not the case in patients with PROP (proportional recovery). Green lines indicate examined tracts, red/yellow colors significant differences between groups. All stroke lesions are aligned to the right hemisphere (shown left).
Functional Imaging
We investigated functional differences between the 2 groups using high-density EEG in a resting-state paradigm, which is unbiased by the ability of the patients to perform a particular task. Figure 4 shows that, at T0, the POOR group displayed disrupted beta-band WND at the convexity of the affected hemisphere (P < .05, cluster corrected). Conversely, the PROP patients had high beta-band WND in a frontal brain region including the ventral premotor cortex. PROP patients had significantly greater beta-band coherence than POOR patients in a large area of the affected hemisphere including the ventral premotor cortex, insula, and inferior parietal lobule (P < .05, cluster corrected). Among anatomically defined motor regions, the ventral premotor cortex showed a significant difference between groups (t61 = 3.5, P = .014, Bonferroni corrected, other motor areas P > .13). These differences in WND indicate that prefrontal brain areas enhanced the overall importance in the brain network40,41 in PROP patients, while fronto-temporo-parietal regions were functionally disconnected in POOR patients. When the ipsilesional ventral premotor cortex was defined as a seed region, we observed significantly greater coherence with the primary motor cortex in PROP patients than in POOR patients (t61 = 2.3, P = .025). Hence, spontaneous beta oscillations were more coherent between these two areas in patients with PROP. Importantly, these functional differences remained unchanged when excluding voxels intersecting with lesion masks for each individual patient. No significant differences in longitudinal EEG changes were observed between the 2 groups (P < .05).
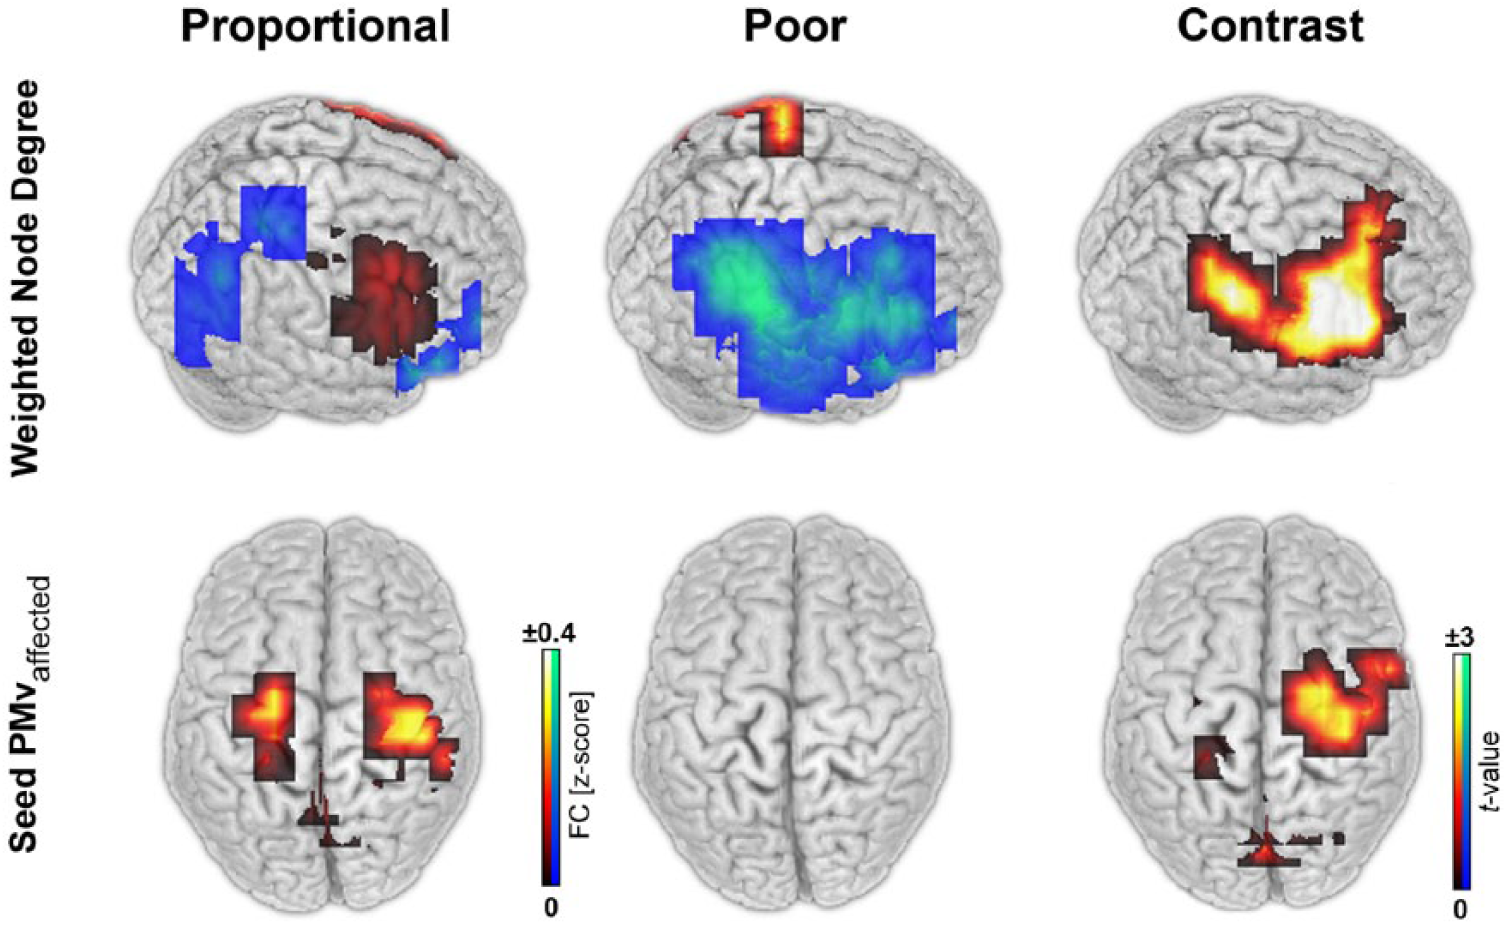
Electroencephalography network correlates of proportional recovery. The weighted node degree (WND) of resting-state functional connectivity was disrupted in the affected hemisphere of patients with POOR (poor recovery) (blue). Conversely, patients with PROP (proportional recovery) showed large WND (red-yellow), in particular between the ventral premotor (PMv) and primary motor area of the affected hemisphere. All stroke lesions are aligned to the right hemisphere (shown right).
Multivariate Prediction of Recovery
We then investigated whether structural and functional markers were independently predictive of PROP while accounting for differences in lesion extension and clinical severity between groups. To this end, we performed a multivariate linear regression analysis with initial (T0) FMA impairment, lesion extent (T0), CST damage, and beta-band FC between the ventral premotor ROI and the rest of the brain as predictors for the errors in the proportional recovery model. Initial FMA impairment, CST damage at T0, and beta-band FC, but not lesion volume remained independent predictors in this multivariate framework (Table 2).
Multivariate Linear Regression With the Error of the Proportional Recovery Model as Dependent Variable.
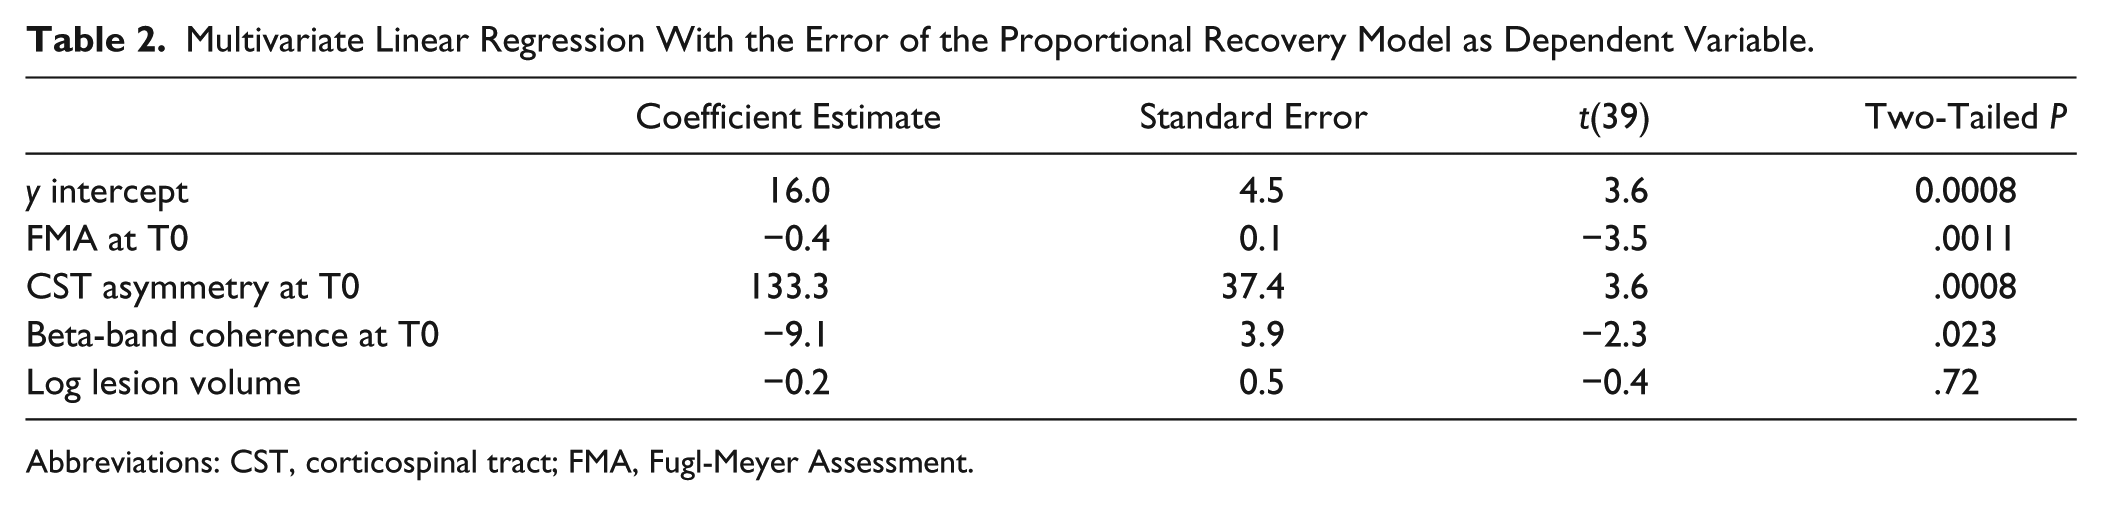
Abbreviations: CST, corticospinal tract; FMA, Fugl-Meyer Assessment.
The complementary value of initial FMA and CST damage for prediction of PROP is further illustrated in Figure 5. In our sample, an initial FMA greater than 15 predicted PROP in 100% of patients (Figure 5A, continuous vertical line). In the remaining patients with more severe initial impairment, POOR was observed in 95% of patients with CST asymmetry greater than 0.085 (Figure 5B, dotted line) and 100% of patients with an asymmetry greater than 0.13 (Figure 5B, continuous vertical line). Hence, with a combination of FMA and DTI of the CST, the type of recovery could be predicted with 95% accuracy in 75% of patients. Among the remaining 14 patients with initial FMA ≤15 and CST asymmetry<0.085, beta-band WND greater than 0.1 at the ipsilesional ventral premotor area was associated with PROP in 80% of patients, while patients with values lower than 0.1 showed POOR in 78% of cases. Finally, support vector machine classification was applied to the entire cohort with leave-one-out cross-validation. Using initial FMA, CST asymmetry, and beta-band coherence as predictors, we obtained a sensitivity of 0.89, specificity 0.85, positive predictive value 0.86, and negative predictive value 0.88
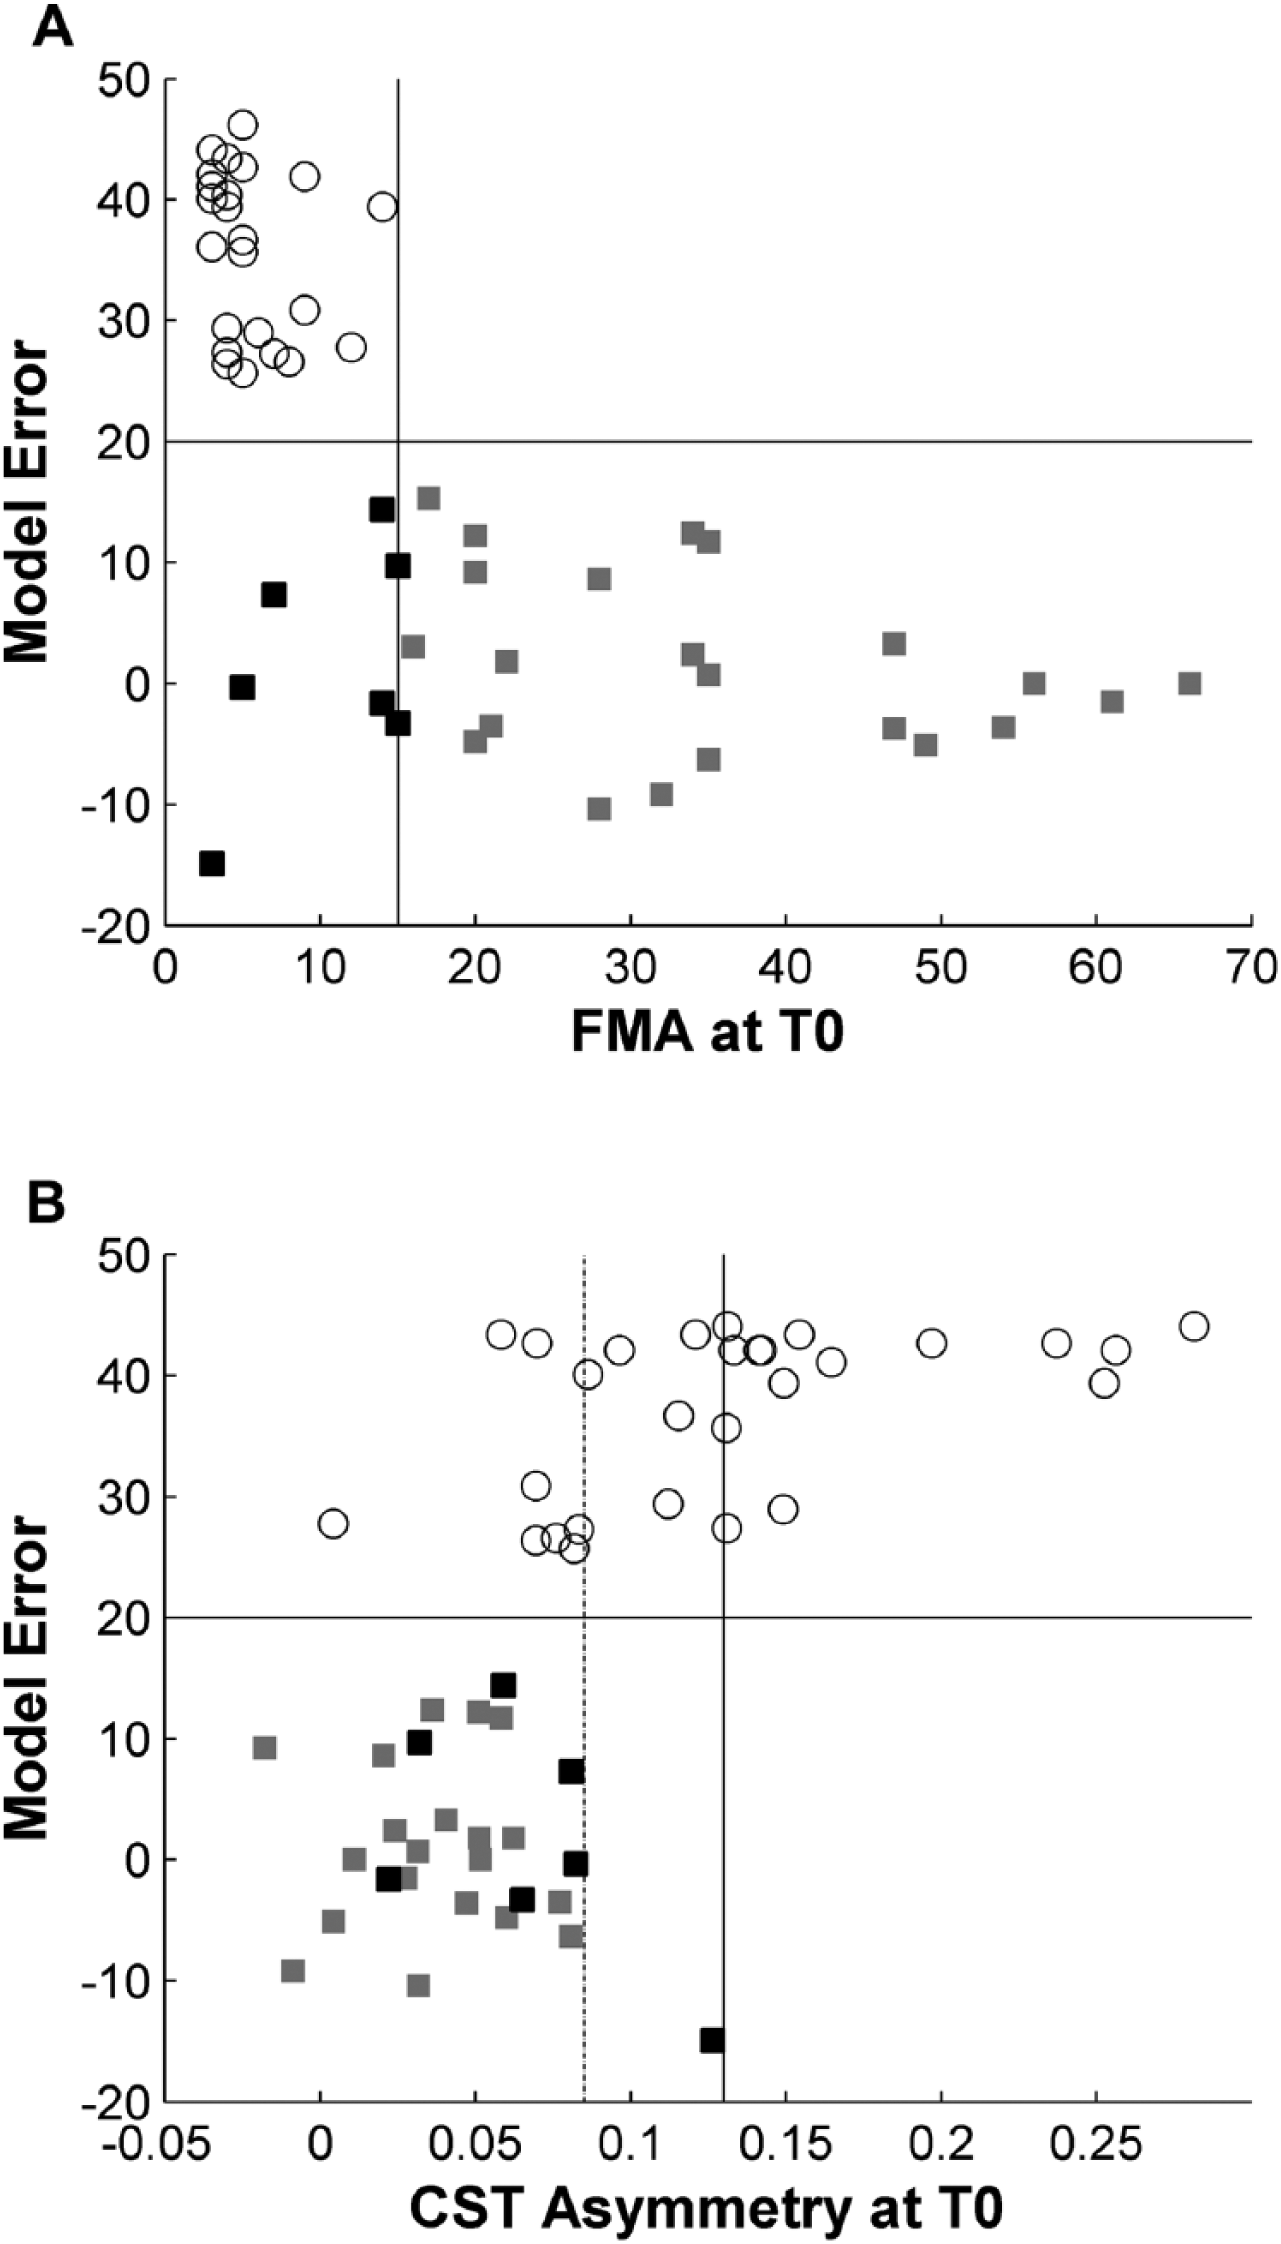
Prediction of proportional (PROP) versus poor recovery (POOR). A combination of clinical assessment and diffusion tensor imaging (DTI) of the corticospinal tract (CST) at T0 allowed predicting whether patients will show PROP or POOR with high accuracy in the majority of patients in our sample. All patients with an initial Fugl-Meyer Assessment (FMA) >15 (gray squares) recovered according to the proportional model (A). Among the remaining patients with severe initial impairment, POOR (white circles) was observed in 95% of patients with a CST asymmetry >0.085 (dotted line) and in 100% of patients with CST asymmetry > 0.13 (continuous vertical line). Conversely, 43% of patients with severe initial impairment but low CST damage evolved to PROP (black squares) (B).
Structure-Function Relationship
Structural and functional differences were statistically related to each other. Figure 6 shows that patients with greater CST integrity (ie, less asymmetry between the affected and the unaffected tract) also had proportionally greater beta-band functional connectivity between perilesional areas of the affected hemisphere and the rest of the brain at T0 (r = −0.50, P < .0001). Greater functional connectivity was in turn associated with proportionally less FA reduction in white matter tracts between T0 to T1 (r = 0.36, P = .015).
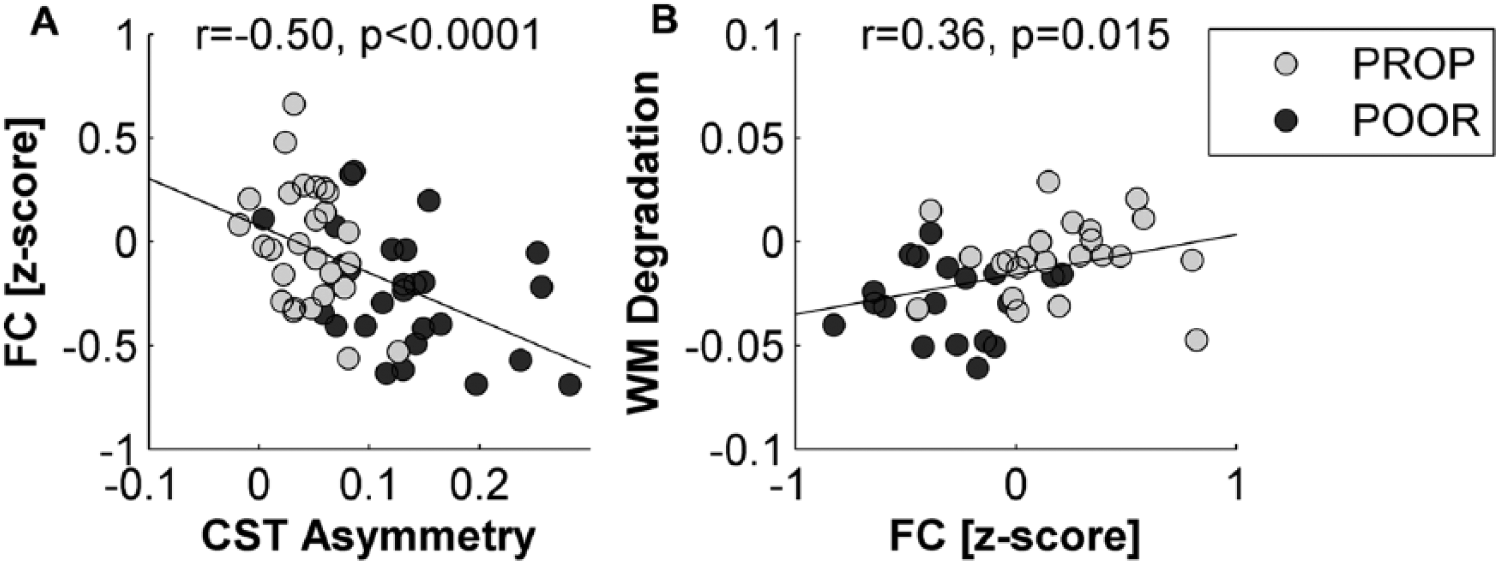
Multimodal assessments. Structural and functional signatures of plasticity were related to each other. Patients with greater corticospinal tract (CST) integrity had proportionally greater functional connectivity between perilesional areas of the affected hemisphere and the rest of the brain (A). Larger functional connectivity was in turn correlated with less white matter tract degradation during the first months after stroke (B).
Discussion
This study provides insights into longitudinal structural and functional differences between patients with PROP and POOR patterns. First, our findings reconfirm the importance of CST integrity for motor outcome and recovery3-5,32 and additionally demonstrate that this impact is specific to the CST. We then show that PROP and POOR patients also differ with regard to secondary degradation of white matter tracts. Such secondary degradation has been previously reported to occur in the CST during the first months after stroke due to anterograde or retrograde Wallerian degeneration.6-8 Our findings show that this degradation extends beyond the CST and involves widespread tracts in the affected hemisphere, and that it is linked to POOR. Finally, the present study also confirms previous observations that changes in ipsilesional functional connectivity are associated with recovery,18-20 and shows that these functional markers of cortical plasticity are enhanced in patients with PROP. The main novelty of this study arises from its multimodal and longitudinal character, which provides insights into structure-function relationships underlying PROP.
Primary Damage and Secondary Degradation of White Matter Tracts
The degree of damage to the CST correlates with the severity of motor impairment in acute and chronic phases as well as with the amount of improvement.32,47 More recent studies have further shown that a large lesion load to the CST in patients with severe initial motor impairment is associated with a POOR pattern of motor improvement.3,4 The present study demonstrates that the ability to discriminate between the 2 recovery patterns is specific to the CST. Differences between PROP and POOR were found along the entire cerebral trajectory of the CST and parts of the external capsule, but in no other tract. This provides further evidence that damage to any part of the CST plays a specific key role for POOR. Note however that a recent study using structural MRI has suggested that other brain areas may also influence recovery. 48 Furthermore, PROP and POOR patterns can also be observed during recovery from aphasia and neglect,49,50 which may depend on other tracts.
Patients with POOR were further characterized by a striking secondary loss of white matter integrity during the first months after stroke. In contrast to the selective implication of primary damage to the CST for POOR, secondary degradation concerned extensive parts of the affected hemisphere. Secondary degradation has so far received surprisingly little attention and previous studies have mostly been limited to the CST.6-8 Given the importance of white matter lesions for function and cognition, the present observation gives rise to concern and should motivate further investigations into the reasons and behavioral consequences of secondary degradation, and into how it might be avoided.
Structure-Function Model of Proportional Recovery
Our study demonstrates significant interdependency between brain structure and function for motor recovery. Patients with at least partial extant CST integrity are more likely to develop spontaneous beta oscillatory synchronization between perilesional motor areas and the rest of the brain. Beta-band synchronization is, in turn, associated with long-term preservation of white matter tracts and proportional clinical recovery. In contrast, severe damage to the CST is associated with reduced markers of cortical plasticity, and subsequent degradation of white matter within the affected hemisphere. This cascade of factors seems to result in POOR.
These observed systems-level associations are congruent with known molecular and cellular events that link synaptic efficacy and white matter myelination with synchronous oscillatory brain activity. In particular, recent work suggests that axon myelination is a dynamic process tightly regulated by neuron-glia interactions dependent on synchronous network oscillations. 51 Thus, synchronous beta oscillations may be an important factor preventing secondary degeneration of white matter fiber pathways following stroke. In turn, the maintenance of synchronous beta oscillations may depend on cellular-based plasticity processes such as dendritic spine remodeling or axonal sprouting, which were previously reported to go in parallel with synchronous neural activity.14,15
Our findings therefore suggest a testable model wherein CST integrity enables a synchronization of spontaneous neural oscillations. Synchronized oscillatory activity, in turn, promotes the reintegration of perilesional areas into the motor network 18 and helps preserve white matter tracts in the affected hemisphere. 51
Previous multimodal imaging studies in stroke patients have also reported associations between structural CST damage and function of ipsilesional motor areas. Greater CST damage was associated with reduced ipsilesional motor cortex excitability during transcranial magnetic stimulation 52 and with more compensatory activation of perilesional areas during movement tasks.53,54 Furthermore, the severity of CST damage was correlated with less interhemispheric synchronization of functional MRI (fMRI) fluctuations54,55 and greater disinhibition of the contralesional primary motor cortex. 52 Taken together, the different studies provide consistent evidence that the amount of structural damage to the CST predetermines ipsilesional, contralesional, as well as network-wide brain function from the first weeks after stroke until the chronic stage.
Prediction of Recovery
In accordance with previous studies,3-5 we find that a combination of initial motor examinations and assessments of the CST can reliably predict PROP or POOR in a majority of patients. Yet, despite a multimodal approach, the recovery pattern remained difficult to predict in 25% of our patients. Byblow and colleagues 5 have been able to predict PROP and POOR in most of their patients when using motor evoked potentials in addition to clinical assessments and DTI of the CST as predictors. Conversely, the addition of EEG coherence only marginally improved prediction. A previous fMRI study also found that the assessment of brain activation patterns during motor tasks did not significantly improve prediction of PROP compared to clinical assessments alone. 9
The relatively low reliability of functional imaging to predict PROP beyond CST integrity may have several reasons. Given the observed interdependency between functional and structural correlates of plasticity, the most likely explanation is that the presence and success of coherent oscillations is contingent on the integrity of the CST. Coherence in the affected hemisphere is suppressed or ineffective in patients with severe damage to the CST. Furthermore, it is known that measures of brain function using EEG or fMRI are nonstationary, which may decrease their predictive reliability over a timespan of several months compared to more slowly changing structural measures. Finally, it is possible that cortical processes have less overall impact on FMA recovery during the first months than plasticity at the level of the CST.
Implications for Rehabilitation
From a therapeutic perspective, the multimodal model makes testable predictions with regard to treatment strategies that might be successful in each recovery group. Based on the importance of CST integrity, it may be crucial to reestablish and strengthen CST projections.3-5 Our findings suggest that this would enable cortical repair processes and better recovery. Thus, for patients with locally severe CST damage but residual motor cortex oscillatory activity, an early-stage focus on plasticity induction within the CST may facilitate spontaneous cortical repair processes. Such an intervention could minimize long-term CST degeneration and convert the recovery pattern trajectory from POOR toward PROP. Future studies will need to investigate how this might be achieved.
In addition, we observed a significant association between beta-band coherence and error in the proportional recovery model that was independent of initial clinical impairment, lesion size, and CST integrity. Furthermore, among patients with relatively preserved CST integrity (FA asymmetry <.085), greater beta-band coherence between the ipsilesional ventral premotor area and the rest of the brain was associated with greater proportions of motor improvement independently of initial FMA severity (r = 0.40, P = .021). Strategies geared toward increasing spontaneous oscillatory synchronization between perilesional motor areas might therefore be beneficial, in particular in patients with at least partial integrity of the CST. We can speculate that such interventions might allow PROP patients to experience improvements beyond the expected 70%. Previous studies have provided evidence that increases of functional interactions within the motor system can be obtained with new treatment concepts such as noninvasive brain stimulation56-60 and neurofeedback therapy.61-63
Potential Limitations
The initial assessment of our study has been obtained somewhat late (ie, 2-4 weeks) and the follow-up somewhat early (ie, 3 months). Therefore, our assessments did not capture the entire recovery period in some patients. Accordingly, the proportion of recovery (63%) and the proportion of explained variance in the PROP group (R2 = 0.7) were slightly lower than previously reported. Since initial FMA scores of the POOR group were close to the minimum, an earlier assessment would have yielded essentially the same values. Conversely, some patients from the PROP group would have shown lower values. However, since the separation of the two recovery groups was very robust and comparable to previous studies, it is unlikely that this influenced the main findings.
It is also important to note that our sample of stroke patients was recruited from an inpatient rehabilitation unit and excluded patients who showed almost complete motor recovery within the first 2 weeks. It is therefore not representative and contains more frequent severe motor deficits. In particular, POOR patterns occur less frequently in real-world settings. However, the inclusion of more PROP patients with less severe affections would have made the reported differences even more pronounced.
A fourth of the patients did not have complete structural imaging at both time points. However, patient demographics, clinical recovery, and EEG measures were not different between patients with and without complete DTI imaging (P > .20), hence rendering a drop out bias unlikely.
Conclusions
This study provides correlational evidence for associations between initial CST integrity, systems-level cortical network plasticity, prevention of white matter atrophy, and clinical motor recovery after stroke. The resulting model of motor recovery identifies candidate targets for individualized therapy.
Footnotes
Supplementary material for this article is available on the Neurorehabilitation & Neural Repair website along with the online version of the article.
Declaration of Conflicting Interests
The authors declared no potential conflicts of interest with respect to the research, authorship, and/or publication of this article.
Funding
The authors disclosed receipt of the following financial support for the research, authorship, and/or publication of this article: AGG was supported by the Swiss National Science Foundation (grants 320030-129679 and 320030-146639), ERB and LGC by the intramural program of the National Institute of Neurological Disorders and Stroke, National Institutes of Health.
References
Supplementary Material
Please find the following supplemental material available below.
For Open Access articles published under a Creative Commons License, all supplemental material carries the same license as the article it is associated with.
For non-Open Access articles published, all supplemental material carries a non-exclusive license, and permission requests for re-use of supplemental material or any part of supplemental material shall be sent directly to the copyright owner as specified in the copyright notice associated with the article.