



Abstract
Carpal tunnel syndrome (CTS) is a most common peripheral nerve entrapment neuropathy characterized by sensorimotor deficits in median nerve innervated digits. Block-design task-related functional magnetic resonance imaging (fMRI) studies have been used to investigate CTS-related neuroplasticity in the primary somatosensory cortices. However, considering the persistence of digital paresthesia syndrome caused by median nerve entrapment, spontaneous neuronal activity might provide a better understanding of CTS-related neuroplasticity, which remains unexplored. The present study aimed to investigate both local and extensive spontaneous neuronal activities with resting-state fMRI. A total of 28 bilateral CTS patients and 24 normal controls were recruited, and metrics, including amplitude of low-frequency fluctuation (ALFF) and voxel-wise functional connectivity (FC), were used to explore synaptic activity at different spatial scales. Correlations with clinical measures were further investigated by linear regression. Decreased amplitudes of low-frequency fluctuation were observed in the bilateral primary sensory cortex (SI) and secondary sensory cortex (SII) in CTS patients (AlphaSim corrected P < .05). This was found to be negatively related to the sensory thresholds of corresponding median nerve innervated fingers. In the voxel-wise FC analysis, with predefined seed regions of interest in the bilateral SI and primary motor cortex, we observed decreased interhemispheric and increased intrahemispheric FC. Additionally, both interhemispheric and intrahemispheric FC were found to be significantly correlated with the mean ALFF.
Keywords
Introduction
The hands execute the most advanced physical functions that have ever evolved in human beings. Finger sensorimotor function is important for the integration of sensory and motor information in the brain, which is particularly important in performing fine motor tasks. Therefore, sensorimotor deficits in the fingers, for example, subsequent to local peripheral neuropathies, will cause considerable disruption to hand dexterity and, in turn, quality of life. Carpal tunnel syndrome (CTS), characterized by compression of the distal median nerve by an increased pressure in the carpal tunnel, is one of the most common entrapment neuropathies. According to Papanicolaou et al, 1 the prevalence of CTS in the United States is 3.72%. 2 Females appear to be more susceptible to CTS than males (female-to-male ratio 3:1), and the majority of CTS patients are middle-aged women. 3 In most cases, CTS patients complain of paresthesias in the median nerve innervated digits (thumb, index and middle fingers, and radial side of the ring finger) and loss of hand dexterity among other symptoms. About half of the cases are believed to be work related. 4 Although the epidemiology and the clinical classifications have been extensively explored in the past decades, some issues regarding CTS-related neuroplasticity remain unaddressed. This has gained increasing attention, particularly with the development of neuroimaging methods such as functional magnetic resonance imaging (fMRI), transcranial magnetic stimulation, magnetoencephalography, and the like. It is believed that a better knowledge of the central issues in CTS would greatly facilitate the development of strategies for therapeutic interventions.
Persistently aberrant peripheral nerve input has been proven to result in altered central processing and cortical plasticity through Hebbian plasticity mechanisms. 5 Some studies have provided evidence of CTS-related cortical plasticity with task-related fMRI and magnetoencephalography investigating the remodeling pattern response to sensory stimulation.6-9 Whereas the majority of previous studies have focused on brain responses to sensory stimulus, the neuroplasticity arising from persistent paresthesia remains uninvestigated. In the present study, resting-state fMRI signals were obtained from both CTS patients and normal controls (NCs), and metrics, including the amplitude of low-frequency fluctuation (ALFF) and functional connectivity (FC), were used to explore the CTS-related synaptic activity at both local and extensive scales. We also studied the relationship between ALFF values and clinical measures (sensory threshold) to investigate the clinical relevance of such neuroimaging indices because sensory threshold is a more relevant index for describing the severity of clinical symptoms. Correlations between ALFF and interhemispheric and intrahemispheric FCs were also calculated to investigate the possible underlying mechanisms.
Methods
Participants
A total of 56 right-handed volunteers were initially recruited, including 27 NCs and 29 CTS patients. All the patients were bilaterally affected. The patients recruited presented a stage with objective neurological signs and delayed motor conduction. The inclusion criteria for CTS patients were as follows: (1) complaints of paresthesias/numbness in median nerve innervated territories, night pain, wrist/finger weakness, and/or thenar atrophy in bilateral hands for more than 3 months according to the guideline released by American College of Occupational and Environmental Medicine, 2011; (2) positive Phalen’s and Reverse Phalen’s signs; and (3) motor latency of median nerve above 3.7 ms.10,11
Exclusion criteria for both groups were as follows: (1) confirmed or suspected history of diabetes mellitus, cervical spondylopathy, rheumatic disease, multiple sclerosis, chronic pain, or cerebral diseases; (2) MRI contraindications; and (3) generalized peripheral neuropathy.
All participants were informed of the complete research protocol and provided written consent forms. The study was approved by the medical ethical committee of Jing’an District Center Hospital. The ethical work was carried out under the guidelines of the Helsinki declaration.
Clinical Assessments
All the enrolled CTS patients completed the Boston Questionnaire 30 to evaluate the severity of clinical symptoms and the negative influence on their daily life. Sensory threshold tests were performed on bilateral middle fingers that were innervated by the median nerve with Von-Frey filaments (North Coast Medical, Inc, CA). The sensory threshold value was discontinuous and was composed of 20 levels ranging from 0.008 to 300 g. The higher the value of the threshold detected, the worse the sensory function was assessed to be. When the filament was applied to the finger pulp, the minimum weight that aroused tactile sensation was regarded as the sensory threshold.
We used a Dantec Keypoint 4 workstation for electromyography (EMG) examination. All participants underwent the same study protocol. For sensory conduction examination, 1 circle-like surface electrode was fixed around the proximal interphalangeal joint of the finger, which was used as the recording electrode. Another surface electrode, which was used as stimulus electrode, was placed on the wrist right between the palmaris longus and flexor carpi radialis. The third surface electrode, which was also circle like and used as a reference electrode, was placed around the distal interphalangeal joint of the finger. The fourth electrode, which was used as ground connection, was placed between the stimulus and recording electrode (usually on the back of hand). For motor conduction examination, one surface electrode, which was used as the stimulus electrode, was placed on the volar side of the wrist (usually the second crease line of the wrist). Another needle electrode, which was used as the recording electrode, was inserted into the abductor pollicis brevis. All assessments were completed before the imaging scan. In the routine EMG assessments, we recorded motor latencies of the median nerve and sensory latencies as well as amplitudes and nerve conduction velocities of both the median and ulnar nerves in the bilateral upper extremities.
MRI Data Acquisition
The whole study was completed using a 3.0-T scanner (MR750, GE Healthcare, USA). Both the CTS patients and NCs underwent the same scan protocol, which included structural 3D-T1 imaging and resting-state fMRI. During the scanning, participants were instructed to rest with their eyes closed and to not think of anything in particular or fall asleep. Foam padding was used to minimize head motion. For structural 3D-T1 imaging, we used a SPGR sequence as follows: matrix size = 256 × 256; field of view (FOV) = 256 × 256 mm2; TR/TE = 8100/3.1 ms; FA = 8°; slice thickness = 1; gap = 0 (isotropic voxel size = 1 × 1 × 1 mm3); TI (prepare time) = 450 ms. For resting-state, the parameters were as follows: sequence = GRE-EPI; interleaved scanning order; slice number = 43; matrix size = 64 × 64; FOV = 220 × 220 mm2; TR/TE = 2000/30 ms; FA = 90°; slice thickness = 3.2 mm; gap = 0 (voxel size 3.4 × 3.4 × 3.2 mm3); number of acquisitions = 240.
Data Preprocessing
Data Preprocessing Assistant for Resting-State fMRI (DPARSF, http://restfmri.net/forum/DPARSF) was used for data preprocessing. 12 The first 4 time points were removed for signal equilibrium; we then applied the slice timing procedure to correct for the different acquisition times of each slice. Head motion was corrected for by means of a 6-parameter rigid body transformation. 13 Three NCs were excluded because of either a space-occupied lesion detected during the scan (n = 1) or excessive head motions (more than 3 mm or 3°, n = 2). One CTS patient’s images were abandoned because of serious artifacts. The functional volumes were then spatially registered to the Montréal Neurological Institute space (MNI space) using deformation information obtained from the T1 image segmentation. The registered images were spatially smoothed with a 6-mm full-width at half maximum (FWHM) Gaussian kernel. The nuisance signals, including the averaged signal from white matter, cerebrospinal fluid, and Friston 24 head motion parameters, were further regressed out of the data to avoid confounding of the following ALFF and FC calculations. Finally, band pass filtering (0.01-0.08 Hz) and linear detrending (removing linear and quadratic signals) were applied to minimize the influence of low-frequency drifts and high-frequency artifacts. 14
ALFF and fALFF Analysis
ALFF data were calculated using the DPARSF toolbox. The calculation processes mainly included a fast Fourier transform of each voxel’s time series, computation of the square root of the power spectrum, and averaging the resultant values in the band of 0.01 to 0.08 Hz. For each participant, this resulted in an ALFF map. A global mean ALFF value was subtracted and each individual ALFF divided by the SD of the ALFF values across all voxels, resulting in a zALFF map for each individual. To test the reliability of ALFF analysis, we also performed a fractional ALFF (fALFF) analysis of 2 groups.
FC Analysis
We investigated the FC between the seeds in the somatosensory as well as motor cortices and the other brain regions in both CTS patients and NCs. Four regions of interest (ROIs) were chosen according to our block-design fMRI investigation, which was similar to that in previous studies.15,16 The ROIs were spheres with 6-mm radii, centering at MNI coordinates of (−38, −22, 56), (38, −22, 56), (−42, −26, 54), and (38, −32, 48), which represent the right primary motor cortex (MI), left MI, right primary sensory cortex (SI), and left SI, respectively. Pearson’s correlation between the time course of each of the seeds and the time courses of the other voxels were calculated, resulting in individual FC maps. These maps were transformed to z-score maps (zFC) using Fisher’s Z transformation.
VBM Analysis
The DPARSF toolbox was used to analyze the acquired T1 images with specialized parameters for voxel-based morphometry (VBM) analysis. First, the skull and extracted images of the brain part were stripped. Then the images of brain tissue were normalized and modulated using the T1 template to reduce the deviation of alignment between participants. The image of each participant was segmented into 3 parts, including gray matter (GM), white matter, and cerebrospinal fluid. The GM density of each participant was aligned to the MNI standard template. Thereafter, the image was smoothed with a FWHM of [8 8 8]. Quality control was then applied for homogeneity and coregistration of data, and no outliers were discovered before statistical analysis. A 2-sample t-test was applied using SPM8 (http://www.fil.ion.ucl.ac.uk/spm/) to compare GM density between the 2 groups at a significance level of P < .01 (false discovery rate corrected for multiple comparisons).
Statistical Analysis
A 2-sample t-test was used to examine the group difference (P < .05) in ALFF and fALFF between CTS patients and NCs. To minimize the error of multiple comparisons, the minimal cluster size was set as 85. This extension threshold was determined using AlphaSim correction (http://afni.nih.gov/afni/docpdf/AlphaSim.pdf) based on Monte Carlo Simulations. 17
One-sample t-tests were used to analyze zFC maps for CTS patients and NCs. Only positive FC data were retained and were of interest. The thresholded (P > .01 at individual voxel, extension threshold of P < .05, and cluster size >40, as determined by AlphaSim correction, cluster connectivity criteria = 5, edge connected, spatial smoothness = 6 mm, brain mask 61 × 73 × 61, iteration = 1000) 1-sample t-test results for both groups were combined to form an inclusive mask for group comparisons. A 2-sample t-test was performed on the zFC maps within the mask to reveal any difference in FC between CTS patients and NCs. For different ROIs, FC and statistical comparisons were conducted separately.
Correlation Analysis
We first located the peak point of decreased zALFF in either the left or right hemisphere for CTS patients compared with NCs. The coordinates were then addressed, and 2 spherical ROIs were defined, with the peak points of decreased ALFF for CTS patients as center and 3 mm as radius. After that, the zALFF values in these 2 spherical ROIs were extracted separately and denoted by zALFFleft and zALFFright. Pearson’s correlation analysis was then performed between the zALFF value of peak coordinates of decreased zALFF for CTS in the left hemisphere (zALFFleft) and the sensory threshold of the right hand. Similarly, the correlation between zALFFright and sensory threshold of the left hand was also calculated.
Following group comparisons of FC, we identified the peak coordinates of the decreased FC, for CTS compared with NC. The peak point was located in the contralateral side of the seed, which came from the right or left SI. The zFC values between the seeds and the contralateral spherical ROIs centering at the peak coordinates (radius = 3 mm) in CTS patients were separately extracted and recorded as zFCright-inter and zFCleft-inter. Similarly, the peak coordinates of the increased FC for CTS were determined. The zFC values between the same 2 seeds and the ipsilateral spherical ROIs centering at the peak coordinates (radius = 3 mm) in CTS patients were calculated and recorded as zFCright-intra and zFCleft-intra. To minimize the bias brought by initial seed selection, we then calculated the mean value of zFCright-inter and zFCleft-inter (denoted by zFCmean-inter) as well as the mean value of zFCright-intra and zFCleft-intra (denoted by zFCmean-intra). We averaged zALFFleft and zALFFright and denoted the result as zALFFmean. The correlation between zALFFmean and zFCmean-inter was calculated via correlation analysis. Likewise, zALFFmean was correlated with zFCmean-intra via correlation analysis also.
Results
Demographic and Clinical Features
The number of participants finally enrolled in the cohort was 52, including 24 NCs (40-66 years, mean ± SD = 50.04 ± 7.62 years, female:male = 21:3) and 28 CTS patients (38-69 years, mean ± SD = 53.75 ± 8.37 years, female:male = 26:2).
There were no significant differences in age or gender (P > .05) between the 2 groups. All the CTS patients complained of paresthesia/numbness in both affected hands. Most patients had been experiencing paresthesias/numbness during the night, even awakening from sleep. EMG tests were performed on all patients, and the sensory velocities of median nerve conduction velocities were significantly slower in CTS patients compared with NCs (NC: R/L= 56.4 ± 1.71 ms/56.3 ± 1.86 ms; CTS: R/L=41.55 ± 7.84 ms/40.03 ± 8.12 ms, mean ± SD, P < .05). Self-reported CTS symptom duration was 4.79 ± 1.28 months. See Table 1 for demographic and clinical assessment details.
Demographics and Clinical Assessments. a

Data are shown as mean ± SD.
Group Differences of ALFF/fALFF Between CTS Patients and NCs
Figure 1 shows the results of the 2-sample t-tests for ALFF differences between CTS patients and NCs. Significantly decreased ALFF was observed in the bilateral SI and secondary sensory cortex (SII) in CTS patients. See Table 2 for a detailed list of the regions. The differences in fALFF analysis were mainly located in the bilateral SI, left frontal lobe, and left insula (see Supplementary Material 1).

ALFF alteration between the CTS patients and NCs (2-sample t-test, AlphaSim corrected P < .05). Blue indicates decreased ALFF in CTS patients compared with the NCs. Decreased ALFF was observed in bilateral SI and SII areas in CTS patients.
Regions Showing ALFF Differences Between CTS Patients and Normal Controls.

Abbreviations: ALFF, amplitude of low-frequency fluctuation; CTS, carpal tunnel syndrome; MNI, Montréal Neurological Institute.
Voxel-Wise FC Map Comprehension
Differences in sensorimotor cortices (4 ROIs) and the whole brain voxel-wise FC between the CTS patients and NCs using the 2-sample t-test are shown in Figure 2 (corrected P < .05). Generally, decreased interhemispheric FC was observed with the homologous regions of the ROIs in the contralateral hemisphere, whereas increased FC in the ROIs in the ipsilateral hemisphere was seen in all the 4 voxel-wise FC maps.

Differences in right MI (A), left MI (B), right SI (C), and left SI (D) voxel-wise functional connectivity between CTS patients and NCs using a 2-sample t-test (AlphaSim corrected P < .05). Blue indicates decreased ALFF in CTS patients compared with NCs, whereas the red indicates the opposite. The seed regions were spheres with 6-mm radii centering at MNI coordinates of (−38, −22, 56) (A), (38, −22, 56) (B), (−42, −26, 54) (C), and (38, −32, 48) (D), which, respectively, represented right MI (A), left MI (B), right SI (C), and left SI (D). Decreased interhemispheric FC was observed in the homologous regions of the ROIs in the contralateral hemisphere, whereas increased FC in the ROIs in the ipsilateral hemisphere occurred in all the 4 voxel-wise FC maps no matter which ROI was selected.
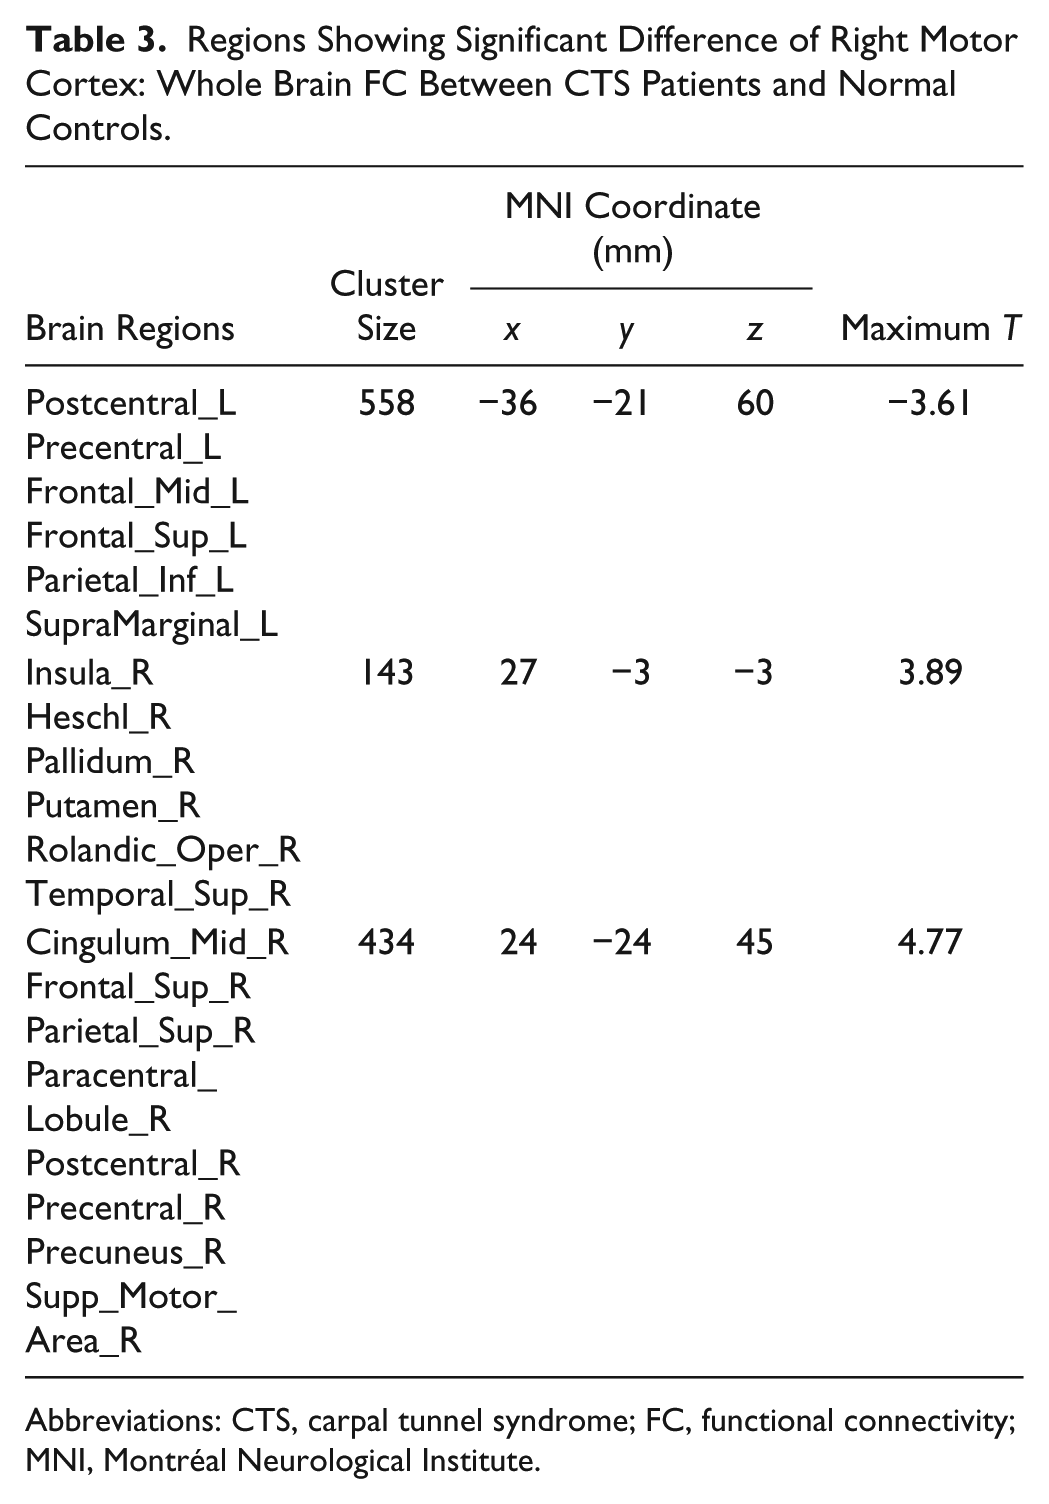
With the predefined ROI in the right MI, decreased interhemispheric FC was observed in the left precentral gyrus, left postcentral gyrus, left superior and medial frontal lobe, and left inferior parietal lobe. Increased intrahemispheric FC was observed in the right insula, right superior, and medial frontal lobe, right precuneus, right superior parietal lobe, right superior temporal lobe, right precentral gyrus, right postcentral gyrus, right putamen, and right pallidum (Figure 2A, Table 3).
Regions Showing Significant Difference of Right Motor Cortex: Whole Brain FC Between CTS Patients and Normal Controls.
Abbreviations: CTS, carpal tunnel syndrome; FC, functional connectivity; MNI, Montréal Neurological Institute.
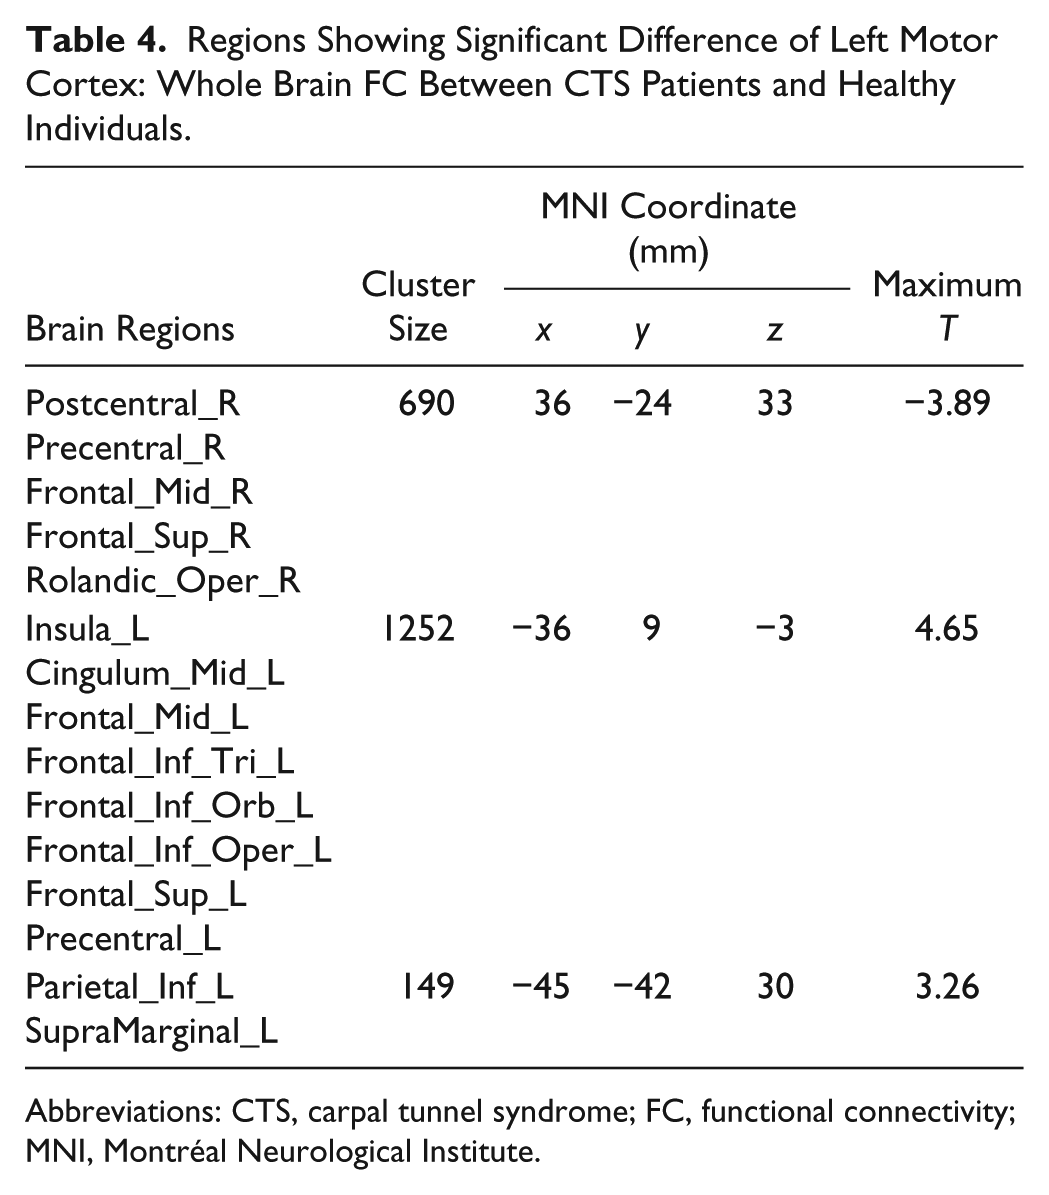
With the predefined ROI in the left MI, decreased interhemispheric FC was observed in the right precentral gyrus, right postcentral gyrus, right superior and medial frontal lobes, and right rolandic area. Increased intrahemispheric FC was observed in the left insula, left middle cingulum, left inferior and medial frontal lobes, left precentral gyrus, and left inferior parietal lobe (Figure 2B, Table 4).
Regions Showing Significant Difference of Left Motor Cortex: Whole Brain FC Between CTS Patients and Healthy Individuals.
Abbreviations: CTS, carpal tunnel syndrome; FC, functional connectivity; MNI, Montréal Neurological Institute.
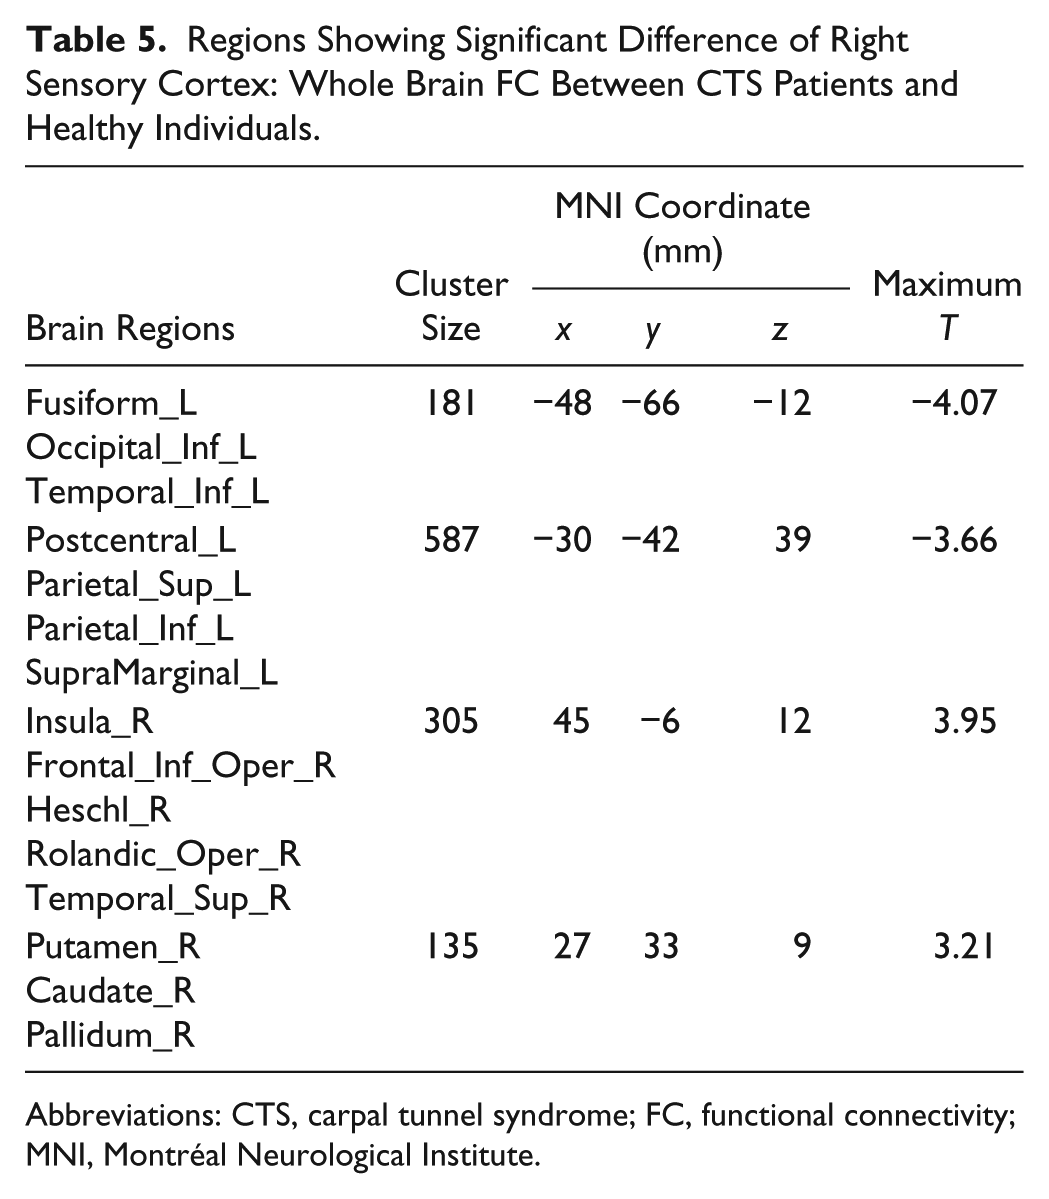
With the predefined ROI in the right SI, decreased interhemispheric FC was observed in the left postcentral lobe and left inferior and superior parietal lobes. Increased intrahemispheric FC was observed in the right insula, right putamen, right caudate, right pallidum, right inferior frontal lobe, and right superior temporal lobe (Figure 2C, Table 5).
Regions Showing Significant Difference of Right Sensory Cortex: Whole Brain FC Between CTS Patients and Healthy Individuals.
Abbreviations: CTS, carpal tunnel syndrome; FC, functional connectivity; MNI, Montréal Neurological Institute.
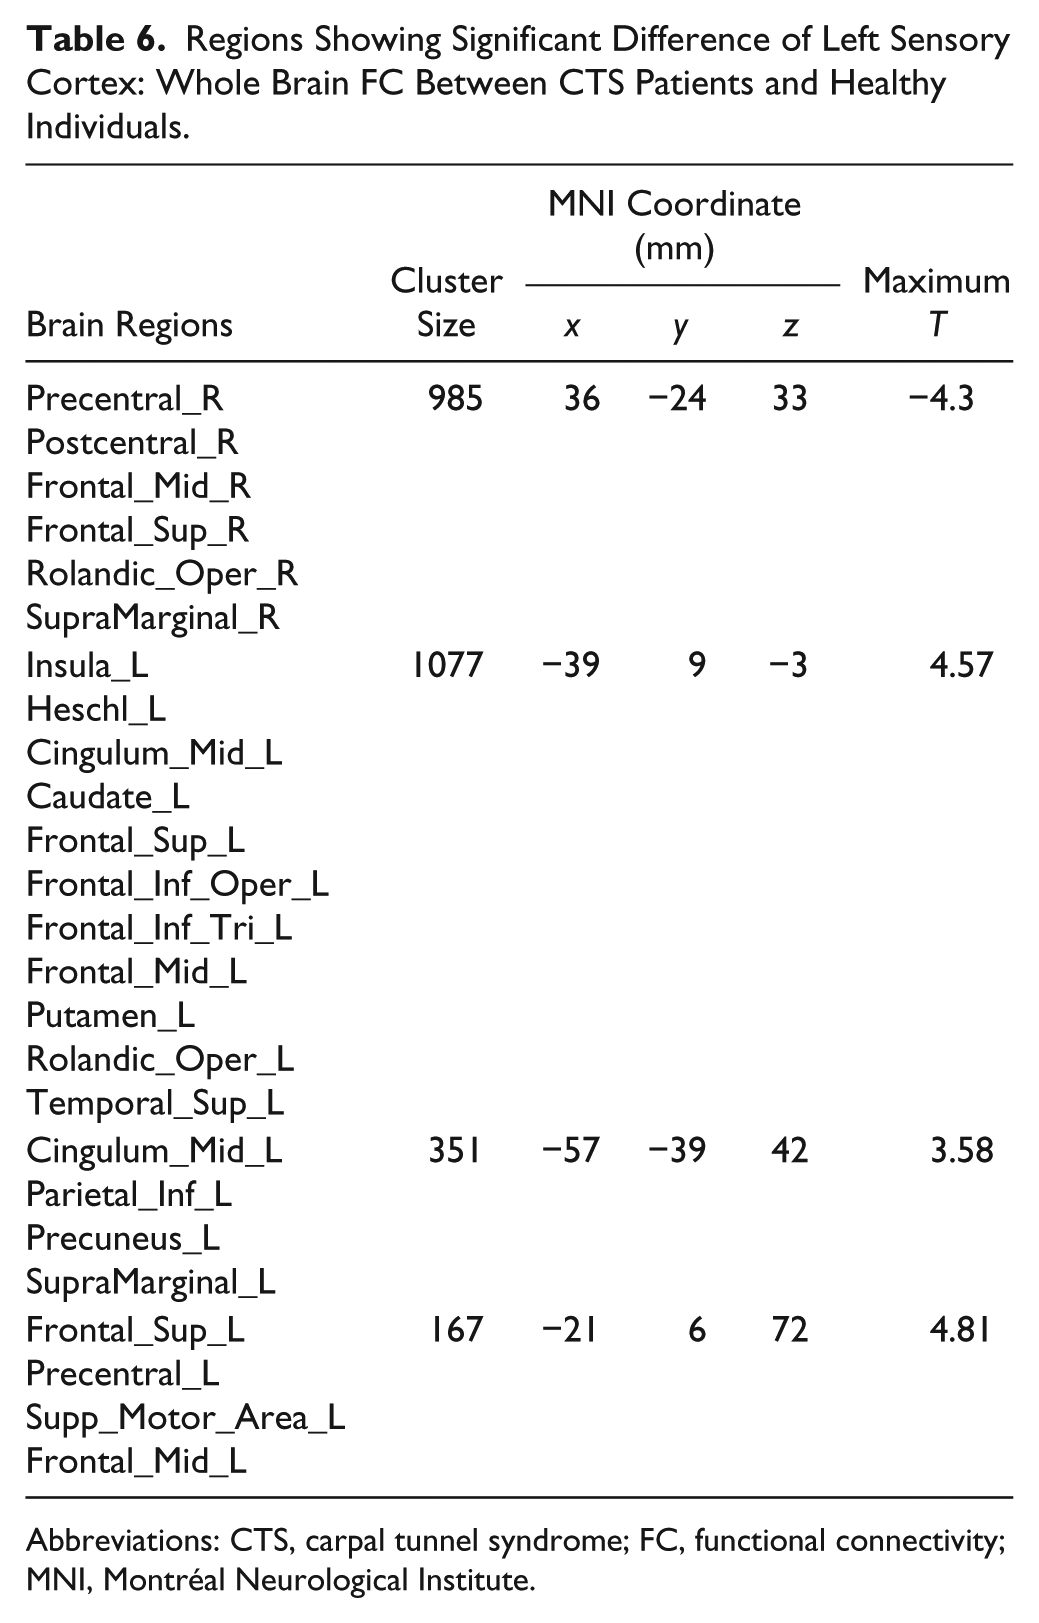
With the predefined ROI in the left SI, decreased interhemispheric FC was observed in the right precentral gyrus, right postcentral gyrus, right superior and medial frontal lobes, right supramarginal area, and right rolandic area. Increased intrahemispheric FC was observed in the left insula, left middle cingulum, left caudate, left inferior, medial and superior frontal lobes, and the left precuneus (Figure 2D, Table 6).
Regions Showing Significant Difference of Left Sensory Cortex: Whole Brain FC Between CTS Patients and Healthy Individuals.
Abbreviations: CTS, carpal tunnel syndrome; FC, functional connectivity; MNI, Montréal Neurological Institute.
Correlations Between ALFF and Sensory Threshold
Figure 3 shows the correlation between the unilateral zALFF and the sensory threshold of the contralateral hand. The peak zALFF located in the right hemisphere correlated negatively with the sensory threshold of the left hand (R2 = 0.22). Similarly, the peak zALFF located in the left hemisphere correlated negatively with the sensory threshold of the right hand (R2 = 0.34). That is, negative correlations were found between the zALFF values of contralateral cortices and tactile function in the affected hands.

Correlation between unilateral zALFF and sensory threshold of the contralateral hand: (A) The peak zALFF located in the right hemisphere correlated negatively with the sensory threshold of the left hand (R2 = 0.34). (B) Similarly, the peak zALFF located in the left hemisphere correlated negatively with the sensory threshold of the right hand (R2 = 0.22).
Correlations Between the ALFF and Interhemispheric/Intrahemispheric FCs
Figure 4 shows the correlation between ALFF and interhemispheric and intrahemispheric FCs. The zALFFmean was found to be positively correlated with the zFCmean-inter (R2 = 0.43) and negatively correlated with the zFCmean-intra (R2 = 0.51; corrected P < .01).

Correlation between ALFF and interhemispheric and intrahemispheric FCs: the zALFFmean was found to be positively correlated with the zFCmean-inter and negatively correlated with the zFCmean-intra (AlphaSim corrected P < .025).
VBM Analysis
We applied a VBM analysis to compare the GM density of the 2 groups. The result showed that there was a decrease in GM density in the right lateral temporal lobe and left inferior occipital lobe (Figure 5). No significant change in sensorimotor area was found.

Gray matter density difference between the CTS patients and NCs (2-sample t-test False Discovery Rate (FDR)-corrected P < .01): Blue indicates decreased gray matter density in CTS patients compared with NCs. There was a decrease in gray matter density in the right lateral temporal lobe and left inferior occipital lobe.
Discussion
The relationship between median nerve entrapment and brain fMRI presentation has been explored since 2006. Napadow et al 6 and Maeda et al 7 evaluated the changes in plasticity through block-design fMRI, and the cortical effect of several treatments for CTS, such as acupuncture, has been examined lately.18,19 But interventions, including anesthesia and sensory relearning, failed to have a positive effect on CTS patients.20,21 On the other hand, there were also magnetoencephalography studies focusing on the plasticity of CTS.9,22 Measurements of magnetoencephalography, such as M20, were found to be novel markers of neural plasticity. However, most of the current knowledge of CTS-related brain functional alteration was obtained from task-related fMRI studies in which sensory protocols of vibrotactile or electrical task/stimulus were administered. 7 It has remained unknown how the spontaneous CTS-related modulation pattern of blood oxygen level–dependent (BOLD) signal appears. Considering the persistence of digital paresthesia brought on by median nerve entrapment, the application of resting-state fMRI may lead to a complementary understanding of the neuroplasticity in intrinsic brain activities other than as an isolated response to conditional sensory stimulus. 23 Moreover, the analysis of synaptic activity is independent of the experimental paradigm, which makes it possible to gain additional information besides task-related fMRI. The present cross-sectional study has for the first time evaluated the local and extensive neuroplasticity in a relatively large sample of CTS patients using resting-state fMRI.
First, the present study revealed decreased local synaptic activity in the bilateral SI and SII cortices, indicated by significant ALFF attenuation. ALFF is supposed to be coupled with regional cerebral blood flow 24 and is susceptible to intrinsic or synaptic activity of the brain, which is physiologically meaningful. 25 It represents an unconstrained baseline state of mental activity and is regarded as an index reflecting the synaptic activity within a specific frequency range without filtering at the baseline state. With ALFF, we are able to record the deviation of the BOLD signal throughout the scanning period, rather than acquiring an averaged level. 26 Because CTS is mainly driven by a persistent conduction block secondary to the median nerve compression, 27 this sensory afferent interruption may potentially lead to the attenuation of synaptic activity in the corresponding cortices involving SI and SII. We also performed a fALFF analysis, and the result was very similar to that with ALFF analysis. However, there were still some slight differences between them, which might be ascribed to lack of physiological noise correction.
Second, we sought to evaluate how the local synaptic activity variation was related to functional deficits in CTS. The physiological assessment demonstrated that the patients were significantly impaired in the detection of simple tactile stimuli, as indicated by increased sensory thresholds. Because the sensory threshold directly reflects sensory deficits in CTS patients, it was used as an index for correlation analysis. We only carried out the correlation analysis between the zALFF value of unilateral ALFF-decreased area and the sensory threshold of the contralateral hand, which provides the corresponding hemisphere (contralateral to the hand) with sensory informational afferentation. Consequently, unilaterally, the zALFF was found to be negatively correlated with the sensory thresholds of the corresponding hands. This result indicates a potential correlation between the local synaptic activity and sensory deficits in the contralateral hand. That is, patients with worse clinical symptoms tended to present with lower local synaptic activity in the corresponding sensory cortex.
In the whole brain analysis, decreased interhemispheric FC and increased intrahemispheric FC was observed in the voxel-wise FC calculation using 4 predefined seed regions that individually localized to the bilateral primary sensory and motor cortices. Interestingly, the related brain regions in the intrahemisphere and interhemisphere appeared to act in opposite ways when confronted with the same situation of peripheral sensory nerve conduction block. When the local synaptic activity is lowered because of the peripheral input block, its functional connections with nearby areas might be enhanced to compensate. In the present study, we were aware of the stable and consistent presence of a FC-increased region—namely, the insula lobe, wherever the seed region was selected. This suggests a possible neuroplasticity of the insular cortex in peripheral nerve entrapment neuropathy. The insular cortex is important in sensory information processing and integration.28,29 The enhancement of the intrahemispheric FC may compensate for the diminished peripheral afferentation. In contrast, the decreased interhemispheric FC indicated a possible impairment of bilateral hemispheric motor or sensory information exchange. A possible explanation for this is that lower local synaptic activity has potentially suppressed the synchronization effect from the contralateral hemisphere. This desynchronization between bilateral hemispheres might result in disinhibition from the contralateral hemisphere that would subsequently facilitate more enhanced intrahemispheric FC.
The correlation between the mean ALFF and mean interhemispheric and intrahemispheric FC was analyzed to explore the relationship between local and extensive synaptic activity. Local synaptic activity decrease was a direct and initial functional alteration secondary to the focal peripheral neuropathy, such as distal median nerve entrapment. However, the voxel-wise FC alterations represented subsequent changes in relatively large brain areas. In the correlation analysis, the interhemispheric and intrahemispheric FC were found to be positively and negatively correlated with the ALFF, respectively, suggesting potential coupling effects at the extensive brain level following local synaptic activity decrease. Specifically, lower local synaptic activity was coupled with enhanced intrahemispheric connectivity and decreased interhemispheric connectivity.
However, GM density was only reduced in nonsensorimotor areas. This implies that functional changes of the sensorimotor cortices in the CTS patients were not related to structural alterations. In contrast, another study reported that GM volume was significantly reduced in the contralateral SI (hand area) and pulvinar and frontal poles. 8 This discrepancy might be explained by the relatively shorter symptom duration in our CTS patient cohort.
It is very likely that the severity of nerve compression had an impact on cortical plasticity. However, this study only recruited individuals who had motor deficit and were in the advanced stage. Although homogeneity could be ensured in this way, it was impossible to study the relationship between severity and plasticity in this research. In fact, it is quite important to distinguish the differences in plasticity brought about by the severity of disease in some longitudinal studies. It would be a fascinating problem for further study.
In conclusion, focal peripheral nerve entrapment neuropathy appears to induce both local and extensive neuroplasticity in bilateral hemispheres, with the extent of the neuroplasticity depending on the severity of the peripheral nerve entrapment.
Limitations and Future Work
Several limitations of our study should be noted. Because there are far fewer men affected by CTS than women, we have only recruited 2 male patients in the present cohort. Thus, the resting-state fMRI presentations between male and female patients should be explored in a future study that includes more male CTS patients. In addition, it will be important for further investigations to explore the relationship between resting-state and task-related fMRI and to investigate longitudinal changes in CTS patients comparing pretreatment and posttreatment brain status.
Footnotes
Supplementary material for this article is available on the Neurorehabilitation & Neural Repair website along with the online version of this article.
Authors’ Note
Ye-Chen Lu, Han Zhang, and Mou-Xiong Zheng contributed equally to this work.
Declaration of Conflicting Interests
The authors declared no potential conflicts of interest with respect to the research, authorship, and/or publication of this article.
Funding
The authors received no financial support for the research, authorship, and/or publication of this article.
References
Supplementary Material
Please find the following supplemental material available below.
For Open Access articles published under a Creative Commons License, all supplemental material carries the same license as the article it is associated with.
For non-Open Access articles published, all supplemental material carries a non-exclusive license, and permission requests for re-use of supplemental material or any part of supplemental material shall be sent directly to the copyright owner as specified in the copyright notice associated with the article.
