
Abstract
Background. Recent work has shown that resting-state functional connectivity (rsFC) between homotopic, motor-related brain regions is associated with upper-extremity control early after stroke. Objectives. This study examined various patterns of rsFC in chronic stroke, a time at which extensive neural reorganization has occurred. Associations between homotopic somatomotor connectivity and clinical measures, representing separate domains of upper-extremity function, were determined. Methods. A total of 19 persons ≥6 months poststroke participated. Four connectivity patterns within a somatomotor network were quantified using functional magnetic resonance imaging. Upper-extremity gross muscle activation, control, and real-world use were evaluated with the Motricity Index, Action Research Arm Test, and accelerometry, respectively. Results. Connectivity between homotopic regions was stronger than that in the contralesional and ipsilesional hemispheres. No differences in connectivity strength were noted between homotopic pairs, indicating that a specific brain structure was not driving somatomotor network connectivity. Homotopic connectivity was significantly associated with both upper-extremity control (r = 0.53; P= .02) and real-world use (r = 0.54; P= .02); however, there was no association with gross muscle activation (r = 0.23; P=.34). The combination of clinical measures accounted for 40% of the variance in rsFC (= .05). Conclusions. The results reported here expand on previous findings, indicating that homotopic rsFC persists in chronic stroke and discriminates between varying levels of upper-extremity control and real-world use. Further work is needed to evaluate its adequacy as a biomarker of motor recovery following stroke.
Introduction
The cortical and subcortical areas regulating movement, though spatially remote from one another, are interconnected. 1 Motor function, therefore, is subserved by a widely distributed brain network. 2 One approach for examining connectivity between regions within a network involves quantifying temporal coherence in the blood oxygen level–dependent (BOLD) signal while the brain is in a resting state. 3 A growing body of evidence indicates that resting-state functional connectivity (rsFC) is correlated with behavioral output in the attention, memory, executive function, and motor domains.4-8 These findings have generated widespread interest, particularly in the context of poststroke hemiparesis, where focal lesions result in a widespread physiological disruption of the brain network mediating voluntary movement.9-12 For example, interhemispheric rsFC has been shown to decrease following corticospinal tract damage. 13 The corticospinal tract is functionally downstream from the motor-related brain regions flowing into it, thus, exemplifying the extent of network-wide dysfunction that results from isolated structural damage.
A common behavioral manifestation of stroke is paresis, which can be attributed to a reduced ability to volitionally activate spinal motor neurons.14,15 The unilateral paresis stemming from stroke compromises the capacity to produce fractionated, goal-directed upper-extremity movement (ie, control) 15 and reduces the frequency with which the limb is used in daily life. 16 Recent findings indicate that an association exists between rsFC and upper-extremity control in persons with poststroke hemiparesis.9,11,17 The phenomenon of activity-dependent plasticity is well established18-20 and is the basis for effective neurorehabilitation.18,21 Use-dependent changes can lead to adaptive neural reorganization of the somatomotor system. Conversely, a decrease in use can have deleterious effects. 22 Thus, it appears likely that connectivity may have an association with upper-extremity use. It is necessary, therefore, to examine upper-extremity function across the multiple domains in which it is compromised following stroke. Moreover, by the chronic stage, considerable neural reorganization has taken place. Whether resting-state connectivity discriminates between individuals with varying levels of upper-extremity function after brain connections have reorganized is not well understood.
Analyses of functional connectivity in the resting state have a number of advantages over task-evoked functional magnetic resonance imaging (fMRI) paradigms. 23 These advantages can be attributed primarily to the lack of a motor task. Specifically, without the need for comparable task performance across participants, data from stroke patients with wide-ranging motor impairment can be included in statistical analyses. There is also a reduction in task-induced head motion, which can compromise the accuracy of voxel registration relative to the desired anatomical location. Bilateral activations (ie, mirror movement) frequently observed in stroke patients 24 are also attenuated. Additionally, networks have been reported to be relatively stable across multiple testing sessions in the resting state. 25 These advantages, coupled with the insight gained into behavior, highlight the need for further research to determine if the resting-state connectivity signal is an adequate surrogate measure of motor recovery following hemiparetic stroke. 23
There were 2 objectives for the current study. The primary objective was to determine if associations exist between rsFC and clinical measures representing each domain of upper-extremity function that is dysregulated following stroke. The secondary objective was to compare the strength of interhemispheric and intrahemispheric connectivity patterns within the somatomotor network. Based on previous findings involving persons within 1 month of stroke, 9 it was hypothesized that rsFC between homotopic regions in either hemisphere would exhibit the greatest connectivity strength and that this pattern would have an association with upper-extremity control in chronic stroke.
Methods
Participants
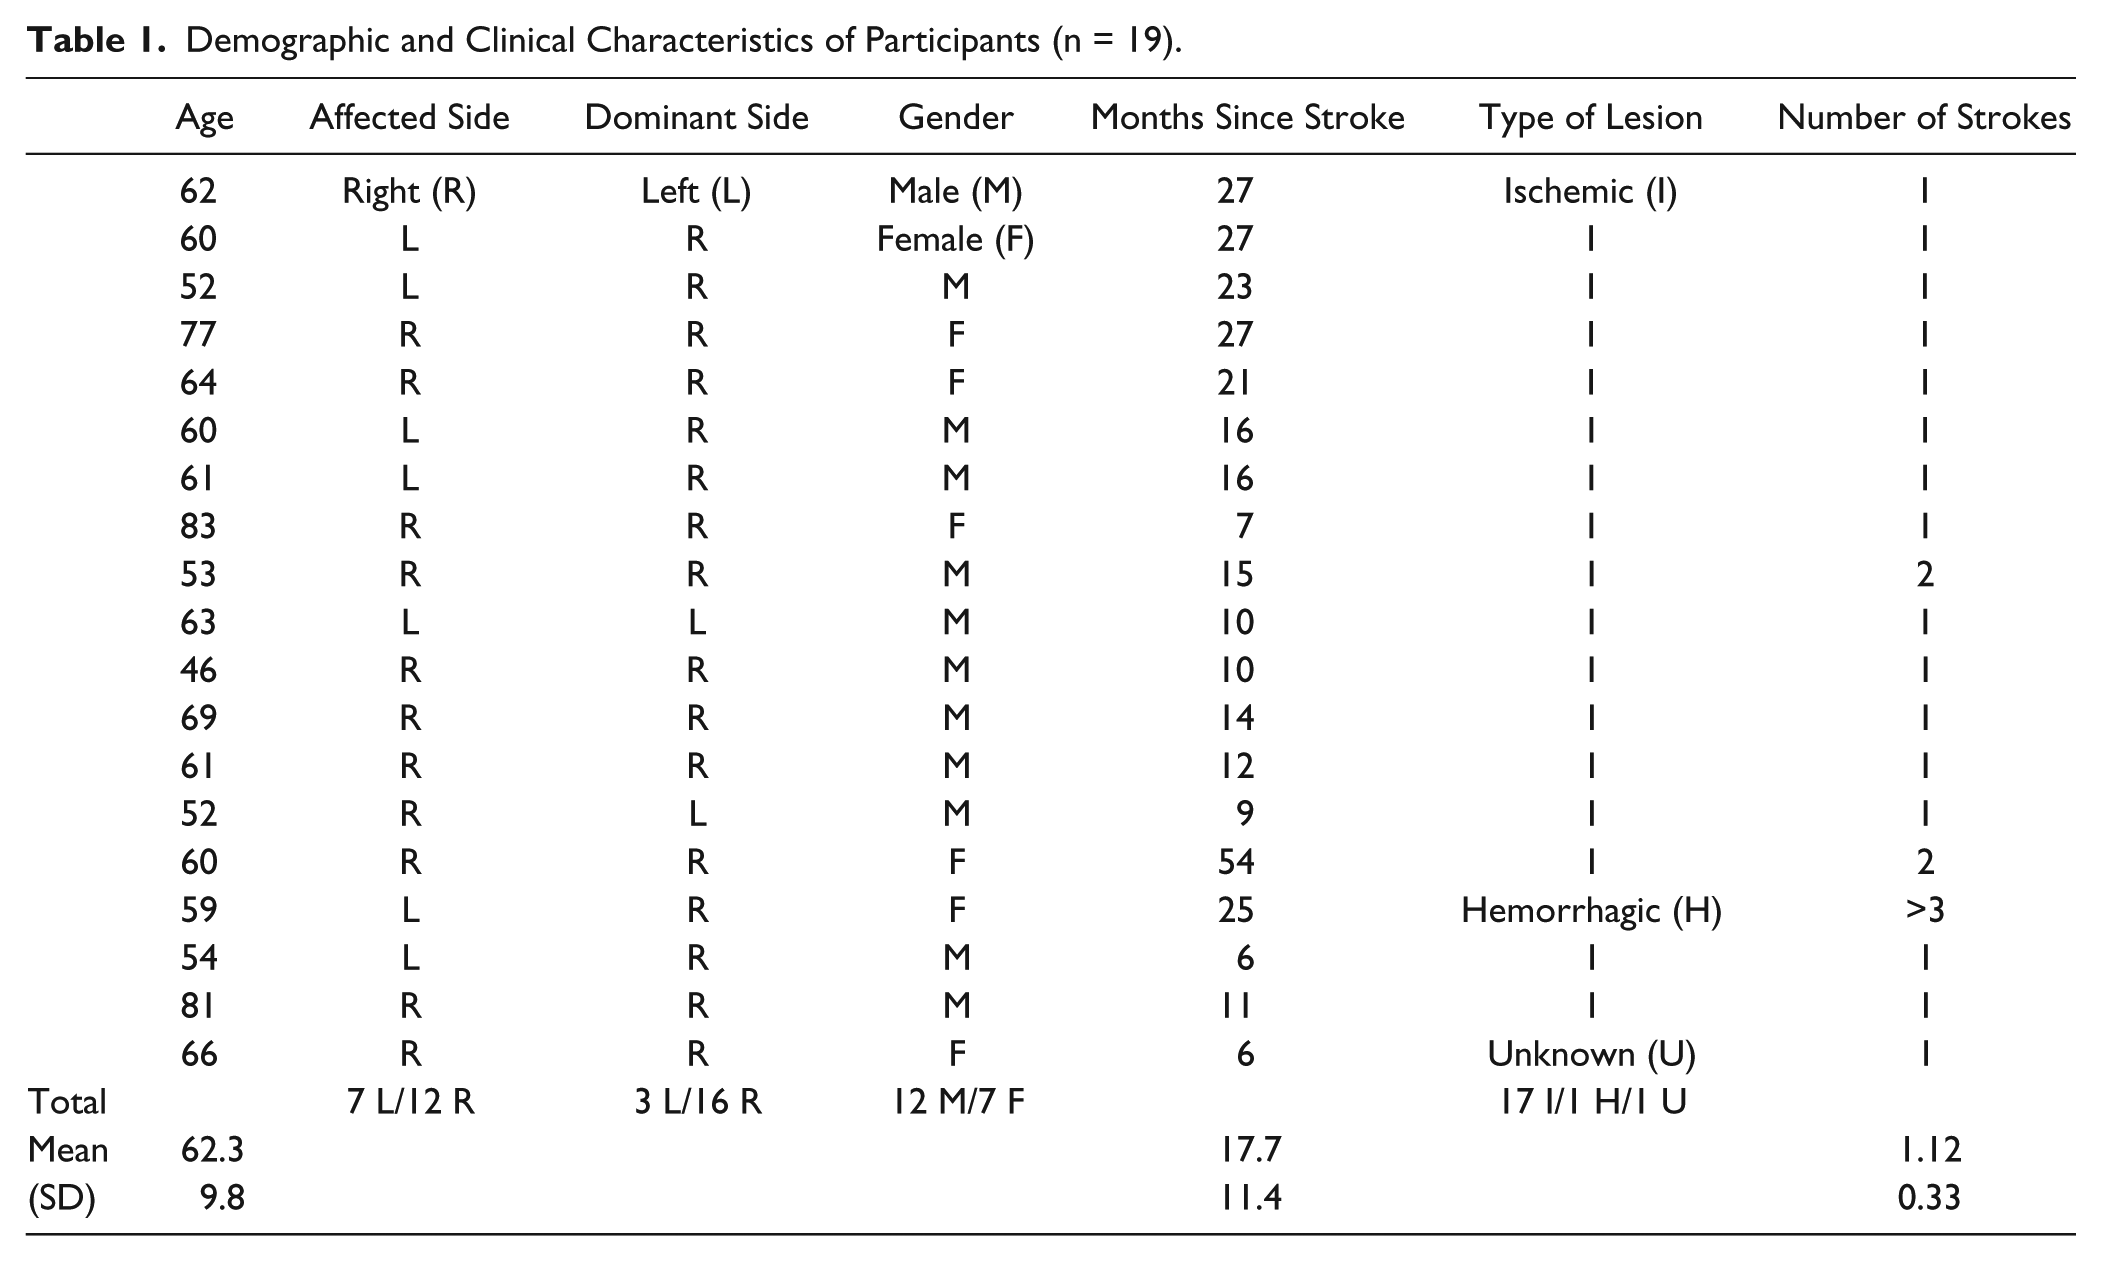
A total of 19 individuals with hemiparesis ≥6 months poststroke participated in the study. Participants were recruited as part of an ongoing clinical trial (NCT 01146379), and data were collected during the baseline assessment. Inclusion criteria were (1) clinical diagnosis of ischemic or hemorrhagic stroke as determined by a stroke neurologist; (2) cognitive skills to actively participate, defined as a score of 0 to 1 on the consciousness and communication items of the National Institutes of Health Stroke Scale (NIHSS); (3) unilateral upper-extremity paresis, defined by a score of 1 to 3 on the arm item of the NIHSS; (4) some ability to move the paretic arm, defined by a score of ≥ 10 on the Action Research Arm Test (ARAT); and (5) ability to sign informed consent. Exclusion criteria were (1) any contraindication to MRI scanning, including but not limited to the presence of metallic implants or claustrophobia; (2) radiographic evidence of >2 lacunar infarcts, with each >15 mm in diameter; (3) history of neurosurgical intervention; (4) psychiatric diagnosis; (5) other neurological diagnoses; and (6) pregnancy. A group of neurologically intact participants (n = 14; 8 female; age = 20 ± 1.8 years) who met the same criteria were scanned with the same methods to compare connectivity strength. All participants provided informed consent according to procedures established and approved by the Washington University Institutional Review Board and were compensated for their time.
Upper-Extremity Clinical Measures
Upper-extremity gross muscle activation was quantified with the Motricity Index, a test that measures the ability to activate a muscle group to move a body segment through a range of motion and resist external force. The test consists of 3 upper-extremity actions: hand grasp, elbow flexion, and shoulder abduction. Each action was scored on a 0to 33-point scale, totaling 100 points, with a previously established system. 26 The Motricity Index was used because it is strongly correlated with dynamometer-derived measures of force production in stroke patients. 27
Upper-extremity control was quantified with the ARAT, a test that measures the ability to reach, grasp, manipulate, and release objects regularly encountered during activities of daily living. The test consists of 19 items, with each item scored on a 0 to 3-point scale. A score of 3 on an item indicates that the instructed action can be completed with a normal movement pattern. Thus, the total score of 57 points would reflect relatively restored movement control of the affected limb. The ARAT was used to measure upper-extremity control because it has strong psychometric properties, including sensitivity to change in people with stroke,28-30 and it is widely used in upper-extremity rehabilitation.31,32 The ARAT is also strongly correlated with other measures of upper-extremity function. 33
Upper-extremity real-world use was measured with accelerometers over a 24-hour period. 34 Participants wore wireless devices (GT3X + Activity Monitor, ActiGraph, Pensacola, FL; 4.6 cm × 3.3 cm × 1.5 cm) on the wrist, just proximal to the radial and ulnar styloid. The device contained a triaxial, solid-state digital accelerometer, detecting accelerations in all 3 cardinal planes. Accelerations were sampled at 30 Hz, and the amount of acceleration that occurred per sample was expressed as activity counts (0.001664 g/count). Once fitted, participants were instructed to not remove the device for the subsequent 24 hours, except when showering/bathing. Each device contained a label to ensure that it was placed on the appropriate limb after showering/bathing.
On returning the accelerometers, participants were asked whether they used the paretic arm about the same, more, or less than that for a typical day. All participants reported that use of the paretic arm during the 24-hour period was representative of a typical day. Recordings were inspected to verify that participants did not remove the accelerometer during the 24-hour period. Accelerations occurring about each axis were squared and summed together. The square root of the resulting value was taken as the aggregate activity for each sample. The overall duration of use was defined as the sum in seconds where aggregate activity was ≥2 counts within the 24-hour period.35,36 All upper-extremity behavioral parameters were quantified on both the affected and unaffected limbs, but only affected-limb data were used for analyses.
Resting State BOLD fMRI and Structural Scanning
A Siemens 3.0 T Trio MRI scanner was used to capture resting-state BOLD fMRI and structural scans. Participants were asked to maintain fixation on a central cross displayed on a computer monitor. A gradient echo-planar sequence sensitive to BOLD contrast was used (echo time [TE] = 27 ms; flip angle = 90°; 4 × 4 × 4 mm3 voxels; 32 contiguous slices; volume repetition time [TR] = 2.0 s). Each BOLD fMRI scan consisted of 128 frames (or volumes) and lasted for 4.4 minutes. In all, 3 to 6 resting scans were obtained for each participant. Structural images for atlas transformation and lesion segmentation were acquired using a T1-weighted magnetization-prepared rapid-gradient echo (1 × 1 × 1 mm3 voxels; TE = 2.26 ms; TR = 1950 ms; TI = 900 ms; flip angle = 90°) and T2-weighted fast spin echo sequence (1 × 1 × 1 mm3 voxels; TE = 442 ms; TR = 2500 ms).
Definition of Brain Networks
The somatomotor network was defined using regions of interest (ROIs) from a meta-analysis of task-evoked activations in previous experiments.9,13 A total of 25 ROIs were located within the frontal lobe (12), parietal lobe (8), insular cortex (3), and cerebellum (2). These ROIs were used as seeds to generate connectivity maps (Figure 1). A peak search algorithm was used to identify additional ROIs and subjected to an iterative algorithm to ensure that correlation maps obtained with any seed were maximally concordant with the maps produced by other seeds in the same network. 37 Connectivity patterns were examined as opposed to using a model-free, data-driven characterization of the somatomotor network for 2 reasons. First, the current study expands on previous work that used ROI-to-ROI rsFC patterns to identify neurobehavioral associations in acute stroke. 9 Second, there is no widely accepted approach for using independent-component analysis to establish region-to-region connectivity.
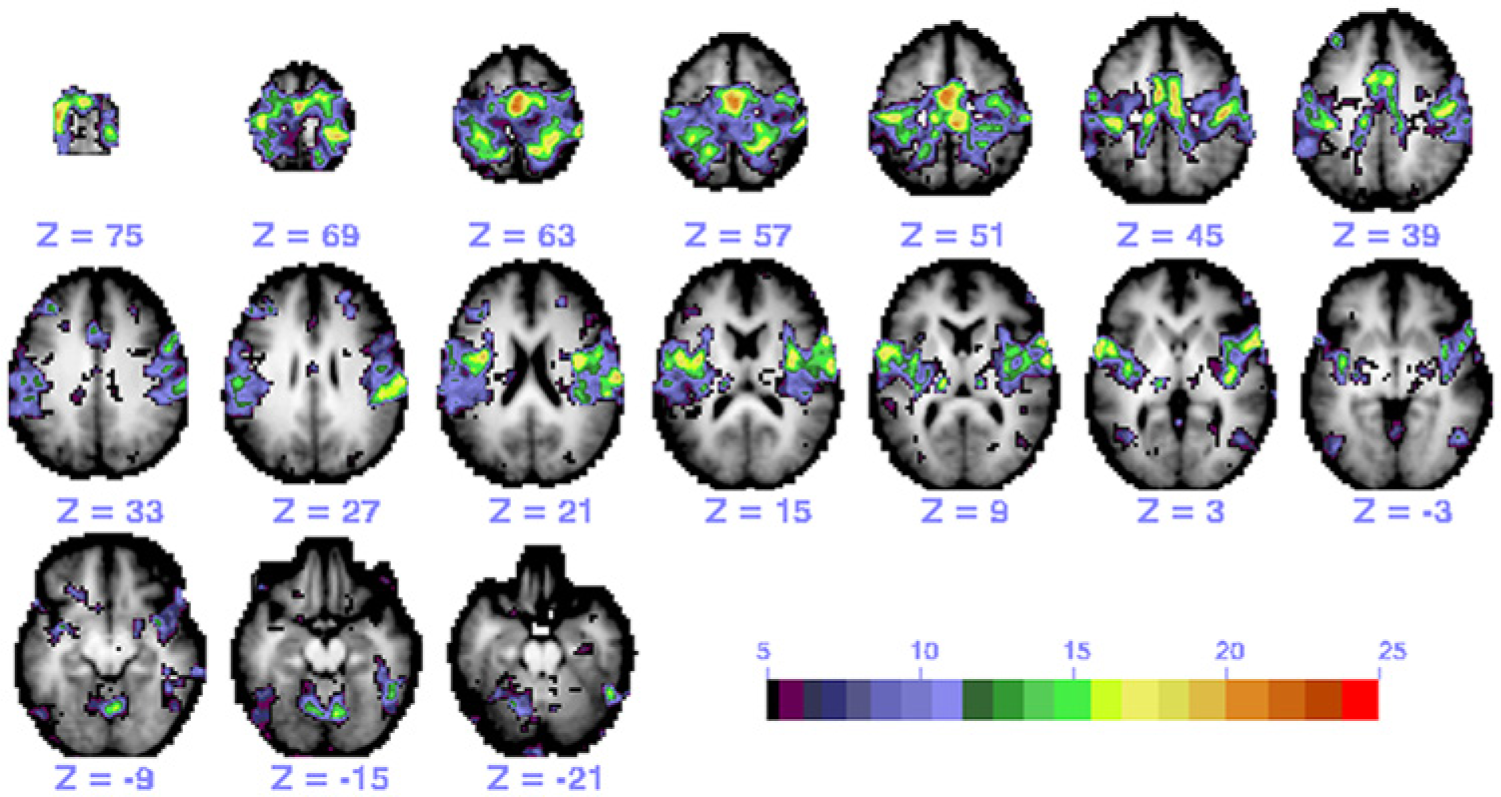
A representative functional connectivity map of the somatomotor network in a control participant generated by the 25 regions of interest (ROIs): individual maps from each ROI seed were thresholded and then summed.
ROI-to-ROI Connectivity Values
A BOLD time course was extracted from each voxel within the seed ROI and averaged across voxels. The average time course was then correlated with the time course of each voxel within the brain. The Fisher z transform was applied to the correlation coefficient at each voxel and plotted to generate a functional connectivity map. Functional connectivity MRI maps corresponding to a selected seed ROI were generated for purposes of illustration. The average time course across voxels of 1 ROI was correlated with the average time course of voxels in other ROIs to obtain ROI-to-ROI connectivity values. Lesioned areas were identified, and ROIs containing lesioned voxels were excluded from connectivity analyses. Pearson correlation coefficients (r) for ROI pairs were calculated, and the Fisher z transform was applied to yield approximately normally distributed measures. To compute an average connectivity score for multiple ROI pairs, the Fisher z scores for the individual ROI pairs were averaged. These connectivity values were used for statistical analyses.
Statistical Analyses
Repeated-measures analysis of variance was used to test for strength differences between 4 connectivity patterns: (1) interhemispheric, homotopic connectivity is the mean connectivity score between homologous ROIs in the left and right hemispheres; (2) interhemispheric, heterotopic connectivity is the mean connectivity score between nonhomologous ROIs in the left and right hemispheres; (3) intrahemispheric, ipsilesional connectivity is the mean connectivity score between each ROI and all other ROIs in the lesioned hemisphere; and (4) intrahemispheric, contralesional connectivity is the mean connectivity score between each ROI and all other ROIs in the nonlesioned hemisphere. Greenhouse-Geisser adjustments were used as a result of a violation of the sphericity assumption. Independent t tests were used to test for differences in homotopic and heterotopic connectivity strength between stroke participants and healthy controls. Pearson correlation coefficients were used to evaluate the respective association between rsFC and each clinical measure. Based on sample size, correlation coefficients greater than 0.39 were significant at P <.05, and coefficients greater than 0.53 were significant at the P <.01 level. The strength of correlation coefficients was considered weak at 0.25 or below, moderate at 0.26 to 0.50, strong at 0.51 to 0.75, and very strong at 0.76 or greater. 38 Multiple regression was used to determine how much variance in homotopic rsFC is accounted for by the domains of upper-extremity function assessed by clinical measures. All statistical procedures were performed in SPSS (PASW Statistics 19), and the α level was set at .05.
Results
Participant demographics are reported in Table 1, and the distribution of lesions is shown in Figure 2. Overall, the sample consisted of persons with long-standing mild to moderate stroke, with about half of the sample affected on their dominant side. Lesions affected cortical and subcortical sites, with a high frequency of damage to the descending motor pathways and basal ganglia. There was a significant within-group difference between the 4 connectivity patterns (F1.758, 31.645 = 71.77; P < .001; η2 = .80; Figure 3). Post hoc tests indicated that interhemispheric rsFC between homotopic regions was stronger than heterotopic (P < .001), ipsilesional (P < .001), and contralesional (P < .001) connectivity. Additionally, heterotopic rsFC was weaker than that in the ipsilesional (P = .006) and contralesional (P = .016) hemispheres. The strength of homotopic and heterotopic connectivity was significantly less in stroke participants than in healthy controls (P = .002 and P = .012, respectively; Figure 4A). Connectivity strength between homotopic ROIs was similar in the stroke participants, indicating that no individual pair was driving the overall strength of homotopic connectivity in the somatomotor network (Figure 4B).
Demographic and Clinical Characteristics of Participants (n = 19).
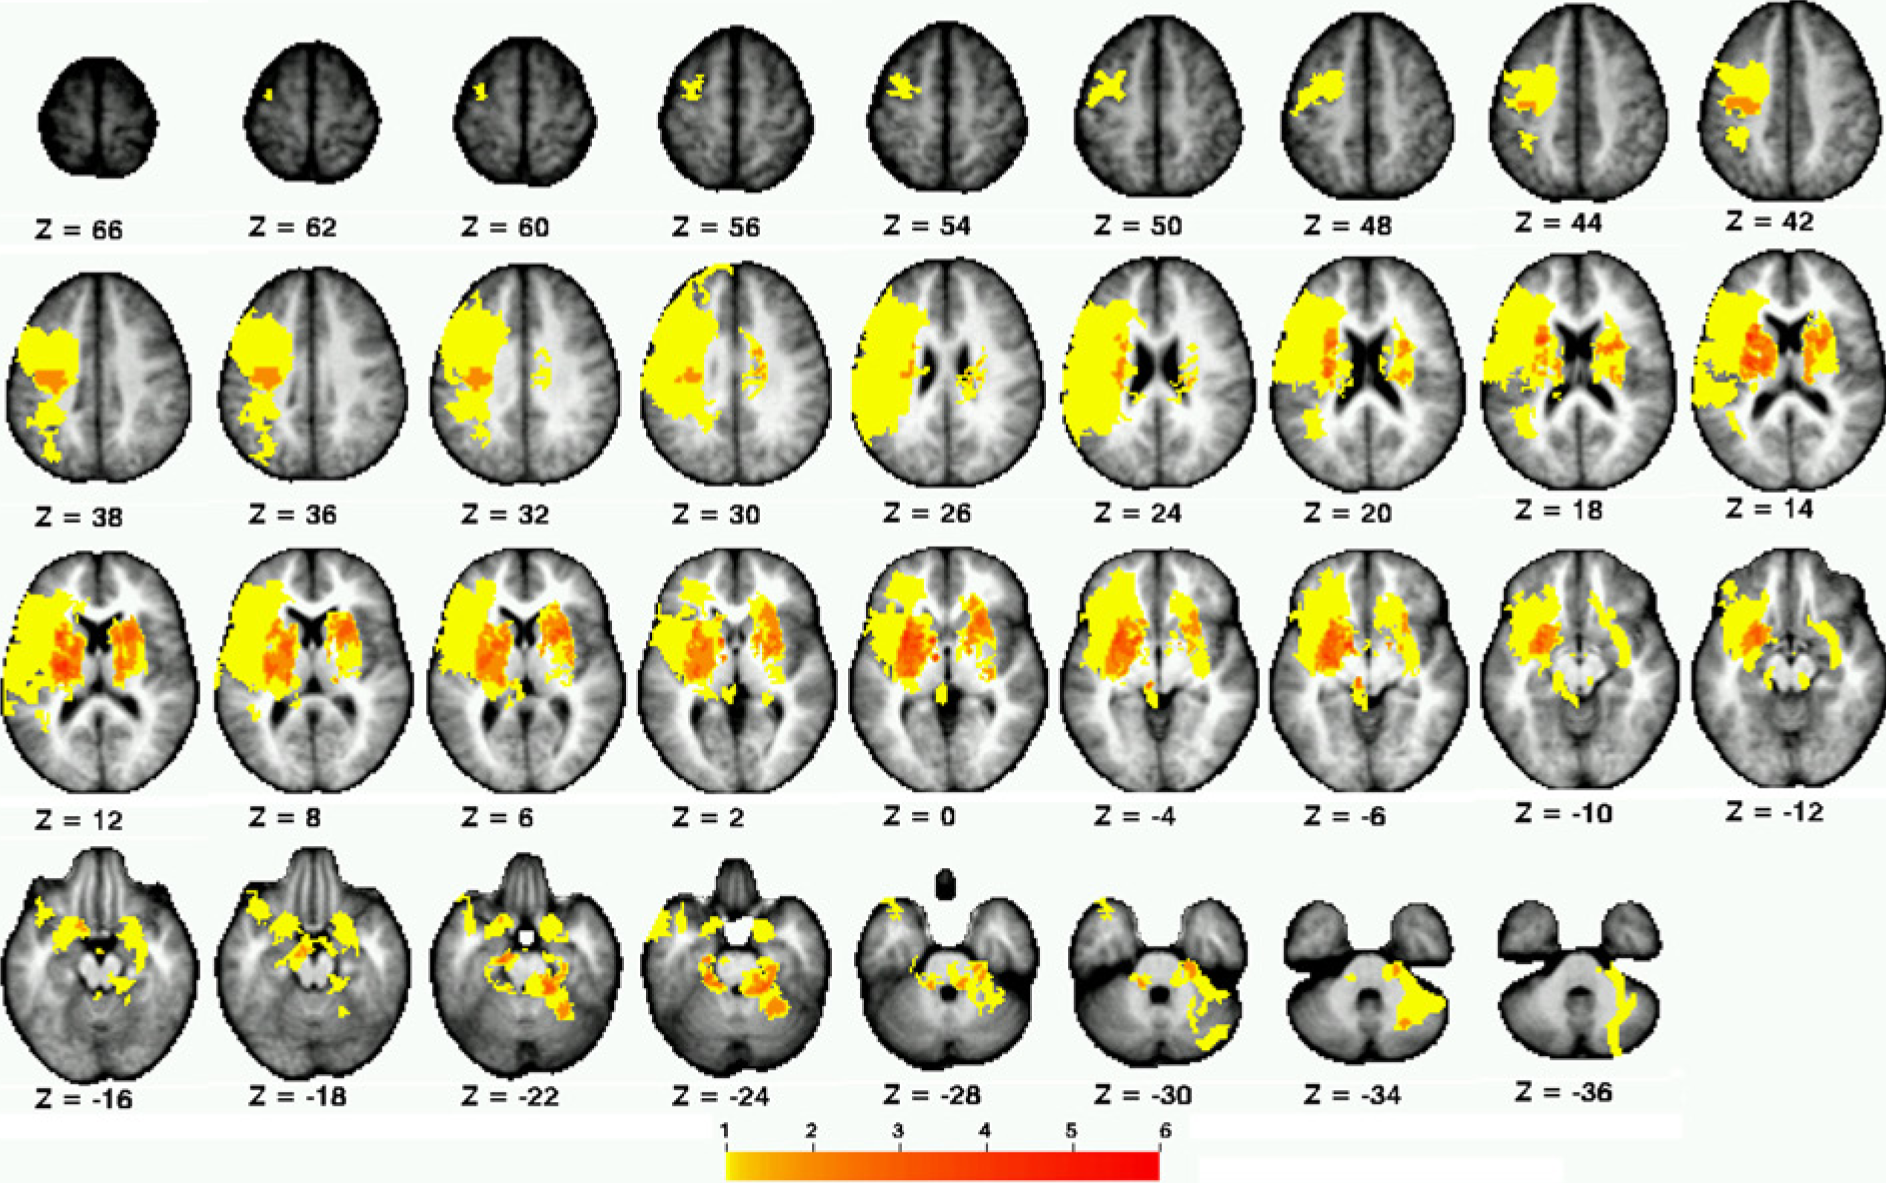
Distribution of stroke lesions: color scale indicates number of participants with lesioned voxel.
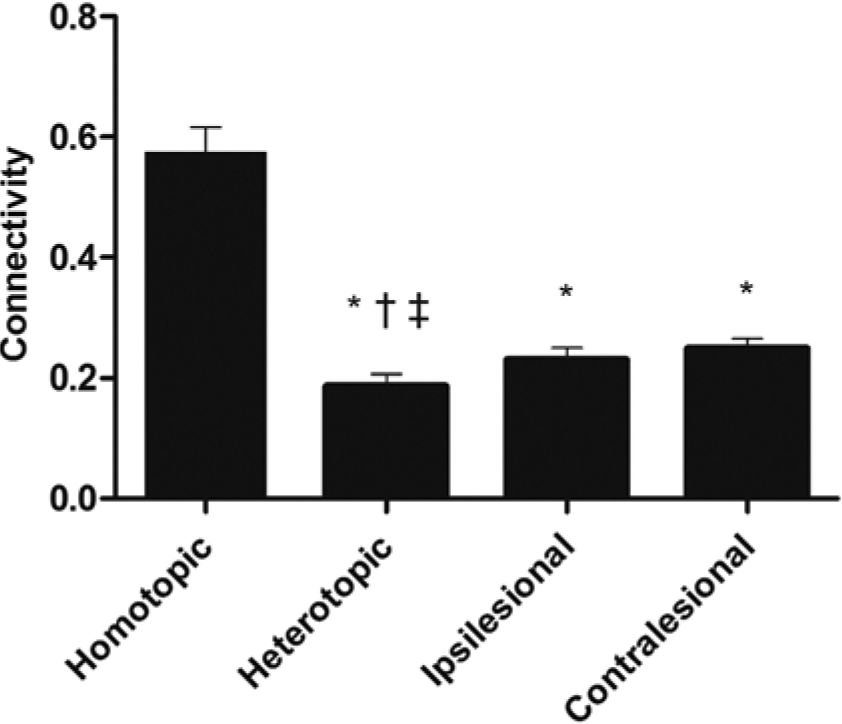
Strength of resting-state functional connectivity patterns.a
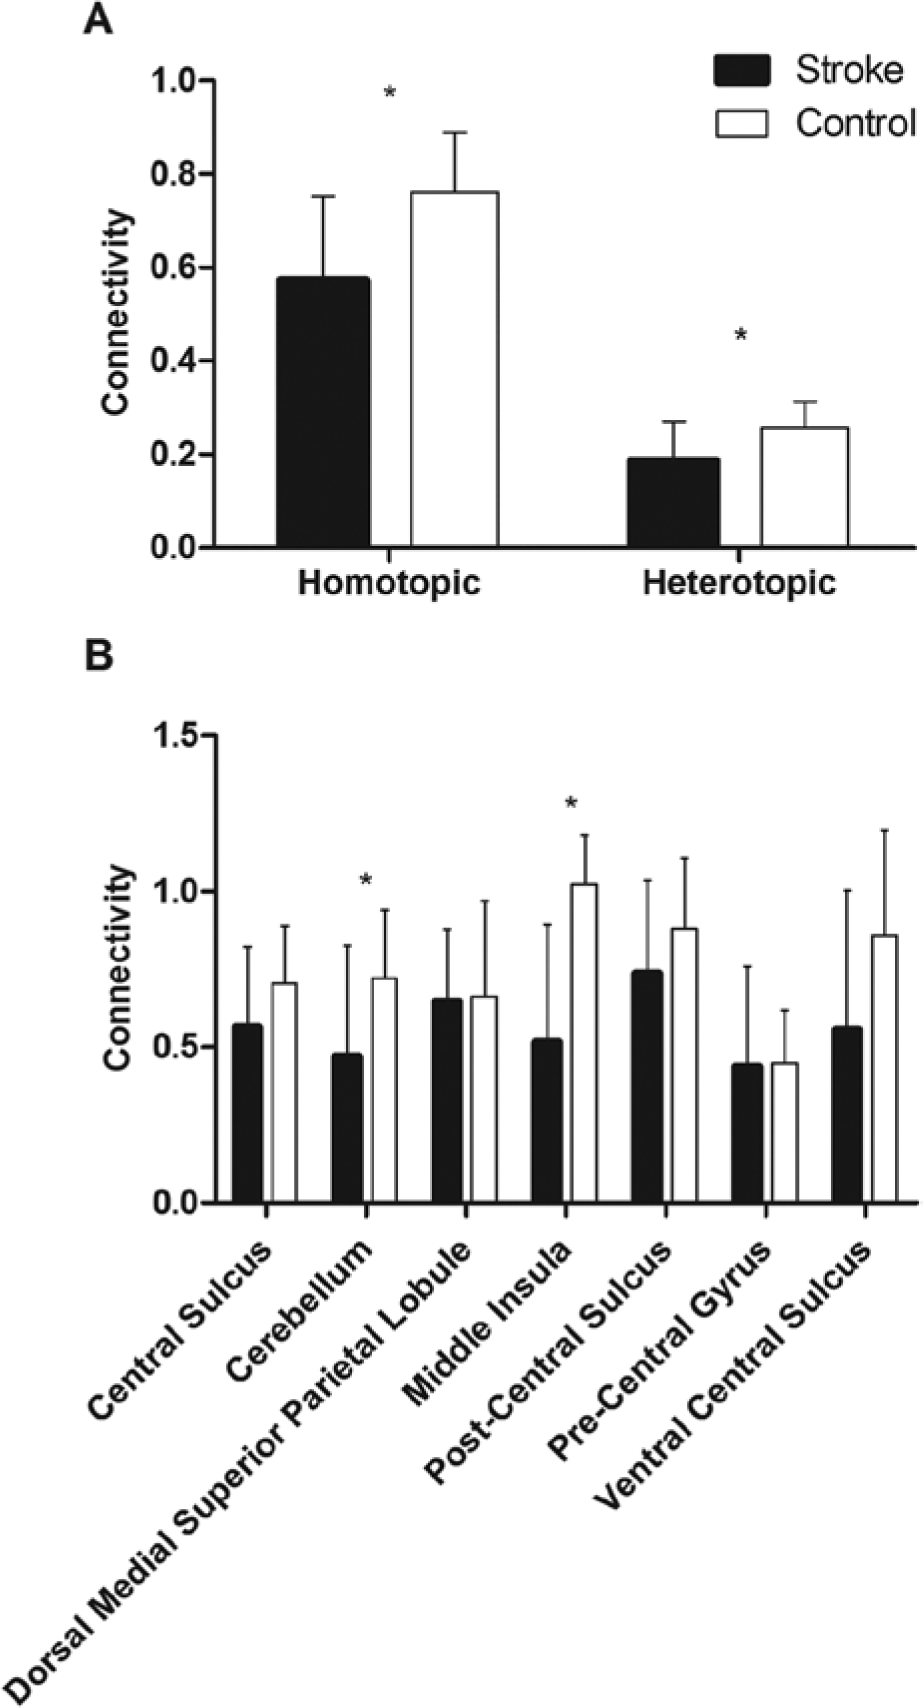
Comparison of (A) resting-state connectivity pattern strength and (B) homotopic regions of interest between stroke and control participants.a
The means and standard deviations for gross muscle activation, control, and real-world use of the upper extremity were 71 ± 13.9 points (0-100 scale), 30.7 ± 13.3 points (0-57 scale), and 4.8 ± 2.1 hours, respectively. Of the 3 behavioral parameters, 2 were significantly associated with homotopic rsFC. Whereas gross muscle activation was not significantly correlated with homotopic rsFC (Figure 5A; r = 0.23; P = .341), there was a significant association between rsFC and both upper-extremity control (Figure 5B; r = 0.53; P = .010) and real-world use (Figure 5C; r = 0.54; P = .009). Heterotopic connectivity did not correlate with gross muscle activation (r = 0.32), control (r = 0.26), or real-world use (r = 0.40). Neither ipsilesional nor contralesional connectivity correlated with gross muscle activation (r = 0.02 and r = 0.29, respectively), control (r = 0.08 and r = 0.17, respectively), or real-world use (r = 0.24 and r = 0.31, respectively).
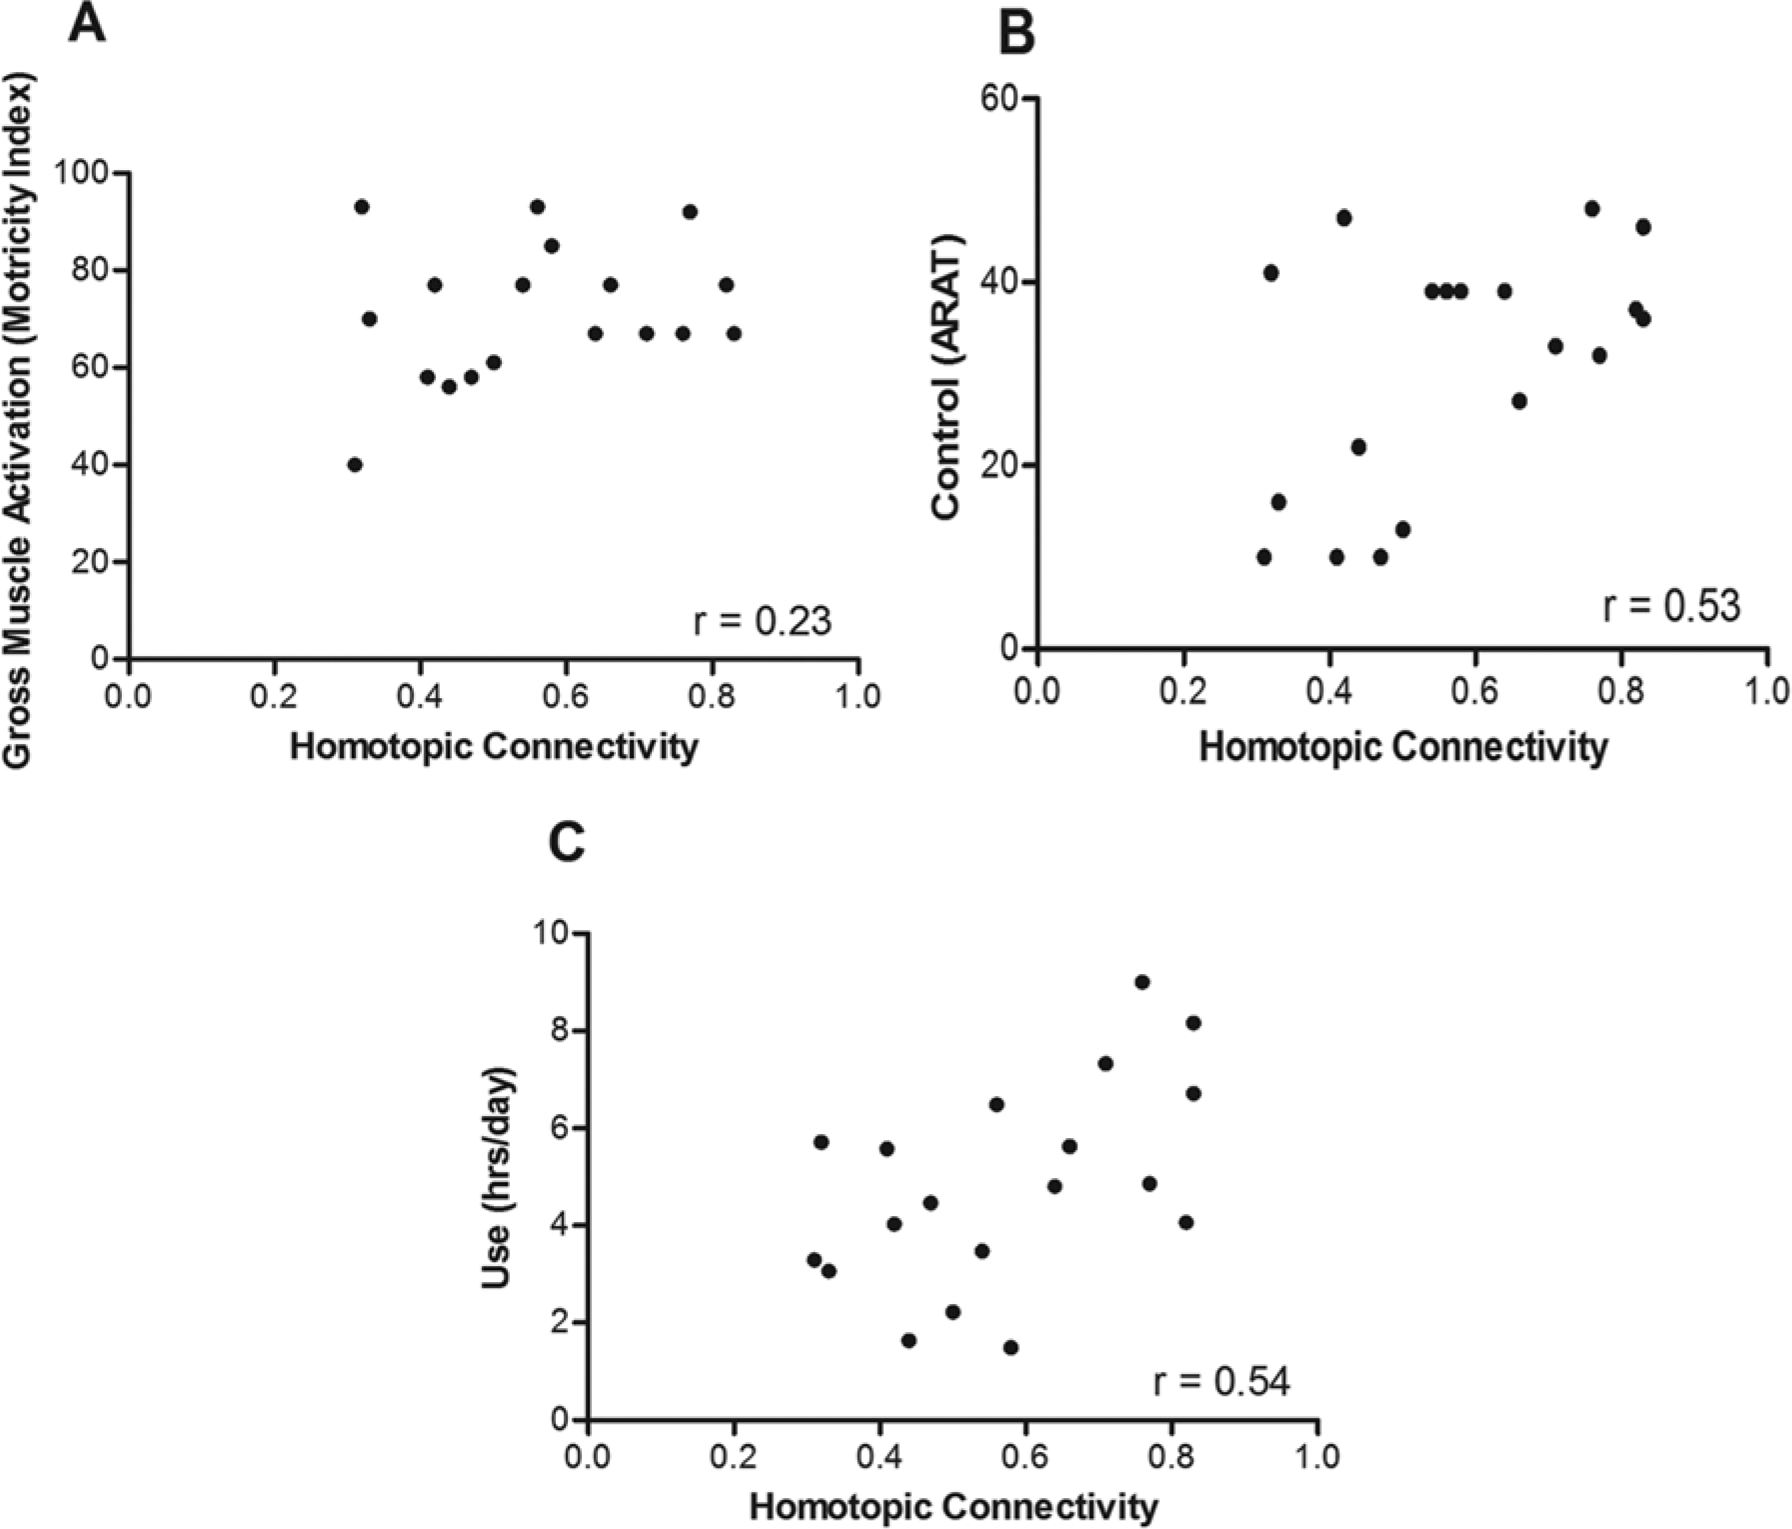
Correlations between interhemispheric, homotopic connectivity and each domain of upper-extremity function: (A) gross muscle activation, (B) control, and (C) real-world use.
Bivariate correlations between clinical measures were computed before entering them as predictors into a regression model. Though upper-extremity control was significantly correlated with upper-extremity gross muscle activation (r = 0.61; P = .003) and real-world use (r = 0.45; P = .027), the variance inflation factors were within normal limits (ie, <2.1), indicating that multicollinearity was not an issue. Inspection of a histogram and p-p plot of standardized residuals indicated that the remaining assumptions for linear regression were not violated. The overall regression model was significant (F3,15 = 3.73; P = .05; R2 = 0.40). None of the 3 parameters contributed significantly to the model, however (gross muscle activation: B = −0.068, t = -0.263, P = .796; real-world use: B = 0.359, t = 1.563, P = .139; control: B = 0.413, t = 1.434, P =.172). Squared semipartial correlations were used to further examine the unique proportion of the variance in homotopic rsFC explained by upper-extremity gross muscle activation (sr2 = 0.01), control (sr2 = 0.08), and real-world use (sr2 = 0.10).
Discussion
This study examined differences in the strength of intrahemispheric and interhemispheric connectivity patterns in persons with chronic stroke as well as the respective association between rsFC and multiple clinical measures corresponding to separate domains of upper-extremity function. The results demonstrate that rsFC between homotopic somatomotor regions across hemispheres is stronger than other connectivity patterns, and the association between interhemispheric rsFC and motor behavior persists in persons with chronic poststroke hemiparesis. The data also indicate that upper-extremity function accounts for a considerable portion of the variance in somatomotor network connectivity.
The findings of the current study indicate that interhemispheric rsFC between homotopic regions is stronger than connectivity within the lesioned and nonlesioned hemispheres. These results are consistent with previous rsFC analyses involving persons within 1 month of stroke. 9 Following a unilateral lesion, there is an increase in excitability of the nonlesioned hemisphere that exerts an inhibitory influence over the lesioned hemisphere. 39 Though the exact cause for the network-wide decrease in interhemispheric connectivity after a focal lesion is not well understood, it may be the result of decreased excitability (ie, reduced activity) in the lesioned hemisphere or an excitability imbalance between both hemispheres. Previous experiments have manipulated excitability in either hemisphere accordingly with transcranial direct current stimulation and reported improvements in motor function40-43 and stronger interhemispheric rsFC, 44 suggesting that more balanced excitability between hemispheres is desirable. 45 The findings of the current study indicate that stronger interhemispheric connectivity is associated with greater upper-extremity control. These findings add to a growing body of evidence that underscores the behavioral significance of interhemispheric equilibrium.9,13,46,47 Contrary to what might be expected, no single homotopic pair in the ROIs that were surveyed was stronger than another. The lack of a difference in this regard suggests that interhemispheric connectivity strength in the somatomotor network is not driven by one particular brain region (eg, primary motor cortex).
Consistent with this evidence, homotopic connectivity discriminates between varying levels of upper-extremity control in persons with chronic stroke, indicating that decreased interhemispheric connectivity is behaviorally relevant. The magnitude of the association reported here is strikingly similar to that of a previous study involving persons with acute stroke. 9 Thus, low-frequency BOLD signal oscillations within the somatomotor network are associated with behavior at various time points following stroke onset. Even after profound neural reorganization at the chronic stage, connectivity between corresponding brain structures underlying movement can differentiate between the extent of upper-extremity control fairly well. Real-world use of the affected upper extremity, whose association with connectivity has not been reported previously, also had a moderate to strong correlation with rsFC. Taken together, these findings suggest that rsFC not only provides insight into the somatomotor network’s capacity to produce competent, goal-directed movement but also may offer some indication of the system’s history of activation. It should be noted that the devices used to quantify real-world upper-extremity use do not discriminate between task-specific and non–task-specific upper-extremity movement.35,36,48,49 Nevertheless, the accelerations measured by these devices do yield a direct quantification of upper-extremity movement production outside of the laboratory setting.
The lack of a relationship between rsFC and gross muscle activation might be unexpected, given the respective associations between rsFC and upper-extremity control and real-world use. In essence, activation of the upper-extremity musculature underlies the ability to control the upper extremity and use it in real-world contexts. Though adequate activation is a prerequisite for producing sufficient muscular tension to generate movement, competent upper-extremity control can be achieved without the need to maximally activate the musculature. 15 Thus, normal performance on the clinical assessment of upper-extremity gross muscle activation likely requires more force development than that required to perform to the same standard on the clinical assessment of upper-extremity control. The lack of an association, however, implies that gross muscle activation capacity is not associated with coherence in the spontaneous activity across motor-related brain regions during resting wakefulness.
The combination of clinical measures used to quantify behavior in each domain of upper-extremity function accounts for 40% of the variance in somatomotor network connectivity. Semipartial correlations indicate that most of this variance is explained by upper-extremity control and real-world use. It should be noted that there are clinical measures of motor function other than those used in the current study. The measures used here were chosen because they are valid and reliable indexes in each domain of motor function in stroke patients. Although there is noise inherent to the clinical measures and the fMRI BOLD signal, a considerable amount of the variance in somatomotor network connectivity is explained by behavior. The findings reported here reaffirm the behavioral significance of endogenous brain activity following hemiparetic stroke and invite the possibility that behavior-based therapies can promote dynamic changes in resting-state connectivity.4,50
Footnotes
Acknowledgements
The authors thank Rebecca Birkenmeier, Brittany Hill, and Kristina Zinn for their assistance with the recruitment and transportation of participants.
Declaration of Conflicting Interests
The author(s) declared no potential conflicts of interest with respect to the research, authorship, and/or publication of this article.
Funding
The author(s) disclosed receipt of the following financial support for the research, authorship, and/or publication of this article: This study was supported by the National Institutes of Health (Grants T32HD007434 to MAU, R01HD068290 to CEL, and 5K08NS064365 to ARC).