
Abstract
Background. Acquired brain injuries (ABI) such as traumatic brain injury (TBI) or stroke can result in motor, language, or cognitive impairments. Although a considerable number of studies have investigated functional recovery, underlying brain reorganization remains poorly understood. Accumulating evidence indicates that plastic processes in the brain are linked to changes in electroencephalographic (EEG) slow wave activity (SWA) during deep sleep (EEG spectral power 1-4.5 Hz). Objective. We investigated sleep SWA in children and adolescents with ABI. Methods. We used high-density EEG (128 electrodes) to record sleep in 22 young patients with ABI (age range = 4-16 years). We compared patients to 52 previously measured typically developing children and adolescents (age range = 4-16 years). Results. The pattern of alterations in SWA differed between particular patient groups. In patients with bilateral stroke, SWA was globally reduced across the entire scalp. Patients with unilateral stroke showed a local reduction in SWA over lesion areas and an increase over perilesional and contralateral brain areas. In patients with severe TBI, we found a reduction in SWA over the midline and an increase over lateral brain areas. We found no consistent pattern in patients with mild to moderate TBI. Conclusions. Sleep SWA seems to be a sensitive measure to assess individual alterations in neural activity after ABI. Deviations from age norms might indirectly indicate plastic processes that have occurred since injury. Improving our understanding of neural activity after ABI could optimize clinical prognosis and guide the development of novel therapeutic interventions.
Introduction
Injuries of the brain, such as traumatic brain injury (TBI) or stroke, can result in various neurological impairments. In children and adolescents as well as in adults, acquired brain injuries (ABI) have been associated with impairments in motor function, language, and cognitive or emotional functioning.1-3 Although a considerable number of studies have investigated functional recovery, underlying brain reorganization remains poorly understood. It has been suggested that the extent to which functions can recover mainly depends on the degree of tissue damage, lesion localization, and the preservation of neuronal circuits engaging intact brain areas to restore function. 4 Recovery after smaller lesions is likely to involve perilesional areas, whereas contralateral areas become involved after larger injuries. 5 Brain reorganization is a plastic process. Neuroplasticity has been defined as the capacity of the nervous system to adapt its structure and function in response to intrinsic and extrinsic stimuli. Such plastic processes can occur during brain maturation and in relation to specific experiences (eg, learning). In the clinical context, plasticity can occur in response to disease or injury and in relation to therapy. 6
Increasing evidence indicates that plastic processes in the healthy brain are linked to changes in electroencephalographic (EEG) slow wave activity (SWA) during sleep (EEG spectral power 1-4.5 Hz; for a review, see Tononi and Cirelli 7 ). For instance, performing a visuomotor learning task prior to sleep induced a local increase in SWA during subsequent sleep over brain areas known to be involved in the learning task.8,9 Brain maturation has also been related to changes in sleep SWA. For example, changes in the amount of SWA have been suggested to reflect brain development, that is, the increase in cortical grey matter volume during childhood and its decrease during adolescence. 10 Inter-estingly, while grey matter maturation proceeds from occipital to frontal brain regions, 11 a similar pattern was found for the localization of maximal SWA (ie, from posterior brain regions during early childhood to anterior brain regions in late adolescence 12 ). Two studies have investigated SWA in adult patients with stroke.13,14 One study investigated group differences between acute patients and healthy controls, and the other study investigated longitudinal changes in chronic patients undergoing speech therapy. Both studies found local differences in SWA. Thus, SWA seems to be a sensitive measure to assess neural activity after ABI.
In the present study, we used high-density EEG to record sleep in children and adolescents with ABI. Our aim was to detect differences in SWA when comparing patients to typically developing children and adolescents of the same age. Such differences could reveal injury-related alterations in neural activity. Moreover, if we assume that patients would have shown typical age-dependent SWA patterns before brain injury, differences in SWA after brain injury might indirectly indicate plastic processes that have occurred since injury.
Material and Methods
Participants
Twenty-two pediatric patients with ABI were compared to 52 typically developing children and adolescents (age range = 4-16 years). Demographic and clinical characteristics of the patients are shown in Table 1. All patients were recruited shortly after admission at the Rehabilitation Center for Children and Adolescents in Affoltern am Albis (Switzerland) between March 2012 and October 2014. Parents gave written informed consent. Patients who were able to communicate gave verbal consent. The study was approved by the local ethics committee. The typically developing children and adolescents were previously assessed.12,15
Demographic and Clinical Characteristics of Patients With Acquired Brain Injury.
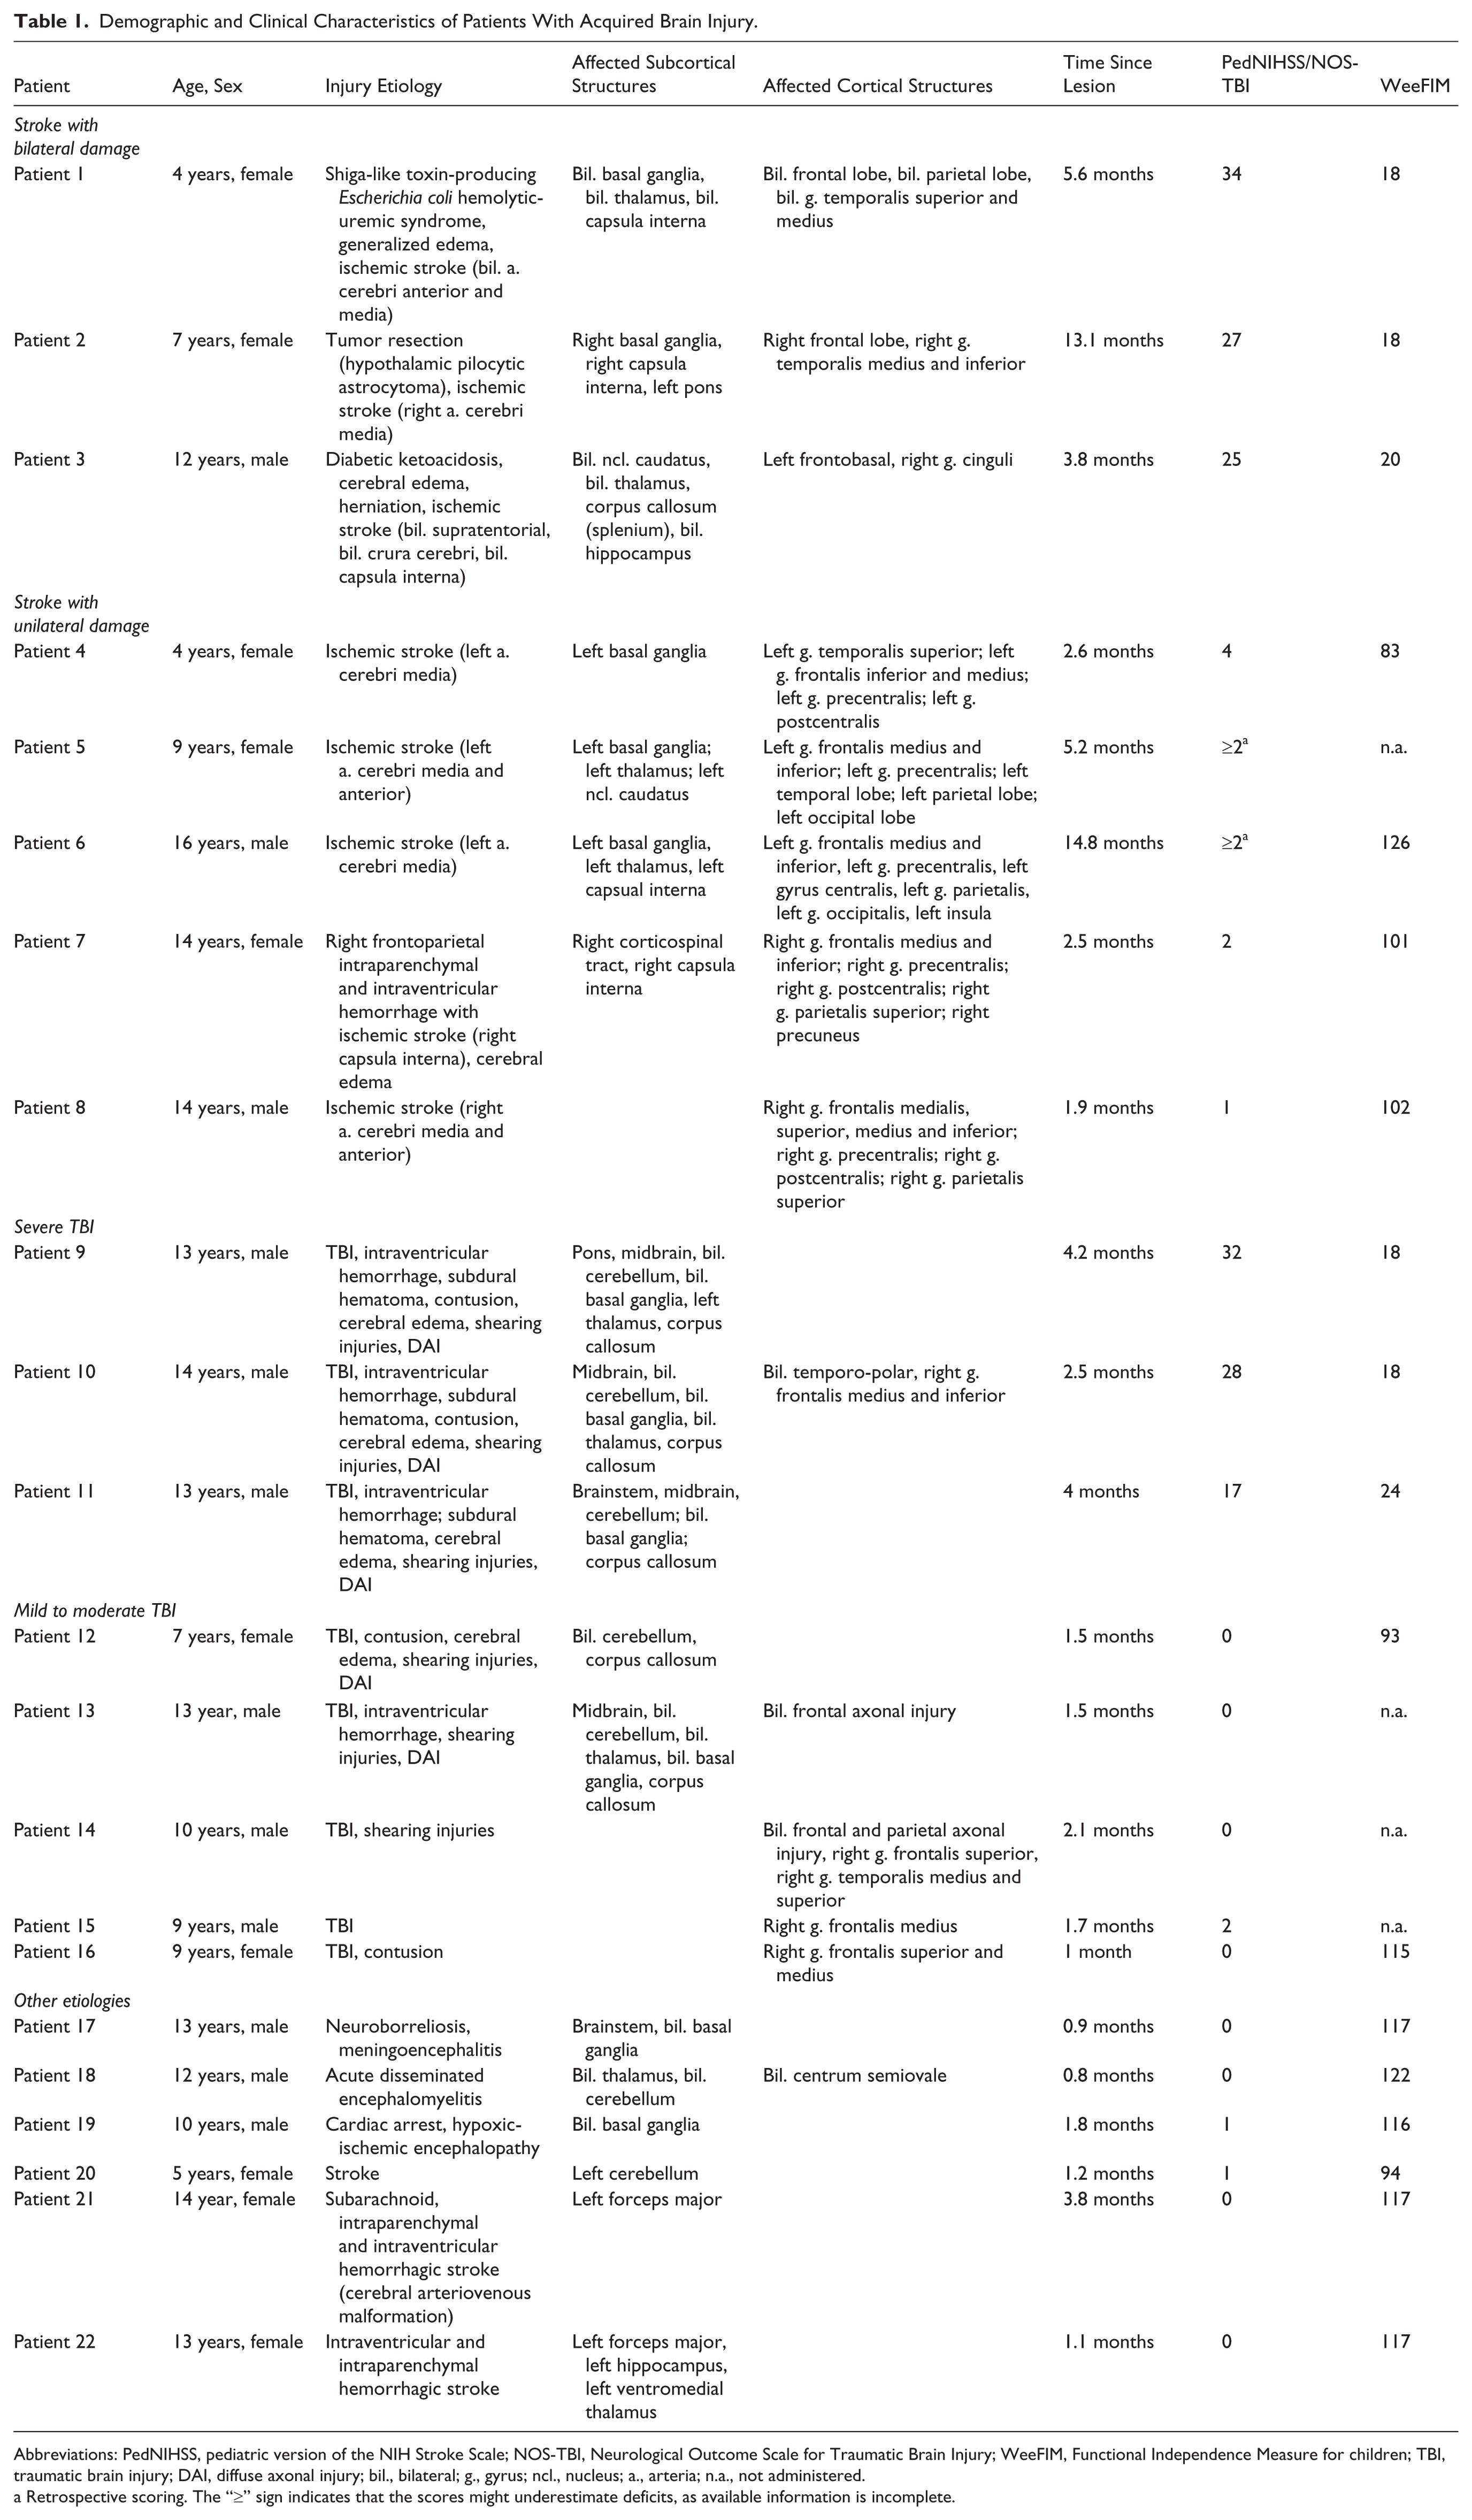
Abbreviations: PedNIHSS, pediatric version of the NIH Stroke Scale; NOS-TBI, Neurological Outcome Scale for Traumatic Brain Injury; WeeFIM, Functional Independence Measure for children; TBI, traumatic brain injury; DAI, diffuse axonal injury; bil., bilateral; g., gyrus; ncl., nucleus; a., arteria; n.a., not administered.
Retrospective scoring. The “≥” sign indicates that the scores might underestimate deficits, as available information is incomplete.
Assessment of Neurological Deficits and Functional Independence
Neurological deficits were assessed using the pediatric version of the NIH Stroke Scale (PedNIHSS 16 ) and the Neurological Outcome Scale for Traumatic Brain Injury (NOS-TBI17,18). Assessments were conducted 1 to 2 days prior to the night of the sleep recording. In 2 patients, assessments were missing (patients 5 and 6). We retrospectively scored them, based on available reports from therapists and pediatricians. High scores indicate severe deficits. The Functional Independence Measure for children (WeeFIM 19 ) assesses the need for assistance in daily life activities and was applied within 7 days before or after the sleep recordings. High scores indicate a high level of independence. All scores are listed in Table 1.
Localization of the Lesion Sites
In all patients, structural magnetic resonance imaging (MRI) scans (T1 and T2) were collected within 6 days after brain injury. The scans were assessed by clinical neuroradiologists at the respective children’s hospitals where patients were staying prior to rehabilitation. The clinical assessments of the scans are reported in Table 1. At the rehabilitation center, all scans were reinspected by an experienced pediatrician specialized in neurodisabilities (AM). Based on the MRI scans, reports from neuroradiologists and templates of vascular territories of the brain, 20 we assigned damaged cortical structures to electrode sites using a template that was provided by an earlier study. This template was based on the co-registration of high-density EEG electrode locations and individual MRI scans in a population of healthy children and adolescents. 21 We only considered cortical lesions covering the area of at least one electrode (ie, a diameter of 1 cm). We created topographical maps of the lesions using the topoplot function provided by the EEGLAB toolbox. 22 We categorized subcortical damage in “bilaterally present,” “unilaterally present,” or “absent” (manually colored). Patients were grouped according to injury etiology and lesion localization (Table 1).
High-Density EEG Recordings, Data Processing, and Analysis
Night sleep was recorded at the bedside. We used a high-density EEG system (Electrical Geodesics Inc, 128 electrodes; Eugene, OR). The net was well tolerated by all the patients. In one patient (patient 3), we had to abort the sleep recording after approximately 6 hours because of increasing agitation. This patient suffered from disorders of consciousness (ie, impaired awareness of the environment), a condition that is often accompanied by highly fragmented sleep. 23 Recordings were sampled at 500 Hz and referenced to the vertex (Cz). The recorded EEG data were then band-pass filtered between 0.5 and 40 Hz and down-sampled to 128 Hz. Epochs containing artefacts were semi-automatically and visually rejected. 24 Electrodes showing poor EEG signal quality were excluded. Data from all good-quality electrodes above the ears were average-referenced. Missing data from excluded electrodes were interpolated using spherical linear interpolation. 9 Sleep stages were visually determined based on American Academy of Sleep Medicine standard criteria (20-second epochs 25 ). EEG spectral power was calculated for 20-second epochs (fast Fourier transform routine, Hanning window, average over 5 consecutive 4-second epochs). SWA was calculated by summing up spectral power from 1 to 4.5 Hz. As sleep is often fragmented in children with ABI (for a review see Gagner et al 26 ), we selected 90 epochs of maximal SWA throughout the entire night instead of using the usual first 90 epochs (90 epochs = 30 minutes). For further analysis, we averaged SWA across the selected epochs. We mapped SWA across the scalp including all 109 electrodes located above the ears and investigated 2 distinct aspects: the amount of SWA and its relative distribution over the scalp. We used the same procedure in typically developing children and adolescents to obtain comparable results.
Amount of SWA
We used absolute SWA values as a proxy of neural activity at each electrode in patients and typically developing children and adolescents. Absolute SWA values were log-transformed to assure normal distribution.
SWA Topography
To display the scalp distribution of SWA irrespective of the overall amount of SWA, we used relative SWA values. As previously done, we divided SWA values at each electrode by the average across all 109 electrodes. 12 Our goal was to detect differences in “Amount of SWA” and in “SWA Topography” when comparing patients with ABI to typically developing children and adolescents of the same age. To do so, we established norm values for different age groups: 4 to 7 years (n = 10), 8 to 10 years (n = 11), 11 to 13 years (n = 16), 14 to 16 years (n = 15). These norm values were based on group averages and variabilities.
Group Average
For each electrode, we calculated the average “Amount of SWA” (absolute values, see above) and the average “SWA Topography” (relative values, see above) across typically developing children and adolescents of the same age group.
Group Variability
Still within the determined age groups, we calculated standard deviations (SD) for “Amount of SWA” and “SWA Topography.” In a next step, we quantified deviations from age norms for all patients with ABI.
Deviations From Age Norms
For each electrode, we subtracted the respective group average from the patient’s individual value and divided this difference by the group’s SD (ie, [individual value − group average]/group SD). Values above or below 2.5 SD were defined as significant deviations. In a last step, we investigated whether significant deviations from age norms in “Amount of SWA” and in “SWA Topography” are suitable markers for changes in neural activity after ABI. To this end, we quantified overall deviation in “Amount of SWA” and in “SWA Topography.”
Overall Deviation
We summed up all electrodes showing a significant deviation from the age norm. For the “Amount of SWA” we used negative and positive values to indicate an overall reduction and an overall increase, respectively. We then performed a Receiver Operating Characteristic (ROC) curve analysis to evaluate sensitivity and specificity of overall deviation in “Amount of SWA” and in “SWA Topography.” Finally, we performed a binary logistic regression to estimate the predictive value of combined overall deviations in “SWA Topography” and in “Amount of SWA” with respect to the categorization into patients or typically developing children and adolescents. The forced entry method was applied. The Hosmer-Lemeshow statistic was used to determine the goodness of the fit (P < .05 indicating that the model should be rejected). Nagelkerke’s R 2 and the overall accuracy of classification were used as measures for the predictive power of the model. Significant contributions of the 2 predictive deviations in variables (“SWA Topography” and “Amount of SWA”) were determined based on the χ2 statistic (P < .05). All statistical tests were performed using SPSS (IBM SPSS Statistics).
Results
Lesion Sites
We localized damaged cortical and subcortical structures and determined lesion topographies (Table 1; Figures 2-4: 1st column). As expected, lesions were variable in size and location.
Sleep Structure
Sleep structure differed between patients with ABI and typically developing children and adolescents (Supplementary Table 1). As expected from previous literature, sleep was more fragmented in patients with ABI (ie, higher amount of wake after sleep onset). 26 We did not perform any further analysis on the structure of sleep, since our main interest was to investigate changes in SWA. We focused on 2 aspects of SWA: the “Amount of SWA” and the “SWA Topography” (see Methods for details).
Norm Values From Typically Developing Children and Adolescents
In a first step, we investigated the “Amount of SWA” and the “SWA Topography” in typically developing children and adolescents. We determined group averages and group variabilities for all age groups. Figure 1 shows the results for “SWA Topography.” Looking at group averages we found the expected changes across development: From early childhood to late adolescence, the location of maximal values in “SWA Topography” shifted from posterior toward anterior brain areas (for details, see Kurth et al 12 ). When looking at group variability, we found a similar topographical pattern. In other words, the variability in “SWA Topography” was highest in areas with maximal “SWA Topography” values. The findings in “Amount of SWA” were similar (Supplementary Figure 1).
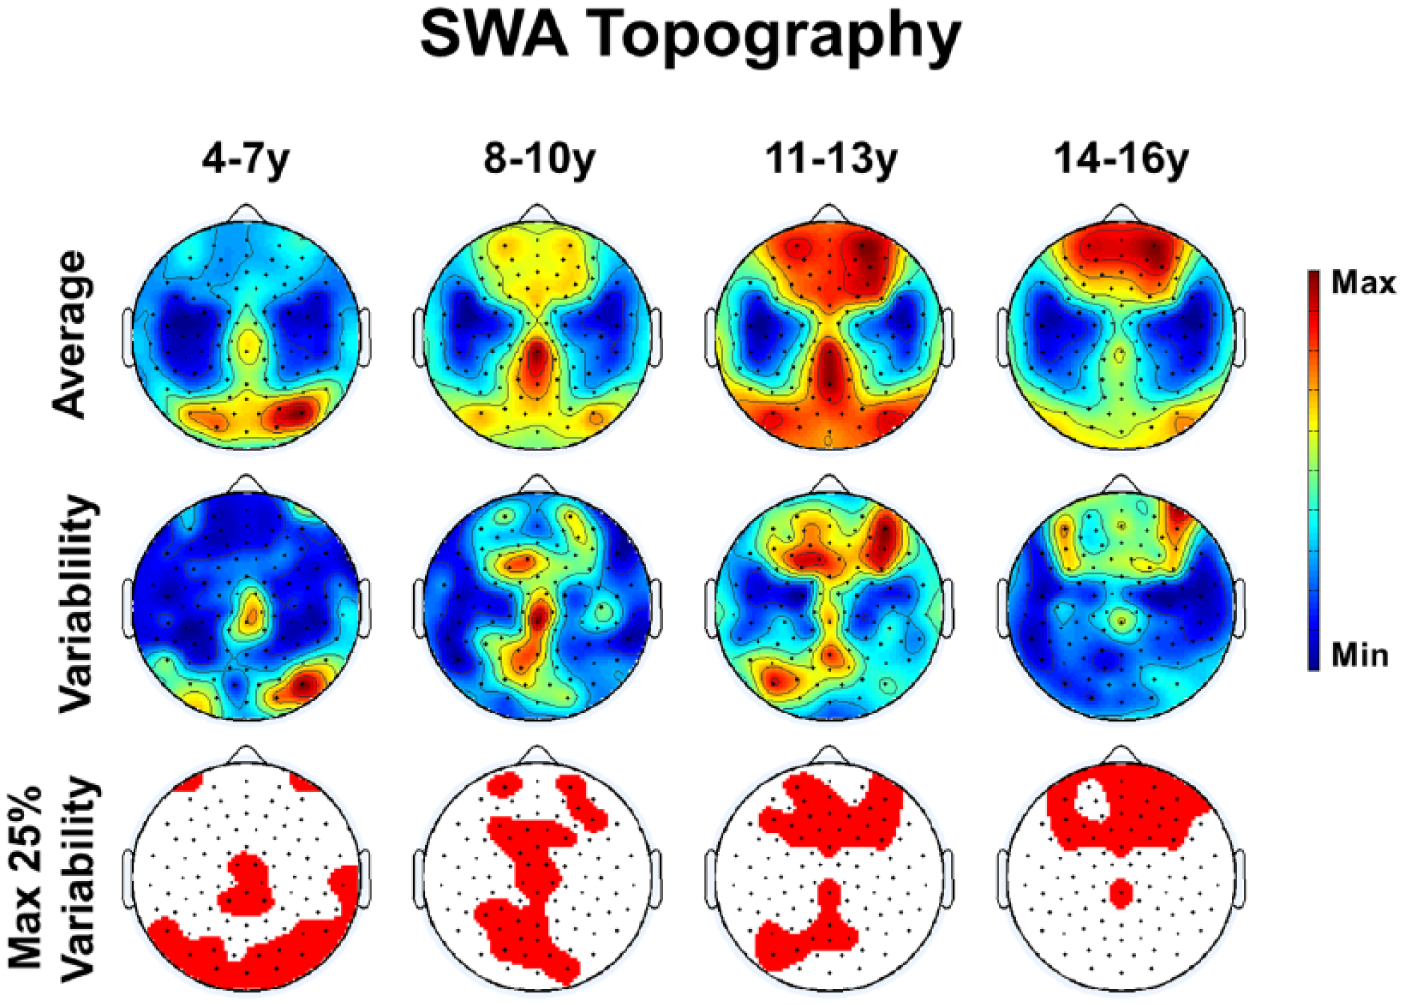
Results for typically developing children and adolescents: “SWA Topography” group average (top row) and group variability (middle row). Maximal values are indicated in red, minimal values in blue. Red areas mark the top 25% values in variability (bottom row).
Deviations From Age Norms in Patients With Acquired Brain Injury
In a next step, we investigated “SWA Topography” and “Amount of SWA” in patients with ABI. We found both age-specific and lesion-related aspects (“SWA Topography” shown in Figure 2-4, 2nd column). We determined individual deviations from age norms (deviations in “SWA Topography” shown in Figure 2-4, third column) to quantify lesion-related changes, when controlling for age-specific patterns. Significant deviations (above/below 2.5 SD; see Methods for details) are highlighted for “SWA Topography” (Figures 2-4, 4th column) and for “Amount of SWA” (Figure 2-4, 5th column). For comparison, deviations from age norms in typically developing children and adolescents are shown in Supplementary Figure 2.
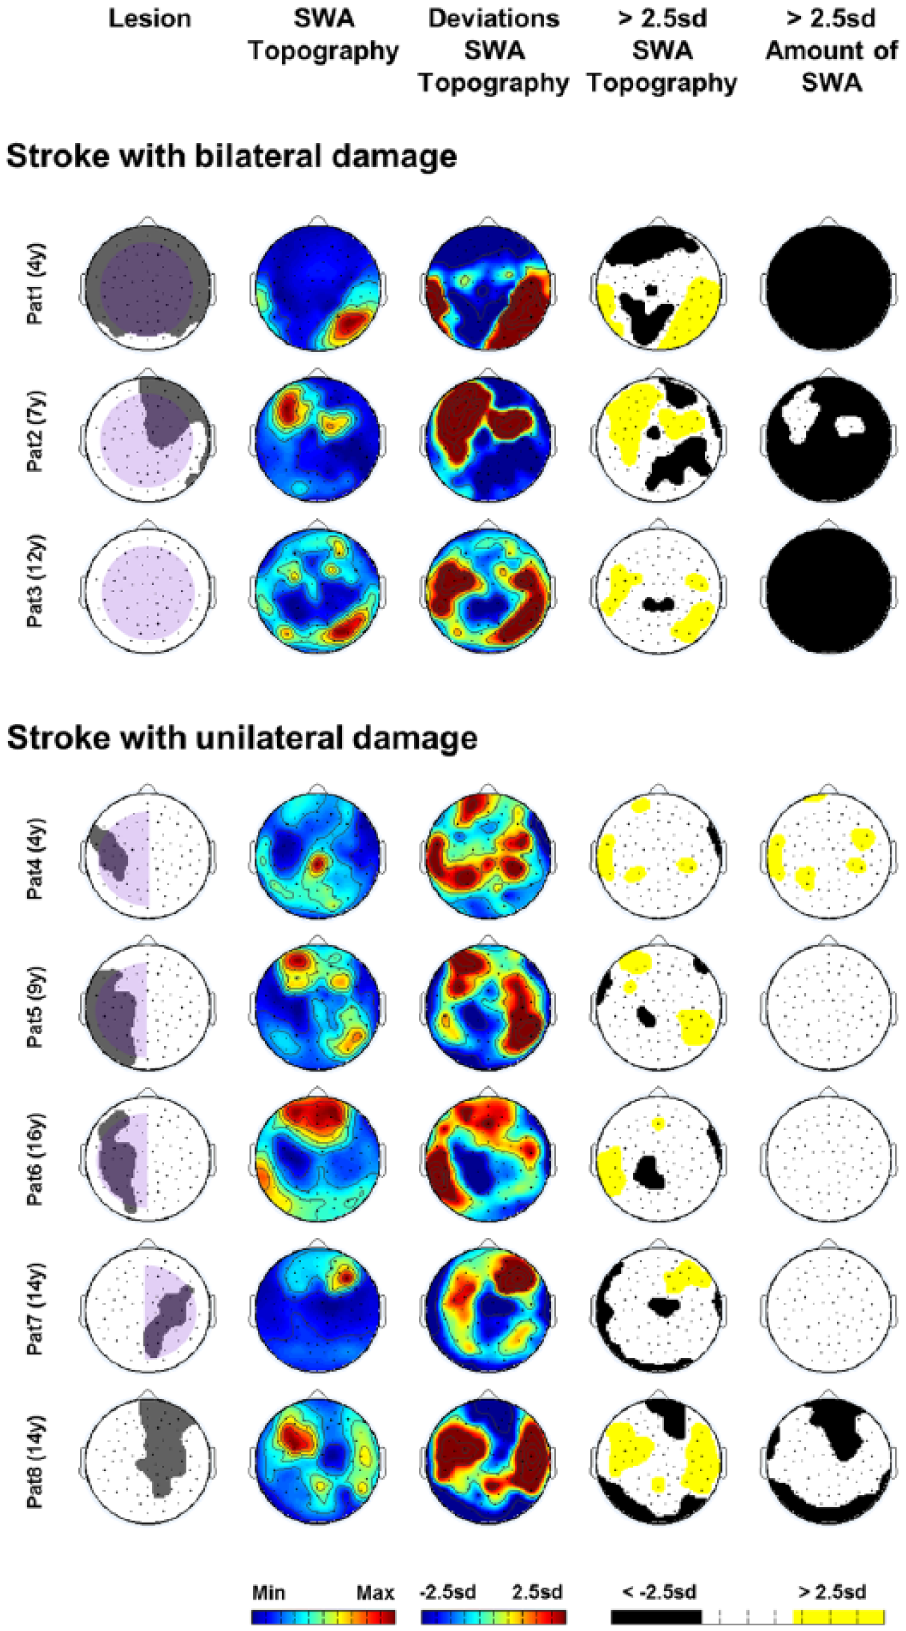
Results for patients with stroke: cortical (grey) and subcortical (pale purple) lesion sites (1st column), “SWA Topography” (2nd column: maximal values in red, minimal values in blue), deviations from age norms (3rd column), significant deviations in “SWA Topography” and in “Amount of SWA” (ie, above/below 2.5 SD; 4th and 5th columns).
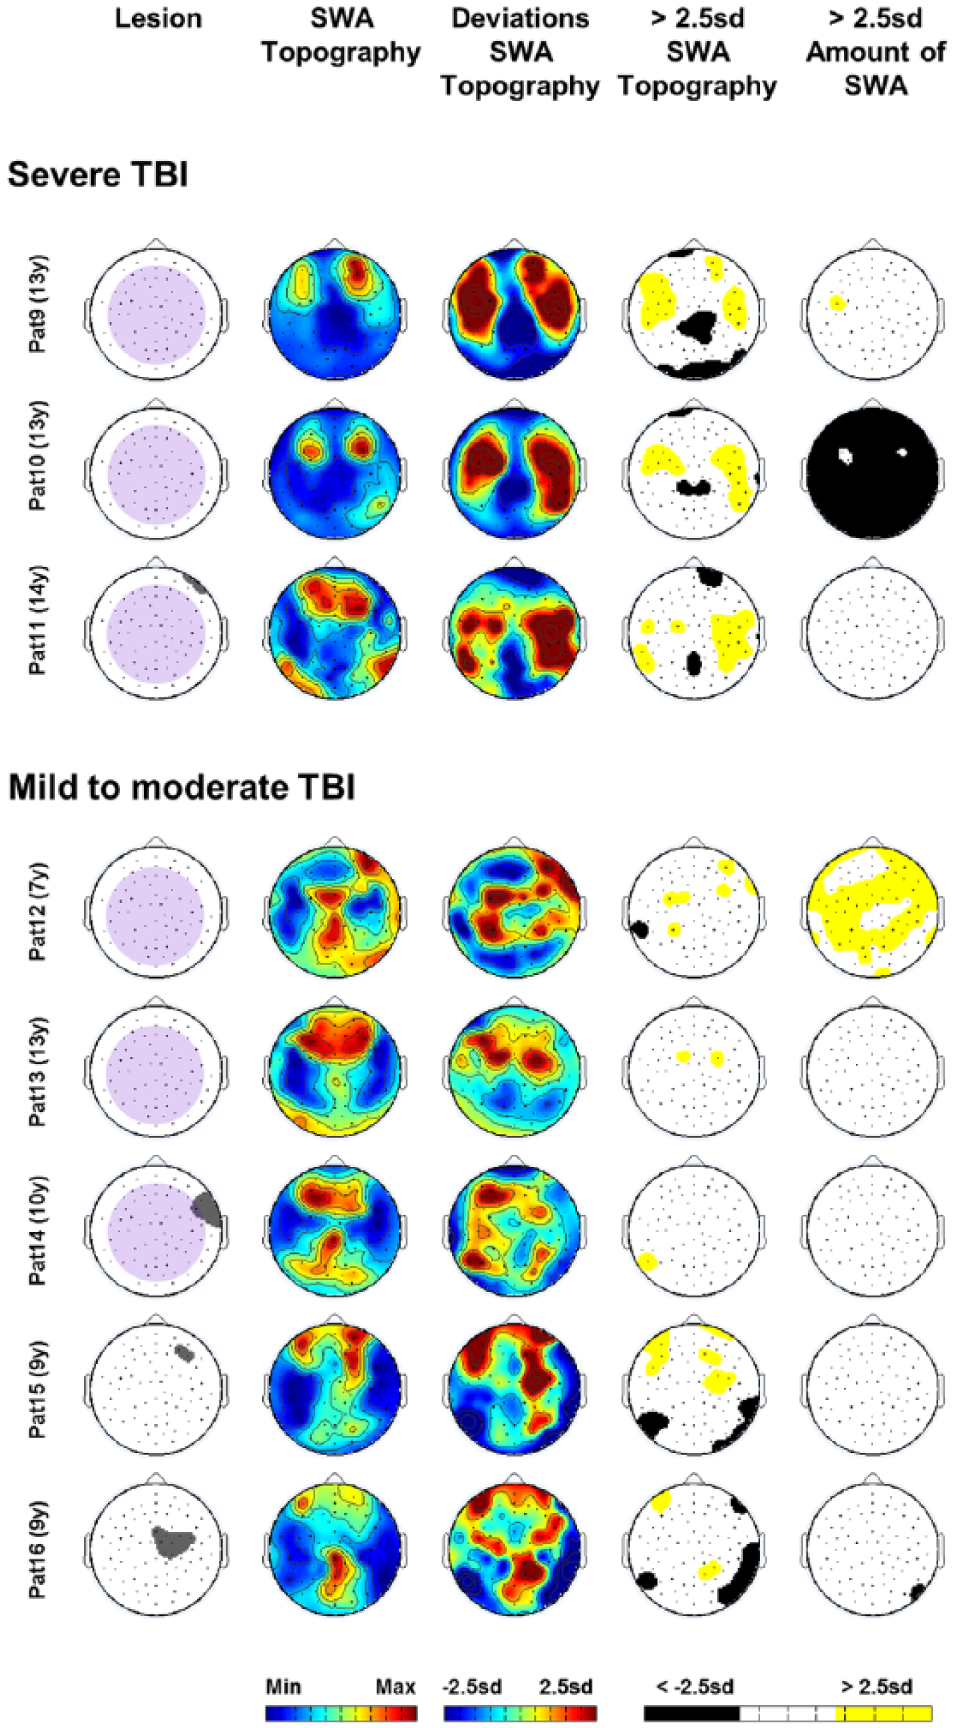
Results for patients with TBI: cortical (grey) and subcortical (pale purple) lesion sites (1st column), “SWA Topography” (2nd column: maximal values in red, minimal values in blue), deviations from age norms (3rd column), significant deviations in “SWA Topography” and in “Amount of SWA” (ie, above/below 2.5 SD; 4th and 5th columns).
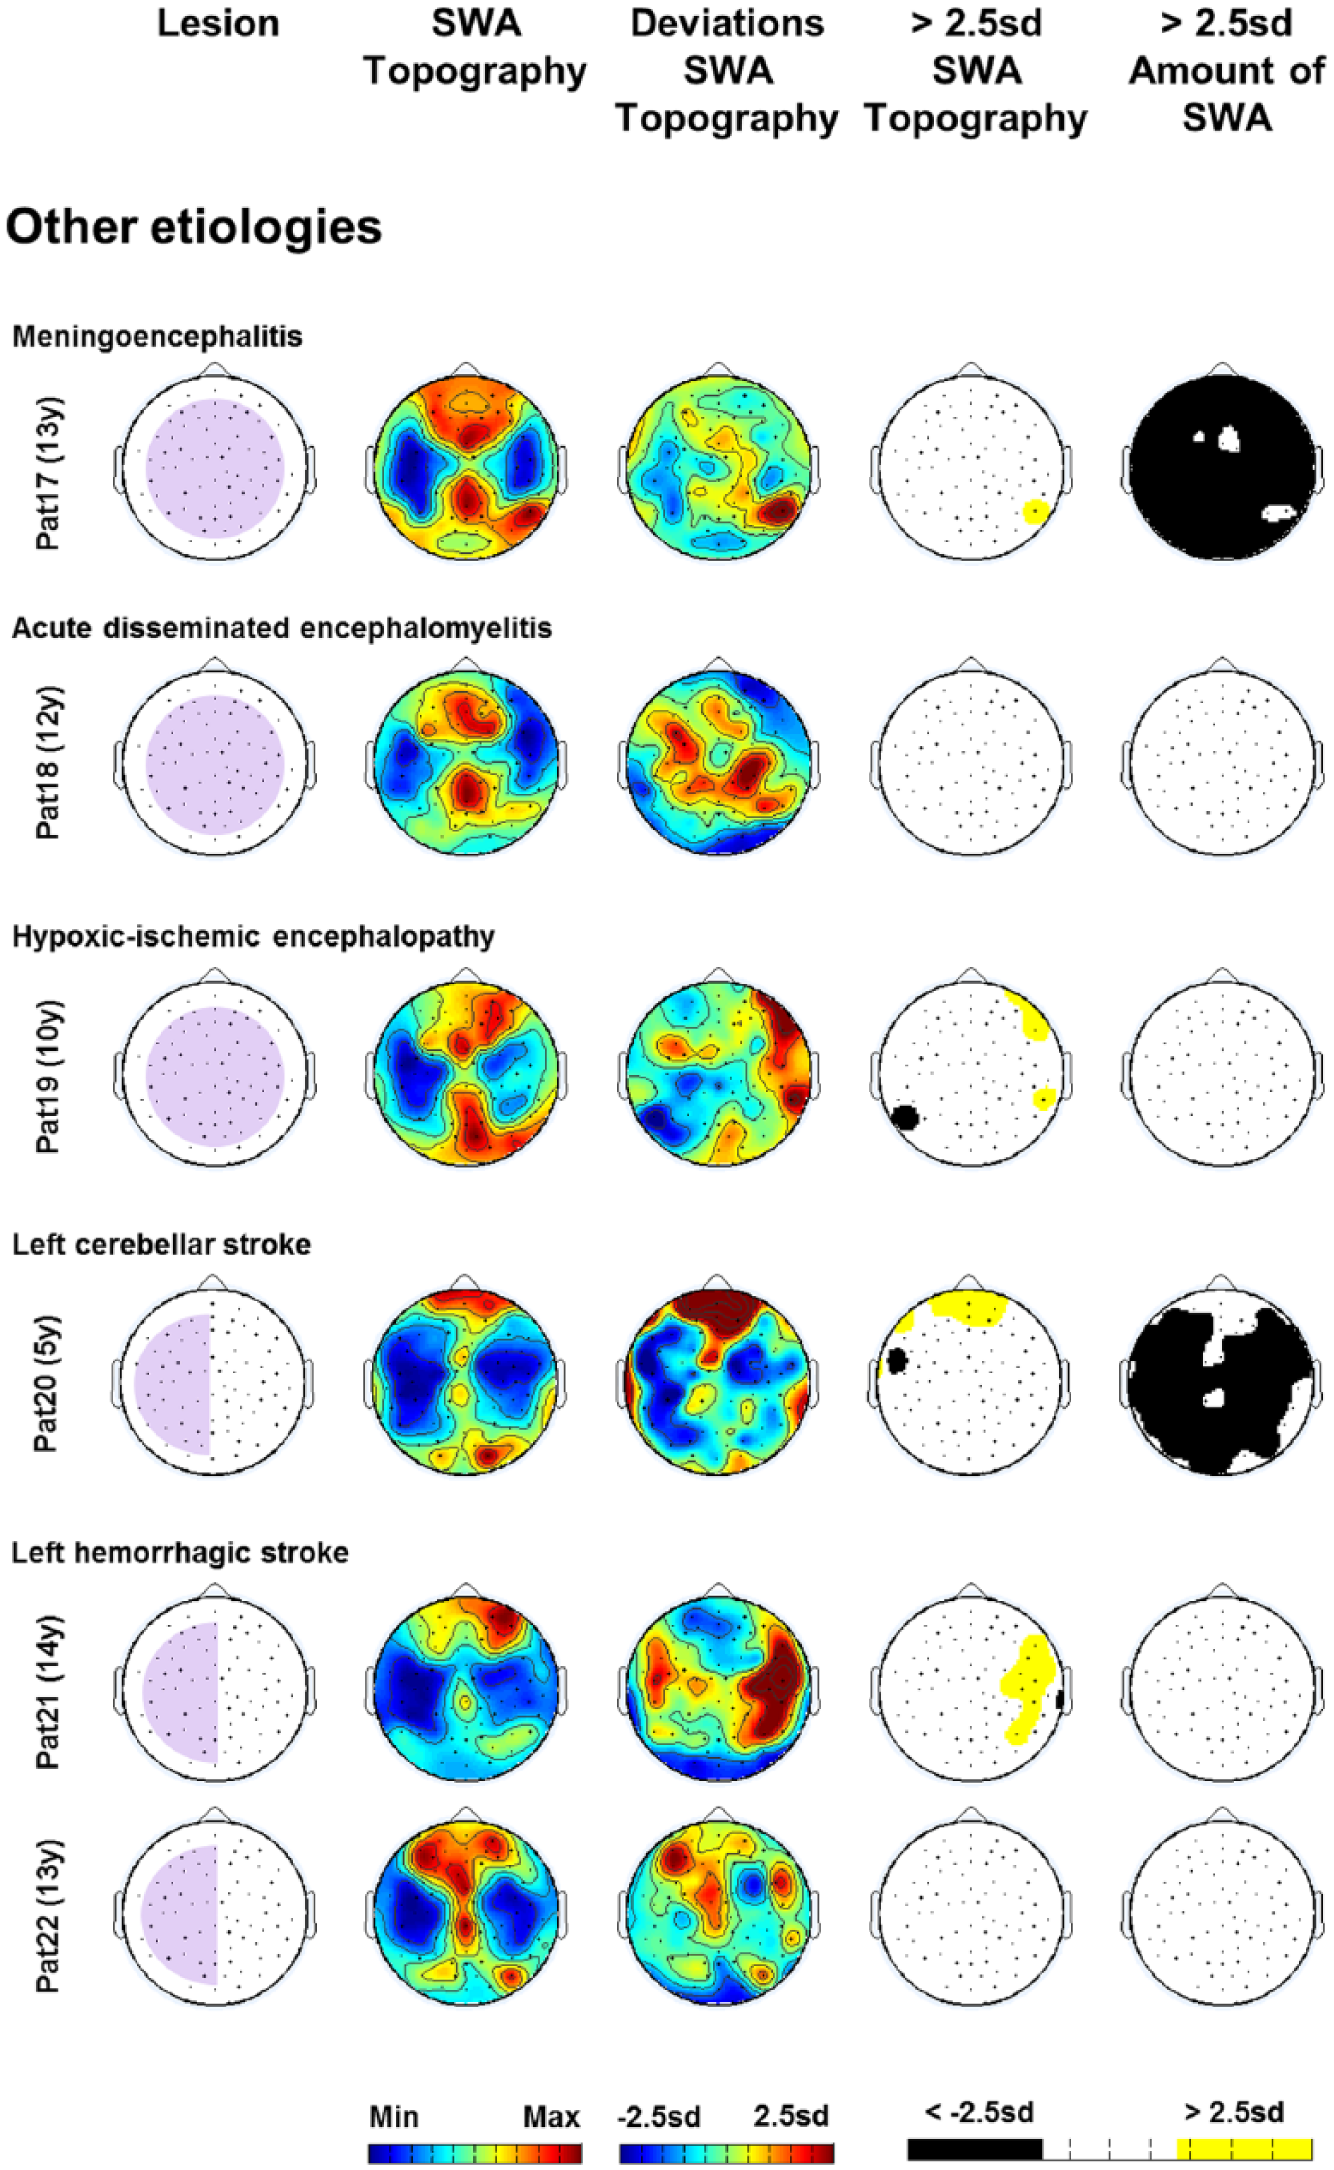
Results for patients with other injury etiologies: subcortical (pale purple) lesion sites (1st column), “SWA Topography” (2nd column: maximal values in red, minimal values in blue), deviations from age norms (3rd column), significant deviations in “SWA Topography” and in “Amount of SWA” (ie, above/below 2.5 SD; 4th and 5th columns).
Patients With Stroke
In patients with bilateral hemispheric stroke (PedNIHSS scores 25-35), “SWA Topography” was extensively altered (Figure 2, 3rd and 4th columns, patients 1-3), and “Amount of SWA” was globally reduced across the entire scalp (Figure 2, 5th column, patients 1-3). Patients with unilateral hemispheric stroke (PedNIHSS scores 1-4) showed a reduction in “SWA Topography” over lesion areas as well as over distant areas, which were mostly located in the contralateral hemisphere. We also found an increase in “SWA Topography” over perilesional and contralateral brain areas (Figure 2, 3rd and 4th columns, patients 4-8). We found no specific pattern for the deviations in “Amount of SWA” (Figure 2, 5th column, patients 4-8).
Patients With Traumatic Brain Injury
In patients with severe TBI (NOS-TBI scores 17-32), we found a reduction in “SWA Topography” over the midline and an increase over lateral brain areas (Figure 3, 3rd and 4th columns, patients 9-11). Deviations in “Amount of SWA” were not uniform. In patients with mild to moderate TBI (NOS-TBI scores 0-2), we found no consistent pattern, either for “SWA Topography” (Figure 3, 3rd and 4th columns, patients 12-16) or for “Amount of SWA” (Figure 3, 5th column, patients 12-16).
Individual Patients With Other Injury Etiologies
Patient 17 (meningoencephalitis, PedNIHSS score 0) showed an almost entirely preserved “SWA Topography” (Figure 4, 3rd and 4th columns) while “Amount of SWA” was globally reduced (Figure 4, 5th column). Patient 18 (acute disseminated encephalomyelitis, PedNIHSS score 0) showed no significant alterations either in “SWA Topography” or in “Amount of SWA” (Figure 4, 3rd, 4th, and 5th columns). In patient 19 (hypoxic-ischemic encephalopathy, PedNIHSS score 1), we found a few distributed alterations in “SWA Topography” across the scalp (Figure 4, 3rd and 4th columns) but no significant alteration in “Amount of SWA” (Figure 4, 5th column). In patient 20 (left cerebellar stroke, PedNIHSS score 1), we found alterations in “SWA Topography” over frontal brain areas (Figure 4, 3rd and 4th columns) and an extensive bilateral reduction in “Amount of SWA” (Figure 4, 5th column). In patients 21 and 22 (hemorrhagic stroke, PedNIHSS scores 0), we found an increase in “SWA Topography” over contralesional lateral brain areas for patient 21 (Figure 4, 3rd and 4th columns) and no significant alterations in “SWA Topography” for patient 22 (Figure 4, 3rd and 4th columns). Both patients showed no significant alterations in “Amount of SWA” (Figure 4, 5th column).
Overall Deviations in “Amount of SWA” and in “SWA Topography”
Finally, we combined the results of the overall deviations in “SWA Topography” and “Amount of SWA” (see Methods for details). This approach allowed us to determine a patient’s individual distance from age norms along these 2 dimensions (Figure 5; see also Supplementary Figure 3 for overall deviations in typically developing children and adolescents).
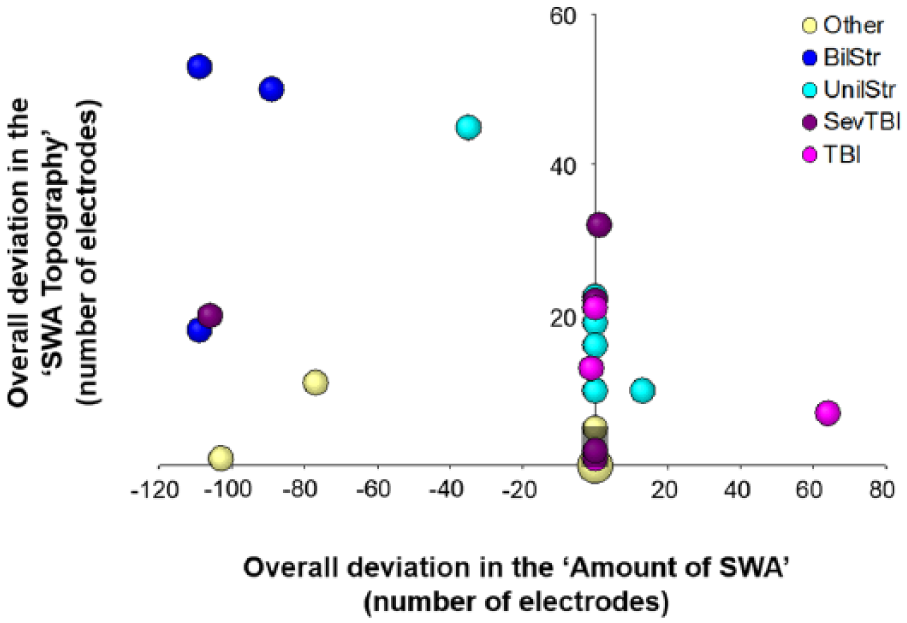
Patient’s overall deviation in “Amount of SWA” (x-axis) and in “SWA Topography” (y-axis). Etiology groups are color-coded: TBI, severe TBI (SevTBI), stroke with unilateral (UnilStr), or bilateral damage (BilStr), Other. The shaded area represents the 95th percentiles for typically developing children and adolescents (“Amount of SWA”: 0; “SWA Topography”: 5). The size of the bubbles represents the number of patients. Please note that only for one bubble (coordinates: 0, 0), 2 patients were included.
When investigating how well overall deviations in “SWA Topography” and in “Amount of SWA” could distinguish between patients and typically developing children and adolescents, ROC analyses indicated that classification is above chance (significant areas under the curve [AUC] for the “Amount of SWA” [AUC = 0.743, P = .001] and “SWA Topography” [AUC = 0.893, P < .001]). The cutoff values that could distinguish best (ie, with best summarized sensitivity and specificity, calculated using the Youden Index) were 0.5 for “Amount of SWA” (sensitivity = 0.50, specificity = 0.98) and 4.5 for “SWA Topography” (sensitivity = 0.77, specificity = 0.96). In other words, an overall deviation in “Amount of SWA” in one electrode or more was highly specific for patients with ABI (ie, rarely present in typically developing children and adolescents), but less sensitive (ie, not only the typically developing children but also many patients showed no deviations; ie, zero electrodes). We also performed ROC analyses for the different patient groups. Patients with stroke: “Amount of SWA” (AUC = 0.809, P = .005; cutoff = 7.5, sensitivity = 0.63, specificity = 1), “SWA Topography” (AUC = 0.999, P < .001; cutoff = 9, sensitivity = 1, specificity = 0.98). Patients with TBI: “Amount of SWA” (AUC = 0.740, P = .03; cutoff = 0.5, sensitivity = 0.5, specificity = 0.98), “SWA Topography” (AUC = 0.931, P < .001; cutoff = 1.5, sensitivity = 0.88, specificity = 0.79). We did not perform an individual ROC analysis for patients with various injury etiologies since they do not actually represent a specific patient group but a group of residual single cases belonging neither to the stroke group nor to the TBI group.
The results of the binary logistic regression showed a good fit of the model (Hosmer-Lemeshow’s P = .96) and a good predictive power (Nagelkerke’s R 2 = 0.727, overall accuracy of classification = 92%). Overall deviations in “SWA Topography” and in “Amount of SWA” both significantly contributed to the model (P < .001). This implies that the 2 variables provide complementary information to classify patients.
Discussion
In the present study, we propose a novel approach to investigate neural activity after ABI. We analyzed the “Amount of SWA” and “SWA Topography” in pediatric patients with ABI and determined deviations from age norms. The patterns of these deviations differed between particular patient groups.
Patients With Stroke
In patients with bilateral damage, we found an overall reduction in “Amount of SWA” and global changes in “SWA Topography.” This might reflect a general impairment of brain function presumably related to the observed severe neurological deficits (ie, high PedNIHSS total scores). In patients with unilateral damage, we found a local reduction in “SWA Topography” over lesion areas, which might reflect a local impairment of brain function related to selective neurological deficits (ie, low PedNIHSS total scores). The intriguing finding that also distant brain areas showed a reduction in “SWA Topography” might be explained in the context of diaschisis. Diaschisis has been defined as neural underactivity in anatomically intact distant brain areas, directly caused by a focal injury. 27 The lack of synaptic input from the lesion area is assumed to result in a loss of excitability also referred to as “functional stillstand.” 28 According to Carrera and Tononi, 27 diaschisis should tend to disappear over time. However, we found a persistent diaschisis-like pattern in all patients with unilateral damage. Four of them were in a subacute stage and one in chronic stage. To our knowledge, diaschisis has never been investigated during sleep; thus, we cannot differentiate between the possibility that our findings depend on the pediatric patient population or on the sleep condition. Besides areas of local reduction in “SWA Topography,” patients with unilateral damage also showed local increases in “SWA Topography,” mainly over perilesional and contralateral brain areas. Those areas are known to play a crucial role in functional recovery after stroke. 5 We suggest that increased SWA may indicate highly active brain areas. Going one step further, we hypothesize that these highly active areas might be indirectly related to brain reorganization. We base this hypothesis on the assumption that patients would have shown typical age-dependent SWA patterns before brain injury. Thus, deviations from the age norm pattern might indirectly reflect plastic changes resulting from brain injury.
Patients with severe TBI showed strikingly similar alterations in their “SWA Topographies.” They all showed a reduction over the midline and an increase over lateral brain areas. This pattern is likely to result from impaired connections between specific brain areas caused by axonal lesions as none of the patients with severe TBI showed cortical damages over the midline. Impaired connections could have led to a reduction in synaptic transmission, which could be a possible explanation for the observed reduction in SWA.
Patients with mild to moderate TBI showed a highly variable pattern of alterations in “SWA Topography.” This is not surprising, given the large variety of lesions. Currently, many aspects of how TBI affects structural and functional networks and how such alterations are related to neurological deficits remain unclear. Multimodal approaches, combining structural and functional information, could improve this understanding.29-32
Single Case
Patient 20 represents an interesting single case in which unilateral left cerebellar stroke resulted in an extensive bilateral reduction in “Amount of SWA” and changes in “SWA Topography.” The loss of cerebellar synaptic input seems to affect both global as well as region-specific neural activity. These bilateral effects are in agreement with previous studies. Unilateral cerebellar stroke has been related to bilaterally impaired excitability in primary motor areas. 33 In monkeys, left cerebellar stimulation induced bilateral responses in the sensori-motor, temporal, and parietal cortex. 34 Results from other patients were less conclusive but still indicated deviations from age norms in most of the cases.
Overall deviations in “Amount of SWA” and in “SWA Topography” appear to be sensitive and specific measures to detect injury-related alterations in neural activity, especially in patients with stroke and TBI.
The novelty of our approach is that unlike the 2 previous studies in adult stroke patients,13,14 we determined alterations in SWA at the single-subject level instead of performing group comparisons. We consider our approach to be the preferable choice when investigating heterogeneous patient groups such as the present group of children and adolescents with ABI (ie, different states of brain maturation and different injuries). Moreover, it provides the possibility to investigate principles of alteration in neural activity even in single cases (eg, patient 20 with unilateral cerebellar stroke).
Our study also has some limitations. We hypothesize that deviations in SWA may indirectly indicate plastic processes induced after brain injury. In this context, increased SWA would indicate neural reorganization related to functional recovery. However, increased SWA might also be due to diffuse overactivity that is unrelated to functional recovery.35,36 Longitudinal measurements in the course of rehabilitation therapy could directly follow-up neural reorganization in individual patients. The yet missing link between neural reorganization and functional recovery could also be addressed in this context. Another point of concern is the small number of patients and the heterogeneity of the group. While our approach specifically aims at minimizing age-related differences, it is not possible to control for lesion-related factors (eg, size and site of the lesion). Nevertheless, even in this rather small and heterogeneous data set, we found convincing similarities for specific patient groups. Moreover, the results from the group with unilateral stroke are well in line with results from previous adult studies using positron emission tomography (PET) or functional magnetic resonance imaging (fMRI) to investigate brain reorganization after stroke. For example, increased activity in perilesional and contralesional brain areas is a highly consistent finding (for a review, see Grefkes and Ward 35 ) and matches our increased SWA over these brain areas. Thus, from a methodological point of view, sleep EEG recordings seem to be a suitable method to investigate brain activity in children with ABI. However, further studies including a larger number of patients are needed to confirm these rather preliminary findings. A methodological limitation concerns the lesion localization. We did not use a neuronavigation system. Thus, electrode positions were not co-registered with the patient’s individual MRI scans. Instead, we used a template provided by an earlier study in healthy children and adolescents. 21 Moreover, only one assessor inspected the patient’s MRI scans and assigned cortical lesions to electrode sites. A second evaluation by another assessor might have improved accuracy. However, since the main objective of the present study was to investigate topographical patterns of EEG activity, we think that an approximate localization of the lesion is acceptable.
In the present study, we specifically investigated whether the prominent hypothesis that plastic processes in the brain are related to changes in sleep SWA 7 also applies to the clinical context of brain reorganization. Thus, we focused our analysis on the SWA frequency domain.
Potential clinical implications from our study are that high-density EEG recordings during sleep could be used to assess alterations in neural activity in individual children and adolescents with ABI. Moreover, SWA has been suggested to actively contribute to synaptic plasticity. 7 Consequently, an increase in SWA over specific brain areas might precede functional recovery. In other words, SWA could provide useful prognostic information. Knowing which brain areas are crucial for the recovery of specific functions could also provide a basis for novel therapeutic interventions such as targeting specific brain areas with, for example, transcranial direct current or repetitive transcranial magnetic stimulation (see Chung and Lo 37 for a review about the application of those methods in pediatric patients). However, at this point, clinical implications remain hypothetical. Larger studies would be needed to confirm them. Larger samples would also offer the possibility to perform analysis beyond our hypothesis-driven approach. Such analysis could include other frequency domains.
Conclusions
This is the first study investigating neural activity in children and adolescents with ABI by means of high-density EEG recordings during sleep. Such recordings are easy to apply in the clinical setting, also in critically ill and noncooperative patients. Sleep SWA seems to be a sensitive measure to assess individual alterations in neural activity after ABI. Deviations from age norms might indirectly indicate plastic processes that have occurred since injury. In a next step, the method could be used to follow-up brain reorganization in the course of rehabilitation. Functional measurements such as sleep recordings could complement structural information provided by MRI. Improving our understanding of neural activity after ABI could not only assist clinical diagnosis and prognosis but may also guide the development of novel therapeutic interventions.
Footnotes
Acknowledgements
The authors thank the nurses and the physicians of the Rehabilitation Center for Children and Adolescents in Affoltern am Albis for their support and all the patients and families for their participation. The authors also thank Bigna Bölsterli for reviewing the article.
Declaration of Conflicting Interests
The authors declared no potential conflicts of interest with respect to the research, authorship, and/or publication of this article.
Funding
The authors disclosed receipt of the following financial support for the research, authorship, and/or publication of this article: This work was supported by the Anna-Müller Grocholski Foundation, the Mäxi Foundation, the Swiss National Science Foundation (Grant P00P3-135438), and the Clinical Research Priority Program “Sleep and Health” of the University of Zurich.
References
Supplementary Material
Please find the following supplemental material available below.
For Open Access articles published under a Creative Commons License, all supplemental material carries the same license as the article it is associated with.
For non-Open Access articles published, all supplemental material carries a non-exclusive license, and permission requests for re-use of supplemental material or any part of supplemental material shall be sent directly to the copyright owner as specified in the copyright notice associated with the article.