
Abstract
Background. Objective measurement of plastic brain changes induced by a novel rehabilitative approach is a key requirement for validating its biological rationale linking the potential therapeutic gains to the changes in brain physiology. Objective. Based on an emerging notion linking cortical plastic changes to EEG sleep slow-wave activity (SWA) regulation, we aimed to assess the acute plastic changes induced by an imitation-based speech therapy in individuals with aphasia by comparing sleep SWA changes before and after therapy. Methods. A total of 13 left-hemispheric stroke patients underwent language assessment with the Western Aphasia Battery (WAB) before and after 2 consecutive high-density (hd) EEG sleep recordings interleaved by a daytime session of imitation-based speech therapy (Intensive Mouth Imitation and Talking for Aphasia Therapeutic Effects [IMITATE]). This protocol is thought to stimulate bilateral connections between the inferior parietal lobule and the ventral premotor areas. Results. A single exposure to IMITATE resulted in increases in local EEG SWA during subsequent sleep over the same regions predicted by the therapeutic rationale, particularly over the right hemisphere (unaffected by the lesion). Furthermore, changes in SWA over the left-precentral areas predicted changes in WAB repetition scores in our group, supporting the role of perilesional areas in predicting positive functional responses. Conclusions. Our results suggest that SWA changes occurring in brain areas activated during imitation-based aphasia therapy may reflect the acute plastic changes induced by this intervention. Further testing will be needed to evaluate SWA as a non-invasive assessment of changes induced by the therapy and as a predictor of positive long-term clinical outcome.
Introduction
About a third of patients suffering from ischemic stroke have speech and language problems at the onset, and more than half of these have persistent aphasia, accompanied by its marked physical and social consequences.1,2
Depending on individual factors (eg, the extent of neural tissue spared by the lesion in functional networks involved in speech and language production and comprehension), aphasic patients may undergo some degree of spontaneous recovery, which can be fostered by rehabilitative therapy. 3
Classically, behavioral treatment of nonfluent aphasia has focused on speech production, therefore relying on an intrinsically impaired domain in these patients. This approach has often yielded minimal clinical benefits. 4 More recently, neuroimaging studies have revealed that the same brain areas implicated in impaired speech production are also involved in speech perception and observation, 5 thus paving the road for a conceptually new approach to nonfluent aphasia rehabilitation.
Along these lines, a new computer-based therapy, the Intensive Mouth Imitation and Talking for Aphasia Therapeutic Effects (IMITATE) has been recently proposed. 6 IMITATE is an intensive protocol based on action observation and imitation, which are thought to activate the brain circuits underlying action execution in the observer, even without explicit motor output.7,8 Imitation has historically played an important role in many treatments for aphasia, 9 with the rationale that sensory input complements other available information for the benefit of oral speech mechanisms. Interestingly, speech imitation is associated with bilateral connections between the inferior parietal lobule and the ventral premotor areas. 10 Therefore, facilitating the complex interaction between these brain areas may contribute to the cortical synaptic plastic changes underlying functional recovery in aphasia. 11
The ability to measure objectively such plastic changes in individuals undergoing rehabilitative protocols is a key requirement for validating the neurobiological basis of the therapeutic rationale as well as for linking the potential behavioral gains to the changes in brain physiology.
Increasing evidence in healthy humans and animals suggests that sleep slow-wave activity (SWA) plays an important role in regulating synaptic plasticity and reorganization.12-15 Specifically, whereas wakefulness favors synaptic potentiation, sleep SWA may promote synaptic depression to obtain a general rescaling of synaptic strength, therefore serving a homeostatic function. 16
An intriguing implication of the link between sleep SWA and synaptic strength is that, as synaptic efficacy is strengthened more during the day in a specific cortical area, subsequent sleep SWA should be locally increased in that area as compared with the rest of the cortex. 12 This effect relies on the notion that stronger synapses lead to stronger cortico-cortical connections and, in turn, increased synchronization among populations of neurons. 17 Increased synchronization is then reflected in slow waves of larger amplitude at the EEG level. 16
More generally, sleep offers important advantages for investigating potential electrophysiological markers of therapeutic efficacy in neurological patients. In fact, sleep recordings minimize waking-related confounding factors, including fluctuation in attention and reduced cognitive ability. 18
In this study, we assessed the local plastic changes induced by IMITATE in individuals with aphasia using sleep SWA as an electrophysiological marker. By comparing high density (hd)-EEG sleep recordings before and after IMITATE, we aimed at noninvasively locating the cortical areas involved in the reorganization induced by the IMITATE protocol, thus directly testing the neurophysiological principles underlying this specific rehabilitative approach.
Methods
Patients
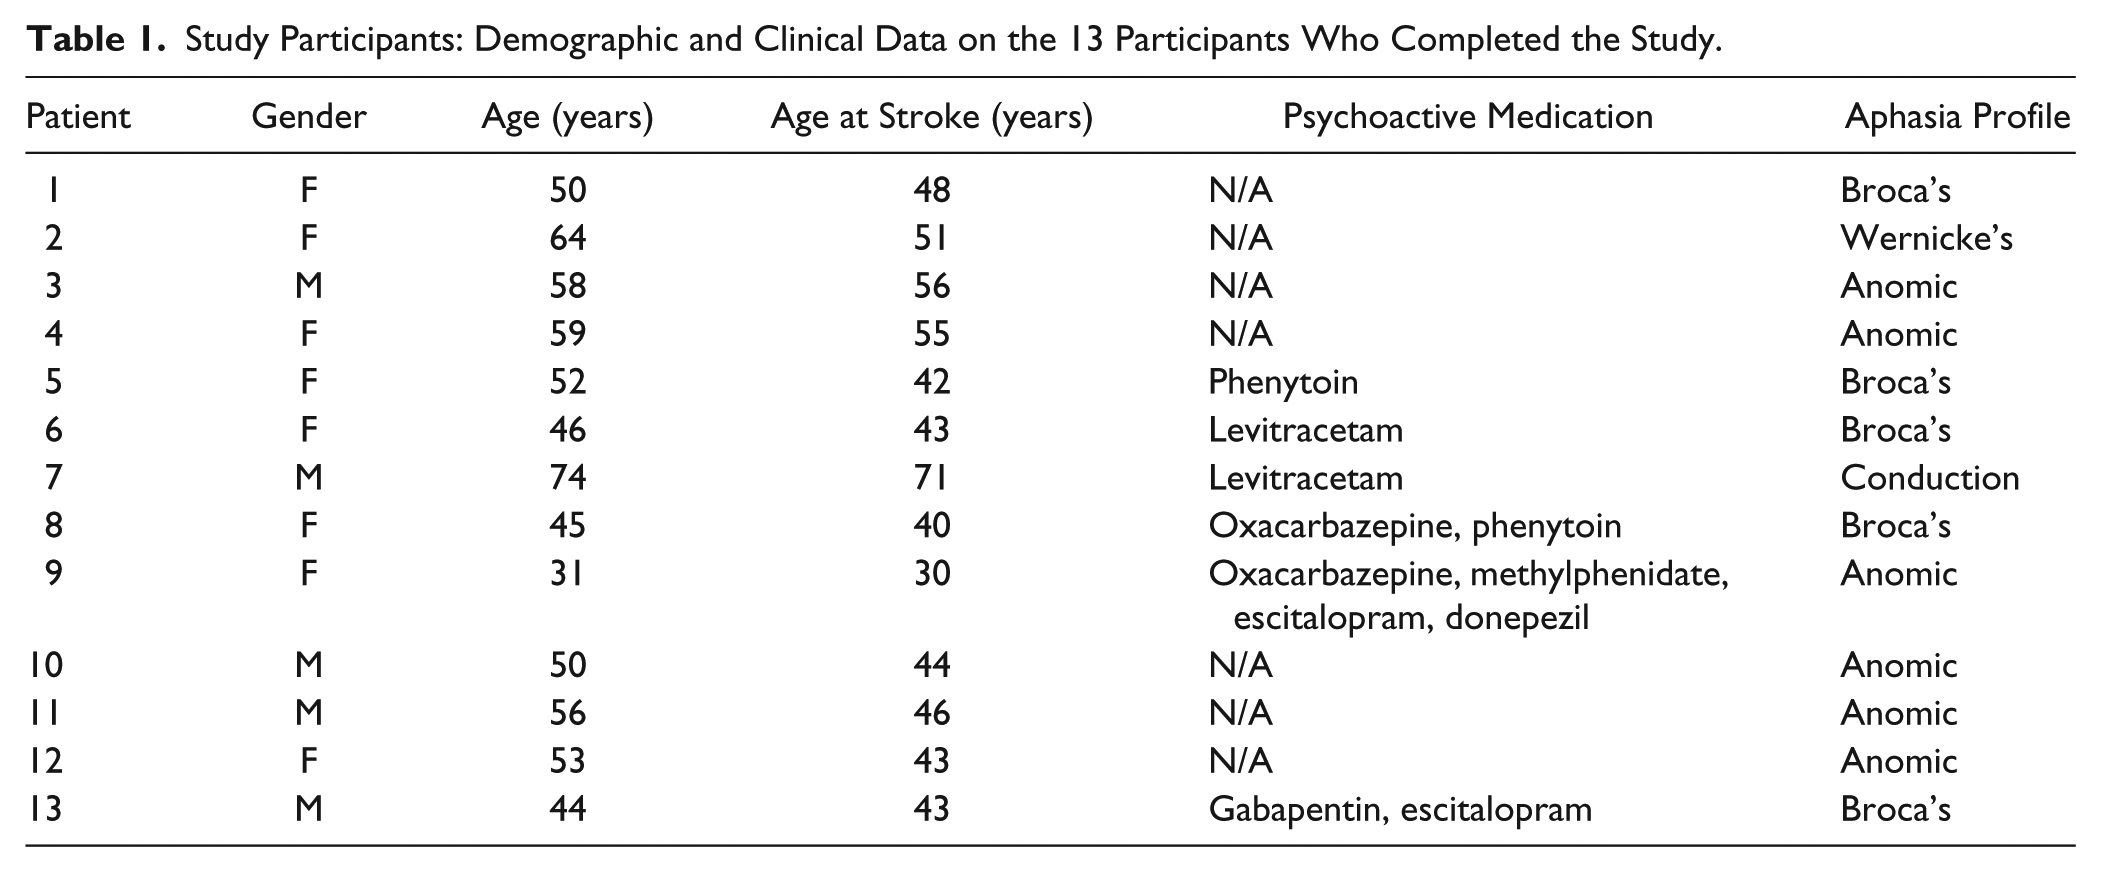
A total of 17 right-handed individuals with previous left-hemisphere ischemic stroke and resulting aphasia were recruited to participate in the study. Inclusion criteria were assessed by a preliminary screening as follows: (1) history of a single, chronic (>9 months), CT- or MRI-documented ischemic stroke of the left hemisphere; (2) medical and neurological stability; and (3) native speaker of English. All patients meeting these criteria underwent a language assessment with the Western Aphasia Battery (WAB). Those with an Aphasia Quotient (AQ) between 20 and 95 were invited to participate in the sleep study. Two candidates were excluded at this stage (both had AQ scores >95, indicating a very modest speech impairment). Each of the remaining 15 participants underwent 2 sleep recordings, one at baseline and another following a session of imitation-based aphasia therapy with IMITATE. Two patients were excluded from the study during this portion of the study: One dropped out after the first sleep recording (very poor sleep quality, probably because of the novel experimental setting), and the other had to leave for technical reasons during the second sleep recording (computer hard drive failure during data acquisition). Results are thus presented for a sample that includes the remaining 13 patients (8 male; mean age = 52 ± 10.9 years; mean age at stroke = 46 ± 10.6). See Table 1 for details. The institutional review board of the Division of Biological Sciences of The University of Chicago approved all experimental procedures. All participants provided written informed consent prior to any behavioral testing or sleep studies.
Study Participants: Demographic and Clinical Data on the 13 Participants Who Completed the Study.
Language Assessment
Language and cognitive assessments were conducted prior to the first night of sleep and repeated following the second night of sleep. Speech-language testing comprised administration of 3 standardized measures, including the Apraxia Battery for Adults-2 (subtests 1, 2A, 2B, 5), the Boston Naming Test, and the WAB (Part 1; AQ). For a full description of the speech assessment scores before and after IMITATE see Table 2.
Speech Assessment Before and After IMITATE. a
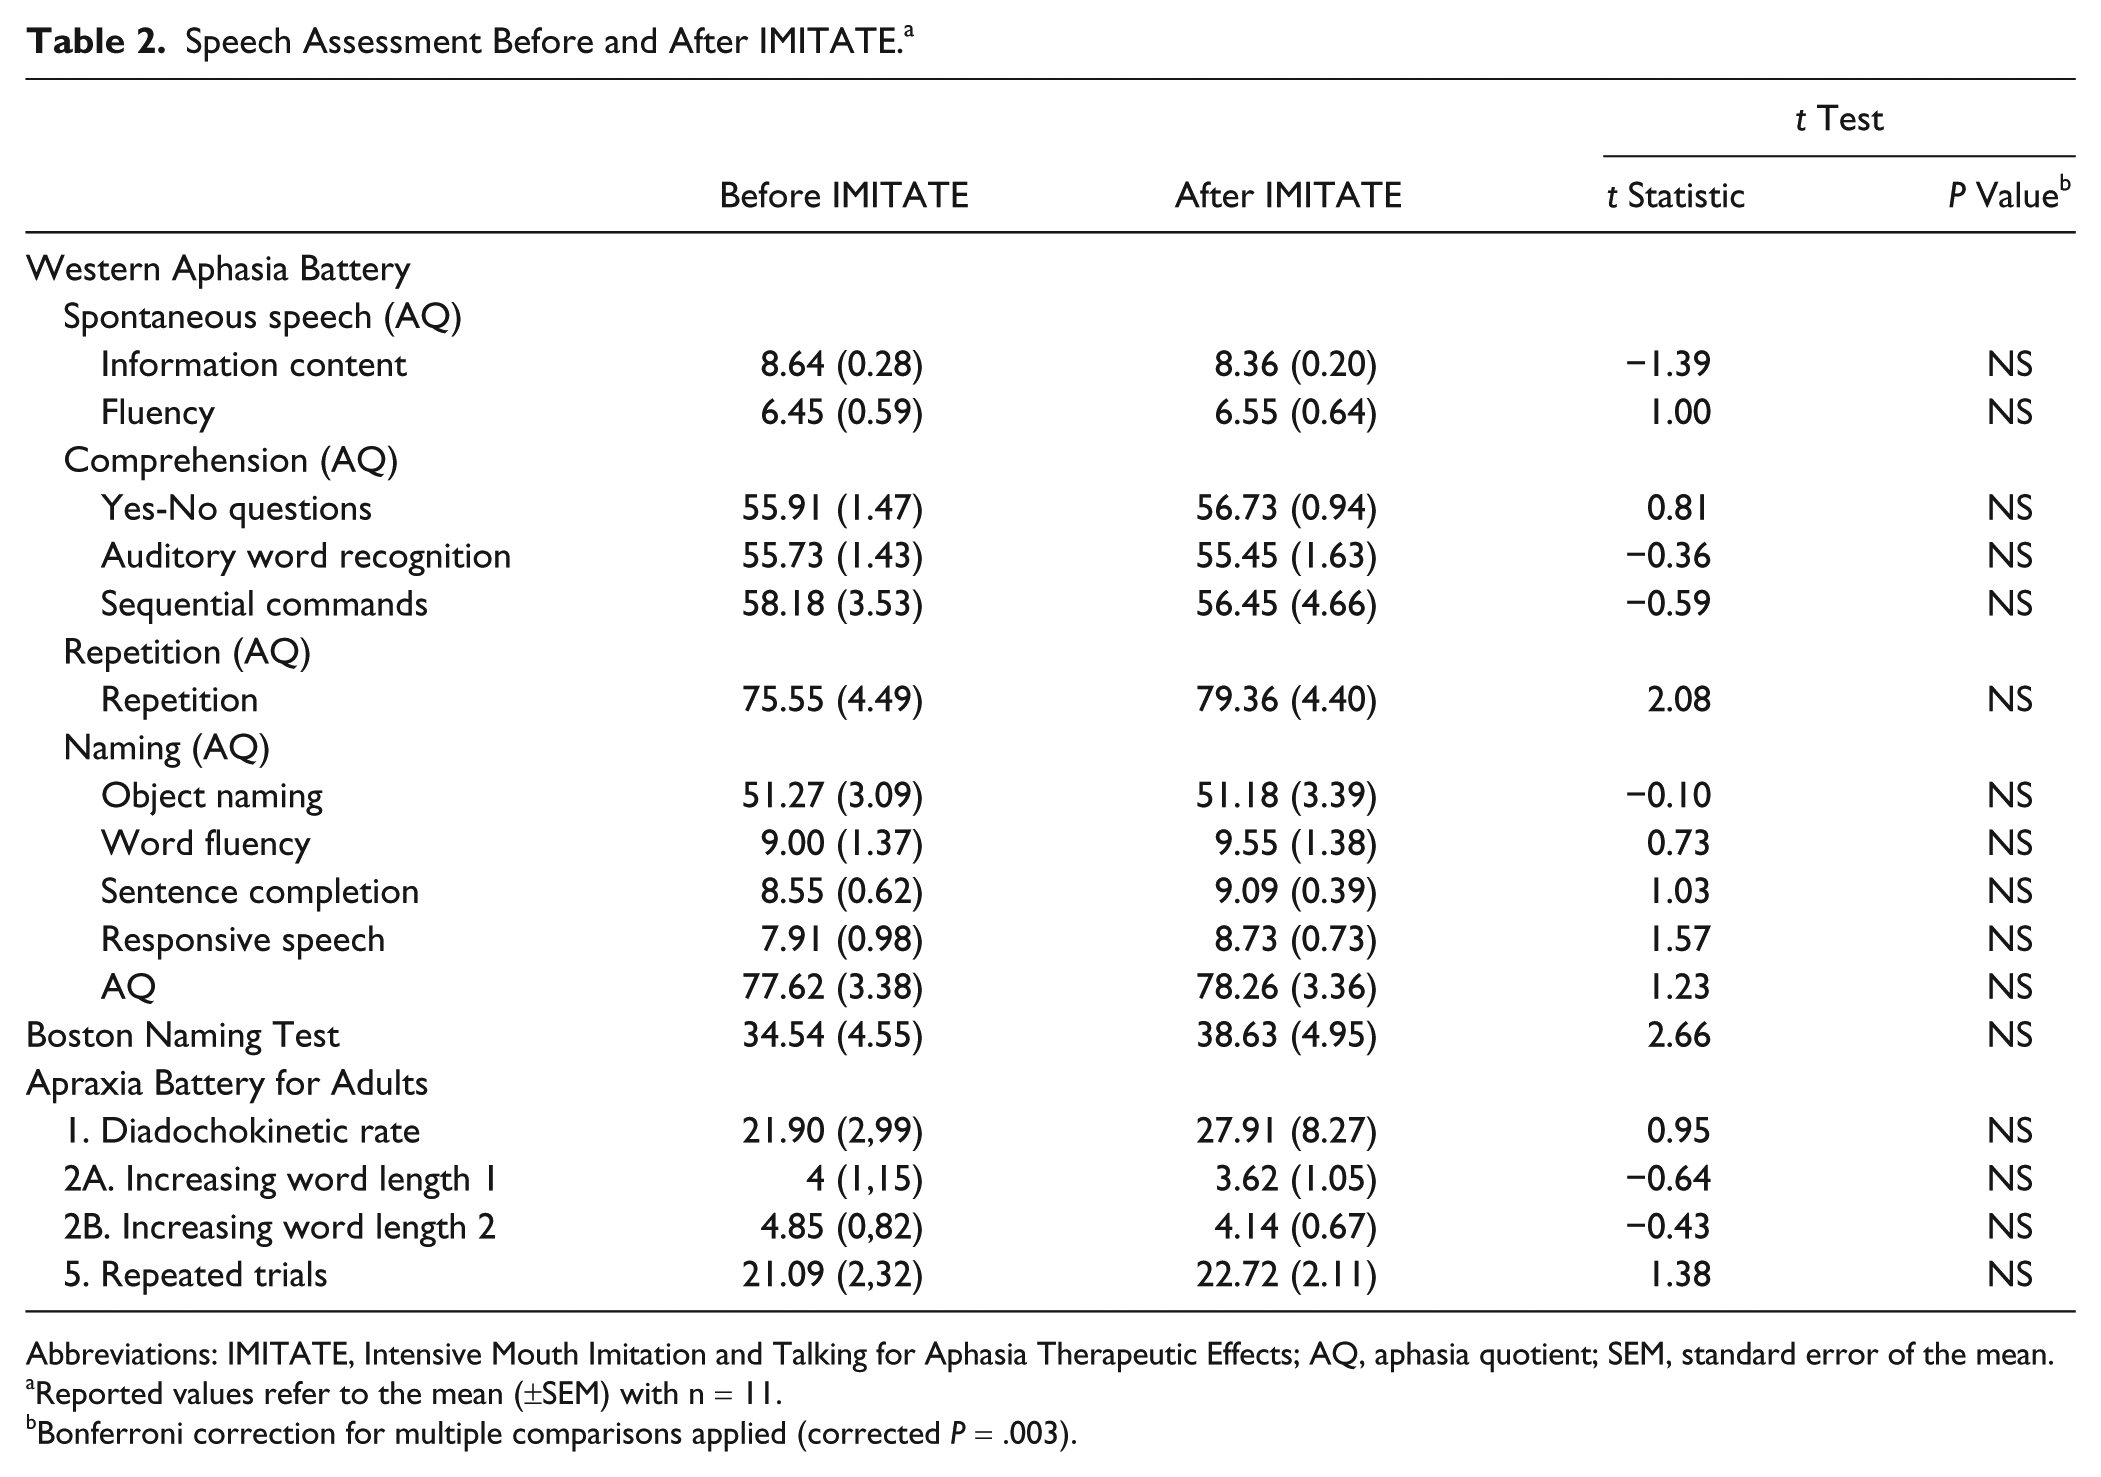
Abbreviations: IMITATE, Intensive Mouth Imitation and Talking for Aphasia Therapeutic Effects; AQ, aphasia quotient; SEM, standard error of the mean.
Reported values refer to the mean (±SEM) with n = 11.
Bonferroni correction for multiple comparisons applied (corrected P = .003).
Structural MRI Assessment
To obtain a precise indication of overall lesion extent at the time of the recordings, patients underwent structural MRI assessment. Three patients were excluded because of contraindications to MRI (1 patient had a pacemaker and 2 others felt discomfort during the scan session and had to be withdrawn). MRI scans were acquired at the Center for Advanced MRI at Northwestern University using a Siemens 3T Trio scanner. Image acquisition consisted of a single T1-weighted, high-resolution, 3-dimensional whole-brain anatomical scan, using a magnetization-prepared rapid gradient echo (MPRAGE) sequence (1 mm isotropic resolution).
IMITATE Therapy
IMITATE is an intensive physiologically based therapy, which uses more than 3000 unique video clips of words and phrases spoken by 6 different standard American English speakers. During the therapy session, participants viewed videos of 6 different speakers uttering an identical word or phrase, followed by a 20-s period during which they were asked to produce the same word or phrase as many times as they could. The therapy uses only ecologically valid stimuli (that is, English words and sentences spoken by a visible speaker using normal prosody). For a detailed description of IMITATE features, please see Gallese et al. 6 For this study, we used a modified version of the IMITATE rehabilitation protocol that compressed the 6-week, 90-min/d protocol to a 3.5-hour intensive single session occurring between the 2 nights of sleep. Patients enrolled in the research were naive to the IMITATE protocol before the study procedures, but several were subsequently enrolled in the 6-week study.
Study Procedures
All sleep EEG recordings were performed in the General Clinical Research Center (GCRC) of The University of Chicago. Following initial behavioral testing, participants donned EEG electrode caps and were instructed to go to bed at their usual bedtime. After 8 hours in bed, the baseline night recording was stopped, and the EEG sensor cap was removed. After the baseline sleep period, participants spent the morning in their room at the GCRC and were allowed to carry out their normal daytime activities. In the afternoon (around 2
Sleep EEG Acquisition
Whole-night EEG sleep recordings were acquired with a 256-sensor, hd EEG system (EGI Inc, Eugene, OR) on 2 consecutive nights. This procedure allows for a within-subject comparison of the sleep EEG topographies with adequate spatial resolution, thus allowing the detection of local changes in EEG power. During both recording nights, sleep EEG signals were sampled at 500 Hz, acquired referenced to the Cz electrode and online filtered DC 200 Hz using NetStation software (EGI Inc, Eugene, OR). Impedance was kept below 50 kΩ at the beginning of each recording for all EEG derivations.
Sleep EEG Spectral Analysis
Sleep stages were visually scored offline in 20-s epochs (American Academy of Sleep Medicine standard criteria 19 ). Non-REM (NREM) sleep episodes were defined according to standard criteria20,21 applied on the C3A2 and C4A1 derivations as well as to right- and left-electrooculographic and electromyographic signals derived from bipolar re-referencing of EEG derivations located over the frontal and neck regions, respectively. After removing electrodes located on the neck/face as well as those with impedances >150 kΩ at the end of the recording, signals from all the remaining derivations (175-185) were processed using custom Matlab routines. Signals were first first-order high-pass filtered (Kaiser type FIR, 0.1 Hz), downsampled to 128 Hz using the Matlab function resample, and then average referenced and filtered (0.5-40 Hz; 2-way least-squares FIR bandpass filter) using the eegfilt function of the EEGLab Matlab toolbox. 22 Spectral density analysis (Welch’s averaged modified periodogram with a Hamming window, averages of five 4-s epochs) with a 0.25-Hz bin resolution was performed. NREM sleep epochs exceeding a threshold based on the mean power values in the 0.75- to 4.5-Hz and 20- to 30-Hz frequency bands in at least 1 channel were excluded from the analysis. For each EEG electrode, SWA was calculated as the average spectral density between 1 and 4.5 Hz in artifact-free 20-s NREM epochs. To investigate topographical changes before and after IMITATE, SWA values for each electrode were then normalized by the mean value across all derivations for the 2 nights separately. For the topographical display of SWA, we used the topoplot function of the EEGLab Matlab toolbox. 22
Statistics
Statistical nonparametric mapping (SnPM 23 ) was used to assess topographical changes in hd-EEG SWA analysis induced by IMITATE. This method takes advantage of the actual data distribution and accounts for multiple comparisons testing in hd-EEG recordings. For sleep parameters, we used 2-tailed paired t tests with significance set at P < .05.
Results
As shown in Figure 1, most patients (8 out of 10) had lesions located over the left-precentral regions (inferior frontal gyrus, pars opercularis, and insula) and over the left-postcentral regions (inferior parietal lobule), whereas fewer patients had lesions involving a broad range of cortical regions of the left hemisphere. Group average aphasia severity assessed by the WAB AQ was 77.85 ± 3.51 (minimum = 56.8; maximum = 95; n = 13). In Table 1, we summarize the clinical features of our participant group.
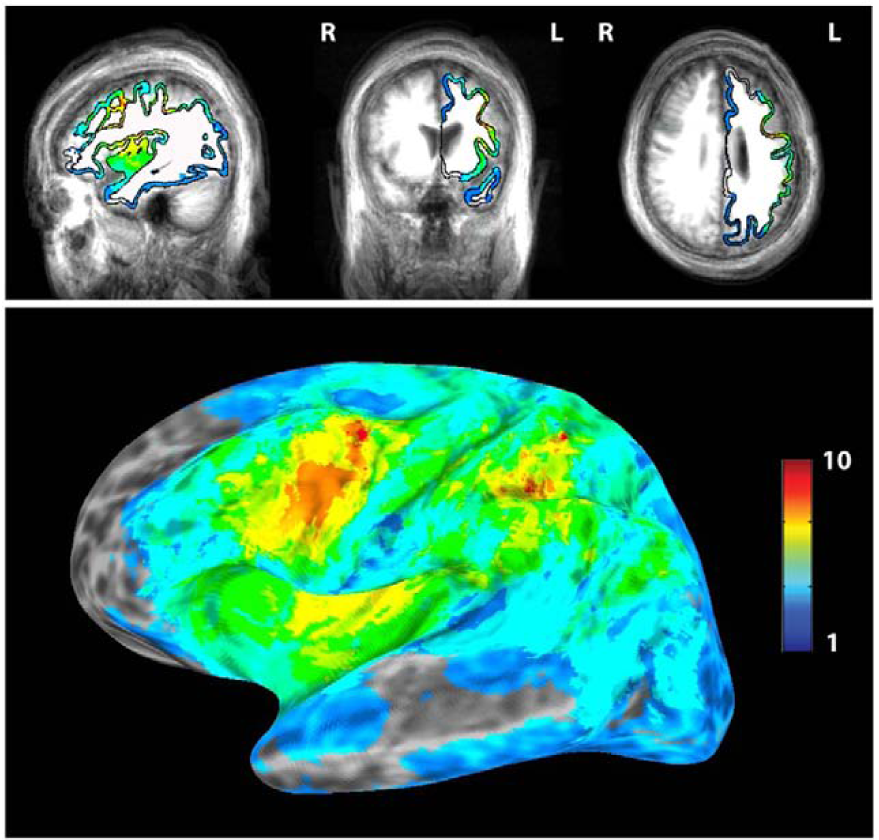
Stroke lesions in participants. Ten out of the 13 participants who completed the study (see the MRI methods section for details on the exclusion of 3 patients) had high-resolution T1-weighed volumetric (MP-RAGE) MRI scans; their brain lesions were manually delimited in the volume. The volumes were converted into surface rendering using Freesurfer, and lesion overlaps were computed. Note on the figure that all the patients had injury to the ventral premotor cortex of the left hemisphere, an important link in the parietal-frontal action comprehension and imitation circuit.
Speech Assessment Before and After IMITATE
We conducted a posttreatment language assessment for most of our patients (n = 11). As expected, for a single exposure to the therapeutic regimen, the overall AQ (as well as WAB subscores), the Apraxia Battery for Adults-2 subtests, and the Boston Naming Test did not show any significant change after IMITATE (see Table 2).
Sleep Parameters Before and After IMITATE
After IMITATE, sleep parameters were substantially unchanged as compared with those observed during baseline sleep (see Table 3). Altogether, these observations confirm that patients slept in a comparable manner during both nights in the GCRC, also suggesting that their baseline sleep was not affected by a “first-night effect,” sometimes found without a proper adaptation night.
Sleep Parameters Before and After IMITATE. a
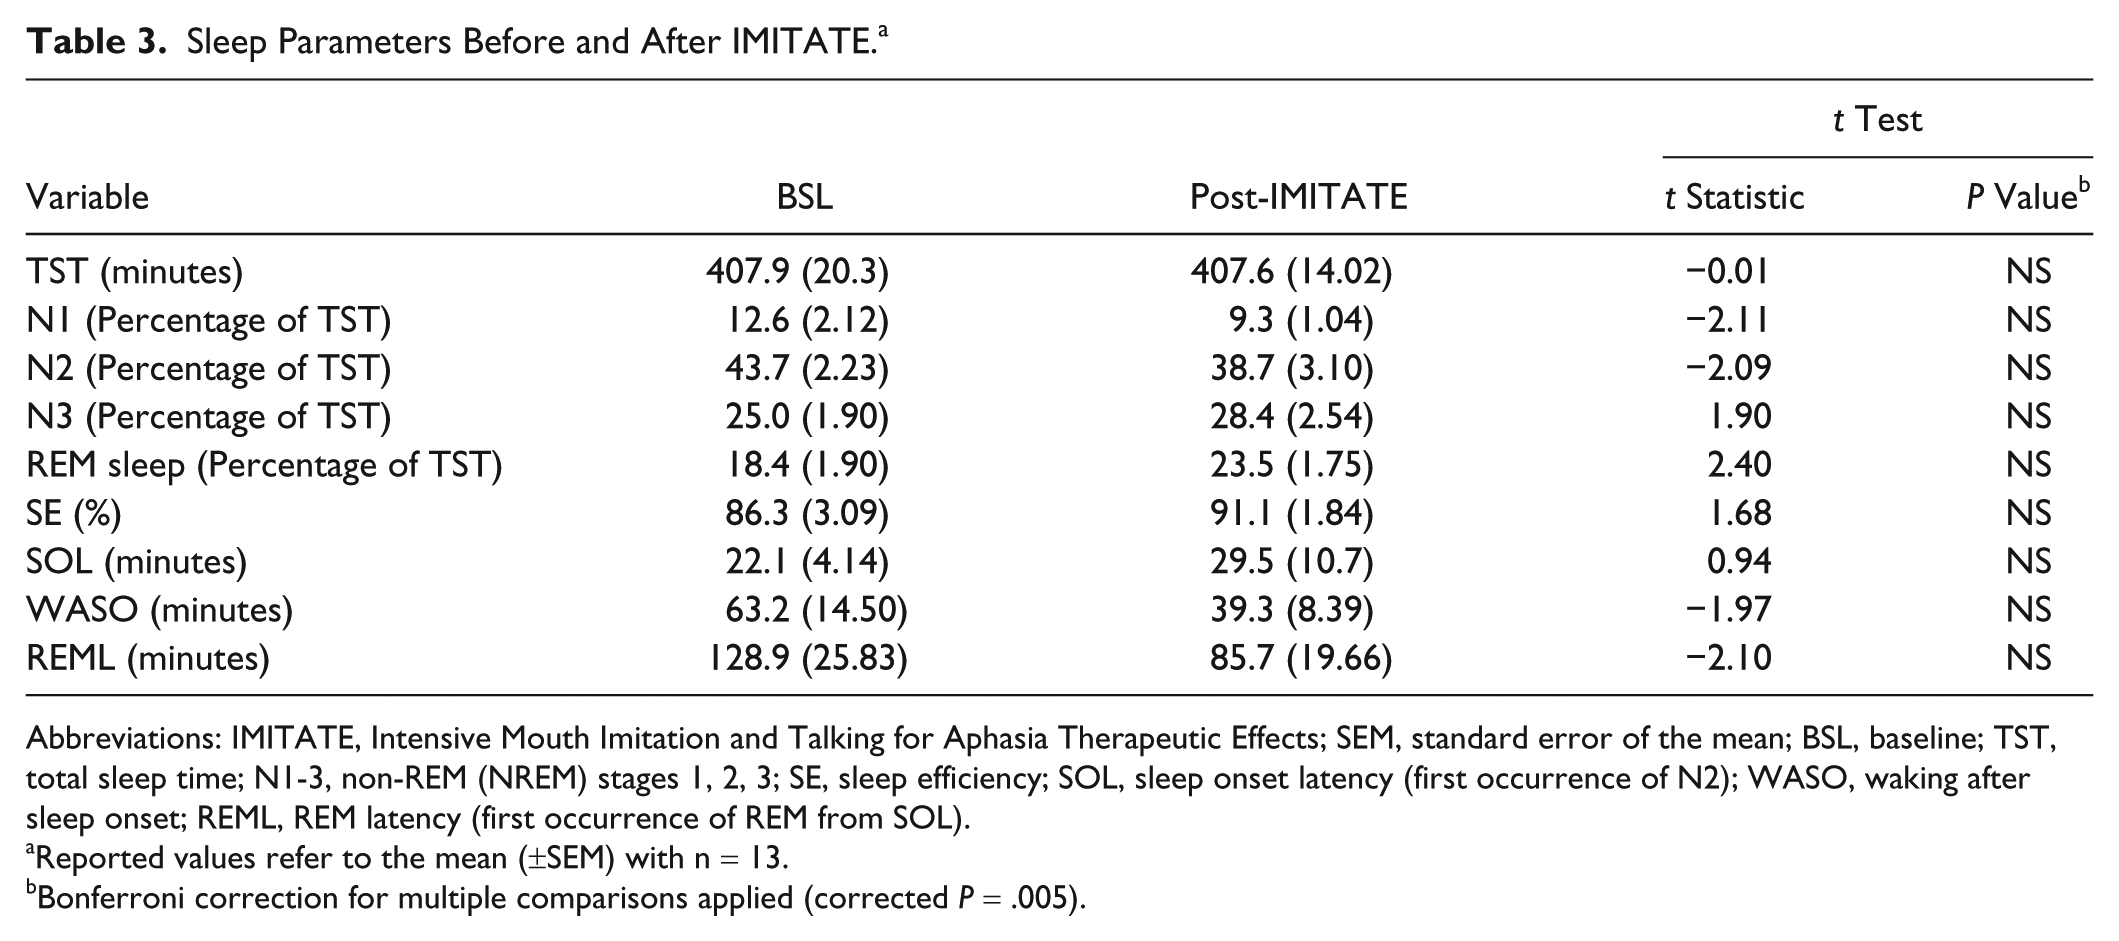
Abbreviations: IMITATE, Intensive Mouth Imitation and Talking for Aphasia Therapeutic Effects; SEM, standard error of the mean; BSL, baseline; TST, total sleep time; N1-3, non-REM (NREM) stages 1, 2, 3; SE, sleep efficiency; SOL, sleep onset latency (first occurrence of N2); WASO, waking after sleep onset; REML, REM latency (first occurrence of REM from SOL).
Reported values refer to the mean (±SEM) with n = 13.
Bonferroni correction for multiple comparisons applied (corrected P = .005).
IMITATE Effects on NREM Sleep EEG
Average SWA was calculated for each NREM sleep episode for both baseline and posttreatment nights. Figure 2A shows the average SWA during the initial 30 minutes of the first NREM sleep episode for both nights. This part of the night is characterized by the highest SWA and has been previously used to demonstrate plasticity-related SWA changes.12,24 Here we found that IMITATE produced a significant local increase in SWA at a cluster of electrodes located across the right-central sulcus (Figure 2B; P < .05; SnPM, suprathreshold cluster analysis) over a region overlapping motor, premotor, superior temporal, and parietal cortical areas. This local increase (14% ± 4% compared with baseline) was not confined to the beginning of the night but was also present during the entire first, second, and third NREM sleep episodes (Figure 3; P < .05), consistent with previous findings from our group. 25 Finally, we tested whether such local effects were specific for the SWA range. To do so, we subdivided the broadband (1-30 Hz) spectral density calculated over the significant cluster into standard frequency ranges (SWA: 1-4.5 Hz; θ: 5-8 Hz; ασ: 8-12 Hz; σ: 12-16 Hz; β: 16-30 Hz) during the first 30 minutes of the first NREM sleep episode. In addition to the above-mentioned SWA effect, a paired t test showed increased β activity (P < .05, data not shown).
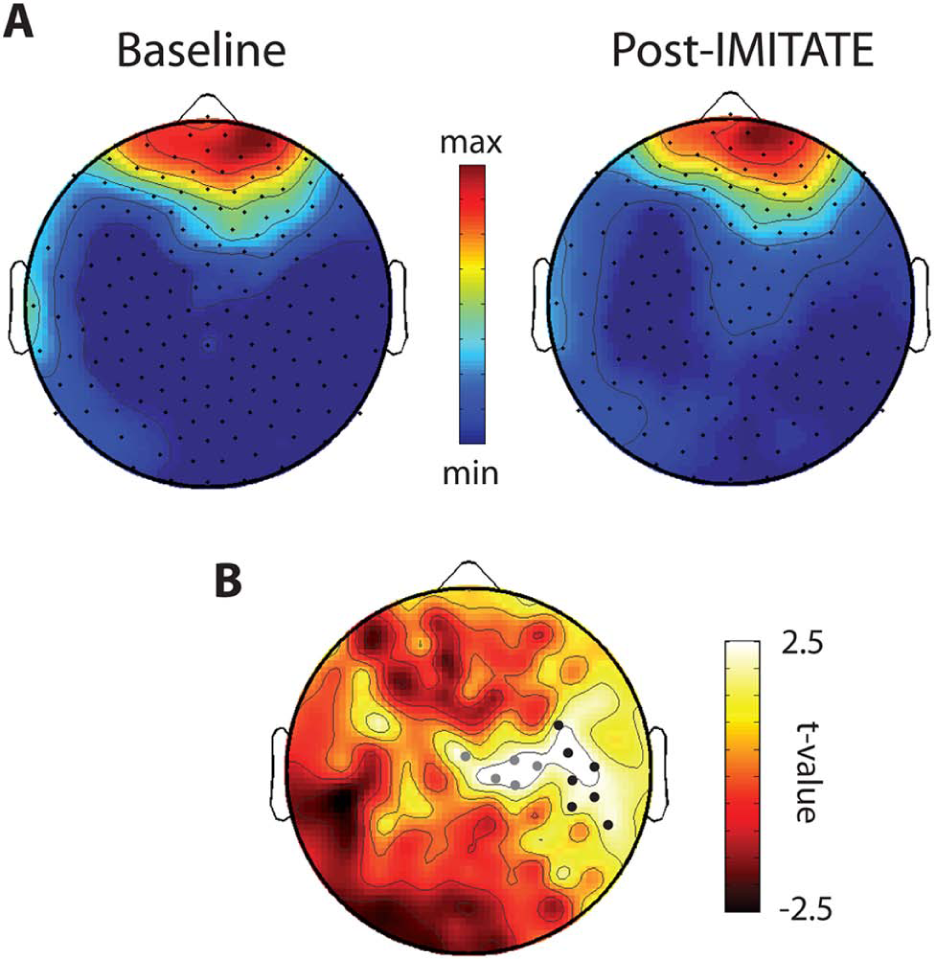
IMITATE effects on sleep SWA: A. Topographic distribution of absolute SWA during the first 30 minutes of the first NREM sleep episode before (baseline) and after IMITATE therapy (post-IMITATE). Values (mean of 13 participants) were plotted at the corresponding position on the planar projection of the scalp surface and interpolated (biharmonic spline) between electrodes. B. Topographic distribution of t values from paired t tests contrasting SWA power changes post-IMITATE relative to baseline during the first 30 minutes of the first NREM episode. Dots represent channels showing a significant increase in spectral power after IMITATE (P < .05; 2-tailed paired t test). In addition, black dots represent channels with significant differences following statistical nonparametric mapping (SnPM, suprathreshold cluster analysis).
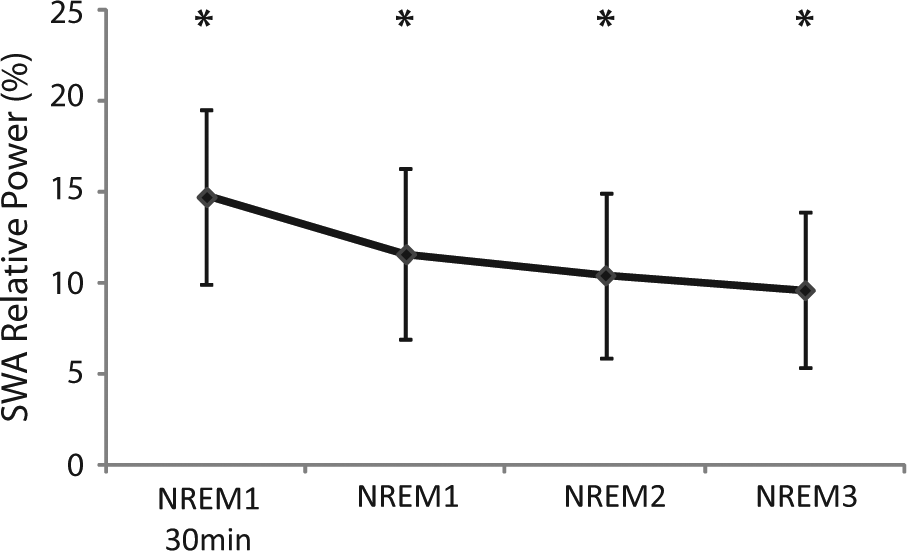
Time course of IMITATE effects on local sleep SWA. The percentage change (mean ± SEM) in average SWA calculated on the first 30 minutes of the first NREM episode (NREM1 30 minutes) and on the 3 NREM episodes (NREM 1-2-3) of the night after IMITATE as compared with the baseline night. We selected the electrode within the significant cluster represented in Figure 2 (black dots) yielding the highest t value at the SnPM suprathreshold cluster analysis (channel 195; t value = 3.07). SWA was significantly increased across all intervals (P < .05; Hotelling’s T2 test) as indicated by the asterisks.
Local SWA Changes and Speech Performance
We then tested whether SWA changes were associated with changes in speech and language performance as measured with the WAB. Among the WAB subscales, the Repetition subscale was the only one showing a trend toward a significant improvement after the imitation-based therapy (from 75.5 to 79.3; 2-tailed t test P = .06, uncorrected). We therefore performed a planned correlation (Pearson’s correlation) between the change in WAB Repetition subtest score and the change in SWA during the first 30 minutes of the first NREM sleep episode across all the EEG derivations. Results are illustrated in Figure 4. A cluster of significant (P < .05) positive correlations was found over the left hemisphere involving central as well as frontal derivations.
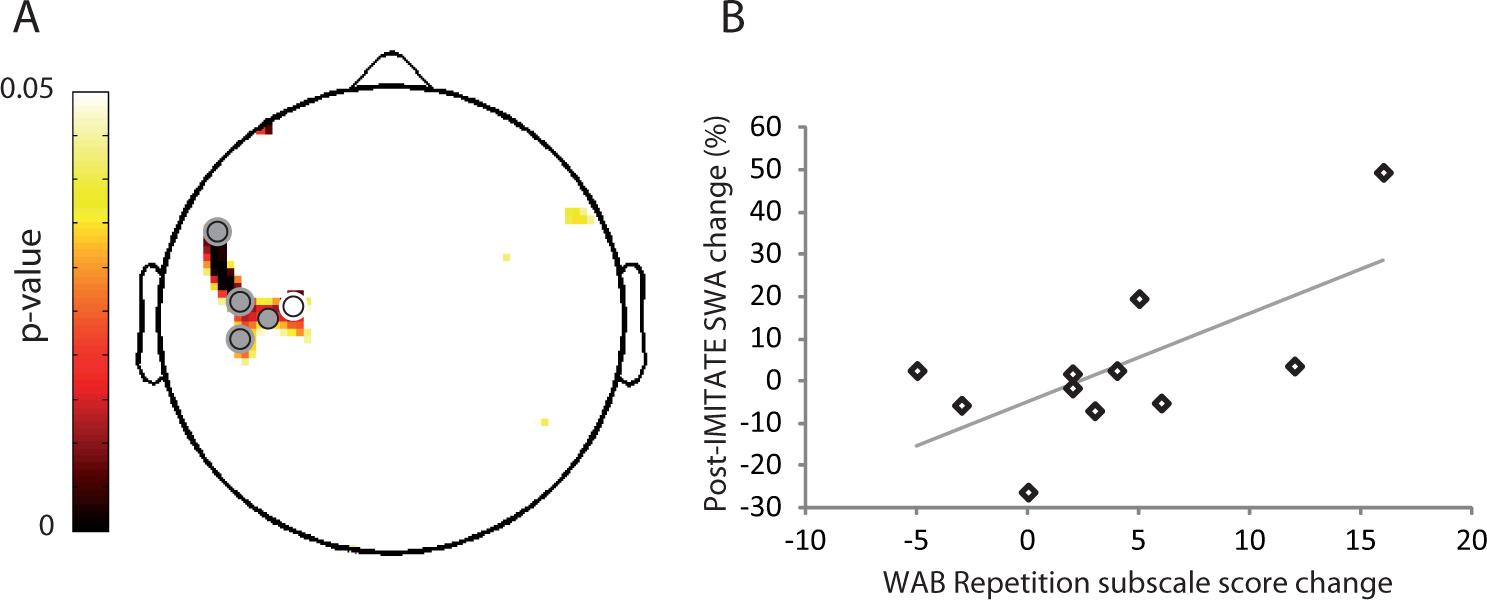
Correlation between IMITATE effects on speech and local sleep SWA: A. Topographic distribution of P values from Pearson’s correlation (n = 11) between changes in WAB Repetition subscale scores and changes in SWA post-IMITATE relative to baseline during the first 30 minutes of the first NREM sleep episode. Dots represent derivations with significant correlations (P < .05). B. Scatterplot (r = 0.67; P = .02) for a representative channel within the significant cluster (colored in white in A).
Discussion
In the present study, we used whole-night sleep hd-EEG recordings to investigate the effects of a single intensive exposure to speech-language therapy on brain plasticity. We focused on an imitation-based, computer-assisted rehabilitative protocol for aphasia treatment aimed at brain remodeling in the parietal-frontal motor pathway known to be important in action observation and imitation. During NREM sleep following the IMITATE protocol—practiced for 3.5 hours during a single day—we found a local increase in EEG SWA in a group of individuals with ischemic stroke and accompanying aphasia.
This local increase in SWA was found over a set of cortical areas shown to be particularly active during both speech observation and imitation in healthy individuals.5,10,26 Results derived from activation networks based on structural equation modeling of fMRI series during observation and imitation of syllables showed that bilateral connections between the inferior parietal lobule and premotor ventral areas are involved in both observation and imitation, pointing to the notion that observation and imitation of speech engage a frontal-parietal network with significant homologies to the “mirror neuron” circuit in macaques. 11
It is well established that sleep slow waves can be regulated at a local level based on prior waking activity.27-31 Many recent studies, however, have also shown that changes in NREM SWA reflect the occurrence of changes in synaptic strength in local networks, consistent with the idea that neuronal plasticity and sleep need are linked.16,32 In humans, a 5-Hz potentiation protocol using repetitive transcranial magnetic stimulation results in local potentiation of cortical responses, consistent with synaptic strengthening followed by a local increase in sleep SWA.33,34 Similarly, paired-associative stimulation protocols involving induction of either cortical potentiation or depression results in local NREM SWA increases and decreases, respectively. 35 Finally, in both humans and rats, learning a motor task increases NREM SWA specifically in the trained cortical area.12,36 Thus, it is likely that the increase in sleep SWA over the right hemisphere observed in the present study may underlie a change in synaptic strength in those cortical circuits engaged by the IMITATE protocol during the day.
It is worth reporting that NREM sleep EEG spectral features 37 and topographies 38 have been previously shown to be very stable within individuals across different nights even after massive global behavioral and pharmacological manipulations such as total sleep deprivation 39 and the administration of GABAergic agents. 40 This sleep EEG power “fingerprint” may reflect individual peculiarities of brain functional anatomy, which are known to be determined by genetic factors. It is therefore likely that the local topographical SWA changes found here are reflective of genuine effects induced by the behavioral intervention occurring between the 2 nights (see similar effects reported in Huber et al 24 ).
These changes were found during the course of the entire night (Figure 3). As previously discussed in Määttä et al, 25 plastic events occurring closer to sleep time may have a larger influence on NREM EEG at the beginning of sleep, during the first sleep cycle. By contrast, plastic events occurring at an earlier time during the day may be more detectable at a later time in sleep NREM EEG power. In line with this study, our IMITATE protocol was carried out during the afternoon up until a few hours before the patient’s bedtime, thereby inducing SWA changes throughout the night.
In addition, following therapy, high-frequency EEG activity in the β range was found to be increased over the same area that showed SWA effects. This result is in line with a previous report showing that human sleep slow waves tend to modulate spindle as well as β EEG activity. 41 Thus, increased synchronization leading to larger slow waves (as reflected by increased SWA) may be also associated with more synchronous β frequency modulation and, in turn, to increased β activity.
This is the first study in which the link between local sleep SWA and plasticity is investigated in a population presenting with cortical brain lesions. Although observation and imitation of speech is known to involve both hemispheres in healthy individuals, 10 here the relative heterogeneity of cortical lesions over the left hemisphere (Figure 1) characterizing our patients group may explain why the observed changes induced by IMITATE (Figure 2) were most consistently found over the right, healthy hemisphere.
Recently, a regional increase in SWA was found to be associated with behavioral improvement in performance on a previously learned task, 12 thus strictly linking synaptic downscaling during sleep with behavioral gains. 16
Here we observed a correlation between the SWA changes and the improvement in WAB Repetition subscale scores after IMITATE in a cluster of electrodes located over the left hemisphere and overlapping with the areas predicted by the therapeutic rationale.
These preliminary observations, although limited by the single exposure to speech therapy and by the small sample size, seem to suggest that the effects of IMITATE over perilesional left-hemispheric regions might be predictive of functional outcome.
Supporting this view, previous preliminary work based on fMRI data from a single aphasic patient reported long-term reorganization of a left-hemispheric functional network toward the normative model 10 after the administration of the full 6-week IMITATE therapy. 42 This is consistent with recent 43 and earlier imaging studies 44 of aphasia recovery.
Any intense behavioral manipulation involving experience-dependent plasticity exerts its effect over widespread areas of the cortex involved in the task execution. Our data are in line with previous human and animal models of stroke recovery, revealing functional and structural neural plasticity occurring both in perilesional areas and in brain regions distant from the lesion site45-48 and further imply a dynamic process for aphasia recovery. The observed changes in SWA after IMITATE over the right hemisphere (here not predictive of functional outcome) may thus reflect functional reorganization induced by the therapy possibly related to the specific task execution per se rather than linked to speech function recovery.
Although the role of the left versus the right hemisphere in facilitating recovery from aphasia has been a highly debated issue in clinical research, 49 it is becoming increasingly accepted that perilesional left-hemisphere activity in aphasia poststroke predicts the best language outcomes. Of course, such activity—and the concomitant outcome—largely depends on the left-hemispheric lesion extent. Usually, patients with small lesions of the left hemisphere tend to recruit left-perilesional areas with variable involvement of right-hemispheric structures.44,50,51 Conversely, in patients with relatively large lesions in the left hemisphere, the only path to recovery may be through the recruitment of homologous language and speech-motor regions in the right hemisphere.50-54
Thus, in order to shed light on which path to recovery IMITATE protocol is more actively stimulating, future studies should apply the standard 6-week IMITATE protocol on patients affected by small left-hemispheric lesions versus patients with lesions involving large portions of the left hemisphere. In addition, in order to test the reliability of the changes in sleep SWA in predicting positive long-term clinical outcomes, patients’ sleep as well as speech assessment should be reassessed both after the first exposure to IMITATE and at the end of the full therapeutic regimen, therefore also excluding potential learning effects resulting from repeated exposure to the WAB items.
To test for the specificity of the observed local changes, in future studies, it would also be important to compare the effects on sleep SWA following IMITATE with those obtained by applying other intensive speech therapeutic interventions not specifically targeting the imitation domain.
Altogether, these findings suggest that plastic changes occur in areas activated during the execution of IMITATE, possibly reflecting the effectiveness of such intervention, therefore providing evidence for the neurobiological rationale of the therapy. Furthermore, these results support the notion that sleep hd-EEG and the topographical analysis of SWA are well suited to investigating local brain plastic changes underpinning functional recovery in neurological populations, allowing for a noninvasive and repeatable assessment of such changes.
Footnotes
Declaration of Conflicting Interests
The authors declared no potential conflicts of interest with respect to the research, authorship, and/or publication of this article.
Funding
The authors disclosed receipt of the following financial support for the research, authorship, and/or publication of this article: The work described here has been supported by the National Institute of Deafness and other Communication Disorders of the National Institutes of Health of the United States of America under grant R01-DC-0007488 (Dr Small) and by the James S. McDonnell Foundation grant to the Brain Network Recovery Group and The Virtual Brain project (Drs Small and Tononi) as well as by the support of “Dote ricerca”: FSE, Regione Lombardia (Dr Sarasso). The aphasia testing described here was performed by speech-language pathologists in the laboratory of Dr Leora Cherney at the Rehabilitation Institute of Chicago, including Edie Babbitt, Robert Rosalind Hurwitz, and Jaime Lee. In addition, both Blythe Buchholz and Rob Fowler provided critical technical support at The University of Chicago and Susan Duncan helped significantly at the University of California, Irvine. The support of our funding agencies and these supporting personnel is gratefully acknowledged.