
Abstract
Background. Even though lower-limb motor disorders are core features of spastic cerebral palsy (sCP), the relationship with brain lesions remains unclear. Unraveling the relation between gait pathology, lower-limb function, and brain lesions in sCP is complex for several reasons; wide heterogeneity in brain lesions, ongoing brain maturation, and gait depends on a number of primary motor functions/deficits (eg, muscle strength, spasticity). Objective. To use a comprehensive approach combining conventional MRI and diffusion tensor imaging (DTI) in children with sCP above 3 years old to relate quantitative parameters of brain lesions in multiple brain areas to gait performance. Methods. A total of 50 children with sCP (25 bilateral, 25 unilateral involvement) were enrolled. The investigated neuroradiological parameters included the following: (1) volumetric measures of the corpus callosum (CC) and lateral ventricles (LVs), and (2) DTI parameters of the corticospinal tract (CST). Gait pathology and primary motor deficits, including muscle strength and spasticity, were evaluated by 3D gait analysis and clinical examination. Results. In bilateral sCP (n = 25), volume of the LV and the subparts of the CC connecting frontal, (pre)motor, and sensory areas were most related to lower-limb functioning and gait pathology. DTI measures of the CST revealed additional relations with the primary motor deficits (n = 13). In contrast, in unilateral sCP, volumetric (n = 25) and diffusion measures (n = 14) were only correlated to lower-limb strength. Conclusions. These results indicate that the combined influence of multiple brain lesions and their impact on the primary motor deficits might explain a large part of the gait pathology in sCP.
Introduction
Although motor disorders are the core features of spastic cerebral palsy (sCP), 1 the degree of motor impairment varies tremendously between children with sCP. 2 Early prognosis of long-term motor functioning constitutes a key challenge because it forms a fundamental prerequisite for timely individual tuning of the multidisciplinary therapy. 3 Neuroimaging might enable the prediction of motor outcome at an early age. Research on the relation between brain lesions and upper-limb motor functioning in sCP has shown that the type of brain lesion, white matter integrity, and cortical reorganization can explain a significant part of the variability in upper-limb functioning.4-9 The link between brain lesions and gait pathology in sCP, however, has been scarcely studied.
Elucidating this relation is complex for several reasons. First, brain lesions in children with sCP are characterized by a wide heterogeneity.10,11 Moreover, brain maturation continues for many years after birth and—especially in the first 2 years—leads to considerable functional changes in the brain. 12 Consequently, it is challenging to make reliable long-term predictions of gait pathologies based on brain lesions before the age of 3. Additionally, conventional magnetic resonance imaging (MRI) modalities fail to highlight brain lesions in 10% to 30% of children with suspected sCP. 11 In those cases, more advanced MRI approaches, such as diffusion tensor imaging (DTI), can identify lesions not observable with conventional MRI, because the sensitivity of DTI to disruption of white matter is higher than that of any other imaging modality. 11 Finally, the brain lesions in children with sCP typically result in a set of primary deficits—that is, muscle weakness, 13 spasticity, 14 and problems with selective motor control and balance.15,16 These primary deficits adversely affect functional activities, such as walking, and have been shown to relate to pyramidal tract damage,17,18 corpus callosum (CC) volume, 19 and injury to the thalamico-cortical connections. 20
The majority of previous studies have focused on general evaluations of lower-limb gross motor functioning, such as the Gross Motor Functioning Classification Scale (GMFCS),2,21-24 or the type of movement pattern (eg, crouch, stiff knee). 25 These studies identified important relationships between lesion severity and gait performance in sCP, but most studies included only 1 sCP subtype (bilateral or unilateral involvement) and did not study the role of the primary motor deficits. In addition, their results can be extended by using an integrated approach (including both conventional volumetric measures and DTI of multiple brain areas and structures), which might provide the key to explaining the highly variable clinical presentation of sCP.11,26
Importantly, in sCP, sensorimotor deficits have most often been described contralateral to the affected brain hemisphere. For instance, Hoon et al 20 found that posterior thalamic radiation injury correlated with increased contralateral sensory deficits of the upper and lower extremity. This lateralization, however, has not been investigated for lower-limb motor deficits and gait pathology. Therefore, it is of particular interest whether lesions on one side of the brain are directly related to gait pathology or lower-limb deficits on the contralateral side or whether ipsilateral projections (of the corticospinal tract [CST]) affect this simple relation. These relations will likely be different between bilateral and unilateral sCP because brain lesions are usually less lateralized in bilateral sCP.
Consequently, we aimed to explore the relation between brain lesions and gait pathology in children with sCP by relating brain characteristics to primary motor deficits of the lower limb and gait performance in 2 types of sCP. We sought to answer the following research questions: (1) Are brain lesions in the most-affected hemisphere directly related to lower-limb motor deficits on the contralateral side? (2) Is brain asymmetry related to asymmetric lower-limb motor deficits?
Methods
Participants
The CP Reference Centre database of the University Hospitals of Leuven was searched for children who met the following criteria: (1) spastic CP; (2) recent MRI brain imaging available or new imaging planned, including at least MPRAGE (magnetization-prepared rapid gradient-echo) and DTI, in children of minimally 3 years old; and (3) data available of 3-dimensional gait analysis (3DGA) conducted between the ages of 3 and 12, prior to any lower-limb orthopedic surgery and prior to or more than 6 months after lower-limb botulinum toxin-A injections. When several 3DGAs of a patient were available, preference was given to the first 3DGA from 5 years on to keep the influence of treatment effects—for example, physical therapy, botulinum toxin-A injections—and the growth spurt to a minimum.
A total of 50 children with sCP were enrolled, 25 bilaterally and 25 unilaterally involved (see Table 1 for patient characteristics). We defined a participant’s most-affected side of the body as the side on which the leg had the highest spasticity measure (median Modified Ashworth Scale). All bilaterally affected children showed bilateral brain lesions, except 1 child who did not show clear lesions on the structural MRI scans. Most unilaterally affected children (n = 20), however, showed bilateral lesions. Only 4 unilaterally affected children showed unilateral brain lesions (the only 4 affected by arterial stroke or venous infarction). One unilaterally affected child did not show clear lesions on the MRI scans. Individual patient characteristics are provided in the Appendix Table A.1.
Patient Characteristics of the Unilateral and Bilateral Group.
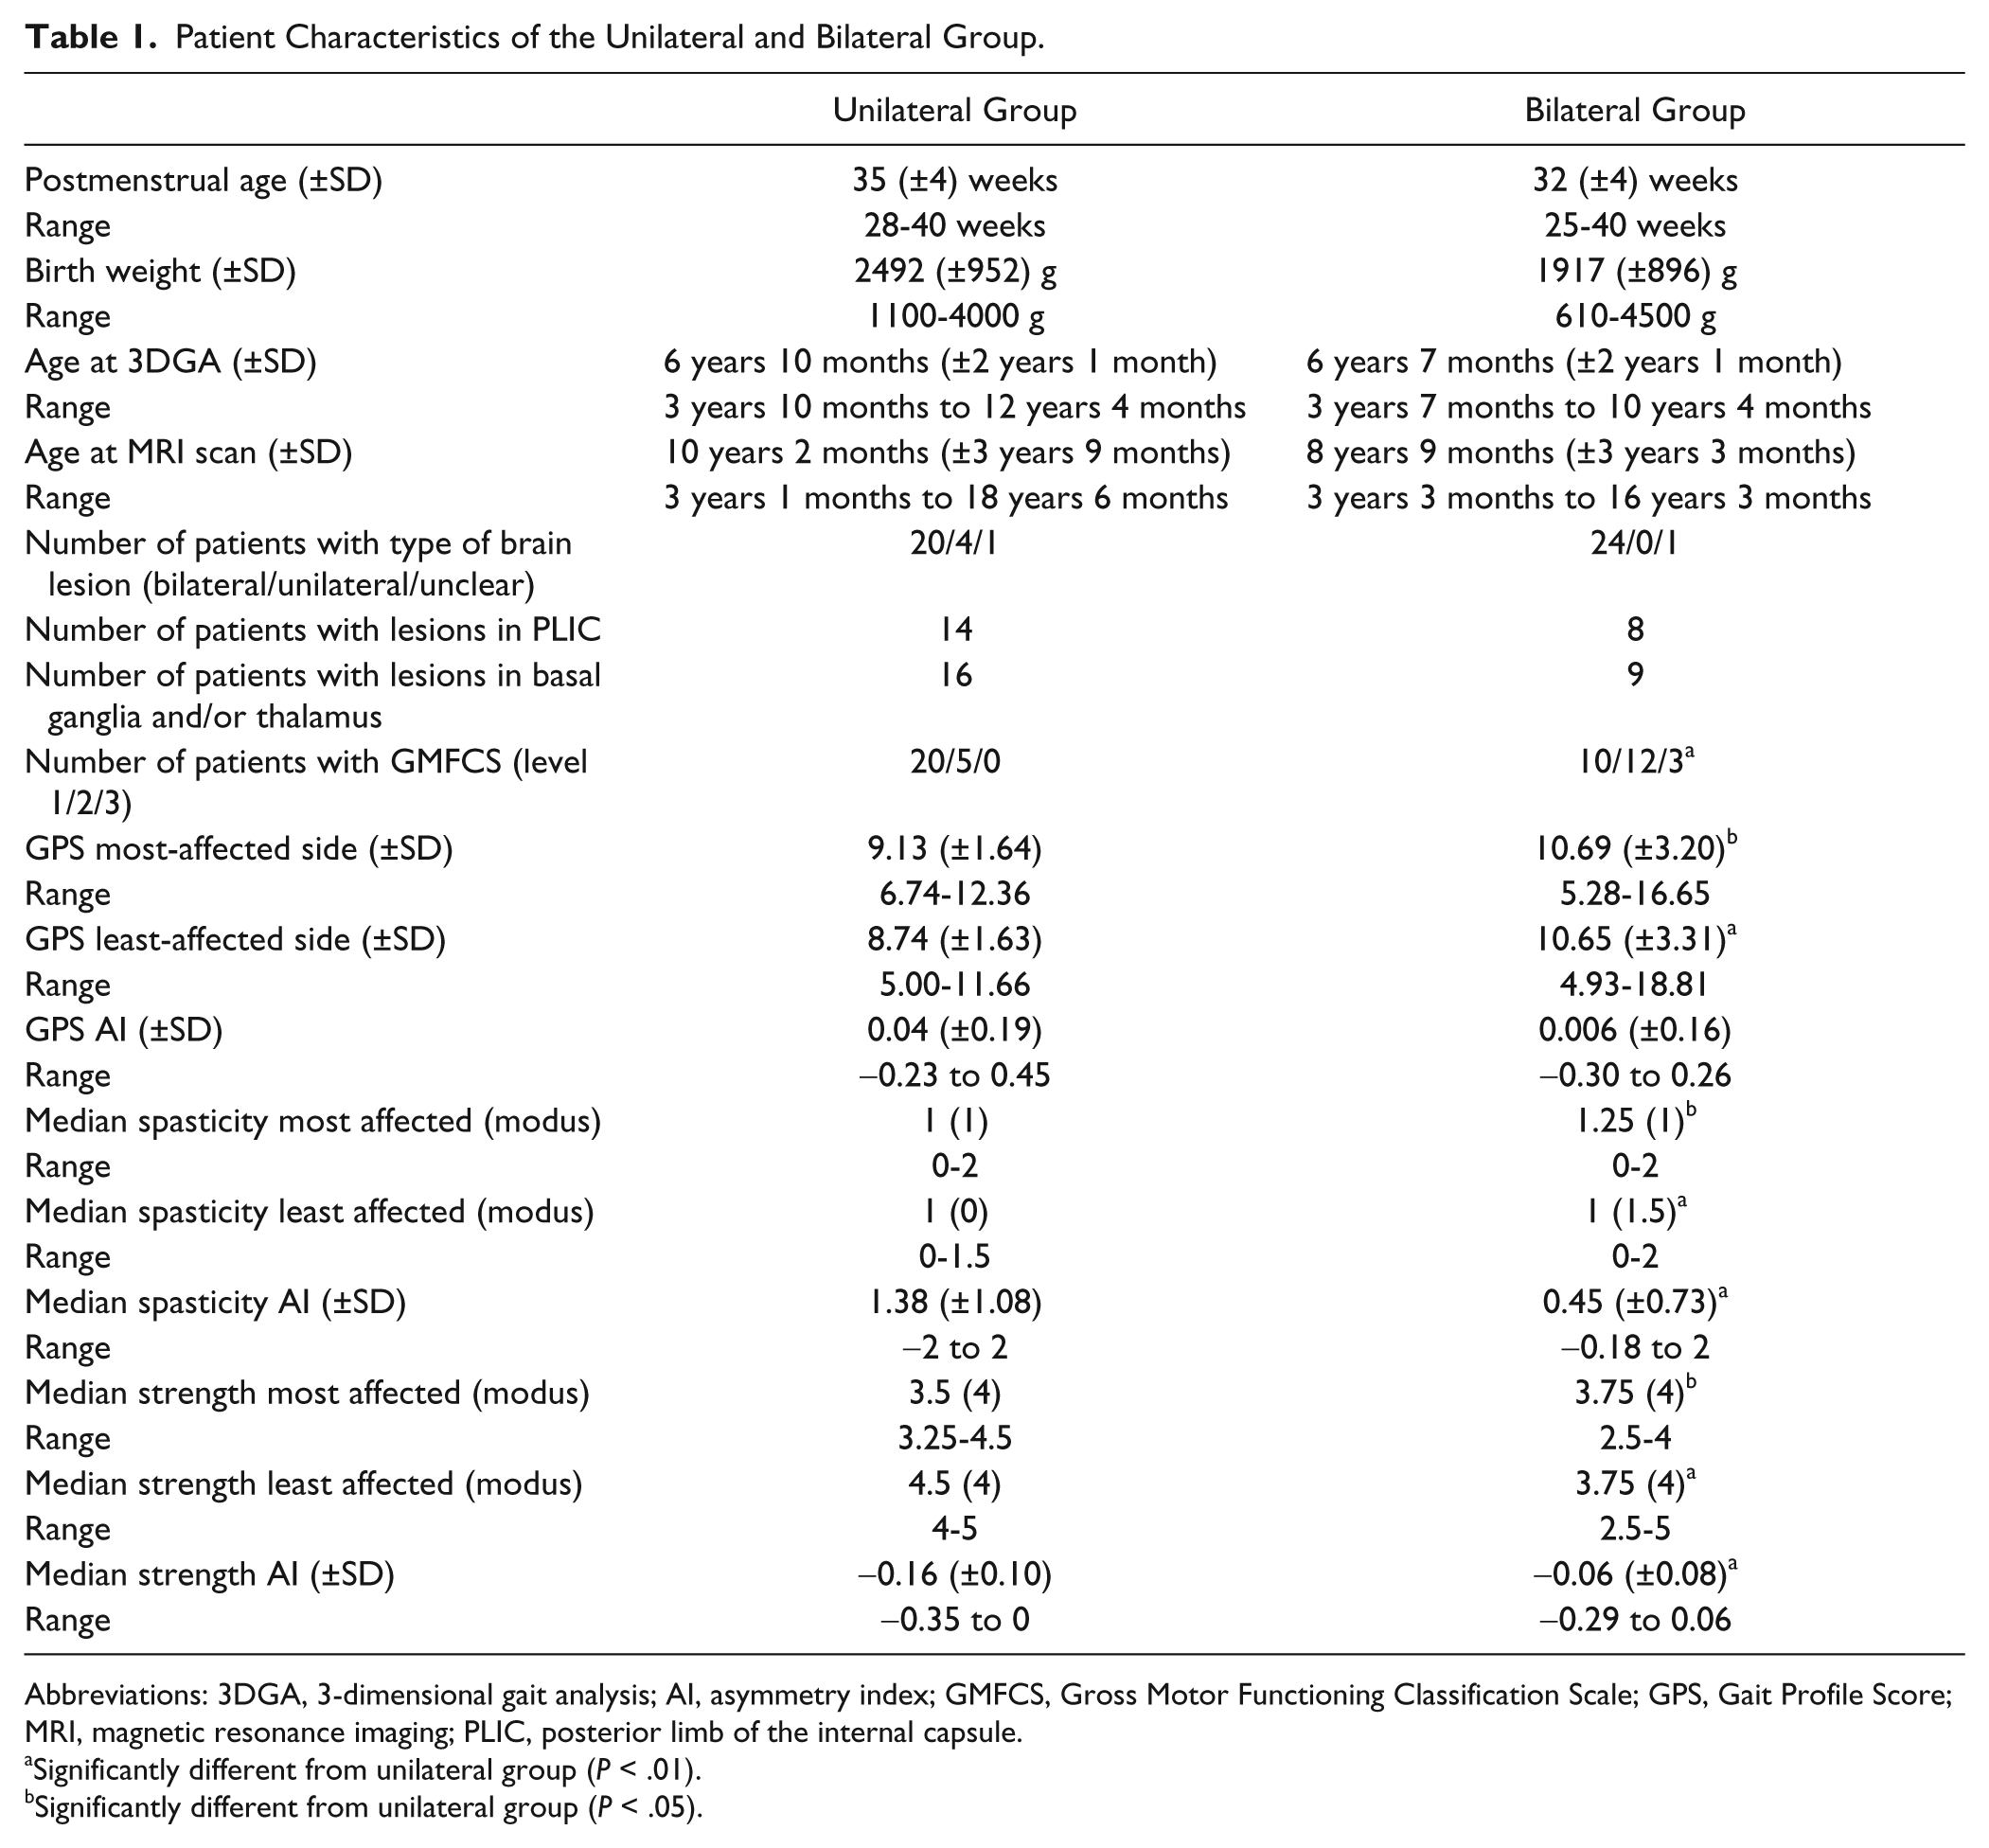
Abbreviations: 3DGA, 3-dimensional gait analysis; AI, asymmetry index; GMFCS, Gross Motor Functioning Classification Scale; GPS, Gait Profile Score; MRI, magnetic resonance imaging; PLIC, posterior limb of the internal capsule.
Significantly different from unilateral group (P < .01).
Significantly different from unilateral group (P < .05).
This study was approved by the local ethical committee, and informed, written consent was obtained from the patients’ parents.
MRI Acquisition
A total of 31 patients were scanned on a 3-T system, and 19 on a 1.5-T system (Philips, Best, Netherlands) using an 8-element SENSE head coil. 3D MPRAGE sequences were obtained with the following parameters on the 3-T system: 182 sagittal slices; FOV = 250 × 250 mm2, voxel size = 0.98 × 0.98 mm2, slice thickness = 1.2 mm, TE = 4.6 ms, TR = 9.7 ms, acquisition time = 6 minutes 23 s. The following parameters were used on the 1.5-T system: 128 sagittal slices, FOV = 256 × 256 mm2, voxel size = 1 × 1 mm2, slice thickness = 1 mm, TE = 3 ms, TR = 20 ms, acquisition time = 4 minutes 34 seconds. DTI data were obtained only from the 3-T scanner and acquired sagittally using a single shot spin echo, echo planar imaging sequence with the following parameters: FOV = 220 × 220mm2, voxel size = 1.96 × 2.0 mm2, 68 contiguous sagittal slices, slice thickness = 2.20 mm, TR = 11.043 ms, TE = 55 ms, acquisition time = 10 minutes 34 seconds. Diffusion gradients were applied in 45 noncollinear directions (b = 800 s/mm2), and 1 non–diffusion weighted image was acquired. 27
MRI Processing
Periventricular leucomalacia is the most common cause of brain abnormalities in sCP. 28 It has been associated with lateral ventricle (LV) dilation, periventricular white matter reduction (especially in the CST at the level of the posterior limb of the internal capsule [PLIC]), and thinning of the CC. 21 Therefore, we focused on these brain areas. Both hemispheres of the participant were evaluated, and they are referred to with respect to the studied limb (eg, the least-affected hemisphere is the hemisphere contralateral to the least-affected lower limb).
The CC is the major interhemispheric commissure of the brain. Its cortical and subcortical connectivity and the wide range of motor functions that it is associated with make the CC a critical structure to assess. Because the CC is not a single body but a complex bundle of fibers with distinct components that act separately, 29 we used the standard Witelson’s classification of the CC 30 to comprehensively explore the relations between the 5 CC subparts and lower-limb deficits and gait performance.
MPRAGE was used to conduct volumetric analyses. CC and LV volume were assessed using MeVisLab. A first preprocessing step consisted of positional standardization of the scans. Scans were realigned according to (1) the anterior commissure–posterior commissure (AC-PC) line in the sagittal plane, (2) the vertical orientation of the interhemispheric fissure in the axial plane, and (3) a vertical line through the interhemispheric fissure and the spinal cord in the coronal plane. 31 Next, the CC and LV were manually delineated (Figure 1). CC was delineated in the midsagittal plane (=plane with AC-PC line) ± 1 slice and automatically parcellated into 5 subparts according to Witelson. 30 The volumes of the total CC and its 5 subparts were calculated. Subsequently, LVs were delineated in the brain volume that includes the PLIC. 32 The volume of the bilaterally delineated LV was calculated.
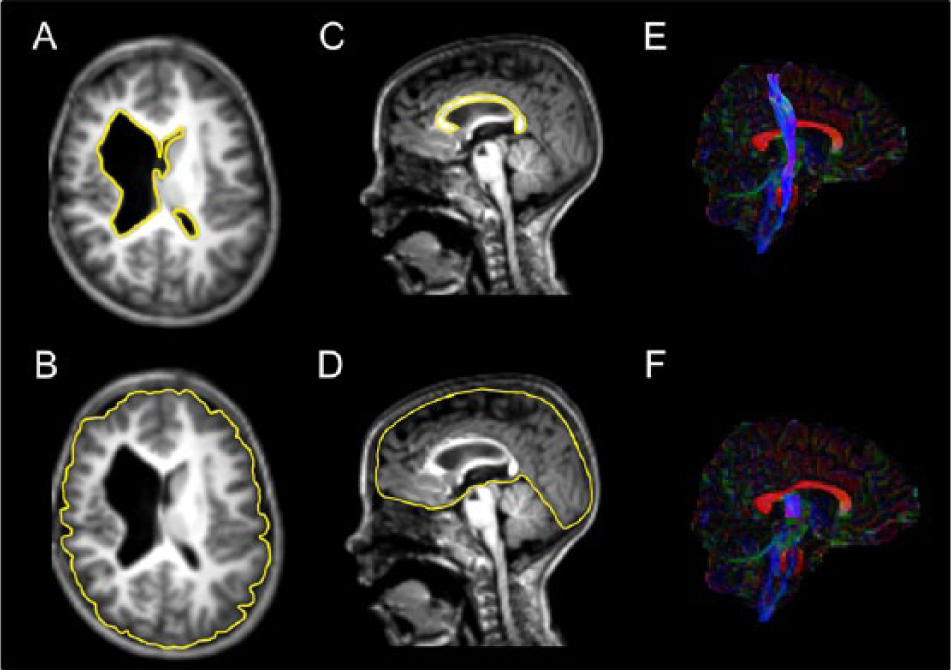
Quantitative markers of microstructural and macrostructural white matter lesions. A. Manually delineated lateral ventricles; only 1 slice is represented. B. Manually delineated cerebrum for normalization of the lateral ventricles; only 1 slice is represented. C. Manually delineated corpus callosum; only the midsagittal slice is represented. D. Manually delineated cerebrum for normalization of the corpus callosum; only the midsagittal slice is represented. E. Reconstructed corticospinal tract. F. Reconstructed corticospinal tract—segment that runs through the posterior limb of the internal capsule.
The cerebrum was manually delineated in the midsagittal ± 1 slice to correct the volumetric data of CC and in the PLIC brain volume to correct the volumetric data of LV (Figure 1).
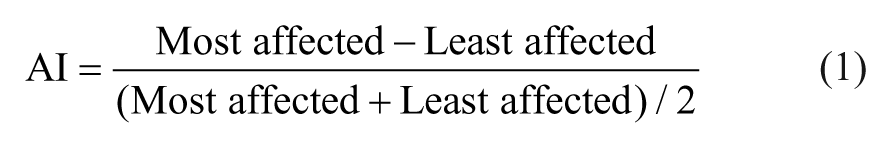
DTI data were processed in ExploreDTI. 33 First, data were visually checked for artifacts. Then, eddy current and participant motion–induced geometrical distortions were corrected. 34 The b-matrix was corrected for the rotational component of participant motion. 27 Two participants were excluded because of interleaving artifacts or a prematurely terminated scanning protocol. MPRAGE data of these participants was not excluded. Next, diffusion tensors, fractional anisotropy (FA), and apparent diffusion coefficients (ADCs) were calculated using nonlinear regression. 35 Deterministic whole-brain fiber tractography 36 was used for each DTI data set with a uniform 1 mm seed point resolution, a 0.2 FA termination threshold, and a 30° angle threshold. 27 Subsequently, regions of interest in each participant were delineated for reconstruction of the CST. 37 The CST was defined between the primary motor cortex and midbrain. Tracking was initiated from the cerebral peduncle, delineated in an axial plane at the level of the decussation of the superior cerebellar peduncle, and the bundles of trajectories that reached the primary motor cortex and central sulcus were identified. Additionally, the segment of the CST that runs through the PLIC (boundaries according to Kawaguchi et al 32 ) was cut from the overall CST (referred to as CSTPLIC) because this area is most often affected in sCP.21,28 One individual was excluded because of the impossibility of tracking the CST. To assess the asymmetry of DTI measures (FA and ADC), an adapted version of the AI according to Bonekamp was determined for both the CST and CSTPLIC 38 :
To exclude the confounding influence of the magnetic field strength, DTI analyses were limited to the 31 children scanned on the 3T system (−3, because their DTI scans were excluded; see flow chart in Appendix A [Figure A.1]). Age and number of days between the brain scan and gait analysis were corrected for by including them as covariates in the statistical model.
We use the term neuroradiological parameters when we refer to DTI measures (FA and ADC of CST and CSTPLIC) and volumetry measures (CC, CC subparts, and LV volume).
Primary Motor Deficits
Lower-limb muscle strength was assessed with the Manual Muscle Testing scale.39,40 The median score of the hip flexors, hip extensors, knee flexors, knee extensors, and ankle dorsiflexors and plantarflexors was calculated for each side. Spasticity was evaluated using the modified Ashworth scale.41,42 Median spasticity score of the hip flexors, hip adductors, knee flexors, knee extensors, and ankle dorsiflexors and plantarflexors was calculated for each side. Furthermore, asymmetry indices were calculated for the median strength and median spasticity using Bonekamp’s adapted formula. 38
Gait
Patients were instructed to walk on a 10-m walkway at self-selected speed. Trajectories of the retro-reflective markers on lower-limb bony landmarks as defined by the Plug-In-Gait model of Vicon (Oxford Metrics, Oxford, UK) were captured with 8 infrared Vicon cameras (100Hz). Two force plates (Advanced Mechanical Technology Inc, Watertown, MA) embedded in the walkway allowed for the calculation of kinetics. Three walking trials with a full kinematics and kinetics profile per lower limb were included per child. Nexus software (Oxford Metrics, Oxford, UK) was used to define gait cycles, calculate spatiotemporal parameters, and estimate joint angles, internal moments, and powers normalized to body mass.
Gait pathology was evaluated with the Gait Profile Score (GPS) representing the root-mean square distance between the movement patterns of the child with sCP and reference movement patterns of typically developing children for each lower limb (joint) separately; the higher the GPS, the more deviated from typical. 43 The GPS has been validated in a pediatric population (such as in sCP) and in patients with Parkinson’s disease.43,44 The GPS scores were averaged per lower limb over the 3 walking trials. Asymmetry scores were calculated using Bonekamp’s adapted formula. 38
Statistics
First, unilateral and bilateral groups of sCP were compared with respect to primary motor deficits and gait performance using χ2 comparisons (for GMFCS), and GLM and Mann-Whitney U tests with Type of sCP as factor for continuous variables (GPS and asymmetry indices) and ordinal variables (median muscle strength and spasticity), respectively. Because the groups were different, statistical analyses were split up according to unilateral/bilateral involvement. Partial Pearson correlations with 2 covariates (age and time between scan and gait analysis) were used to assess the relation between neuroradiological parameters and GPS. Neuroradiological parameters were related to median lower-limb muscle strength and spasticity using Spearman correlations with the same covariates. Additionally, partial Pearson correlations with age as covariate were used to assess the relation between primary lower-limb deficits (spasticity and strength) and gait pathology. An extra covariate (scanner type) was included for the volumetric data to control for the confounding factor of the difference in strength of the magnetic field between the 3-T and 1.5-T scanner. The level of significance was set at α = .05.
Results
Unilateral Versus Bilateral sCP
The unilateral sCP group was overall less affected compared with the bilateral group. More children with unilateral sCP were classified as having a lower level of GMFCS and showed lower median spasticity scores and higher median strength scores compared with the bilateral group (Table 1). Furthermore, GPS scores were significantly lower in the unilateral group, indicating better gait performance than the bilateral group (Table 1).
Primary Motor Deficits in Relation to Gait Pathology
In bilateral sCP (n = 25), GPS on the most-affected side was significantly related to spasticity (r = 0.51, P < .05) and strength (r = −0.57, P < .05) of the same limb. This indicates that higher spasticity and lower strength are associated with reduced gait performance in bilateral sCP.
No significant correlations were found in unilateral sCP (n = 25).
Bilateral Group
Correlations between neuroradiological parameters, gait pathology, and lower-limb motor deficits for bilateral sCP are summarized in Tables 2 and 3 (correlation plots in Appendix A [Figure A.2]).
Partial Pearson and Spearman Correlation Coefficients Between Volumetric Neuroradiological Parameters, Gait Parameters, and Primary Motor Deficits, Respectively, for the Group of sCP Children With Bilateral Involvement (n = 25). a
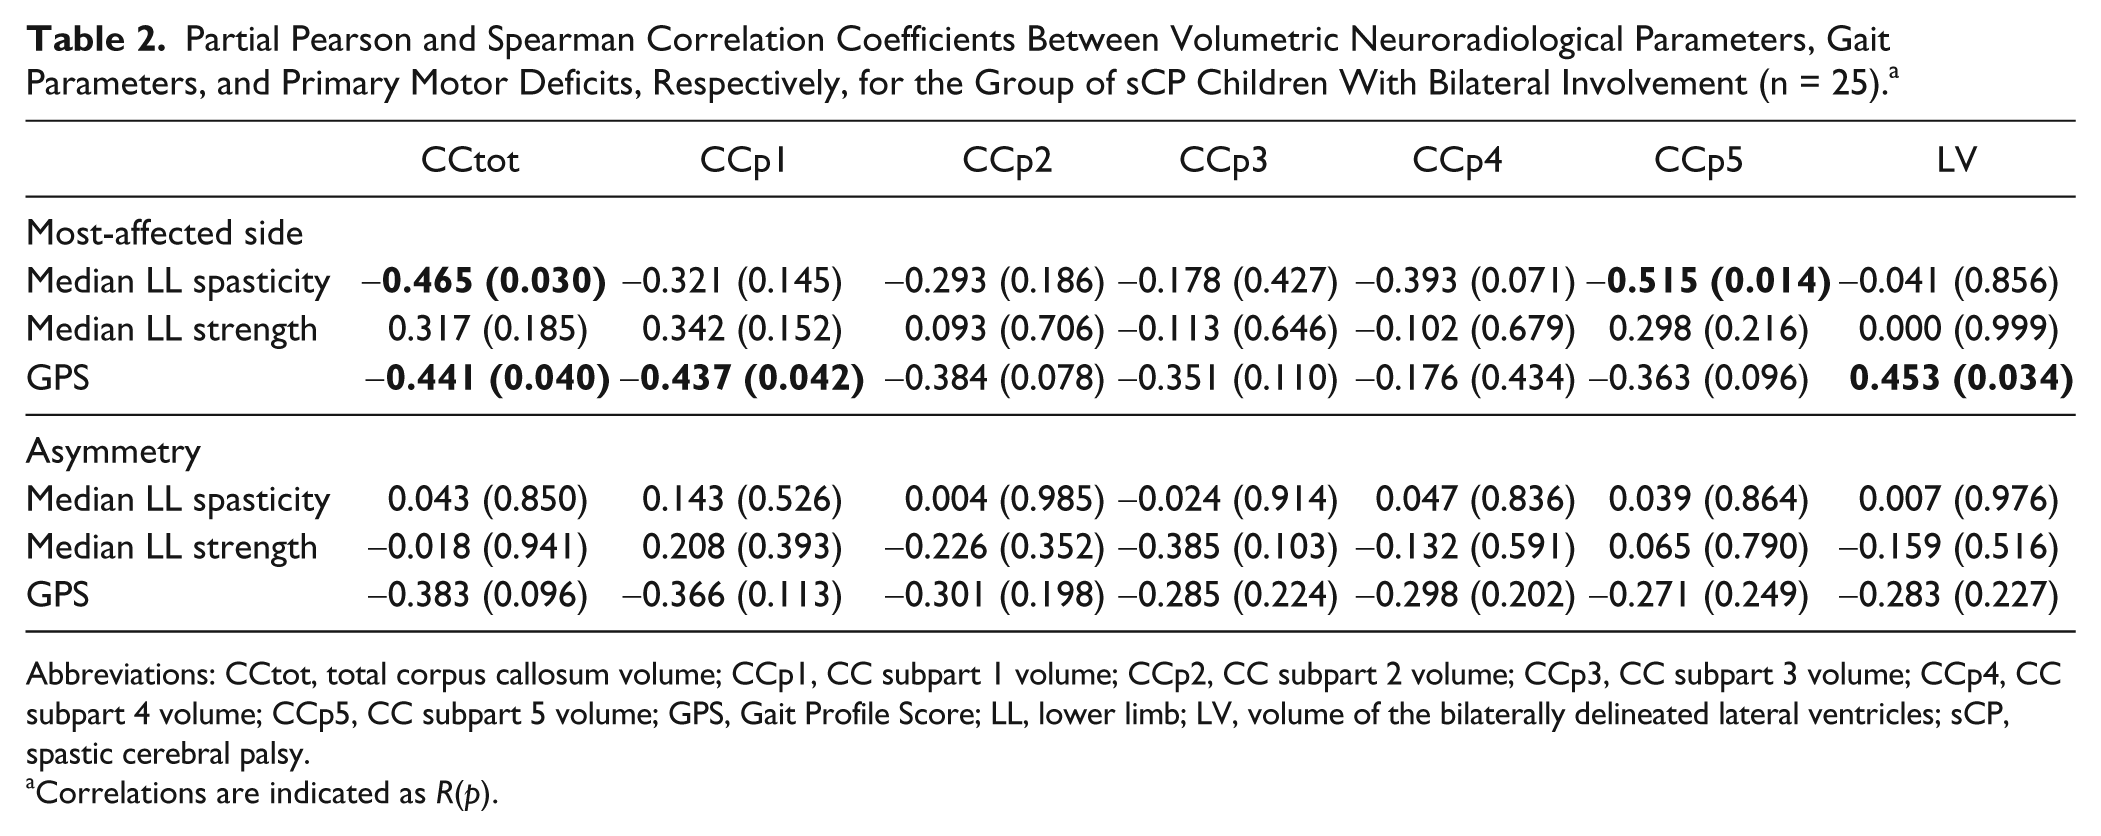
Abbreviations: CCtot, total corpus callosum volume; CCp1, CC subpart 1 volume; CCp2, CC subpart 2 volume; CCp3, CC subpart 3 volume; CCp4, CC subpart 4 volume; CCp5, CC subpart 5 volume; GPS, Gait Profile Score; LL, lower limb; LV, volume of the bilaterally delineated lateral ventricles; sCP, spastic cerebral palsy.
Correlations are indicated as R(p).
Partial Pearson and Spearman Correlation Coefficients Between the DTI Parameters, Gait Parameters, and Primary Motor Deficits, Respectively, for the Group of sCP Children With Bilateral Involvement (n = 13). a
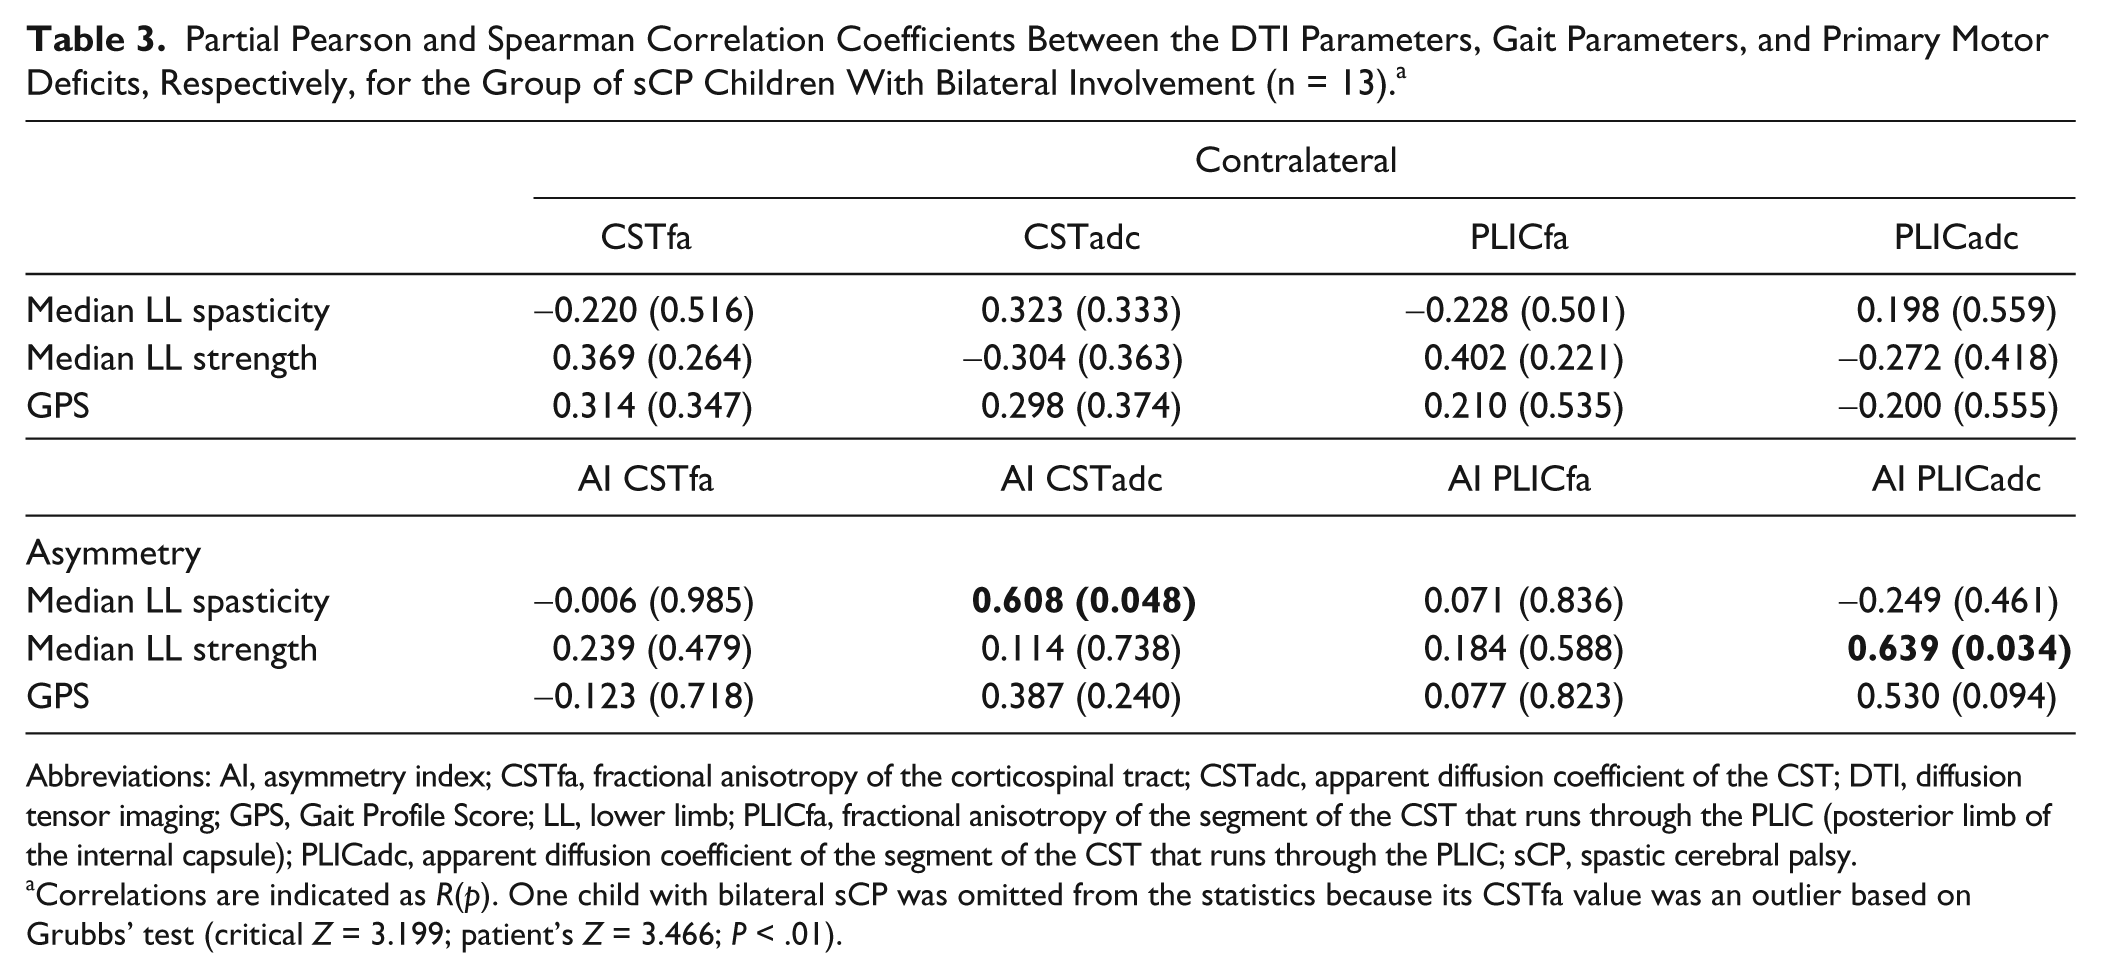
Abbreviations: AI, asymmetry index; CSTfa, fractional anisotropy of the corticospinal tract; CSTadc, apparent diffusion coefficient of the CST; DTI, diffusion tensor imaging; GPS, Gait Profile Score; LL, lower limb; PLICfa, fractional anisotropy of the segment of the CST that runs through the PLIC (posterior limb of the internal capsule); PLICadc, apparent diffusion coefficient of the segment of the CST that runs through the PLIC; sCP, spastic cerebral palsy.
Correlations are indicated as R(p). One child with bilateral sCP was omitted from the statistics because its CSTfa value was an outlier based on Grubbs’ test (critical Z = 3.199; patient’s Z = 3.466; P < .01).
Brain Volume and Primary Motor Deficits/Gait Pathology (Bilateral sCP; n = 25)
Spasticity showed mild/moderate negative correlations with CC volume. Particularly, total CC volume and subpart 5 were negatively related to spasticity, indicating that a higher CC volume of those parts corresponded to less spasticity.
No correlations were found between strength and volumetric measures in bilateral sCP.
For gait performance, mild/moderate negative correlations were found between GPS and volume of total CC and subpart 1—that is, patients with higher volume of these CC parts showed a lower GPS, reflecting a gait pattern closer to typical gait. Furthermore, a moderate/strong positive correlation was found between GPS and LV volume. This means that higher LV volume corresponded to worse gait performance in bilateral sCP.
DTI and Primary Motor Deficits/Gait Pathology (Bilateral sCP; n = 13)
Asymmetry in spasticity was positively and moderately correlated with ADC asymmetry of the CSTs. This means that greater asymmetry in spasticity was related to greater ADC asymmetry of the CSTs.
Asymmetry in strength correlated positively and moderately to ADC asymmetry of the CSTPLICs. Thus, greater asymmetry in strength was associated with a greater ADC asymmetry of the CSTPLICs.
Unilateral Group
Correlations between neuroradiological parameters, gait pathology, and lower-limb motor deficits for unilateral sCP are summarized in Tables 4 and 5 (correlation plots in Appendix A [Figure A.3]).
Partial Pearson and Spearman Correlation Coefficients Between Volumetric Neuroradiological Parameters, Gait Parameters, and Primary Motor Deficits, Respectively, for the Group of sCP Children With Unilateral Involvement (n = 25). a
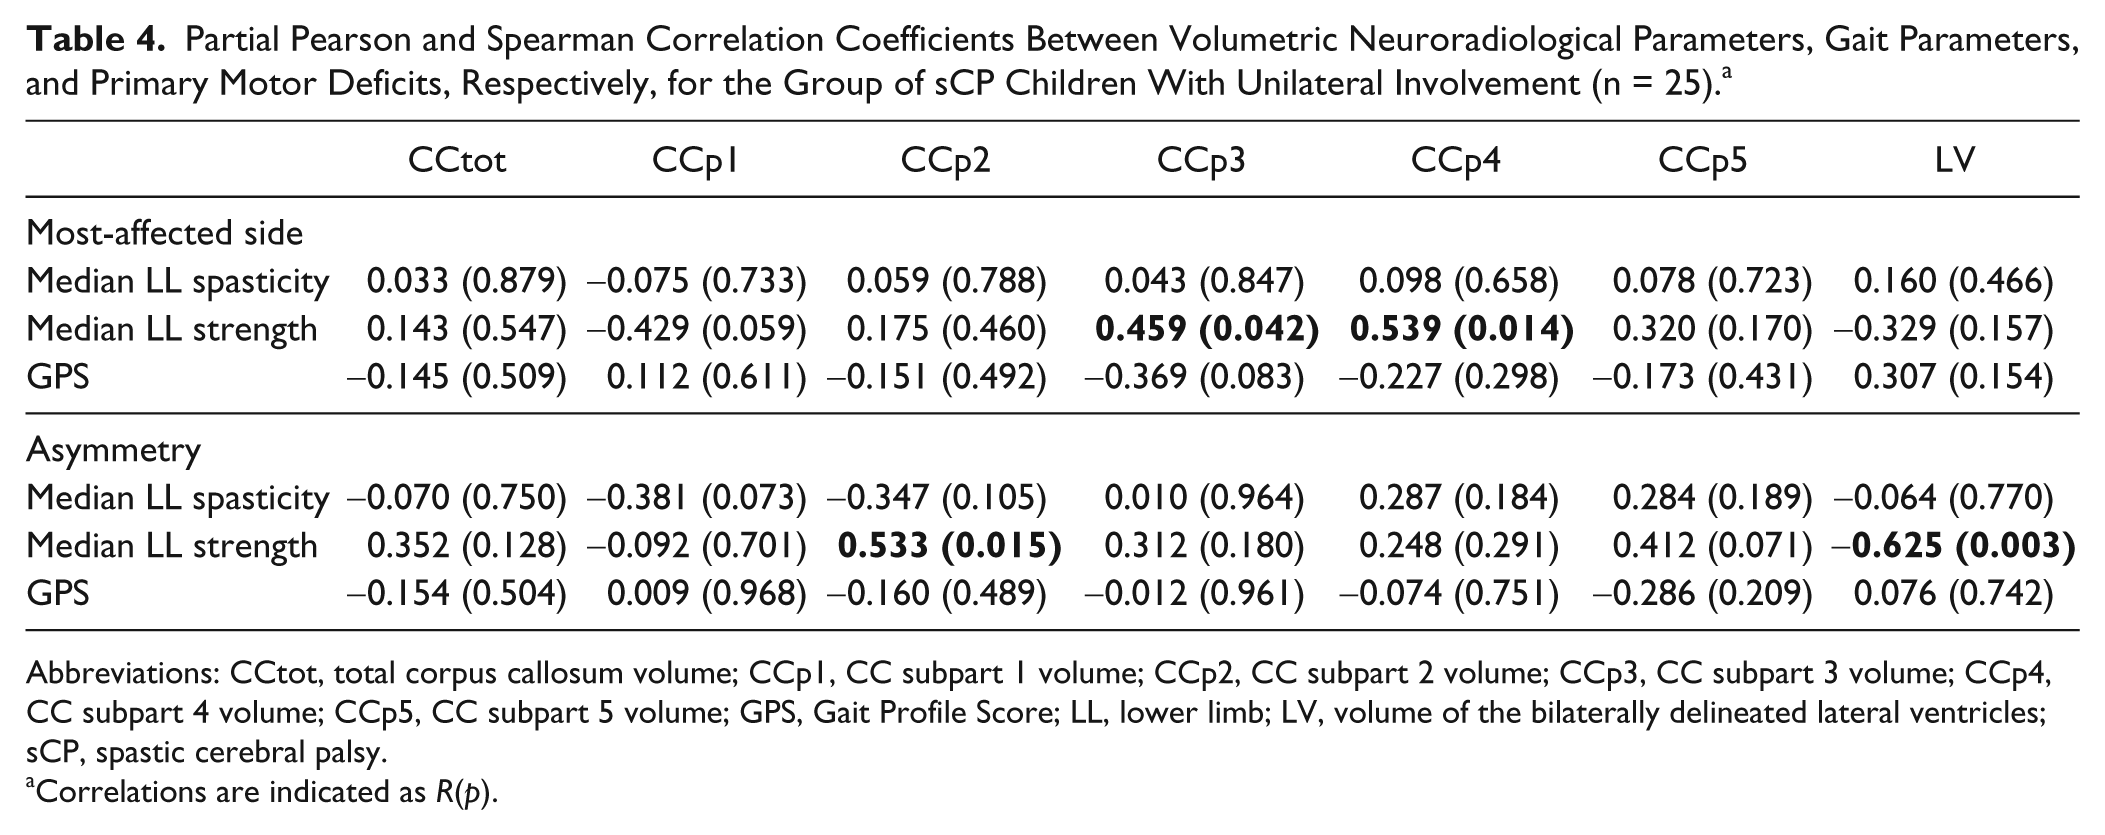
Abbreviations: CCtot, total corpus callosum volume; CCp1, CC subpart 1 volume; CCp2, CC subpart 2 volume; CCp3, CC subpart 3 volume; CCp4, CC subpart 4 volume; CCp5, CC subpart 5 volume; GPS, Gait Profile Score; LL, lower limb; LV, volume of the bilaterally delineated lateral ventricles; sCP, spastic cerebral palsy.
Correlations are indicated as R(p).
Partial Pearson and Spearman Correlation Coefficients Between the DTI Parameters, Gait Parameters, and Primary Motor Deficits (Respectively) for the Group of sCP Children With Unilateral Involvement (n = 14). a
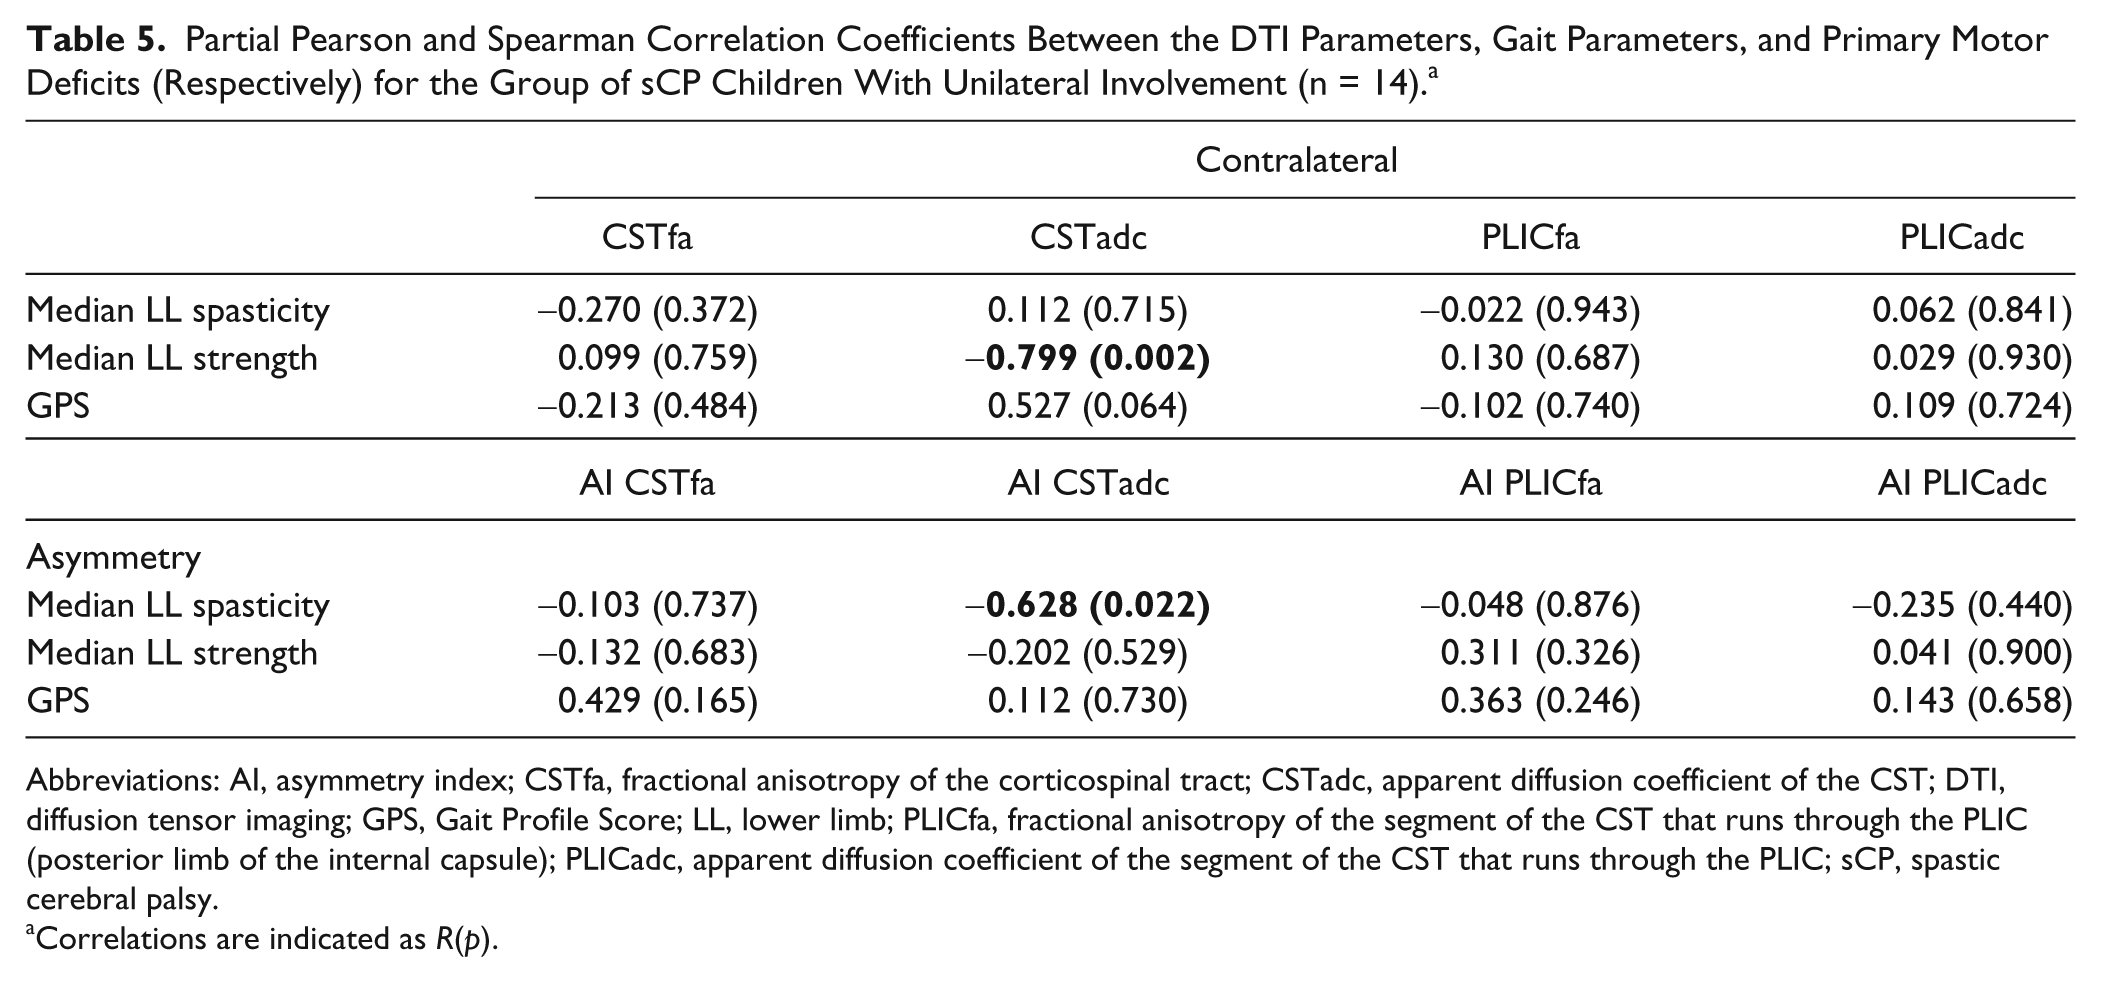
Abbreviations: AI, asymmetry index; CSTfa, fractional anisotropy of the corticospinal tract; CSTadc, apparent diffusion coefficient of the CST; DTI, diffusion tensor imaging; GPS, Gait Profile Score; LL, lower limb; PLICfa, fractional anisotropy of the segment of the CST that runs through the PLIC (posterior limb of the internal capsule); PLICadc, apparent diffusion coefficient of the segment of the CST that runs through the PLIC; sCP, spastic cerebral palsy.
Correlations are indicated as R(p).
Brain Volume and Primary Motor Deficits/Gait Pathology (Unilateral sCP; n = 25)
Significant positive correlations were found between strength and CC volume of subparts 3 and 4. This indicates an association between higher strength and greater CC volume of subparts 3 and 4. LV volume correlated negatively with strength asymmetry, which suggests that higher LV volume coincided with a more negative strength asymmetry (higher asymmetry). Furthermore, strength asymmetry was positively correlated to CC volume of subpart 2, which means that less asymmetry in strength (less negative asymmetry) was also accompanied by higher volume of this CC part.
DTI and Primary Motor Deficits/Gait Pathology (Unilateral sCP; n = 14)
A significant negative correlation was found between strength and ADC of the CST on the contralateral side. This means that weaker strength coincided with higher ADC of the CST on the contralateral side.
The asymmetry of spasticity was negatively correlated to ADC asymmetry of the CSTs because greater asymmetry in spasticity was associated with less asymmetry of ADC of the CST.
Discussion
This is the first explorative study that combined volumetric and DTI data in bilateral and unilateral sCP, aiming to identify potential relations with primary lower-limb deficits and gait pathology in sCP. The results revealed associations between lower-limb motor functioning and the volume of (parts) of the CC and the LVs. Moreover, asymmetry in lower-limb motor functioning was related to asymmetry in diffusion measures. However, the associations differed considerably between the two sCP groups.
Bilateral Group
Gait pathology was significantly related to the primary motor deficits in sCP children with bilateral involvement. This suggests that lower-limb spasticity and strength contribute to the atypical gait pattern in these children, which highlights the importance of taking these primary motor deficits into account when studying the underlying mechanisms of gait pathology in sCP.
Both lower-limb spasticity and GPS correlated moderately to the volume of the CC and its subparts, indicating that reduced CC volumes relate to increased spasticity and (more) pathological gait. More specifically, lower-limb spasticity was related to volume of subpart 5 of the CC. This highlights a potential role of the tracts running through this CC part in spasticity regulation. According to Witelson, 30 mainly occipital and inferior temporal projections run through CC subpart 5, whereas Hofer and Frahm 45 additionally assign parietal fibers to this subpart. Because none of these tracts have previously been reported as important actors in lower-limb spasticity in sCP, further research is needed to confirm this relationship.
The highest correlation with gait pathology (GPS) was found for CC subpart 1; that is, lower volume of CC subpart 1 related to increased gait pathology. Subpart 1 of the CC mainly contains prefrontal and premotor tracts according to Hofer and Frahm, 45 whereas Witelson 30 found prefrontal, premotor, and supplementary motor projections running through this subpart. Functional imaging studies revealed strong activity in these 3 regions for actual and imagined walking.46-49 The premotor tracts are mainly involved in visually driven movements and preparation of movement, 50 whereas the supplementary motor cortex specifically controls internally driven sequential motor acts.51,52 Lesions in the supplementary motor area have been reported to lead to reduced spontaneous motor activity and a reduction in movements to command. 53 Hence, it is not surprising that disruptions in these white matter connections likely play a significant role in the (worse) gait performance in sCP.
Interestingly, we found a higher volume of the LVs to be moderately related to increased gait pathology. Because the volume of the LV was assessed in the PLIC volume of the brain, this parameter was expected to reflect the (compromised) integrity of white matter tracts running through the PLIC (including the CST). However, we did not find a correlation between asymmetry in white matter tract measures of CSTPLIC and asymmetry in GPS.
In contrast, we did find that asymmetry in lower-limb muscle strength and spasticity was moderately related to ADC asymmetry of the CSTPLIC and CST, respectively. This shows that larger asymmetry in CST integrity (of the PLIC portion) was reflected in larger asymmetry in primary lower-limb motor deficits. Additionally, the lower-limb motor deficits most likely (partially) increased gait pathology, as indicated by the correlations between gait pathology and lower-limb motor deficits. This suggests that the increased volume of the LVs, as assessed in the PLIC volume, compromises the integrity of the white matter tracts running through the PLIC, which in turn significantly affects the primary lower-limb motor deficits and hence negatively affects gait performance.
Overall, we can conclude that in bilateral sCP, asymmetry in the central nervous system seems closely mirrored by asymmetry in lower-limb motor performance.
Unilateral Group
In the unilateral group, the CC seems to play an important role in motor functioning because 3 of its subparts were related to lower-limb muscle strength. Lower volumes of CC subparts 3 and 4 correlated moderately with weaker lower-limb strength. Furthermore, lower volumes of subpart 2 also correlated with more asymmetry in muscle strength (with lower strength on the affected side). These results show that lower-limb strength in unilateral sCP is (at least partly) dependent on the integrity of sensorimotor-related parts of the CC because subpart 2 is known to contain premotor and supplementary motor tracts, subpart 3 contains somaesthetic and posterior parietal motor projections, and subpart 4 contains posterior parietal and superior temporal sensory projections.30,45 These parcellations indicate that—besides motor fibers—also sensory/sensorimotor fibers seem to play an important role in lower-limb motor function. Hoon et al 54 already stressed the importance of sensory fibers in motor performance of children with sCP because they found that lesions in sensory fibers affect sCP more severely than lesions in motor fibers. 55 This was later confirmed in a study, where it was found that lesions in sensory fibers correlated to sensorimotor performance in sCP, in contrast to lesions in the CST. 20 The latter finding is challenged in the current study because we did find a strong correlation between ADC of the CST and lower-limb strength. Moreover, the moderately high correlation between volume of the (dilated) LVs and asymmetry in lower-limb strength further confirms this relation because as a result of the reduction in white matter (ie, periventricular leucomalacia), enlargement of the LVs is often present, which was significantly related to lower-limb strength. In conclusion, based on our findings, motor fibers (such as the CST) should not be completely disregarded, and future research should focus on both motor and sensory fibers when unraveling the relation between brain lesions and motor performance in sCP.
In contrast to the results in bilateral sCP, no relevant correlations were found for lower-limb spasticity or GPS in unilateral sCP. Statistical analysis did highlight one significant but clinically contradictory negative correlation between asymmetry in lower-limb spasticity and ADC asymmetry of the CST, which would mean that high ADC asymmetry of the CST coincides with low asymmetry in lower-limb spasticity. We believe, however, that this controversial correlation was most likely related to the ordinal evaluation scale for spasticity that was applied for this study. Post hoc analysis also revealed a positively skewed distribution. This advocates the use of instrumented spasticity assessments, which also is a promising tool to predict botulinum toxin treatment response in sCP. 56
Concluding Remarks
A number of quantitative neuroradiological parameters were related to gait pathology or one of the underlying primary motor deficits in children with sCP. This underpins the hypothesis of Hoon et al, 20 who indicated that the combined influence of multiple brain lesions might explain a large part of the clinical presentation of sCP. One should take into account that this was an exploratory study in which a comprehensive approach was applied to evaluate both macrostructural and microstructural integrity of multiple brain areas and structures aiming to highlight potential relations with lower-limb motor outcome in sCP, in which we did not correct for multiple comparisons. Overall, the correlations found were modest, underscoring the complexity of the anatomy-behavior relationship. Future research should focus on the neuroanatomy markers highlighted in this study, and in-depth and more complex, multiregion analyses into their relationship with lower-limb motor functioning should be conducted.
We did not emphasize the difference between the 2 sCP groups because the unilateral group was less affected than the bilateral group (in terms of GPS, spasticity, strength, and GMFCS level; Table 1). Interestingly, all relevant correlations in unilateral sCP indicated a relation between brain lesions and lower-limb muscle strength. In bilateral sCP, only a very limited number of relevant correlations were found for lower-limb muscle strength, but more relevant correlations were documented for lower-limb spasticity. The relatively lighter motor pathology of the unilateral group might have resulted in muscle weakness being the dominant underlying primary problem, whereas in the bilateral group, lower-limb spasticity might have been the primary problem dominating the motor pathology. In the bilateral group, this proposition is corroborated by the similarity in results between spasticity and gait pathology (ie, total CC volume correlated negatively with lower-limb spasticity and GPS). In unilateral sCP, however, no significant correlations between gait pathology and lower-limb motor deficits could confirm our proposition. It is possible that because the unilateral group was less affected (based on GMFCS), other deficits (than currently measured) affected their gait pathology, such as gait stability,15,16 the coordination of the limbs, 57 or the effect of altered arm movements.16,58 It is important to note that most of the children in the unilateral sCP group had bilateral brain lesions. These children (unilateral sCP with bilateral brain lesions) might have different relations between lower-limb functioning and macrostructural/microstructural brain integrity when compared with their peers with unilateral lesions. Further research (with a larger sample size of both groups) is required to confirm or refute this hypothesis and whether the ipsilateral projections could be the explanation for the possible difference between these subgroups and the bilateral sCP group. Additionally, differences found between unilateral and bilateral sCP in the relations between the neuroradiological parameters and gait performance/lower-limb deficits might have been influenced by the number of children with basal ganglia and/or thalamus lesions (Table 1). Further investigations with increased sample sizes (of children with and without lesions in the basal ganglia and thalamus) and specific focus on the subcortical structures are suggested to examine this effect.
Unexpectedly, we did not find a relation between FA of the CST or CSTPLIC and primary lower-limb motor deficits or gait performance (whereas we did for the ADC values). A possible explanation for these nonsignificant relations could be that a minority of the included children had an affected PLIC. Other studies also did not find a relation between motor outcome and CST integrity. For instance Hoon et al 54 indicate that the sensory tracts have a more important role in this respect than motor pathways. Another explanation could be that the interaction between motor and sensory tracts explains motor outcome more. 20
In this study, only prepubertal children (age 3 to 12 years) were enrolled to exclude the possible effects of growth spurt. This wide age range, on the other hand, might have introduced some variability because children between 3 and 5 years old can be characterized by an inconsistent gait pattern, whereas the gait pattern of children between 10 and 12 years old might have been influenced somewhat more by secondary deformations such as lever arm dysfunctions. 59 We did, however, account for age and difference in age between the brain scan and gait analysis in our statistical model. Similarly, the use of the Manual Muscle Testing scale might have introduced some additional variability because it is difficult to assess isolated/analytical movements in children, especially in very young children. This test, however, is routinely used in the university hospital Leuven and was performed by experienced clinicians.
In conclusion, the correlations found in this study offer interesting new insights into the complex interplay between central nervous system integrity and motor performance in children with sCP. Future studies should focus on (1) comprehensively evaluating multiple (motor and sensory) areas in the brain and (2) relating them to motor performance in larger (multicenter) groups of unilateral and bilateral sCP with similar variability in motor functioning.
Footnotes
Appendix A
Individual Characteristics of All Included Patients.
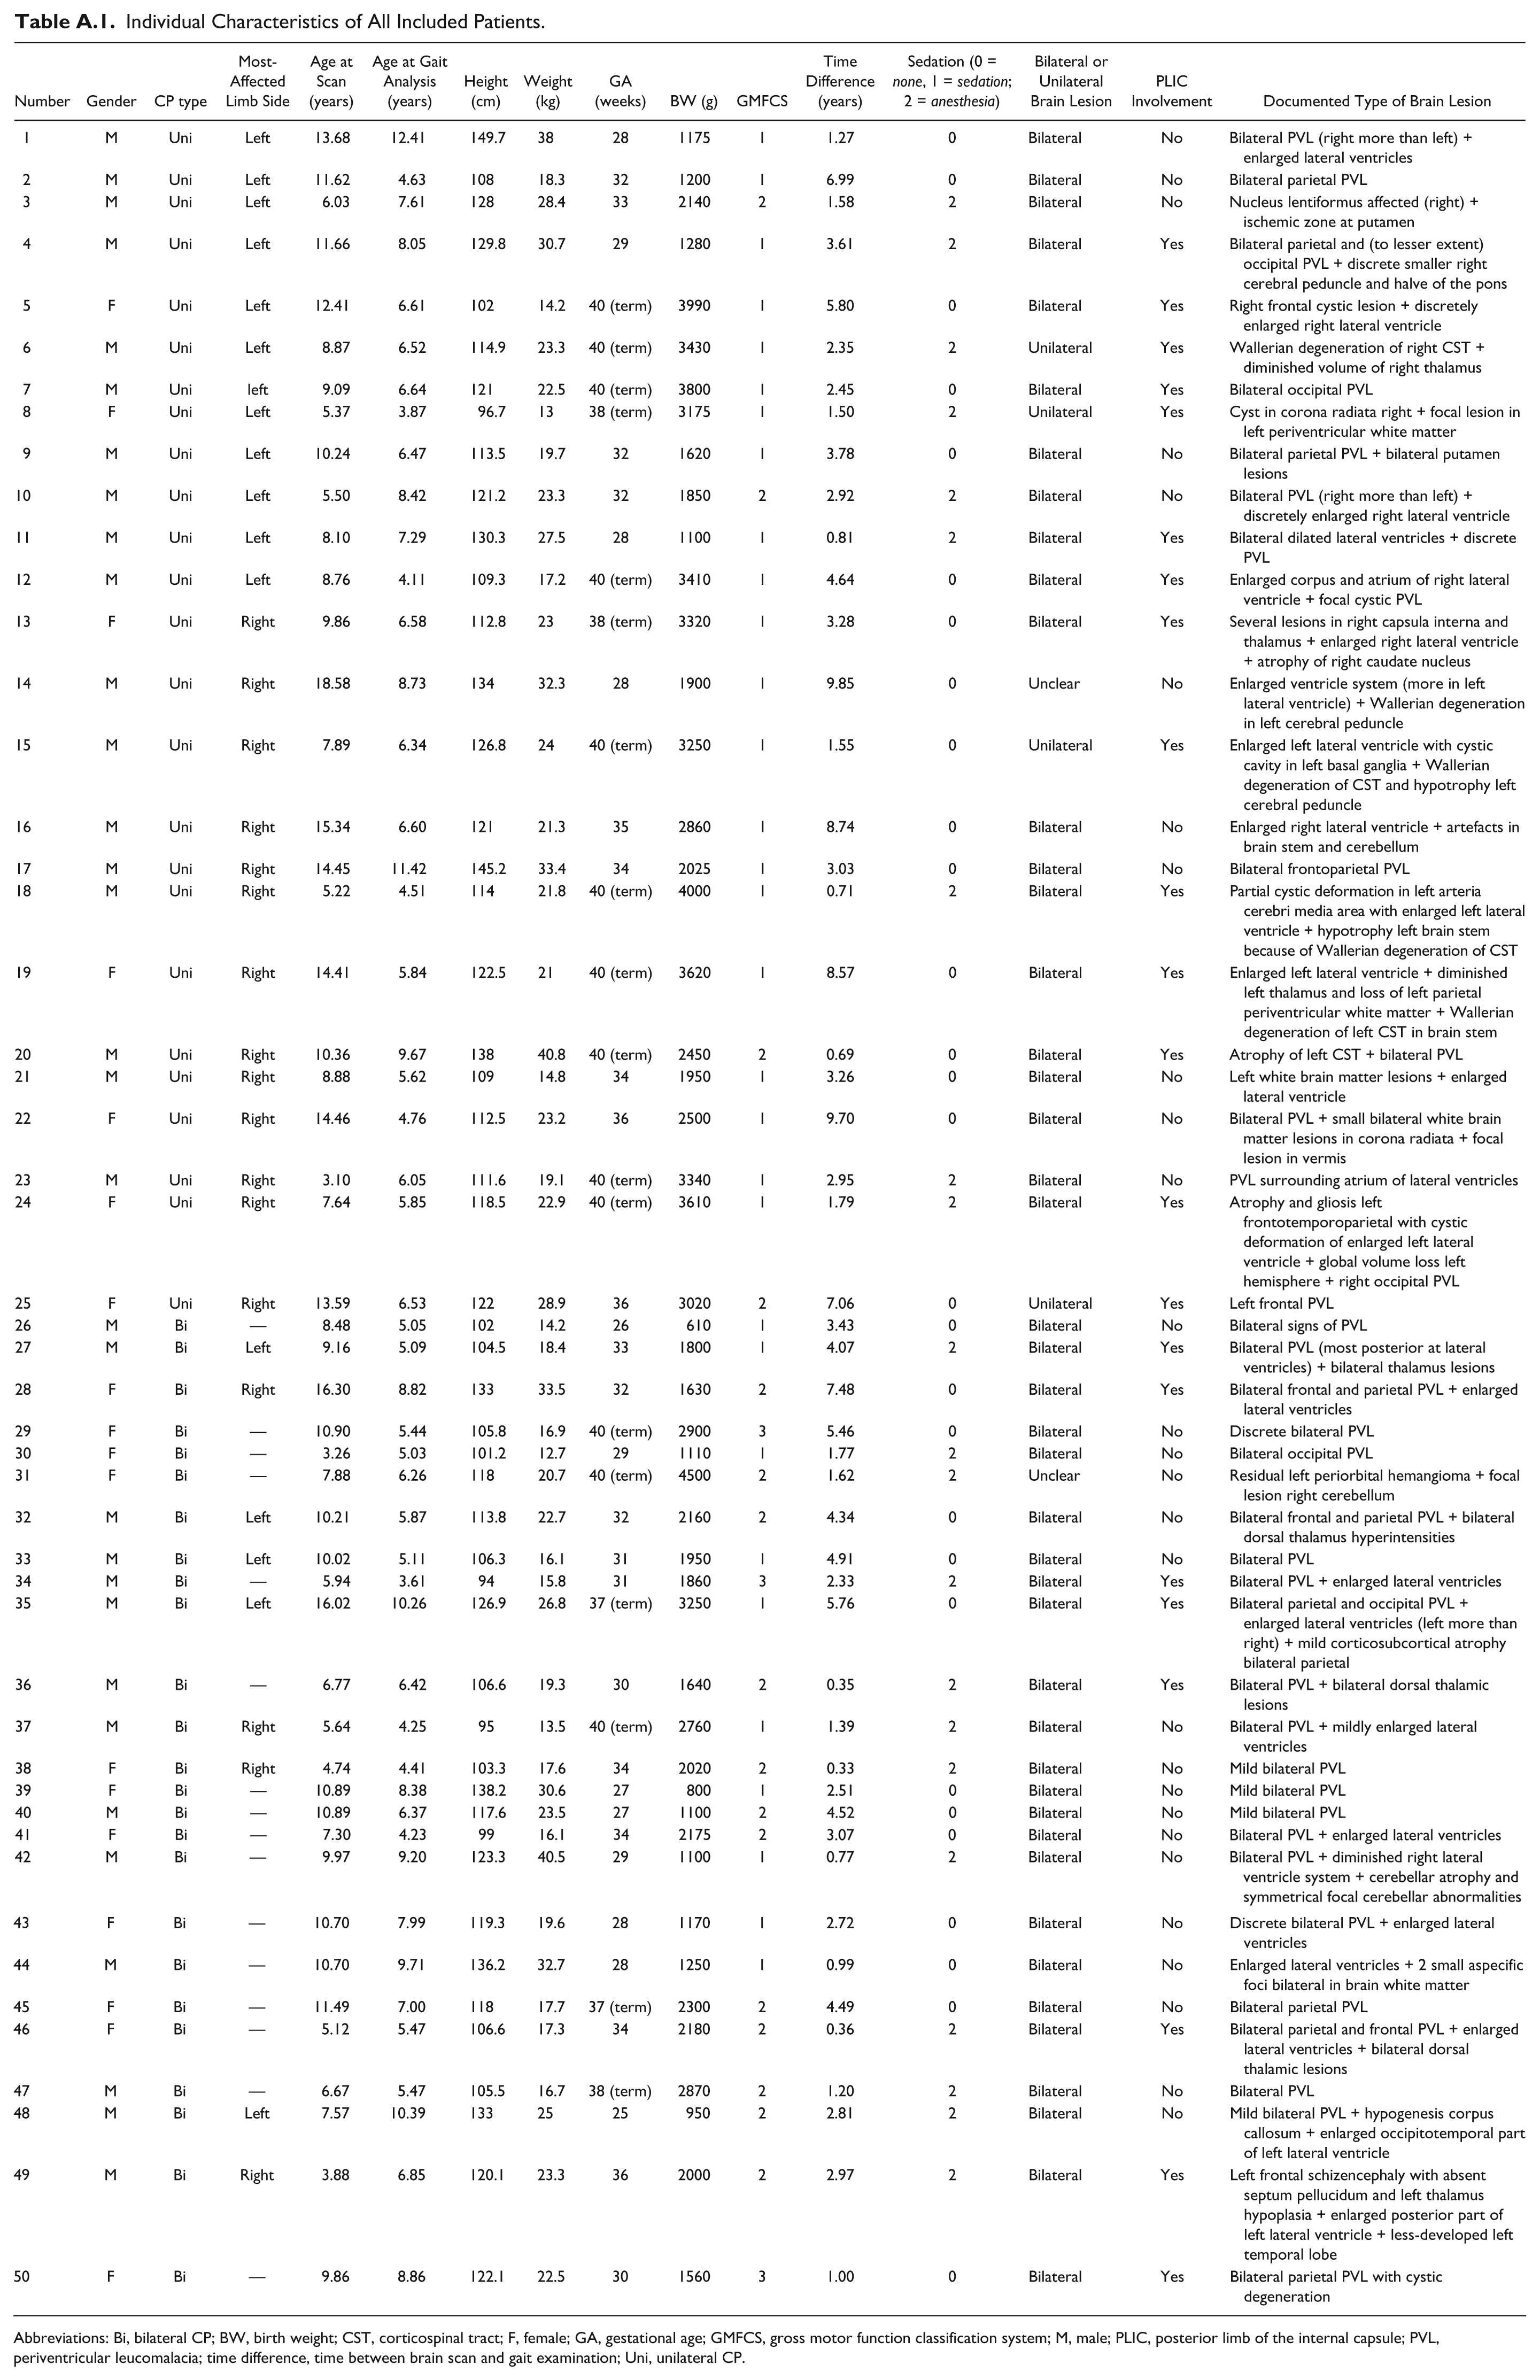
| Number | Gender | CP type | Most-Affected Limb Side | Age at Scan (years) | Age at Gait Analysis (years) | Height (cm) | Weight (kg) | GA (weeks) | BW (g) | GMFCS | Time Difference (years) | Sedation (0 = none, 1 = sedation; 2 = anesthesia) | Bilateral or Unilateral Brain Lesion | PLIC Involvement | Documented Type of Brain Lesion |
|---|---|---|---|---|---|---|---|---|---|---|---|---|---|---|---|
| 1 | M | Uni | Left | 13.68 | 12.41 | 149.7 | 38 | 28 | 1175 | 1 | 1.27 | 0 | Bilateral | No | Bilateral PVL (right more than left) + enlarged lateral ventricles |
| 2 | M | Uni | Left | 11.62 | 4.63 | 108 | 18.3 | 32 | 1200 | 1 | 6.99 | 0 | Bilateral | No | Bilateral parietal PVL |
| 3 | M | Uni | Left | 6.03 | 7.61 | 128 | 28.4 | 33 | 2140 | 2 | 1.58 | 2 | Bilateral | No | Nucleus lentiformus affected (right) + ischemic zone at putamen |
| 4 | M | Uni | Left | 11.66 | 8.05 | 129.8 | 30.7 | 29 | 1280 | 1 | 3.61 | 2 | Bilateral | Yes | Bilateral parietal and (to lesser extent) occipital PVL + discrete smaller right cerebral peduncle and halve of the pons |
| 5 | F | Uni | Left | 12.41 | 6.61 | 102 | 14.2 | 40 (term) | 3990 | 1 | 5.80 | 0 | Bilateral | Yes | Right frontal cystic lesion + discretely enlarged right lateral ventricle |
| 6 | M | Uni | Left | 8.87 | 6.52 | 114.9 | 23.3 | 40 (term) | 3430 | 1 | 2.35 | 2 | Unilateral | Yes | Wallerian degeneration of right CST + diminished volume of right thalamus |
| 7 | M | Uni | left | 9.09 | 6.64 | 121 | 22.5 | 40 (term) | 3800 | 1 | 2.45 | 0 | Bilateral | Yes | Bilateral occipital PVL |
| 8 | F | Uni | Left | 5.37 | 3.87 | 96.7 | 13 | 38 (term) | 3175 | 1 | 1.50 | 2 | Unilateral | Yes | Cyst in corona radiata right + focal lesion in left periventricular white matter |
| 9 | M | Uni | Left | 10.24 | 6.47 | 113.5 | 19.7 | 32 | 1620 | 1 | 3.78 | 0 | Bilateral | No | Bilateral parietal PVL + bilateral putamen lesions |
| 10 | M | Uni | Left | 5.50 | 8.42 | 121.2 | 23.3 | 32 | 1850 | 2 | 2.92 | 2 | Bilateral | No | Bilateral PVL (right more than left) + discretely enlarged right lateral ventricle |
| 11 | M | Uni | Left | 8.10 | 7.29 | 130.3 | 27.5 | 28 | 1100 | 1 | 0.81 | 2 | Bilateral | Yes | Bilateral dilated lateral ventricles + discrete PVL |
| 12 | M | Uni | Left | 8.76 | 4.11 | 109.3 | 17.2 | 40 (term) | 3410 | 1 | 4.64 | 0 | Bilateral | Yes | Enlarged corpus and atrium of right lateral ventricle + focal cystic PVL |
| 13 | F | Uni | Right | 9.86 | 6.58 | 112.8 | 23 | 38 (term) | 3320 | 1 | 3.28 | 0 | Bilateral | Yes | Several lesions in right capsula interna and thalamus + enlarged right lateral ventricle + atrophy of right caudate nucleus |
| 14 | M | Uni | Right | 18.58 | 8.73 | 134 | 32.3 | 28 | 1900 | 1 | 9.85 | 0 | Unclear | No | Enlarged ventricle system (more in left lateral ventricle) + Wallerian degeneration in left cerebral peduncle |
| 15 | M | Uni | Right | 7.89 | 6.34 | 126.8 | 24 | 40 (term) | 3250 | 1 | 1.55 | 0 | Unilateral | Yes | Enlarged left lateral ventricle with cystic cavity in left basal ganglia + Wallerian degeneration of CST and hypotrophy left cerebral peduncle |
| 16 | M | Uni | Right | 15.34 | 6.60 | 121 | 21.3 | 35 | 2860 | 1 | 8.74 | 0 | Bilateral | No | Enlarged right lateral ventricle + artefacts in brain stem and cerebellum |
| 17 | M | Uni | Right | 14.45 | 11.42 | 145.2 | 33.4 | 34 | 2025 | 1 | 3.03 | 0 | Bilateral | No | Bilateral frontoparietal PVL |
| 18 | M | Uni | Right | 5.22 | 4.51 | 114 | 21.8 | 40 (term) | 4000 | 1 | 0.71 | 2 | Bilateral | Yes | Partial cystic deformation in left arteria cerebri media area with enlarged left lateral ventricle + hypotrophy left brain stem because of Wallerian degeneration of CST |
| 19 | F | Uni | Right | 14.41 | 5.84 | 122.5 | 21 | 40 (term) | 3620 | 1 | 8.57 | 0 | Bilateral | Yes | Enlarged left lateral ventricle + diminished left thalamus and loss of left parietal periventricular white matter + Wallerian degeneration of left CST in brain stem |
| 20 | M | Uni | Right | 10.36 | 9.67 | 138 | 40.8 | 40 (term) | 2450 | 2 | 0.69 | 0 | Bilateral | Yes | Atrophy of left CST + bilateral PVL |
| 21 | M | Uni | Right | 8.88 | 5.62 | 109 | 14.8 | 34 | 1950 | 1 | 3.26 | 0 | Bilateral | No | Left white brain matter lesions + enlarged lateral ventricle |
| 22 | F | Uni | Right | 14.46 | 4.76 | 112.5 | 23.2 | 36 | 2500 | 1 | 9.70 | 0 | Bilateral | No | Bilateral PVL + small bilateral white brain matter lesions in corona radiata + focal lesion in vermis |
| 23 | M | Uni | Right | 3.10 | 6.05 | 111.6 | 19.1 | 40 (term) | 3340 | 1 | 2.95 | 2 | Bilateral | No | PVL surrounding atrium of lateral ventricles |
| 24 | F | Uni | Right | 7.64 | 5.85 | 118.5 | 22.9 | 40 (term) | 3610 | 1 | 1.79 | 2 | Bilateral | Yes | Atrophy and gliosis left frontotemporoparietal with cystic deformation of enlarged left lateral ventricle + global volume loss left hemisphere + right occipital PVL |
| 25 | F | Uni | Right | 13.59 | 6.53 | 122 | 28.9 | 36 | 3020 | 2 | 7.06 | 0 | Unilateral | Yes | Left frontal PVL |
| 26 | M | Bi | — | 8.48 | 5.05 | 102 | 14.2 | 26 | 610 | 1 | 3.43 | 0 | Bilateral | No | Bilateral signs of PVL |
| 27 | M | Bi | Left | 9.16 | 5.09 | 104.5 | 18.4 | 33 | 1800 | 1 | 4.07 | 2 | Bilateral | Yes | Bilateral PVL (most posterior at lateral ventricles) + bilateral thalamus lesions |
| 28 | F | Bi | Right | 16.30 | 8.82 | 133 | 33.5 | 32 | 1630 | 2 | 7.48 | 0 | Bilateral | Yes | Bilateral frontal and parietal PVL + enlarged lateral ventricles |
| 29 | F | Bi | — | 10.90 | 5.44 | 105.8 | 16.9 | 40 (term) | 2900 | 3 | 5.46 | 0 | Bilateral | No | Discrete bilateral PVL |
| 30 | F | Bi | — | 3.26 | 5.03 | 101.2 | 12.7 | 29 | 1110 | 1 | 1.77 | 2 | Bilateral | No | Bilateral occipital PVL |
| 31 | F | Bi | — | 7.88 | 6.26 | 118 | 20.7 | 40 (term) | 4500 | 2 | 1.62 | 2 | Unclear | No | Residual left periorbital hemangioma + focal lesion right cerebellum |
| 32 | M | Bi | Left | 10.21 | 5.87 | 113.8 | 22.7 | 32 | 2160 | 2 | 4.34 | 0 | Bilateral | No | Bilateral frontal and parietal PVL + bilateral dorsal thalamus hyperintensities |
| 33 | M | Bi | Left | 10.02 | 5.11 | 106.3 | 16.1 | 31 | 1950 | 1 | 4.91 | 0 | Bilateral | No | Bilateral PVL |
| 34 | M | Bi | — | 5.94 | 3.61 | 94 | 15.8 | 31 | 1860 | 3 | 2.33 | 2 | Bilateral | Yes | Bilateral PVL + enlarged lateral ventricles |
| 35 | M | Bi | Left | 16.02 | 10.26 | 126.9 | 26.8 | 37 (term) | 3250 | 1 | 5.76 | 0 | Bilateral | Yes | Bilateral parietal and occipital PVL + enlarged lateral ventricles (left more than right) + mild corticosubcortical atrophy bilateral parietal |
| 36 | M | Bi | — | 6.77 | 6.42 | 106.6 | 19.3 | 30 | 1640 | 2 | 0.35 | 2 | Bilateral | Yes | Bilateral PVL + bilateral dorsal thalamic lesions |
| 37 | M | Bi | Right | 5.64 | 4.25 | 95 | 13.5 | 40 (term) | 2760 | 1 | 1.39 | 2 | Bilateral | No | Bilateral PVL + mildly enlarged lateral ventricles |
| 38 | F | Bi | Right | 4.74 | 4.41 | 103.3 | 17.6 | 34 | 2020 | 2 | 0.33 | 2 | Bilateral | No | Mild bilateral PVL |
| 39 | F | Bi | — | 10.89 | 8.38 | 138.2 | 30.6 | 27 | 800 | 1 | 2.51 | 0 | Bilateral | No | Mild bilateral PVL |
| 40 | M | Bi | — | 10.89 | 6.37 | 117.6 | 23.5 | 27 | 1100 | 2 | 4.52 | 0 | Bilateral | No | Mild bilateral PVL |
| 41 | F | Bi | — | 7.30 | 4.23 | 99 | 16.1 | 34 | 2175 | 2 | 3.07 | 0 | Bilateral | No | Bilateral PVL + enlarged lateral ventricles |
| 42 | M | Bi | — | 9.97 | 9.20 | 123.3 | 40.5 | 29 | 1100 | 1 | 0.77 | 2 | Bilateral | No | Bilateral PVL + diminished right lateral ventricle system + cerebellar atrophy and symmetrical focal cerebellar abnormalities |
| 43 | F | Bi | — | 10.70 | 7.99 | 119.3 | 19.6 | 28 | 1170 | 1 | 2.72 | 0 | Bilateral | No | Discrete bilateral PVL + enlarged lateral ventricles |
| 44 | M | Bi | — | 10.70 | 9.71 | 136.2 | 32.7 | 28 | 1250 | 1 | 0.99 | 0 | Bilateral | No | Enlarged lateral ventricles + 2 small aspecific foci bilateral in brain white matter |
| 45 | F | Bi | — | 11.49 | 7.00 | 118 | 17.7 | 37 (term) | 2300 | 2 | 4.49 | 0 | Bilateral | No | Bilateral parietal PVL |
| 46 | F | Bi | — | 5.12 | 5.47 | 106.6 | 17.3 | 34 | 2180 | 2 | 0.36 | 2 | Bilateral | Yes | Bilateral parietal and frontal PVL + enlarged lateral ventricles + bilateral dorsal thalamic lesions |
| 47 | M | Bi | — | 6.67 | 5.47 | 105.5 | 16.7 | 38 (term) | 2870 | 2 | 1.20 | 2 | Bilateral | No | Bilateral PVL |
| 48 | M | Bi | Left | 7.57 | 10.39 | 133 | 25 | 25 | 950 | 2 | 2.81 | 2 | Bilateral | No | Mild bilateral PVL + hypogenesis corpus callosum + enlarged occipitotemporal part of left lateral ventricle |
| 49 | M | Bi | Right | 3.88 | 6.85 | 120.1 | 23.3 | 36 | 2000 | 2 | 2.97 | 2 | Bilateral | Yes | Left frontal schizencephaly with absent septum pellucidum and left thalamus hypoplasia + enlarged posterior part of left lateral ventricle + less-developed left temporal lobe |
| 50 | F | Bi | — | 9.86 | 8.86 | 122.1 | 22.5 | 30 | 1560 | 3 | 1.00 | 0 | Bilateral | Yes | Bilateral parietal PVL with cystic degeneration |
Abbreviations: Bi, bilateral CP; BW, birth weight; CST, corticospinal tract; F, female; GA, gestational age; GMFCS, gross motor function classification system; M, male; PLIC, posterior limb of the internal capsule; PVL, periventricular leucomalacia; time difference, time between brain scan and gait examination; Uni, unilateral CP.
Acknowledgements
The authors would like to thank Steffen Fieuws of the Leuven Biostatistics and Statistical Bioinformatics Centre for his expertise and advice on the statistical analyses in this article.
Authors’ Note
PM and LVG contributed equally to the article.
Declaration of Conflicting Interests
The authors declared no potential conflicts of interest with respect to the research, authorship, and/or publication of this article.
Funding
The authors disclosed receipt of the following financial support for the research, authorship, and/or publication of this article: Pieter Meyns was supported by grants of the Special Research Fund of the KU Leuven (OT/08/034 & PDMK/12/180) and Krediet aan Navorsers of the Research Foundation-Flanders (FWO; Grant 1503915N). Pieter Meyns, Leen van Gestel, and Jacques Duysens were also funded by an FWO project (Grant G.0901.11). Leen Van Gestel and Inge Leunissen received a PhD fellowship of the FWO. Leen Van Gestel was also supported by a grant of the Marguerite-Marie Delacroix fund. There was no role of these funding bodies in the study design, collection, and analysis of data; interpretation of data; writing of the article and decision to submit the article for publication.
References
Supplementary Material
Please find the following supplemental material available below.
For Open Access articles published under a Creative Commons License, all supplemental material carries the same license as the article it is associated with.
For non-Open Access articles published, all supplemental material carries a non-exclusive license, and permission requests for re-use of supplemental material or any part of supplemental material shall be sent directly to the copyright owner as specified in the copyright notice associated with the article.