
Abstract
Background. Cortical stimulation (CS) combined with rehabilitative training (RT) has proven effective for enhancing poststroke functional recovery in rats, but human clinical trials have had mixed outcomes. Objective. To assess the efficacy of CS/RT versus RT in a nonhuman primate model of cortical ischemic stroke. Methods. Squirrel monkeys learned a pellet retrieval task, then received an infarct to the distal forelimb (DFL) representation of primary motor cortex. A subdural monopolar electrode was implanted over the spared DFL representation in dorsal premotor cortex (PMD). Seven weeks postinfarct, monkeys underwent 4 to 6 weeks of RT (n = 8) or CS/RT (n = 7; 100 Hz, cathodal current) therapy. Behavioral performance was assessed before and after infarct, prior to therapy, and 1 and 12 weeks posttherapy (follow-up). The primary outcome measure was motor performance at 1 week posttherapy. Secondary outcomes included follow-up performance at 12 weeks and treatment-related changes in neurophysiological maps of spared DFL representations. Results. While postinfarct performance deficits were found in all monkeys, both groups demonstrated similar recovery profiles, with no difference in motor recovery between the RT and CS/RT groups. Posttherapy, PMD DFL area was significantly expanded in the RT group but not the CS/RT group. A significant relationship was found between motor recovery and DFL expansion in premotor cortex. Conclusions. Results suggest that the specific parameters utilized here were not optimal for promoting behavioral recovery in nonhuman primates. Though CS/RT has consistently shown efficacy in rat stroke models, the present finding has cautionary implications for translation of CS/RT therapy to clinical populations.
Keywords
Introduction
Partial but incomplete functional recovery after stroke is common despite conventional therapy, resulting in chronic impairments, increased cost of care, and reduced quality of life. 1 As such, the need exists to develop new or enhanced approaches to improve the treatment of motor impairments in the chronic phase of stroke recovery.
The brain’s innate capacity for neural plasticity, specifically in the motor cortex, has been implicated in the acquisition of motor skills during learning and the reacquisition of motor skills following cortical ischemic injury.2,3 Several therapeutic approaches designed to harness this endogenous mechanism have been investigated in recent years.4-10 One such method is cortical stimulation (CS), applied either epidurally or subdurally. The general premise of CS is to pair subthreshold electrical stimulation of the intact, poststroke motor cortex with rehabilitative training (RT), a combined treatment herein referred to as CS/RT, to enhance plasticity mechanisms responsible for mediating recovery of function. The validity of this approach to treating chronic poststroke deficits was supported by several initial studies in rats using combined CS/RT treatment to enhance recovery on forelimb reaching tasks after cortical ischemic injury11-15 and by a series of early-phase clinical trials in human stroke survivors that demonstrated improvements on upper extremity Fugl-Meyer (UEFM), SIS (Stroke Impact Scale), and arm motor ability test (AMAT) functional scores after CS/RT treatment.16-18 However, results of a large scale trial of CS/RT in human stroke survivors showed no overall benefit for functional recovery,19,20 suggesting a need for additional studies to investigate this interventional therapy.
In our own initial studies, 14 adult squirrel monkeys experienced an ischemic infarct to the distal forelimb (DFL) area in primary motor cortex (M1), and subsequently were implanted with a bipolar electrode on the cortical surface that spanned the spared cortex medial and rostral to the M1 infarct, which included the proximal forelimb representation in M1 and at least some of the forelimb (distal and proximal) representation in dorsal premotor cortex (PMD). Monkeys underwent several weeks of CS/RT treatment with bipolar current at a 50 Hz stimulation frequency. Behavioral performance showed significant, though incomplete, recovery, and motor maps beneath the electrode showed significant expansion of DFL representations. Performance gains persisted for up to 4 months. Taken together, these results indicated that CS/RT was a viable therapeutic technique after cortical stroke in nonhuman primates. Importantly, however, this initial report was a feasibility study and did not include an RT-only control group.
In the present study, we employed a translational approach to assess the efficacy of CS/RT versus RT in a nonhuman primate model by adopting CS parameters found to be optimal in rat studies.11,13,15 In particular, CS was found to be most effective for enhancing behavioral recovery in rats by using a monopolar electrode to deliver cathodal current at a 100 Hz stimulation frequency to motor cortex during RT (contrast with 50 Hz bipolar stimulation used in our earlier feasibility study in monkeys 14 ). In addition, compared with our earlier study, 14 larger M1 infarcts were produced (an attempt to produce more severe deficits), the location of the cortical electrode was shifted rostrally to predominantly target PMD (to emphasize the role of a single, intact forelimb motor region for promoting recovery), and we have now examined treatment efficacy by comparing experimental (CS/RT) and control (RT) therapy conditions. We hypothesized that the use of optimized treatment parameters would enhance behavioral gains in the CS/RT group compared with the RT group and produce an expansion of DFL representations in the stimulated cortical tissue.
Methods
Subjects
Fifteen adult squirrel monkeys (genus Saimiri, 10 male, 5 female; birth dates unknown, veterinary estimates ranged between 3 and 10 years at start of experiment) were used. Monkeys were experimentally naïve and free of obvious physical and neurological problems at study initiation. Five squirrel monkeys (2 from the cohort above along with 3 others) participated in additional experiments to evaluate technical aspects of the monopolar CS method; results of these studies informed the final methods design. All procedures were conducted in accordance with federal guidelines for the care and use of laboratory animals and with approval of the Institutional Animal Care and Use Committee at the University of Kansas Medical Center.
Experimental Design
Figure 1 illustrates the experimental timeline. After determination of hand preference on a pellet reach-and-retrieval task (Kluver board),21,22 monkeys were fitted with a short-sleeved, torso-covering, nylon mesh primate jacket. Monkeys underwent training on the pellet retrieval task for two weeks, followed by a surgical procedure during which functional regions of M1, PMD, and ventral premotor cortex (PMV) were identified via intracortical microstimulation (ICMS) mapping.14,22,23 In the same procedure, an ischemic infarct was produced in the M1 DFL representation.14,24,25 After infarct, in either the same procedure (n = 2) or in a separate procedure 2 to 3 weeks later (n = 13), a monopolar electrode was implanted over spared DFL areas in premotor cortex. This variation in timing of electrode implantation was guided by veterinary consultation regarding the impact of the multiple survival surgery schedule on the overall health and well-being of the monkeys.
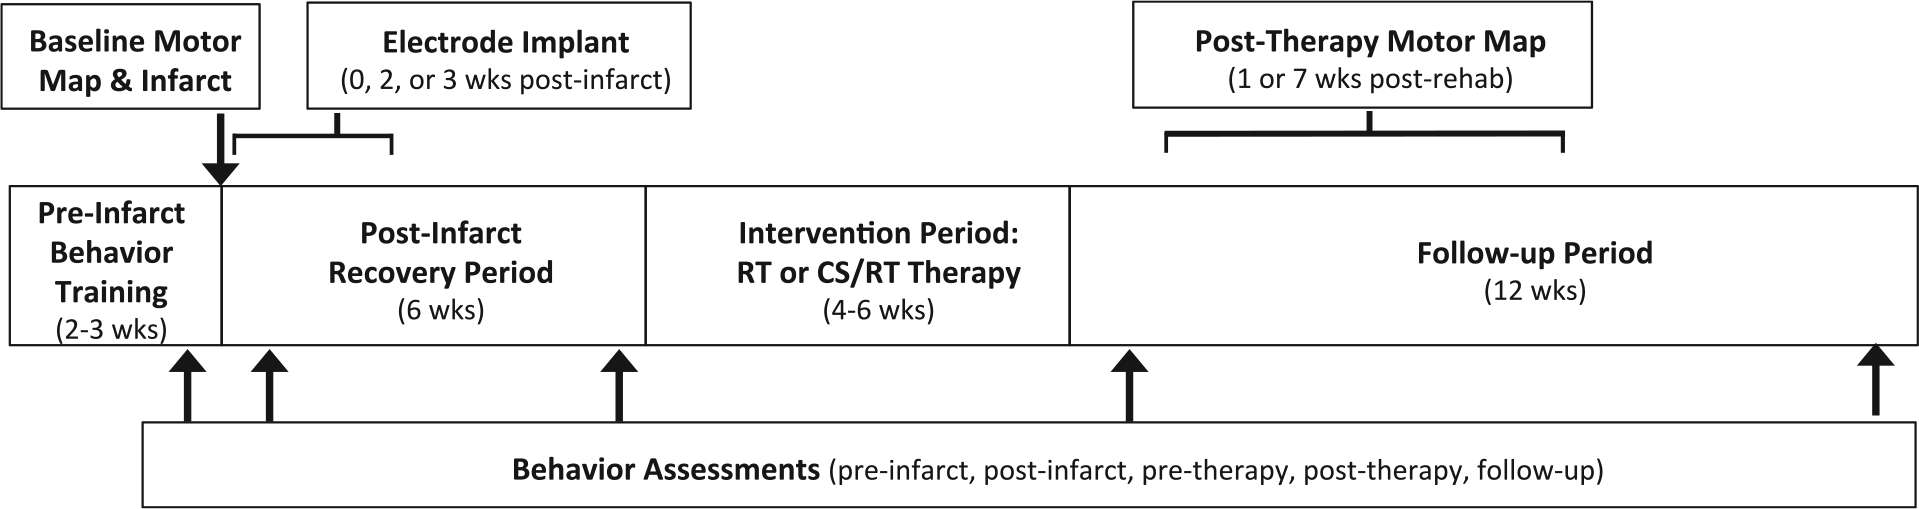
Summary of experiment timeline highlighting key procedural elements. The middle series of boxes delineate major intervals (preinfarct, postinfarct, therapy, follow-up). The top boxes, arrows, and brackets indicate the timing of surgical procedures (motor mapping, ischemic infarct, electrode implantation); brackets reflect timing variations for electrode implantation and posttherapy motor mapping (see Methods section). The bottom box and arrows indicate the timing of behavior assessments reported in the article.
Postinfarct motor deficits were monitored during a 6-week recovery period. This timing was chosen to model the expected clinical treatment paradigm in which human stroke survivors would enroll into CS/RT treatment programs secondary to an earlier poststroke recovery period17,18,26; prior results suggested monkeys would have sufficient residual deficits on the pellet retrieval task at 6 weeks postinfarct to enable meaningful comparisons between treatment groups. 27 At 7 weeks postinfarct, monkeys were randomly assigned to either the RT therapy group (rehabilitative training for 4-6 weeks; n = 8; 4 male, 4 female) or the CS/RT therapy group (cortical electrical stimulation concurrent with 4-6 weeks of RT; n = 7; 6 male, 1 female). At the conclusion of the therapy period, task performance was monitored for 12 weeks to assess retention of performance gains. Within this follow-up period, monkeys underwent a surgical procedure at 1 week (n = 5; RT = 3, CS/RT = 2) or 7 weeks (n = 9; RT = 4, CS/RT = 5) posttherapy to remove the electrode and remap DFL representations in M1, PMD, and PMV. Since only limited data was available when the present study was designed to suggest that posttherapy retention of performance gains would not be dependent on ongoing CS treatment (retention for 2 days post-CS/RT in rats 12 ; up to 4 months in monkeys but in only 3 subjects 14 ), the variation in posttherapy surgical timing was planned in anticipation of investigating neurophysiological changes associated with a potential relapse of behavioral performance in either group. One RT monkey died prior to the second mapping procedure (missing posttherapy map data and 12-week follow-up behavior data). A technology failure caused behavior video from 2 RT monkeys to be lost after experiment completion but prior to analysis of behavioral performance (behavior data missing, but mapping data present). For the 15 monkeys described here, complete behavior results were available for 12 monkeys (5 RT, 7 CS/RT) and ICMS mapping results were available for 14 monkeys (7 RT, 7 CS/RT).
Behavior Training
Skilled motor behavior was assessed using a modified Kluver board task.22,23,28 In brief, food pellets (45 mg, Bioserve) were placed individually into 1 of 5 wells for the monkey to retrieve and eat. The wells ranged in diameter from 25 mm (larger than the width of the monkey’s hand) to 9.5 mm (wide enough to insert 1-2 fingers). Success on this task is defined as controlled (ie, in the grasp of the fingers) removal of the pellet from the food well. Since well depth was identical, retrieval difficulty increased with decreasing well diameter. Normal, uninjured monkeys with no prior task exposure can readily perform the largest wells with few errors, but require training to achieve proficiency with the smaller wells.22,23
Preinfarct training was conducted in 30-minute sessions, twice per day for 10 days. For the first session, pellets were placed exclusively into the largest well. In subsequent sessions, placements were progressively shifted toward smaller wells, with all placements into the smallest well by the last several training days. Monkeys typically performed 400 to 500 training trials per day with this regimen. Prior to each training session, “probe” trials were conducted, which consisted of 25 to 50 trials distributed evenly between each well. Probe trials thus served as a consistent testing mechanism to assess overall performance on the retrieval task, and are the basis of the reported performance data in the present study.
Rehabilitative training sessions were similar to preinfarct training (twice daily probe trials followed by training trials). Well progression during RT was based on achieving criterion performance at successive stages: Monkeys had to achieve at least 80% of their preinfarct performance level for the tested well for 2 consecutive days. All monkeys met this criterion within 4 days for each well. During the 6-week postinfarct recovery period and the 12-week follow-up period, task performance was assessed 1 to 3 times per week with a probe test consisting of 50 probe trials (10/well).
In a prior study, 14 we demonstrated that the time to remove a pellet from the food wells (“dwell time”) exhibited more substantial and persistent deficits after M1 infarct than the number of finger flexions required to remove pellets from the well (“flexions per retrieval”). As such, dwell time values for each well were used as the primary performance data in the present study. To facilitate comparisons between monkeys that could have a range of task skill levels after the preinfarct training protocol, a motor performance index14,27 was calculated as follows. The average dwell time values from each test well were calculated from the final 5 days of preinfarct training, then used to normalize performance for the experimental periods listed below, such that an index of 1.0 is equivalent to the 5-day preinfarct average, 2.0 is double the preinfarct average, and so on. It is possible for individual monkeys to have a performance index less than 1.0, indicating performance better than preinjury levels.
Five time points were preselected as the primary endpoints to assess changes in motor performance: (1) “preinfarct” (the final 3 days of probe trials prior to ischemic injury), (2) “postinfarct” (probe trials during the first week after injury), (3) “pretherapy” (probe trials during week 6 of the recovery period), (4) “posttherapy” (probe trials during the first week after the therapy period), and (5) “follow-up” (probe trials during the final week of the follow-up period).
Surgical Procedures
Surgical and neurophysiological mapping methods were similar to previous reports.14,21-23,29 In brief, monkeys were sedated with ketamine (20 mg/kg), followed by isoflurane anesthesia (1% to 2%, with 70% nitrous oxide, 30% oxygen) during surgical procedures. Using aseptic techniques, a craniotomy was performed to expose motor cortex in the hemisphere opposite the monkey’s preferred forelimb on the pellet retrieval task. The dura was excised and a plastic cylinder was secured around the cranial opening with dental acrylic and filled with sterile silicone oil to prevent tissue desiccation. Gas anesthesia was discontinued and ketamine (15-20 mg/kg/h) supplemented with diazepam (~0.01 mg/kg/h) was administered during the neurophysiological mapping procedure. At the conclusion of mapping, gas anesthesia was reinstated, the plastic chamber removed, and the craniotomy was closed using a layered combination of silicone sheeting (as dura replacement), gelfoam (as space filler), and dental acrylic (as skull replacement).
After completion of the first mapping procedure, and prior to surgical closing, the ischemic infarct was created (see below). All monkeys in both groups also underwent implantation of the monopolar electrode system (see below).
Neurophysiological Mapping of Motor Cortex Using ICMS
Functional maps of DFL movement representations in M1, PMD, and PMV were derived prior to infarct (baseline map) and after the intervention period (posttherapy map) using ICMS.21,22 In brief, guided by a scaled digital image of the cortical surface, a sharp beveled glass micropipette (10-25 µm outer diameter, filled with 3.5 M saline) was used to deliver high-frequency low-amplitude electrical stimuli to layer V neurons (thirteen 200-µs pulses, 3.3-ms interval, 1-Hz repeat, 0-30 µA, 1750 µm depth). The objective was to identify the extent of digit, wrist, and forearm representations (collectively, the DFL representation) in each of the 3 cortical regions (Figure 2). Cortical territory containing representations of other parts of the body, such as the proximal forelimb, torso, face, and hindlimb, were extensively explored to ensure all DFL locations were identified at both mapping timepoints. The total extent of cortical mapping area was typically ~95 to 105 mm2, based on 250 to 350 ICMS sites/map, using a 500-µm interpenetration distance in M1 and PMD and a 350-µm interpenetration distance in PMV.
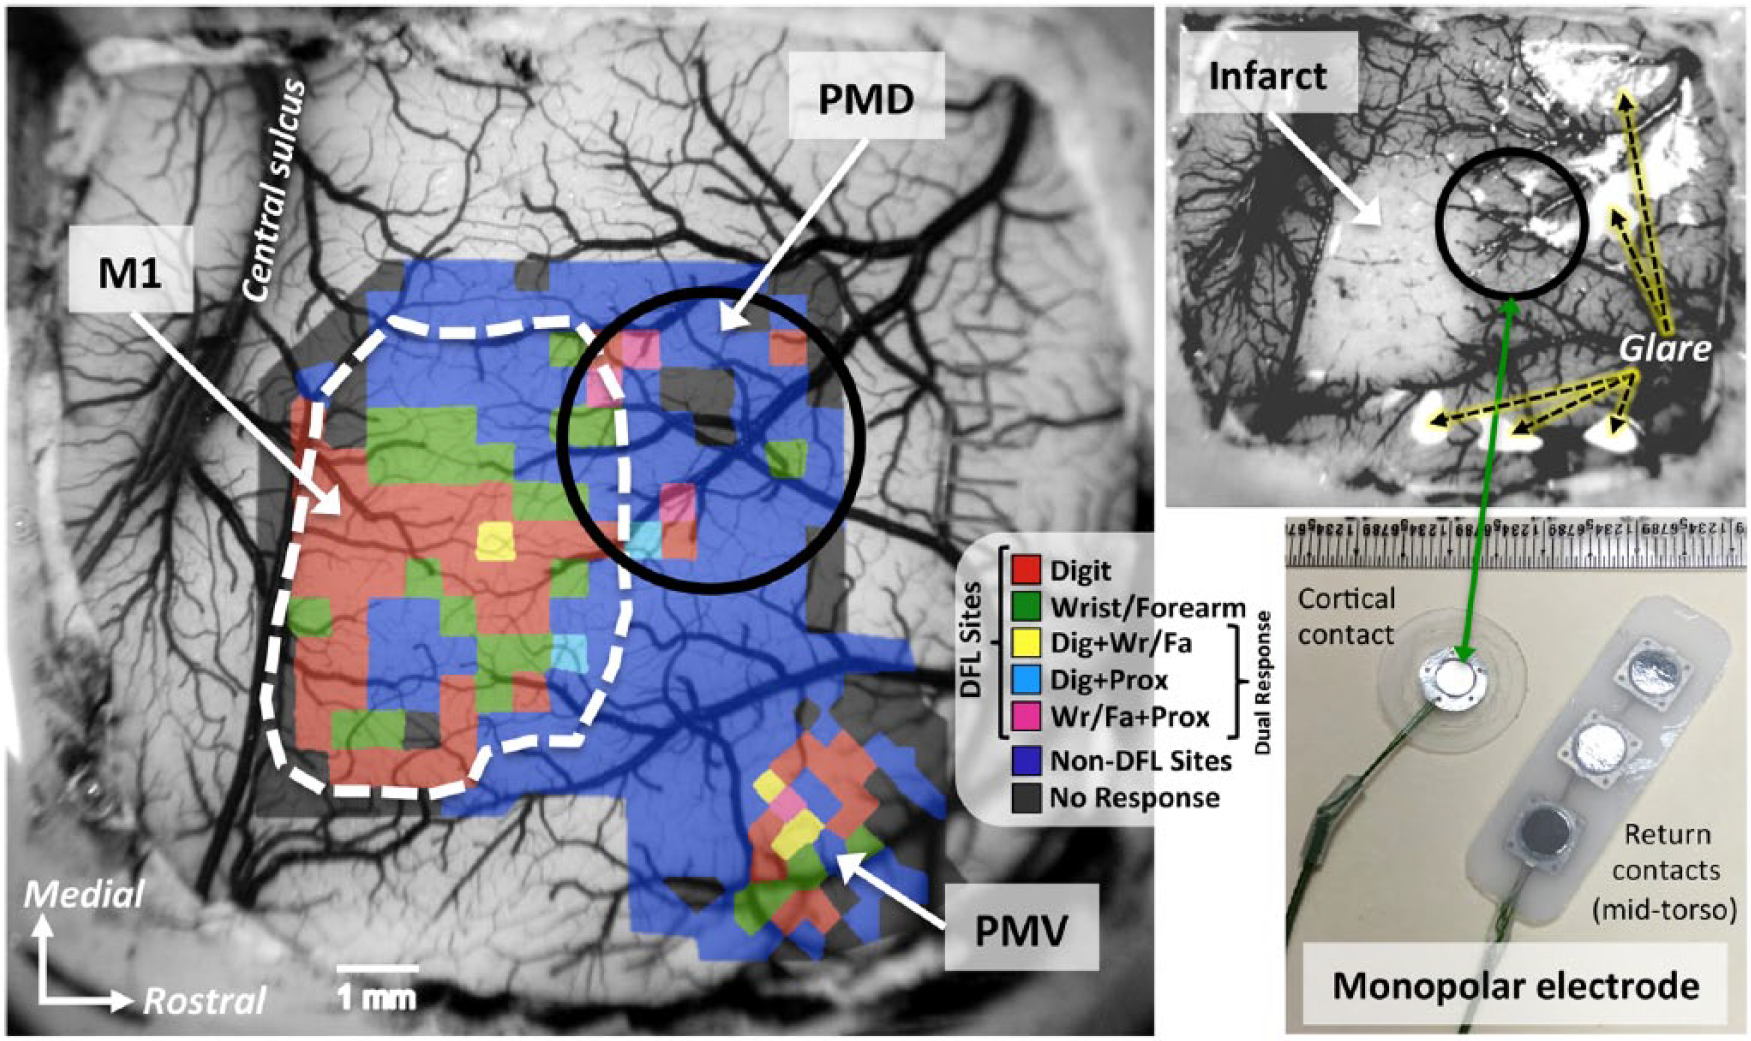
(Left) Representative baseline motor map from 1 cortical stimulation/rehabilitative training (CS/RT) monkey illustrating distal forelimb (DFL) and surrounding non-DFL representations in primary motor (M1), dorsal premotor (PMD), and ventral premotor (PMV) cortices, overlaid onto an image of the surgically exposed cortical surface. Colors represent different movement types evoked by ICMS mapping: DFL movements (red = finger or thumb, green = wrist or forearm, yellow = digit + wrist/forearm, light blue = digit + elbow/shoulder (labeled “Prox” as abbreviation for “proximal forelimb”), magenta = wrist/forearm + elbow/shoulder; the latter 3 colors are dual-response sites at which two movements were evoked within 2 µA of each other22,23), non-DFL movements (dark blue; eg, elbow, shoulder, torso, face, hindlimb), and nonresponsive (black). The white dashed line indicates the infarct target in this monkey, based on the location of M1 DFL responses and constraints imposed by vascular patterns. (Top right) Image of the cortical surface (from left panel) immediately after infarct creation. Surface arteries and veins within the target region have been occluded by bipolar electrocoagulation, producing a blanched appearance indicative of the absence of blood flow. Note the difference between blanched tissue and white areas due to reflective glare (dashed arrows). (Bottom right) The monopolar electrode developed by Northstar Neuroscience. The exposed portion of the cortical contact was placed on the pial surface overlying the spared PMD DFL area (black circle in left and top right panels) and secured in place during surgical closing. The return electrode was subcutaneously implanted in the mid-torso to complete the electrical circuit.
Ischemic Infarct
Bipolar electrocoagulation of surface vasculature was used to produce the ischemic infarct.14,24,30 The baseline M1 DFL map was used to determine the cortical territory subjected to a permanent ischemic infarct, with the goal of targeting all of the M1 DFL area while limiting the extent of injury to other representations, notably adjacent proximal forelimb areas and nearby PMD DFL areas. All arterial and venous vessels and vessel branches within the target region were occluded, with an exception for the main “trunk” of large pass-through vessels that supplied other cortical territories. Vessels were monitored for 10 minutes for signs of reperfusion, and reoccluded as necessary. A digital image of the infarct tissue was captured to document and verify the extent of the target region (Figure 2). This infarct technique produces an injury with sharp borders that extends through all cortical layers but spares the underlying white matter24,29; as such, it produces a selective injury that is ideal for examining functional plasticity in spared tissue. Since the duration between infarct creation and final follow-up behavior testing was 22 to 24 weeks in each monkey, calculation of lesion volume based on histological data is unreliable. 29 Instead, the size of the infarct (in mm2) was calculated from the scaled image of the preinfarct blood vessels compared with the postinfarct blood vessels (Figure 2). By superimposing ICMS maps of motor representations, this allows us to describe the infarct size in terms of the amount of loss of the M1 DFL representation.14,24,25,27,31,32
Electrode Implantation and Cortical Stimulation
All monkeys were implanted with a monopolar electrode system (developed by Northstar Neuroscience, Seattle, WA) consisting of a cortical surface electrode with a single (monopolar) 4-mm diameter circular contact and a separate “return” electrode with three 4.5-mm diameter circular contacts. Wire leads connected the electrodes to a portable battery-powered stimulator unit.
In the CS/RT group, the monopolar electrode was placed over the PMD DFL, with overlap onto adjacent proximal forelimb (elbow and shoulder) representations due to the size of the contact area (Figure 2). In the RT group, similar electrode placement was conducted over either PMD DFL (n = 6) or PMV DFL (n = 2), but no therapy stimulation was conducted in these animals. In all monkeys, the return electrode was implanted subcutaneously in the mid-to-lower back, 1 to 2 cm lateral to the spine, on the same side of the body as the implanted cortical hemisphere, with the contacts facing the underside of the skin. Wire leads from both the cortical and return electrodes were tunneled subcutaneously to a common exit incision in the mid-back and connected to the stimulator unit worn in a backpack-like pocket of the primate jacket. The lead connections were arranged to deliver cathodal current via the cortical electrode.
The CS-evoked movement threshold (MT) for each monkey in the CS/RT group was determined prior to RT initiation. Individual stimuli were triggered remotely (via computer and wireless controller) and evoked movements were observed while monkeys were at rest in their home cages. MT was determined by delivering a burst of cathodal pulses at 100 Hz for 1 second. Each pulse was charge balanced but asymmetrically biphasic, with an active-driven 100-µs square phase followed by a passive 9900-µs decaying exponential phase. Starting at a level below the expected MT, the amplitude of MT test bursts was gradually increased in 0.12-mA steps until a motor response was detected visually, then reduced in 0.06-mA steps until the response was unobservable (0.06 mA was the minimum step level possible for this stimulation system). The interval between each MT test was a minimum of 10 seconds. The lowest current that produced an observed movement was defined as the MT and an amplitude of 50% MT was used during CS therapy.12-15 MT was defined twice per week during the RT period and the therapy amplitude was adjusted accordingly.
During CS/RT therapy sessions, continuous 100 Hz pulses (at 50% MT) were delivered for a total duration of 35 minutes; CS was initiated 5 minutes prior to the start of the RT session and remained on for the remainder of the session (30 minutes).
Data Analysis and Study Outcomes
Statistical analysis was performed using Prism 6 (GraphPad Software), with 2-tailed hypotheses and α = .05, and reported/graphed as mean ± standard error of the mean. Behavioral performance and neurophysiological mapping data were analyzed with 2-way repeated-measures analysis of variance and Bonferroni post hoc tests. Relationships between behavioral recovery and DFL map areas were examined with correlation analysis. CS movement thresholds were analyzed with 1-way repeated-measures analysis of variance and Bonferroni post hoc tests. All behavior and mapping data were normally distributed (Kolmogorov-Smirnov test).
The primary outcome measure was motor performance at 1 week posttherapy. Secondary outcome measures included motor performance at follow-up, within-group changes in behavior over the course of the experiment, and changes in DFL representations in M1, PMD, and PMV after therapy. Subgroup statistical analysis revealed no effect on outcomes related to the timing of postinfarct electrode implantation, location of cortical electrode, or posttherapy timing of ICMS mapping; thus, data were pooled and analyzed based only on RT or CS/RT group assignment.
Results
Infarct Size in Baseline M1
For the RT group (n = 8), the infarct affected 98.1% of the baseline M1 DFL map, intentionally sparing 0.25 ± 0.09 mm2 of M1 DFL area (Figure 2). For the CS/RT group (n = 7), the infarct affected 97.2% of the baseline M1 DFL map, sparing 0.43 ± 0.14 mm2 of M1 DFL area. Additional non-DFL territory included in the infarct region was 8.20 ± 0.86 mm2 in the RT group and 8.35 ± 1.32 mm2 in the CS/RT group. There were no statistical differences between groups for any of these measurements.
Behavior Performance
Five time points were selected to assess the hypothesis that CS/RT would enhance behavioral performance over RT alone (Figure 3). To facilitate comparisons between monkeys, a motor performance index score was calculated by normalizing each monkey’s preinfarct performance scores, with preinfarct equal to 1.0 and larger scores indicating impaired performance (see Methods section and Plautz et al 14 ).
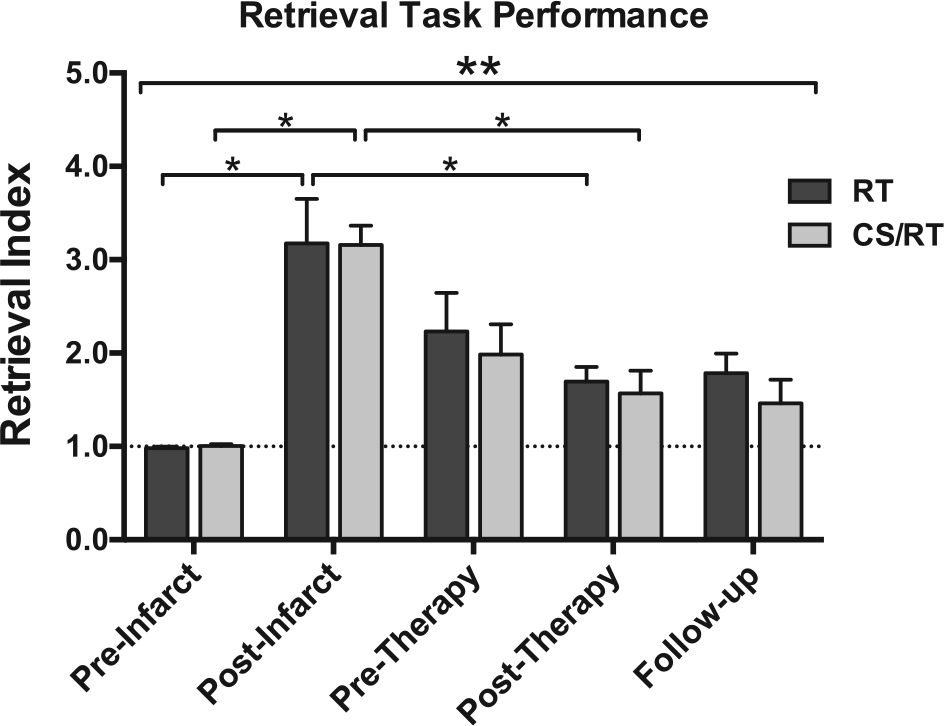
Behavior performance on the pellet retrieval task for rehabilitative training (RT; dark gray) and cortical stimulation (CS)/RT (light gray) groups. Both groups exhibited postinfarct impairments (3-fold increase in motor performance index score; postinfarct bars), partial spontaneous recovery by 6 weeks postinfarct (pretherapy bars), and additional recovery during the intervention period (posttherapy bars). The CS/RT group continued to improve while the RT group regressed slightly during the 12-week follow-up period (follow-up bars). There was a significant effect of time (analysis of variance, double asterisk), and significant within-group effects (single asterisks) for postinfarct impairment (vs preinfarct) and posttherapy recovery (vs postinfarct). There were no significant differences between RT and CS/RT groups at any of the 5 time points.
There was a significant effect of Time on the motor performance index (F4, 44 = 22.66, P < .0001), demonstrating an effect of the infarct on behavioral performance. However, there were no significant group or group × time interaction effects. Importantly, there was no significant difference in the primary outcome measure comparing behavior recovery in the CS/RT group versus the RT group at 1 week posttherapy.
Each of the 15 monkeys exhibited postinfarct impairments on the retrieval task, with index scores of individual monkeys ranging from 2.05 to 5.35 during the first week postinfarct. Postinfarct performance for both groups was significantly impaired compared with preinfarct (RT index score = 3.18 ± 0.48, P < .0001; CS/RT index score = 3.16 ± 0.21, P < .0001; Figure 3). Index scores improved for both groups during the 6 weeks prior to therapy initiation (pretherapy time point, RT, 2.23 ± 0.41; CS/RT, 1.98 ± 0.32), consistent with the phenomenon of “spontaneous” recovery. After therapy (posttherapy time point), index scores were significantly improved in both groups compared with their postinfarct scores (RT, 1.70 ± 0.16, P < .002; CS/RT, 1.57 ± 0.24, P < .0001). At the end of the follow-up period, the RT group had regressed slightly (index score 1.79 ± 0.21) while the CS/RT group had improved slightly (index score 1.46 ± 0.26), though this difference was not significant (within-group vs posttherapy or between-group for RT vs CS/RT).
Changes in Cortical Motor Representations
Each cortical region (M1, PMD, PMV) was compared to evaluate differential effects of RT and CS/RT on functional representations in postinfarct surviving tissue (Figures 4 and 5). Compared with the baseline map, the M1 DFL representation in the posttherapy map was significantly reduced in size in both groups (RT, −95.0%, P < .0001; CS/RT, −95.3%, P < .0001) (Figure 4, top row, left graph), indicating that the infarct successfully destroyed the M1 DFL map as intended, and that behavior improvements were unlikely to be related to functional recovery in M1. ICMS stimulation thresholds for DFL responses in M1 were higher in both groups between baseline and posttherapy maps (RT, 14.6 ± 0.9 µA baseline, 21.7 ± 3.3 µA posttherapy; CS/RT, 12.9 ± 0.9 µA baseline, 17.0 ± 3.8 µA posttherapy). These increases were significant overall (effect of time, P < .036) though neither within-group change reached significance.
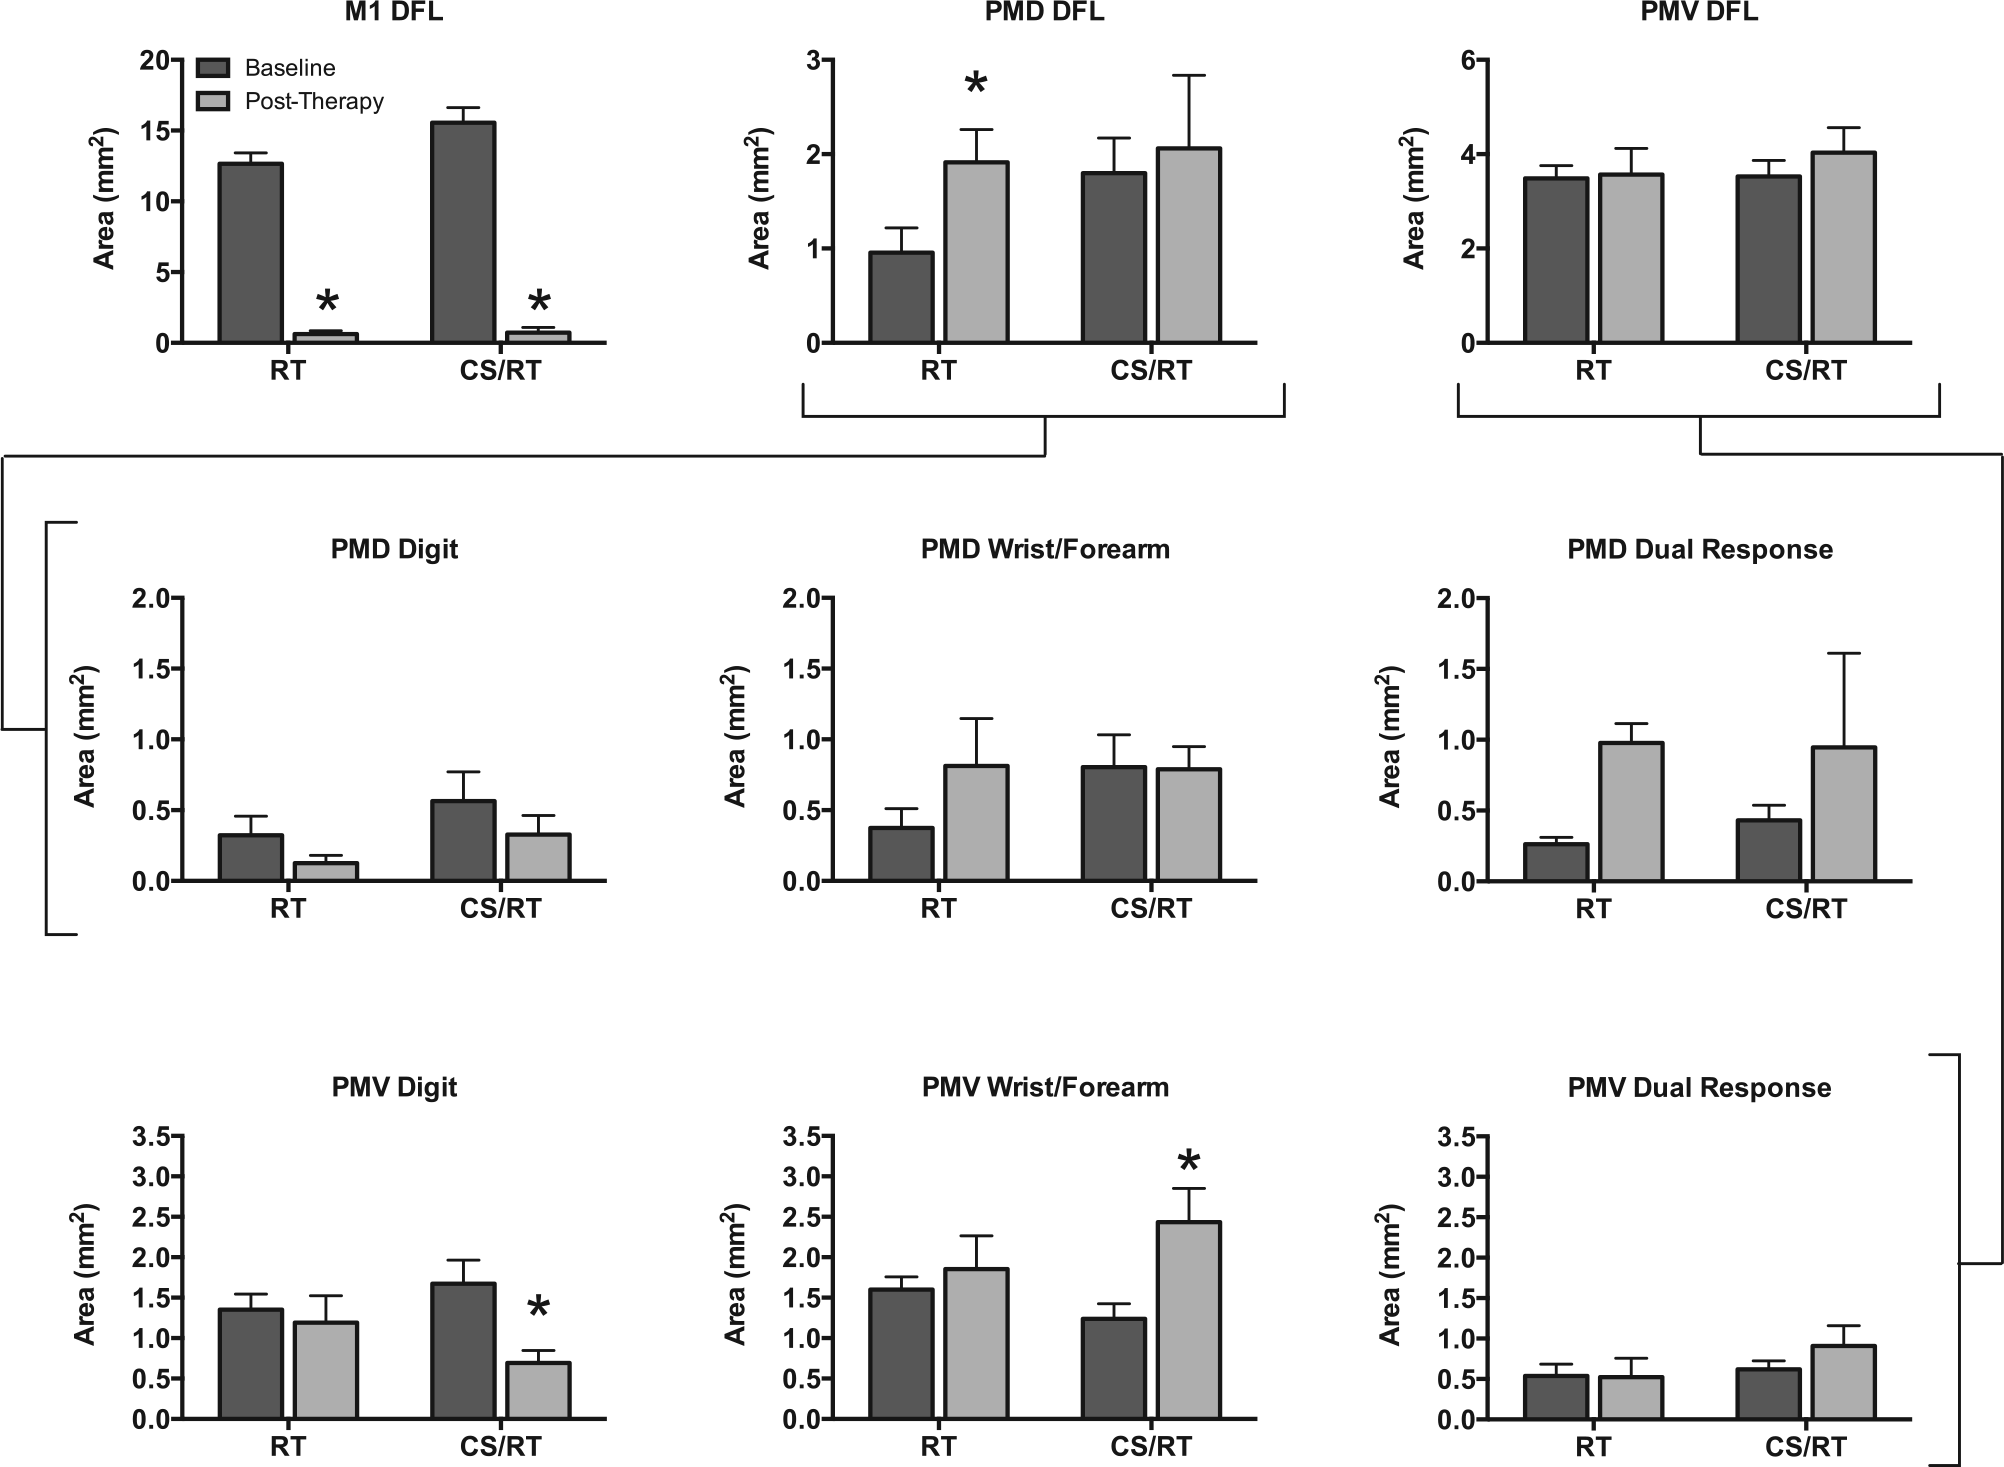
Area of distal forelimb (DFL) representations in primary motor (M1), dorsal premotor (PMD), and ventral premotor (PMV) cortices prior to infarct (“baseline”, dark gray) and after rehabilitative training (RT) or cortical stimulation (CS)/RT treatment (“posttherapy,” light gray). (Top row) In M1, the ischemic infarct produced a significant and equivalent reduction in DFL area in both groups (P < .001, left graph). PMD DFL area significantly increased in the RT group (P < .029) but not in the CS/RT group (middle graph). There were no changes in total DFL area in PMV for either group (right graph). There were no between-group differences in baseline area in PMD or PMV for any of the data shown in this figure (all 9 graphs). (Middle row) Comparison of 3 movement types evoked by intracortical microstimulation (ICMS) in PMD. There were no significant within-group differences in digit (left graph), wrist/forearm (middle graph), or dual-response (right graph) representations in PMD. The increase in overall DFL area in the RT group (top row) was driven by the separate nonsignificant increases in wrist/forearm and dual-response representations (69% of these dual-responses included wrist/forearm movements). (Bottom row) Comparison of 3 movement types evoked by ICMS in PMV. There was a significant decrease in digit area (P < .009, left graph) and a significant increase in wrist/forearm area (P < .021, middle graph) for the CS/RT group in PMV. These changes offset each other in the overall size of the PMV DFL map in this group (top row). There were no significant changes in the RT group in PMV.
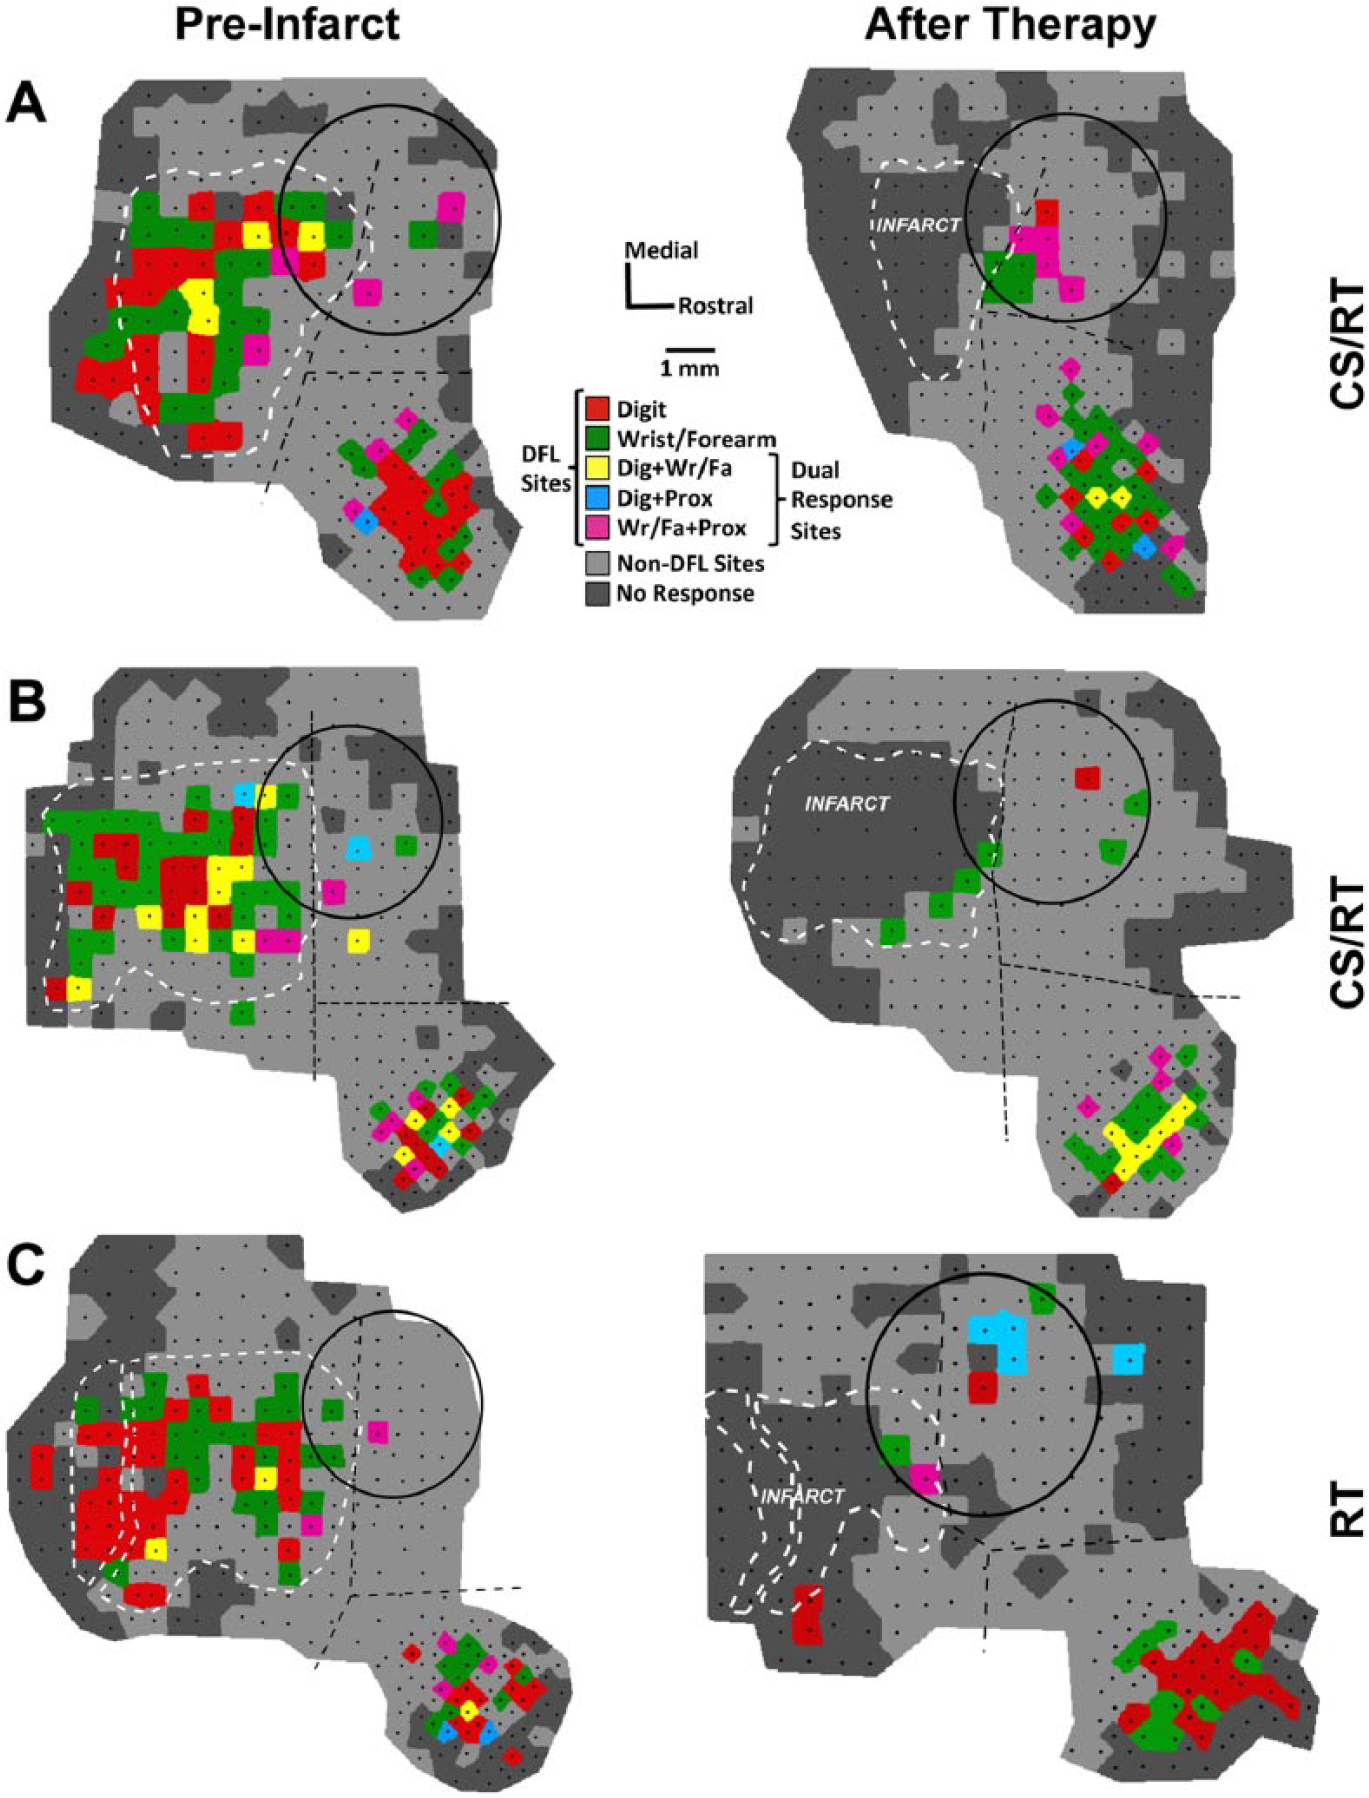
Representational maps from 2 monkeys in the cortical stimulation/rehabilitative training (CS/RT) group (panels A and B) and 1 monkey in the RT group (panel C). Black dots indicate the location of intracortical microstimulation (ICMS) sites in each map, and distal forelimb (DFL) sites are indicated by 1 of 5 colors (as in Figure 2). Non-DFL sites (proximal forelimb, face, etc) are shaded light gray (rather than dark blue, as in Figure 2) to improve visibility of the DFL regions. Borders between primary motor (M1), dorsal premotor (PMD), and ventral premotor (PMV) cortices (dashed black lines) were defined in preinfarct (baseline) maps based on ICMS data and vascular landmarks. Notably, some PMD DFL sites are often adjacent to the M1 DFL area, with as little as 500 µm separation. In posttherapy maps, the vascular landmarks from the baseline map were used to delineate the borders. Tissue necrosis of the infarct caused deformation of intact cortical tissue and surface vasculature, which is reflected by the shift in border positions in the posttherapy maps. In monkey C, the 2 infarct outlines indicate that a large pass-through artery was spared from occlusion (see Methods section). All 3 subjects had near-complete loss of DFL area in M1, with a limited number of ICMS-responsive sites at the rostral edge of the infarct (consistent with prior reports and likely reflecting uneven tissue distortion between the cortical surface and deeper layers 14 ). Movements were evoked by ICMS throughout PMD and PMV after therapy, indicating that CS did not adversely affect the physiological responsiveness of the cortical tissue. For all three subjects, the monopolar electrode was implanted 2 weeks postinfarct (shown on the preinfarct map only for reference), and posttherapy maps were derived 7 weeks posttherapy. Image scaling for figure display is responsible for the apparent change in size of the electrode between maps (all electrode circles are 4 mm in diameter).
In PMD (the target of CS in the CS/RT group), the posttherapy DFL representation increased significantly in the RT group (+100.2%, P < .029) but not in the CS/RT group (+14.5%) (Figure 4, top row, middle graph). ICMS thresholds for PMD DFL responses were not significantly different for either group (RT, 18.1 ± 3.1 µA baseline, 15.9 ± 2.6 µA posttherapy; CS/RT, 17.9 ± 1.6 µA baseline, 18.4 ± 2.4 µA posttherapy). In PMV, the posttherapy DFL representation increased in both groups (RT, +2.4%; CS/RT, +14.3%) (Figure 4, top row, right graph) but neither increase was significant. PMV DFL ICMS thresholds were not significantly different for either group (RT, 19.1 ± 2.0 µA baseline, 19.5 ± 1.9 µA posttherapy; CS/RT, 16.9 ± 0.6 µA baseline, 16.9 ± 0.9 µA posttherapy). Combining both premotor regions (PMD + PMV), DFL area increased in both groups (RT, +29.8%; CS/RT, +14.4%) but again neither increase was significant.
Distal forelimb representations in PMD and PMV were further explored by comparing changes in area for digit, wrist/forearm, and all dual-response movements evoked by ICMS. In PMD (Figure 4, middle row), there were no significant changes for any of the 3 movement types for either group. Although no individual change was significant, the increase in PMD DFL described earlier for the RT group was primarily driven by increases in wrist/forearm (+0.44 mm2, +118%) and dual-response (+0.72 mm2, +274%) movements, with 69% of the dual-response area including a wrist/forearm component. In PMV (Figure 4, bottom row), the CS/RT group had a significant decrease in digit area (−0.98 mm2, −59%, P < .009) and a significant increase in wrist/forearm area (+1.19 mm2, +96%, P < .021). These PMV changes in the CS/RT group offset each other in the overall DFL area analysis.
Baseline and posttherapy ICMS maps from 2 subjects in the CS/RT group and 1 subject in the RT group are illustrated in Figure 5. One CS/RT subject (Figure 5A) had large DFL expansion in both PMD (+1.33 mm2, +177%) and PMV (+1.44 mm2, +34%) while the other CS/RT subject (Figure 5B) had a reduction of DFL in PMD (−0.26 mm2, −27%) and a smaller expansion in PMV (+0.56 mm2, +18%). It is notable that CS (delivered to both subjects) did not affect tissue responsiveness to ICMS, indicating that group differences in PMD DFL were not due to a physiological dysfunction in the stimulated cortex. The RT subject (Figure 5C) had a large DFL expansion in PMD (+1.28 mm2, +582%) and a smaller DFL expansion in PMV (+0.56 mm2, +16%).
Relationship Between Behavior and Map Changes
Although significant recovery occurred in both groups, recovery levels of individual monkeys ranged from 10% to 104% of their postinfarct impairment level. Similarly, both groups had expanded premotor DFL maps, but changes in individual monkeys ranged from −47% to +66% (for the combined PMD + PMV area). Correlation analysis found that behavioral recovery was positively related to expanded DFL areas in PMD (r = 0.682, P < .015), PMV (r = 0.558, P < .06), and combined PMD + PMV (r = 0.693, P < .013) (Figure 6). This suggests that, independent of the application of CS during RT, changes in behavioral performance were associated with plasticity of motor representations in premotor cortex.
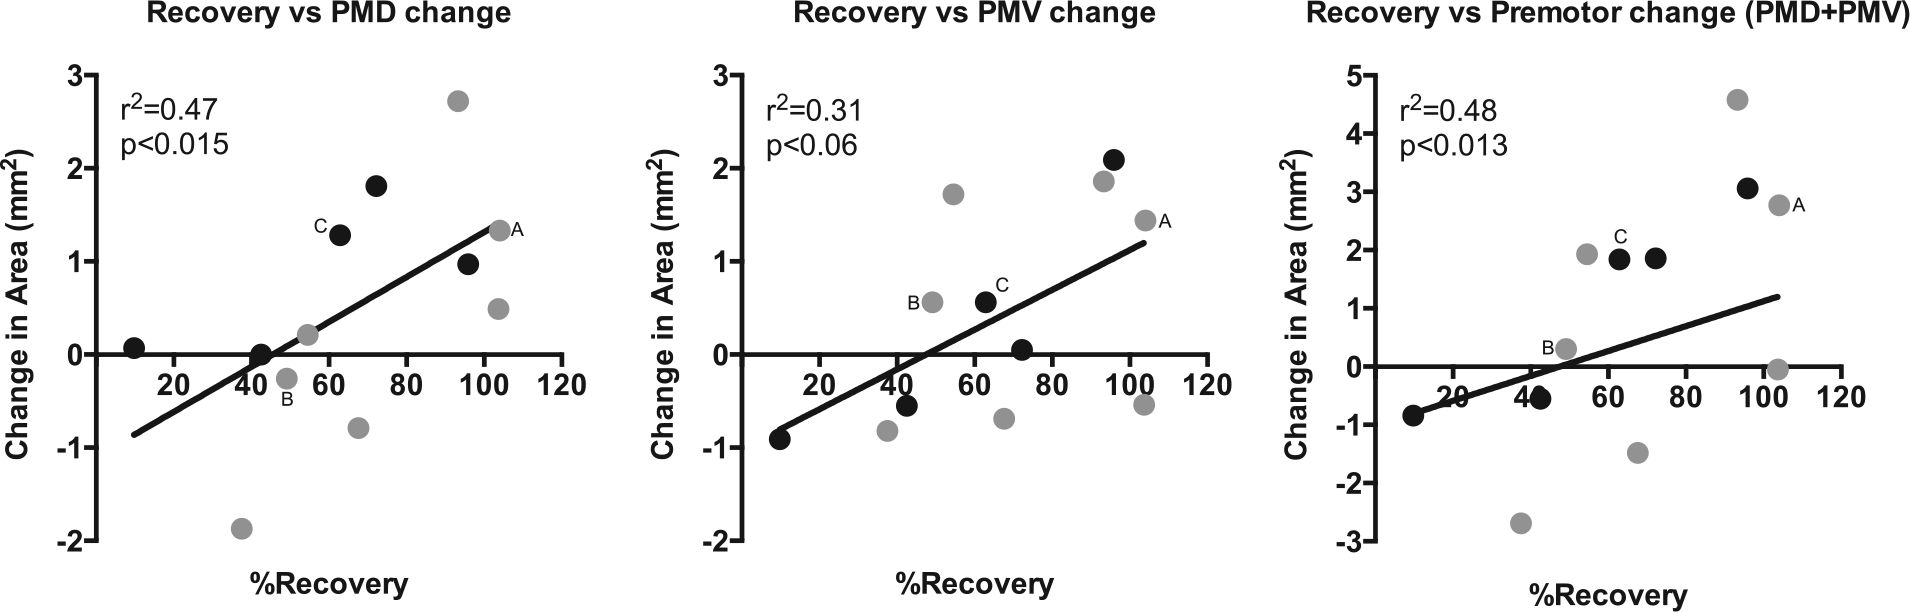
Scatterplot of behavior improvement (%Recovery) versus change in distal forelimb (DFL) representational area in dorsal premotor cortex (PMD, left graph), ventral premotor cortex (PMV, middle graph), and the combined premotor cortex area (PMD + PMV; right graph). There was a strong association between better behavioral recovery and larger DFL areas in the intact premotor cortex. Monkeys illustrated in Figure 5 are indicated on each of the scatterplots (“A,” “B,” and “C”); note that monkey A (cortical stimulation/rehabilitative training; CS/RT subject) had good recovery and larger DFL maps, monkey B (CS/RT subject) had poorer recovery and smaller DFL maps, and monkey C (RT subject) was intermediate between A and B. %Recovery (x-axis) is defined as the amount of performance improvement (postinfarct minus posttherapy) divided by the total deficit (postinfarct minus preinfarct). Change in area (y-axis) is defined as posttherapy DFL map area minus baseline DFL map area; thus negative values indicate a reduction in DFL area in posttherapy maps. Data are plotted for the 12 monkeys (5 RT, black circles; 7 CS/RT, gray circles) for which complete behavior and mapping results were available (see Methods section). Linear curve fit added to graphs for visual clarity after statistics were obtained by correlation analysis.
Cortical Stimulation–Evoked Movements and Movement Thresholds
Cortical stimulation reliably evoked movements in all 7 CS/RT subjects during each MT determination session. Evoked movements most often involved movements of the head, neck, and torso, typically characterized as “torso twitches” or “head ducking,” with very few instances of evoked forelimb movements. Movements did not appear to be visibly synchronized to the 100 Hz stimulation frequency, but rather were unitary events in response to each MT pulse burst.
The average MT in the CS/RT group was 2.98 ± 0.12 mA one week prior to therapy, 2.90 ± 0.15 mA during the first week of therapy, and 3.05 ± 0.05 mA during the final week of therapy. There were no significant differences in MT values over time; nor were there any significant correlations between MT and behavioral performance or between MT and DFL areas in motor maps.
Discussion
This report is the first controlled efficacy study in non-human primates to evaluate the effects of CS/RT as a therapeutic treatment for chronic motor deficits after ischemic stroke. The results indicate that 100 Hz monopolar cathodal-current CS/RT produced no statistically significant benefit for behavioral recovery during the therapy period compared with RT alone for either the primary outcome measure (between-group posttherapy performance) or secondary behavioral outcome measures (between-group follow-up performance or within-group performance over time). ICMS motor mapping revealed a larger DFL area expansion in PMD for the RT group compared to the CS/RT group. There was a significant correlation between expanded premotor cortex DFL maps and improved behavioral performance after treatment.
The lack of behavioral benefit in the CS/RT group compared with the RT group was unexpected and contrary to repeated findings in rats,11-13,15,33-36 our own initial study in monkeys, 14 and the results of early clinical trials.16-18 The CS/RT method had previously been shown to be robust, in that improvements were evident using both bipolar and monopolar stimulation, and using a range of stimulation frequencies. However, CS/RT in rats has been shown to be less effective under certain conditions, notably in animals with severe postinjury behavioral impairments, 33 in animals with electrode placements that spanned smaller regions of spared peri-infarct tissue, 34 and in animals in which CS/RT intervention was initiated after a substantial (ie, 3 months) postinfarct delay. 36 These contingencies do not appear to have been factors in the present study, in that (1) there was no clear relationship between the level of postinfarct impairment and the amount of posttherapy recovery (r2 = 0.053, P < .45; data not shown), (2) the region under the implanted CS electrode was comprised almost entirely of intact cortical tissue, and (3) initiation of CS/RT was 7 weeks postinfarct (though an effect of this delay cannot be entirely ruled out). The present results are consistent with the results of a larger clinical trial (Everest trial) of CS/RT therapy in which primary measures of upper extremity motor function showed no difference between CS/RT and RT at the end of therapy.19,20,26 Subgroup analysis of the Everest data suggests that another key factor affecting CS/RT efficacy is the integrity of descending pathways between motor cortex and the spinal cord.19,20 This factor is not likely to be relevant to the present results, as the integrity of descending pathways in the monkeys was demonstrated by the responsiveness of premotor cortex to ICMS mapping (DFL and non-DFL regions) and to MT determination procedures.
Nonhuman primates, including squirrel monkeys, are well suited to examine translational aspects of putative rehabilitative therapies, as they share many neurological complexities with humans. Compared with rats, squirrel monkeys possess multiple distinct motor cortical areas, greater cortical thickness and neuropil volume, and a greater ratio of white matter to gray matter,37,38 though their brains are less gyrencephalic than humans and contain substantially fewer direct corticomotoneuronal connections in the spinal cord.39,40 While it is unclear if any one factor carries substantially more weight than others, it can be assumed that a nonhuman primate model will better predict the outcome of the therapy in humans than one based solely on rodent results.
It is noteworthy that epidural cathodal stimulation over the affected region of motor cortex has been found more effective than anodal stimulation in rodents for enhancing poststroke recovery,11,13 whereas human noninvasive (ie, extracranial) stimulation methods such as tDCS (transcranial direct current stimulation) often produce superior results using anodal stimulation over the target region.8,41,42 Epidural and extracranial anodal stimulation requires lower current amplitudes to produce cortical excitation, whereas cathodal stimulation within cortical tissue via ICMS requires lower amplitudes than anodal-ICMS. 43 Cathodal current was chosen in the present study based on results from rodent studies that used the same Northstar Neuroscience stimulator system and whose outcomes favored cathodal over anodal.11,13 However, in light of the present results, the interspecies neurological differences, and the differences in electrode proximity to the cortical tissue between invasive and noninvasive stimulation techniques, it remains unclear whether cathodal or anodal would be the optimal polarity in our model of poststroke CS/RT therapy.
Before dismissing CS/RT as a viable therapy in human and nonhuman primates, it is important to note that a recent subgroup analysis of the Everest trial data demonstrated that CS/RT resulted in continued functional improvement up to 24 weeks posttreatment, whereas RT alone resulted in substantial regression of motor function from 12 to 24 weeks posttreatment. 19 In the present monkey study, there was a slight reduction in performance in the RT group and a slight continuation of improvement in the CS/RT group by the end of the follow-up period (Figure 3). Monkeys were tracked for 12 weeks, suggesting that a longer follow-up period may have paralleled the recent Everest results. That is, CS/RT may be effective, but its benefits may not be completely evident until long after treatment has been completed. Additionally, there are a variety of design factors that could influence the effectiveness of CS/RT, including the postinfarct timing of therapy initiation, the intensity of the rehabilitation experience, and the target location selected for CS application. A complete examination of these parameters was beyond the scope of the present study, but should be considered in future investigations.
The premise of CS/RT therapy is that CS will enhance RT-associated recovery mechanisms, but in the absence of differential effect of CS/RT versus RT on behavioral recovery, it is reasonable to ask whether the RT protocol was effective at all. Frost et al 27 examined spontaneous recovery of motor performance on the pellet retrieval task for 12 weeks after an M1 DFL infarct. Recovery during weeks 7 to 12 postinfarct was 33% relative to baseline performance. 27 In the present study, RT was conducted during weeks 7 to 12 postinfarct for the RT and CS/RT groups, and recovery was 42% for both groups (Figure 3). While only a 9% difference relative to their respective performance at week 6 postinfarct, this was a 27% improvement in recovery for both RT-treated groups compared to spontaneous recovery. The infarcts produced by Frost et al 27 were smaller (81% of M1 DFL) than in the present study (98% of M1 DFL), so it is reasonable to conclude that spontaneous recovery would be somewhat reduced after a larger infarct and that RT would yield correspondingly larger improvements. Thus, while CS/RT did not enhance recovery compared with RT alone, it is clear that the rehabilitation protocol used in both groups did produce modest gains in performance.
In contrast to prior CS/RT therapy studies,13,14,34 expansion of spared DFL representations was greater in the RT group rather than the CS/RT group. Expansion of cortical representational areas is generally considered to be a correlate of acquired (and recovered) motor skills,23,25,27,28,44-50 reflecting a combination of changes in synaptic strength, synaptogenesis, and sprouting of new axonal connections between neurons within the motor cortex. In light of the equivalent behavioral recovery in both groups, there are several, possibly concurrent, explanations for the mapping results found in the present study. First, although map expansion is usually posited to reflect the underlying changes in neural circuitry that support the newly acquired skills, it is improbable that such large scale functional expansion would persist indefinitely, as this would imply a “ceiling effect” on the ability to learn additional new skills in the future. Thus, CS may have accelerated the consolidation process for the neural circuits that supported the reacquired skills, resulting in less PMD map expansion in the CS/RT group. Alternatively, CS may have interfered with the normal synaptic and axonal plasticity mechanisms that support map expansion within the region directly affected by CS (perhaps as a function of current polarity). If so, recovery-related plasticity still could have occurred in other structures within the motor system in the form of terminal sprouting in the afferent targets of PMD, such as red nucleus, spinal cord, or another cortical area such as PMV. In this regard, it is interesting that PMV in the CS/RT group showed significant changes in digit (decreased) and wrist/forearm (increased) representations, whereas PMV representations did not change in the RT group. Finally, although task outcomes were equivalent, it is possible that CS could have influenced the specific compensatory strategies used by the monkeys, such that RT group favored the involvement of PMD whereas the CS/RT group favored PMV involvement. PMD and PMV are considered to have different roles in the control of limb movement, with PMD being more involved in reaching into interpersonal space (eg, moving the hand to the food well) and PMV being more involved in hand-to-body interactions (eg, bringing a food pellet to the mouth). Expanded wrist/forearm map areas in both groups suggest that wrist and forearm movements were critical to task success after the infarct, but we did not examine movement kinematics to determine whether there were differences in the reaching versus retrieval phases of task performance between the 2 groups.
It is unfortunate that the random distribution of animals into RT and CS/RT groups resulted in a visibly notable, though statistically insignificant, difference in the size of the baseline DFL maps in PMD (Figure 4, top row, middle graph), but it raises a question about whether the nonexpansion of DFL maps in the CS/RT group was due to a size limit on the PMD maps. The 2 smallest baseline PMD maps were in the RT group (0.24 and 0.22 mm2), and the largest baseline PMD map was in the CS/RT group (3.61 mm2); these 3 maps account for most of the apparent difference in average baseline seen in Figure 4. However, of the 12 monkeys in Figure 6, these 3 monkeys also had the first (from 3.61 to 6.33 mm2), second (from 0.24 to 2.05 mm2), and fourth (from 0.22 to 1.50 mm2) largest increases in PMD area, suggesting that a limit on map size is unlikely to account for group differences in map area. As Figures 4 and 6 indicate, the change in PMD DFL area in the CS/RT group was more variable than in the RT group. Figure 6 also indicates that 3 of 7 CS/RT monkeys had >90% recovery on the behavior task, whereas only 1 of 5 RT monkeys had >90% recovery, hinting that CS/RT may have been effective in a subgroup of the monkeys. It is unclear what factor(s) might account for this possible subgroup outcome in the CS/RT monkeys.
An interesting difference between the monopolar stimulation experiments conducted in rats versus monkeys was the location of the return electrode relative to the central nervous system. In rats, the return electrode was placed near the occipital skull,11,13,33,35,36,51,52 such that the current path between electrode poles was largely confined to the cranial chamber (cerebrum and cerebellum), with a direction of charge flow that was approximately transverse to the radial orientation of the corticospinal neurons within the target cortical tissue. In monkeys, however, mid-torso implantation was necessitated by the size of the return electrode. This placement produced a current path that potentially included the entire motor axis (cerebrum through spinal cord), with a direction largely parallel to the orientation of the corticospinal neurons. It is unclear, and beyond the scope of the present study to examine, to what extent these differences in current paths may have affected the response of the nervous system to CS, though modelling studies suggest that the effect of anodal or cathodal polarity on neuronal activity is dependent on neuron orientation relative to the electrode contact. 53 Anecdotally, the evoked responses during MT determination using bipolar stimulation in our prior nonhuman primate study produced precise movements of discreet body parts (eg, elbow flexion or toe extension) in a visible rhythm consistent with the 50 Hz stimulation frequency. 14 In contrast, responses evoked in monkeys by monopolar stimulation were nonsynchronized, nondiscreet movements of axial body elements (head, neck, torso), implying a physiological difference in motor system activation using bipolar versus monopolar stimulation in nonhuman primates. Human trials, including Everest, used only bipolar stimulation, in which both electrode poles overlay the target cortical tissue.16-20 However, the gyri and sulci of the human brain likely would have produced a mixture of parallel and transverse current flows with respect to the corticospinal neurons regardless of whether a bipolar or monopolar contact arrangement was used. Furthermore, it is unknown how return electrode location might have affected clinical outcomes.
In conclusion, monopolar CS/RT in monkeys failed to promote enhanced behavioral recovery after cortical ischemic stroke during the therapy period compared with RT alone. However, there may have been some secondary benefit for improved skill retention during follow-up testing. It is unclear from the present results whether monopolar CS/RT is simply ineffective in nonhuman primates, though it seems more likely that the translation of CS methodology from rat to monkey was inadequate. Further studies would be needed to more conclusively address this issue.
Footnotes
Acknowledgements
The authors thank Bob Cross for behavior testing and Drs David Guggenmos and David McNeal for assistance with collection of mapping data.
Authors’ Note
A portion of these results has previously appeared in abstract form at the 2007 Society for Neuroscience Annual Meeting.
Declaration of Conflicting Interests
The authors declared no potential conflicts of interest with respect to the research, authorship, and/or publication of this article.
Funding
The authors disclosed receipt of the following financial support for the research, authorship, and/or publication of this article: This work was supported by the National Institutes of Health (NIH; grant numbers NS48126, NS30853, and HD02528) and Northstar Neuroscience, Inc (Seattle, WA, USA).
References
Supplementary Material
Please find the following supplemental material available below.
For Open Access articles published under a Creative Commons License, all supplemental material carries the same license as the article it is associated with.
For non-Open Access articles published, all supplemental material carries a non-exclusive license, and permission requests for re-use of supplemental material or any part of supplemental material shall be sent directly to the copyright owner as specified in the copyright notice associated with the article.