
Abstract
Background. Poststroke lower-limb spasticity (LLS) has been shown to degrade standing balance control by disrupting the temporal synchronization between individual limb centers of pressure (COPs). Time-varying changes in standing balance control associated with alterations in the extent of LLS have yet to be documented and are important to informing treatment strategies to improve such functional outcomes. Objective. The present work aimed to understand the natural recovery of standing balance control among stroke survivors with LLS using limb-specific indices of standing balance control. Furthermore, we sought to understand if time-varying changes in LLS were associated with alterations in standing balance control. Methods. A retrospective analysis of 92 participants was performed; 47 participants never exhibited LLS during the study (No_LLS), and 45 participants exhibited LLS during at least 1 testing session (LLS). Quiet standing for a duration of 30 s on 2 force platforms was recorded. Temporal synchrony and spatial symmetry of COP displacements were assessed, along with interlimb weight-bearing symmetry. Results. All variables, except spatial symmetry, indicated initial improvement followed by deceleration in the rate of balance control recovery. Limb-specific measures indicated that individuals with LLS exhibited deficits in balance control. The recovery trajectories were not different between groups, suggesting a similar rate, but reduced extent, of balance control recovery among the LLS relative to the No_LLS group. Only temporal synchrony was altered by time-varying changes in spasticity. Conclusions. The present results suggest that the reduction in spasticity may be beneficial to balance control recovery.
Introduction
Falls after stroke continue to pose a significant health concern 1 and are a central component of the medical complications experienced by stroke survivors. 2 Cross-sectional studies indicate that fall prevalence among stroke survivors increases over time, rising from 7% during the first week following stroke 3 to 40% to 73% at 6 months and beyond.4,5 Given the multifactorial nature of fall risk poststroke,6-8 which includes impairment in balance control, it is possible that the influence and interaction of such risk factors exhibit time-varying changes, which can influence fall prevalence over time. The present work sought to examine the factors influencing the time-varying alterations in balance control poststroke.
Traditional methods for evaluating standing balance control poststroke have focused on displacements of the net center of pressure (COPnet)9,10 and weight-bearing symmetry,11-13 which quantifies the combined output from both limbs. However, given the lateralized sensorimotor effects of stroke, these global measures of standing balance control (particularly the COPnet, which quantifies the combined neuromuscular control of the center of mass arising from both limbs) may mask lateralized balance control challenges among this population. Indeed, both the symmetry in amplitude and high temporal synchronization of individual-limb COP displacements typically observed among healthy individuals 14 are disrupted following stroke.15-19 Consequently, metrics that capture the individual limb contributions to balance control may be helpful in quantifying alterations in balance control brought about by recovery following stroke.
Further contributing to the challenges in standing balance control among stroke survivors is the extent of lower-limb spasticity (LLS) affecting the ankle joint. Spasticity, a velocity-dependent increase in tonic stretch reflexes, 20 which occurs in conjunction with other features of the upper motor neuron (UMN) syndrome, such as paresis, altered agonist-antagonist muscle sequencing, dystonia, and soft-tissue stiffness.21,22 Spasticity (and its associated features) further alters the ability to regulate muscle force output from the affected limb during standing balance, which disrupts the temporal synchronization between individual limb COPs. 23 However, the extent to which balance control is altered by fluctuations in the extent of LLS and associated pathologies that occur with the passage of time24,25 remains unclear. Such knowledge may inform the potential impact and timing of spasticity management interventions. 26
To this end, we sought to examine the trajectory of recovery of standing balance control among patients with poststroke LLS, as quantified by improvements in interlimb temporal synchrony of COP displacements, spatial symmetry of COP displacements, and weight-bearing symmetry.18,23 We aimed to (a) characterize balance control recovery trajectories using the abovementioned 3 metrics; (b) determine if the recovery trajectories among individuals with LLS at any point during the study differed from those who never developed spasticity; and (c) explore the potential for time-varying changes in individual levels of ankle spasticity to account for alterations in the trajectory of recovery of standing balance. Consistent with previous research,27-30 we hypothesized that control of standing balance would improve over time, with an initial increase followed by a deceleration in the rate of recovery. We also hypothesized that individuals who experienced spasticity at any point within the study would exhibit a less-rapid and reduced extent of balance control recovery. Finally, we hypothesized that the time-varying level of spasticity would account for a significant proportion of the within- and between-subject variance in the recovery of standing balance control poststroke. We believed that such between-group differences and recovery trajectories would only be apparent for measures of interlimb temporal synchrony and weight-bearing symmetry.
Methods
Participants
Data were obtained from the Heart and Stroke Foundation Canadian Partnership for Stroke Recovery Rehabilitation Affiliates Longitudinal Database, which contains data collected at 4 hospitals, as part of a larger examination of the recovery of sensorimotor and cognitive function poststroke. Assessments were planned to occur as temporally proximate as possible to the following schedule: stroke onset, and again at 6, 12, and 24 months poststroke. At each site, clinical scores were obtained by the same research physiotherapist throughout the duration of the study. Balance metrics were obtained by research staff who had each received training from the same research physiotherapist, located at the lead site. All balance assessments at all sites followed identical protocols.
Participants were included in the analysis if they underwent an initial assessment within 90 days of first-ever stroke, could stand independently for 30 s, could understand and follow instructions, and underwent at least 3 assessments during which standing balance data were collected (necessary to model linear effects). A total of 103 participants met these initial criteria. Participants were excluded if they exhibited bilateral LLS (n = 2) or bilateral motor impairment (n = 1), as assessed with the ankle and knee components of the Modified Ashworth Scale (MAS) 12 and leg and foot components of the Chedoke-McMaster Stroke Assessment (CMSA), 31 respectively. Given the focus on spasticity of the ankle musculature, individuals were also excluded if they presented with only spasticity of the knee extensors without ankle plantarflexor spasticity (n = 8). A total of 92 participants were retained for analysis; 47 participants never exhibited LLS during the course of the study (No_LLS), and 45 participants exhibited LLS (ie, ankle spasticity, with or without knee spasticity) during at least 1 testing session (LLS). Two participants exhibiting LLS were receiving oral baclofen to manage spasticity, which continued throughout the study duration. Individual testing sessions were excluded from analysis in the event of incomplete data pertaining to the abovementioned assessments, necessary for the inclusion of time-invariant and time-varying covariates within the model. Participant characteristics at the initial intake to the study are reported in Table 1.
Participant Characteristics at Study Intake. a
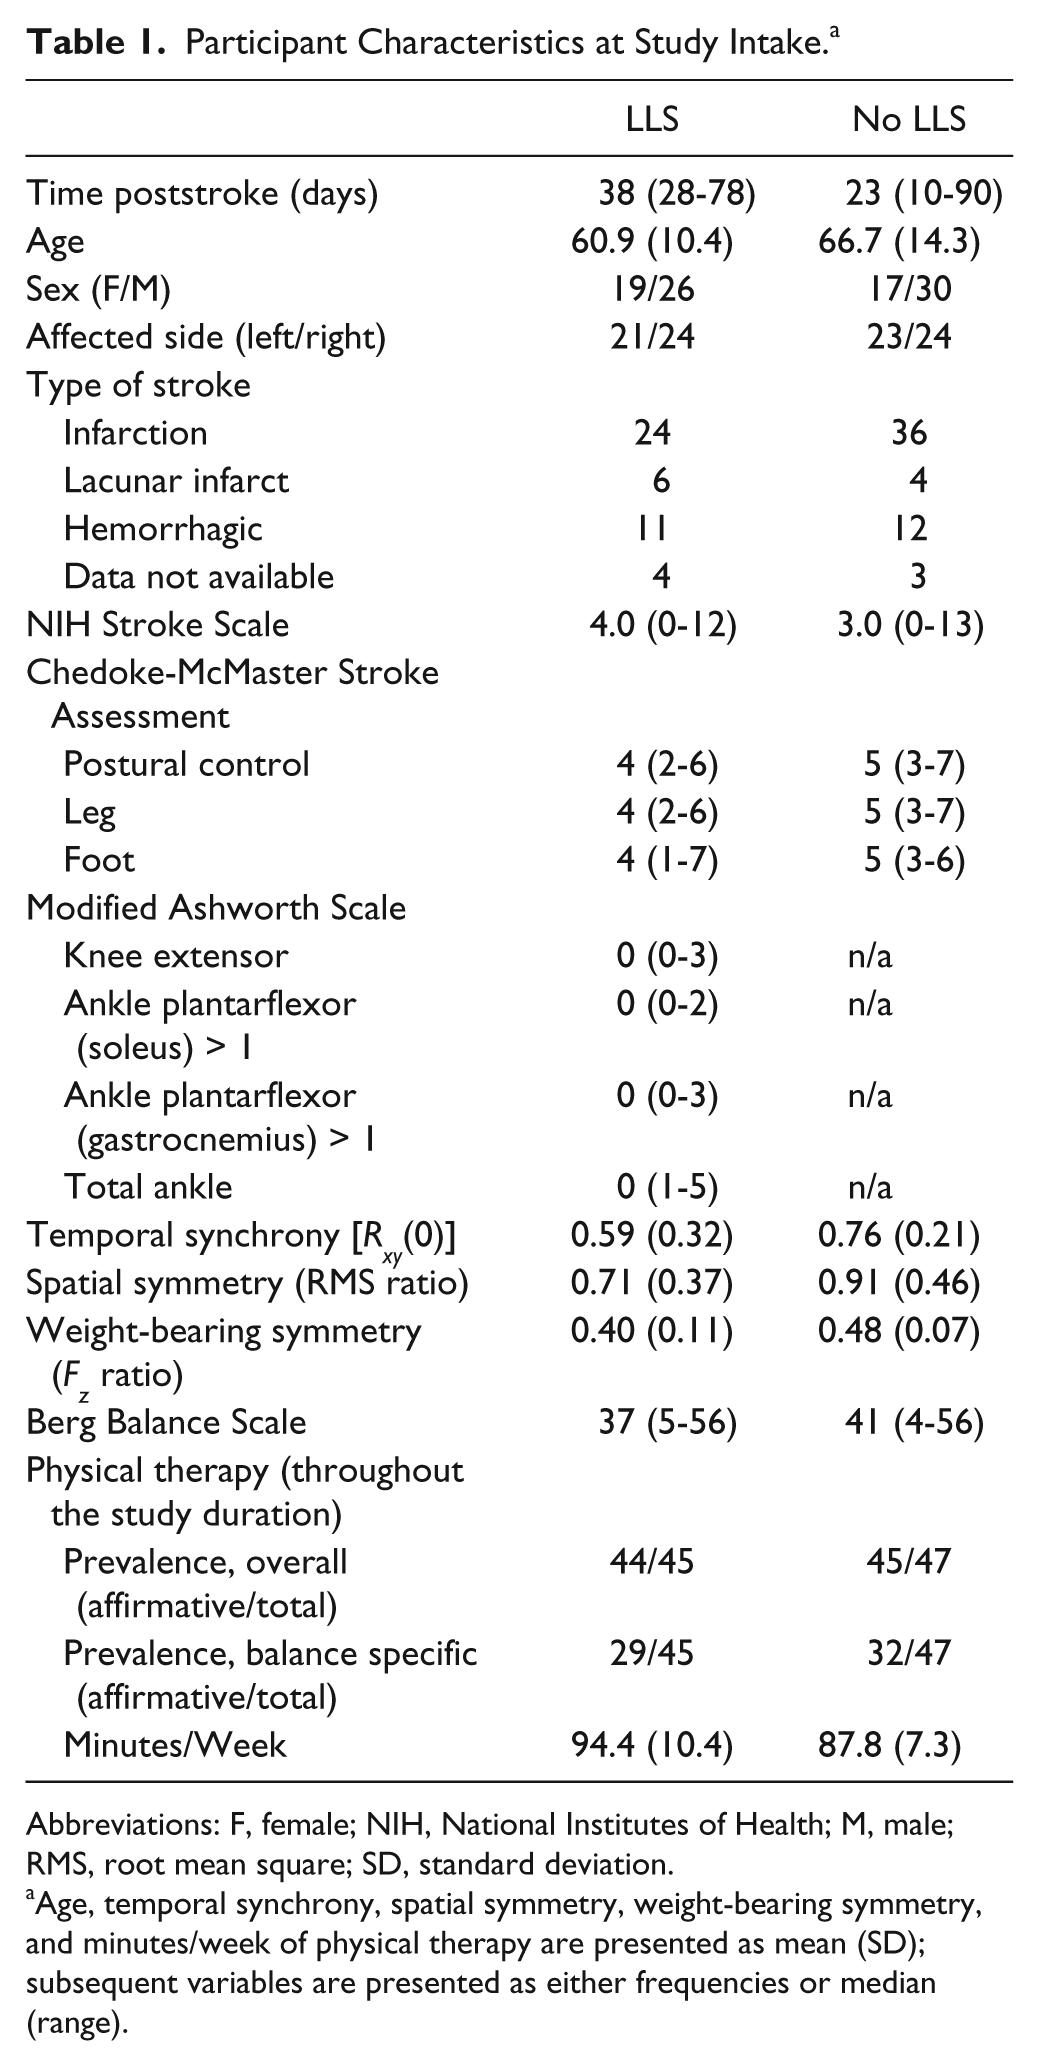
Abbreviations: F, female; NIH, National Institutes of Health; M, male; RMS, root mean square; SD, standard deviation.
Age, temporal synchrony, spatial symmetry, weight-bearing symmetry, and minutes/week of physical therapy are presented as mean (SD); subsequent variables are presented as either frequencies or median (range).
Instrumentation and Protocol
Ground reaction force and moment components were synchronously sampled (200 Hz) from 2 force platforms (Bertec Corp. Columbus, OH) arranged in a side-by-side configuration (y-axes in parallel—anteroposterior direction), separated by approximately 1 mm (force platform linearity: 0.2% full-scale output; resolution: 0.02% full-scale). Participants performed a single trial of quiet standing, during which they stood as still as possible for 30 s. One foot was positioned on each force platform in a standardized position: 17 cm between heels, with each foot externally rotated 14° from the median plane. 32
Data Analysis
Raw force and moment components were low-pass filtered using a zero-lag, fourth-order Butterworth filter with a cutoff frequency of 15 Hz; individual-limb COPs were calculated. Vertical force components from beneath each limb were averaged over the course of the entire 30-s trial. Weight-bearing symmetry (Fz ratio) was calculated as the ratio between the average vertical force from the affected limb and the average net vertical force (ie, summation of vertical force components from both limbs).
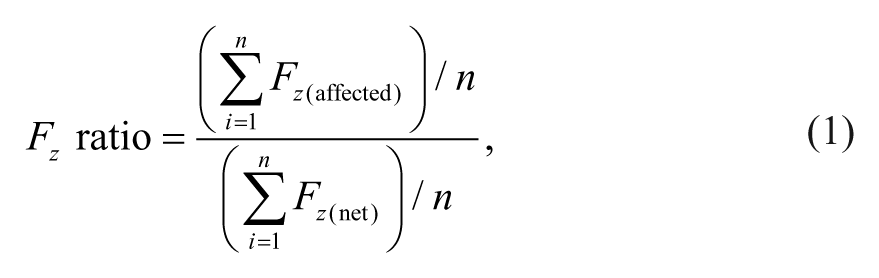
where n is the number of frames of data within the 30-s trial. Ratios less than 0.5 indicated that a reduced proportion of weight was borne by the affected limb. Because the MAS was used to grade spasticity in the ankle plantar/dorsiflexors, which largely contribute to balance by altering the anteroposterior (AP) COP position, attention was focused on the individual-limb COP in the AP direction. The cross-correlation function was calculated using AP COP time series from right and left limbs, after subtracting their respective mean values; the cross-correlation coefficient at zero phase-lag [Rxy(0)] was extracted for analysis. As a measure of COP spatial symmetry (root mean square [RMS] ratio), the ratio of the RMS COP displacements between the affected and less-affected limbs was calculated for the AP direction.
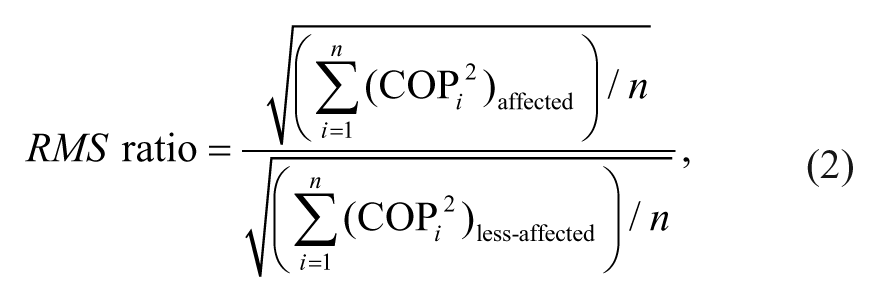
where n is the number of frames of data within the 30-s trial. The score on the Berg Balance Scale (BBS) was used as a global measure of balance control.
Secondary Analyses: Individual-Limb AP RMS Displacements
Given that time-varying changes in the RMS ratio could occur via alterations in the RMS COP displacement of either limb, we extracted the affected and less-affected limb RMS COP displacements for entry into separate growth curve models, as described below.
Statistical Analysis
A hierarchical growth curve model was used to analyze all dependent variables within the study. This approach was used rather than repeated-measures ANOVA because it allows for the inclusion of both time-invariant and time-dependent covariates (including time itself), missing data points, and unbalanced longitudinal data. 33 Furthermore, a hierarchical growth curve model allows for nonzero covariance between observations of the dependent variable arising from the same level of a random factor (ie, subject, in this case). During the exploratory data analysis phase, a 3-level model was tested, which assessed the appropriateness of grouping participants by spasticity status, irrespective of the hospital at which they were assessed. These initial models indicated no differences between hospitals and no differential effect of hospital site on spasticity status or recovery trajectory. As a result, the present model included 2 levels: the level-1 model described the within-individual change and the effects of any time-varying predictors; the level-2 model described the between-person differences and the effects of any time-invariant predictors.
A hybrid model formulation was used for the present analysis. The initial model—the unconditional growth curve model (UGCM)—included only the linear and quadratic effects of time without any covariates. This model specifically allowed the determination of whether there were any time-dependent changes in the dependent variables. A second model was formed that included a grouping variable based on the presence or absence of LLS at any point throughout the study, along with the maximum number of fixed effects and interactions among covariates (with the exception of total ankle MAS). This model permitted the evaluation of group-related differences in recovery trajectories, after accounting for important covariates. A final model was formed with a loaded mean structure, 34 which included the maximum number of fixed effects and interactions among covariates, allowing the assessment of all study hypotheses pertaining to each dependent variable while accounting for all available covariates. All 3 initial models included a complete set of random effects and residual variance for measurements on the same individual using an unstructured covariance matrix.
After including the most complete set of fixed effects, an appropriate set of random effects was selected. Hypotheses concerning the necessity for inclusion of each random effect were assessed using restricted maximum likelihood–based tests for the covariance parameters, which compares the nested (without random effect) and reference (with random effect) models. 35 Under conditions in which the likelihood ratio test statistic was adequately large (ie, was statistically significant), the reference model was retained. In contrast, when the likelihood ratio statistic was not statistically significant, the nested model was favored.
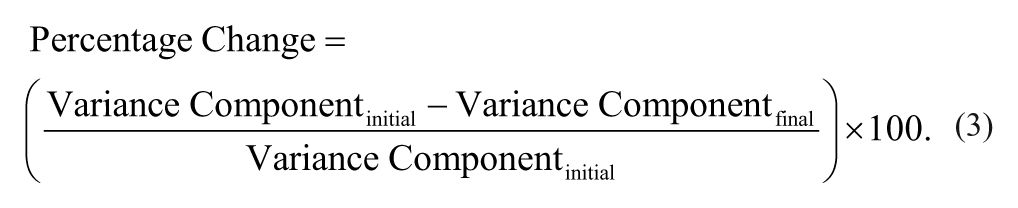
Finally, we used likelihood ratio tests based on maximum likelihood (ML) estimation to determine the best set of fixed-effect parameters to include in the model. The reference and nested models included identical sets of random effects but differed in the set of fixed-effect parameters. Significance levels for each fixed-effect parameter were reported using the t-statistic with a Satterthwaite approximation of the degrees of freedom. As an estimate of the reduction in variance resulting from the inclusion of fixed and time-varying covariates, we calculated the percentage change in the measures of within- and between-subjects variance.
The full model for the dependent variable included a set of time-varying (time poststroke; CMSA foot score; MAS total ankle score) and time-invariant (National Institutes of Health Stroke Scale [NIHSS] at the initial visit; group [presence or absence of ankle spasticity]) fixed effects. Time poststroke was scaled in months and centered such that the intercept represented the mean of the dependent variable at 6 months poststroke, for consistency with our previous research.23,36 A quadratic effect of time was also included in the model. As the level of ankle impairment (CMSA foot score) may also influence balance outcome measures in addition to the presence or absence of spasticity, the CMSA foot score was included in the model and centered at 7, such that the intercept represented the mean of the dependent variable when there was no ankle impairment. In addition to a random intercept, we included the linear effect of time as a random variable (ie, random slope) to explore the potential that individuals vary both in their initial status and recovery over time.
Results
Temporal Synchrony
The final model (Table 2), after inclusion of covariates (ie, NIHSS and CMSA), revealed a significant difference between LLS and No_LLS groups at 6 months poststroke. The intercept represents the mean cross-correlation coefficient obtained from the reference group (ie, No_LLS) at 6 months poststroke—namely, Rxy(0) = 0.864. The difference in the LLS group, relative to the No_LLS group is represented by the spasticity status parameter: the LLS group exhibited a 0.083 unit reduction in the cross-correlation coefficient—namely, Rxy(0) = 0.78). Alterations in the time-varying level of LLS suggested that the cross-correlation coefficient would reduce by 0.046 units immediately following each 1-level increase in the MAS. There were no interactions between spasticity status and either the linear or quadratic time parameters, suggesting that the temporal changes were similar for both groups. As such, all participants exhibited a linear improvement in temporal synchrony by 0.007 units per month (as indicated by the linear time parameter), although the negative quadratic time parameter indicated that the rate of improvement decreased with increasing time poststroke (Figures 1A and 1B).
Final Hierarchical Growth Curve Models Detailing Factors Associated With Change in Balance Outcome Measures. a
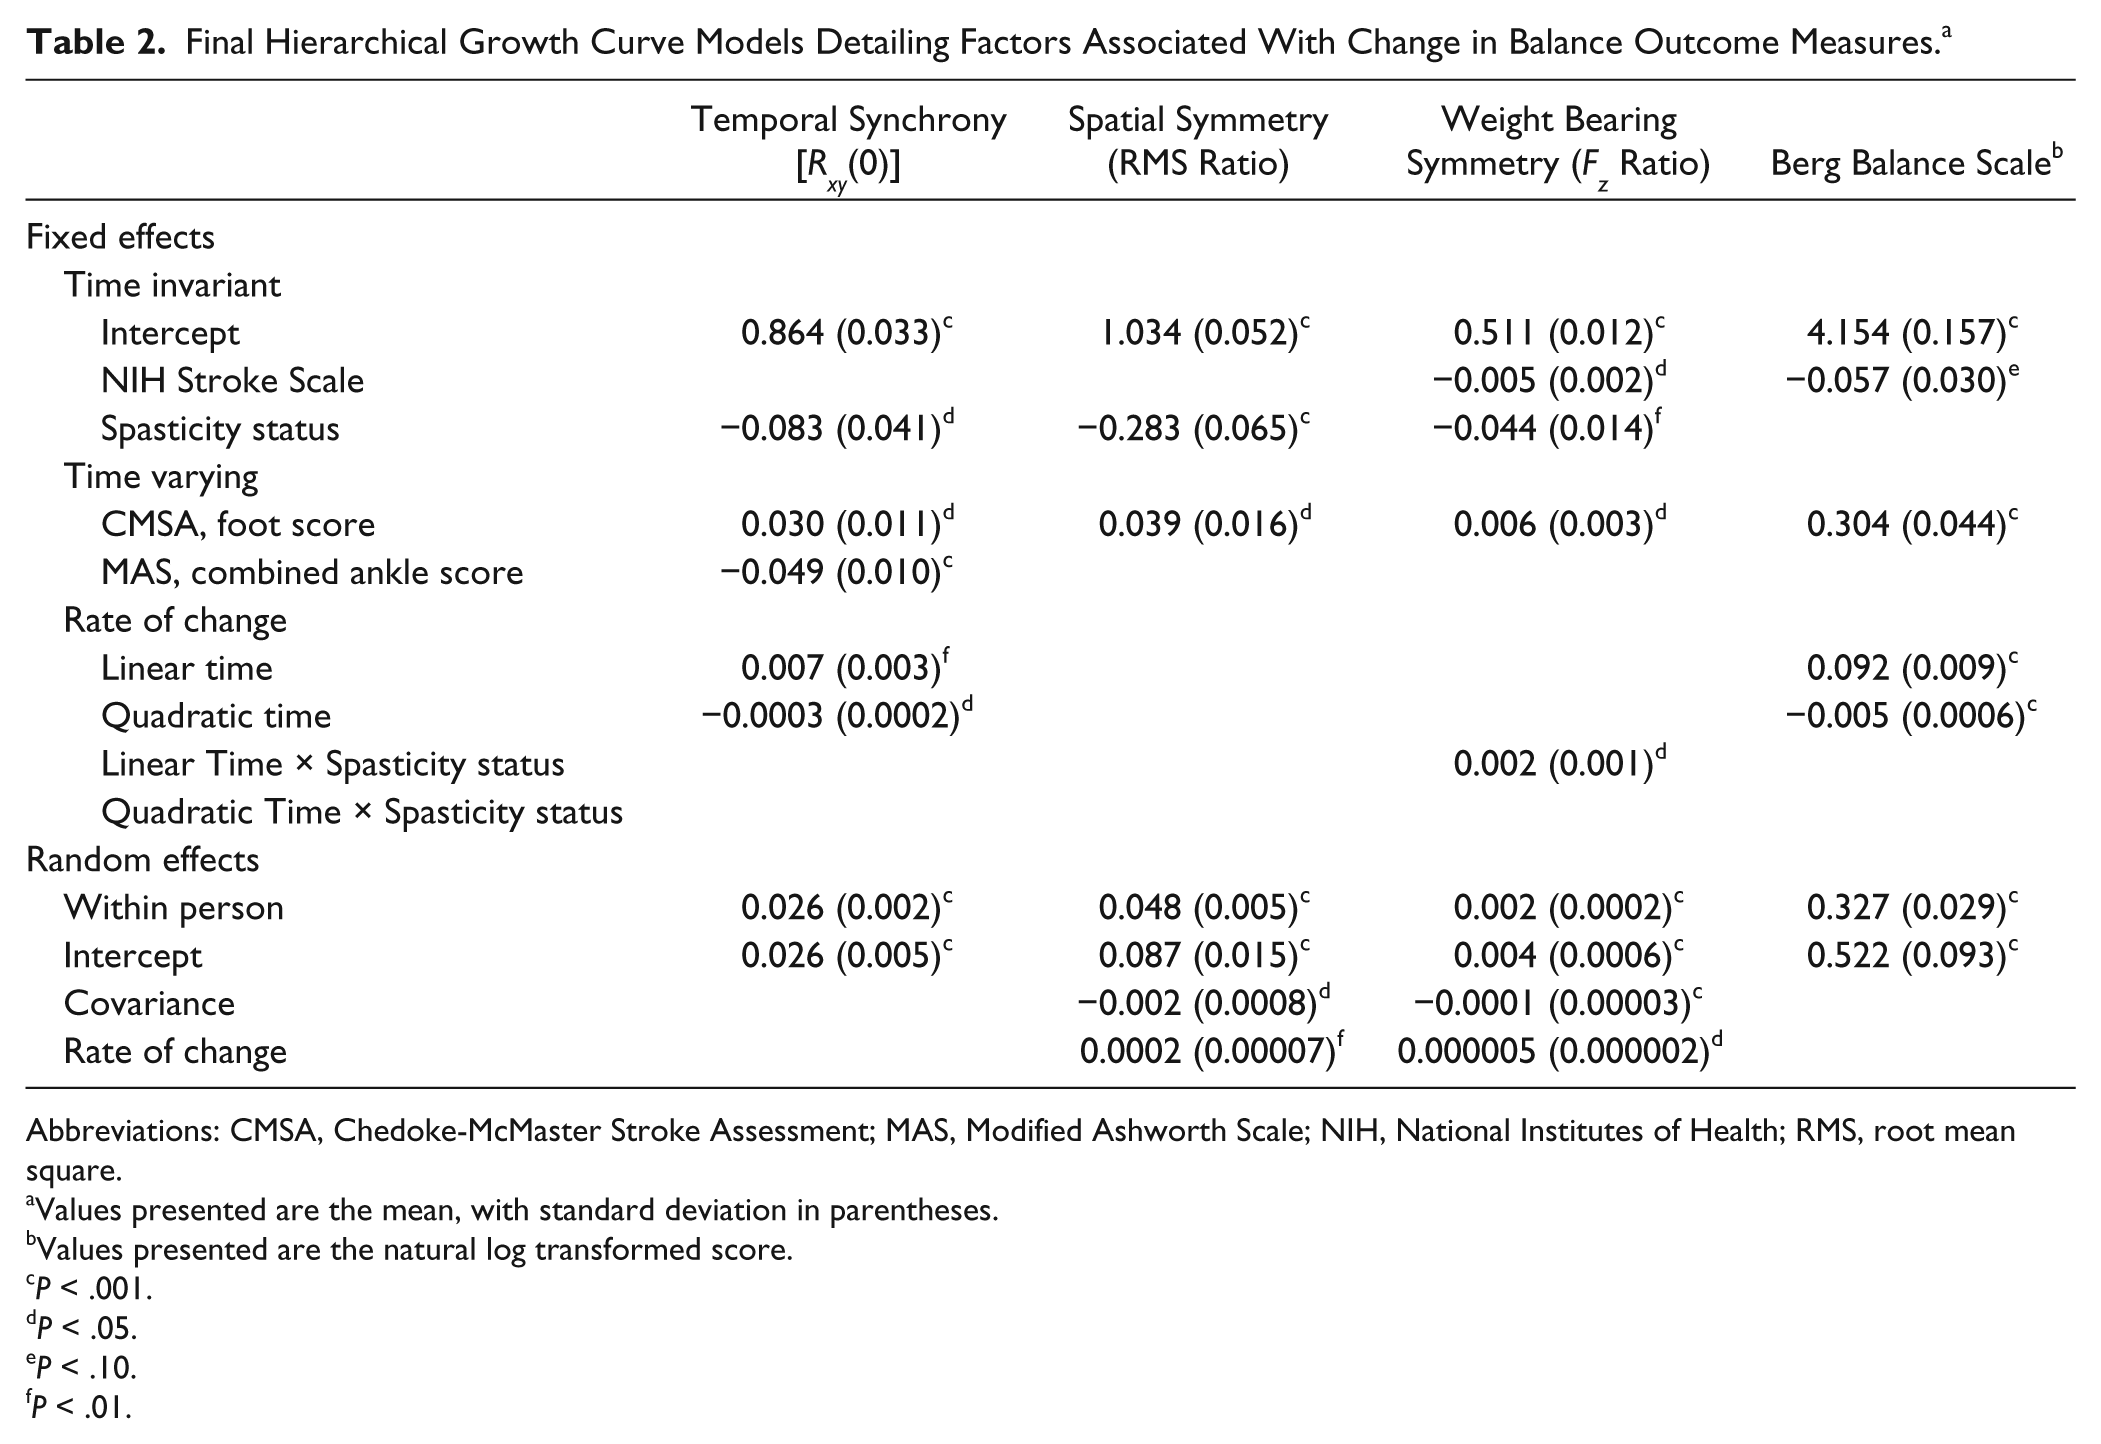
Abbreviations: CMSA, Chedoke-McMaster Stroke Assessment; MAS, Modified Ashworth Scale; NIH, National Institutes of Health; RMS, root mean square.
Values presented are the mean, with standard deviation in parentheses.
Values presented are the natural log transformed score.
P < .001.
P < .05.
P < .10.
P < .01.
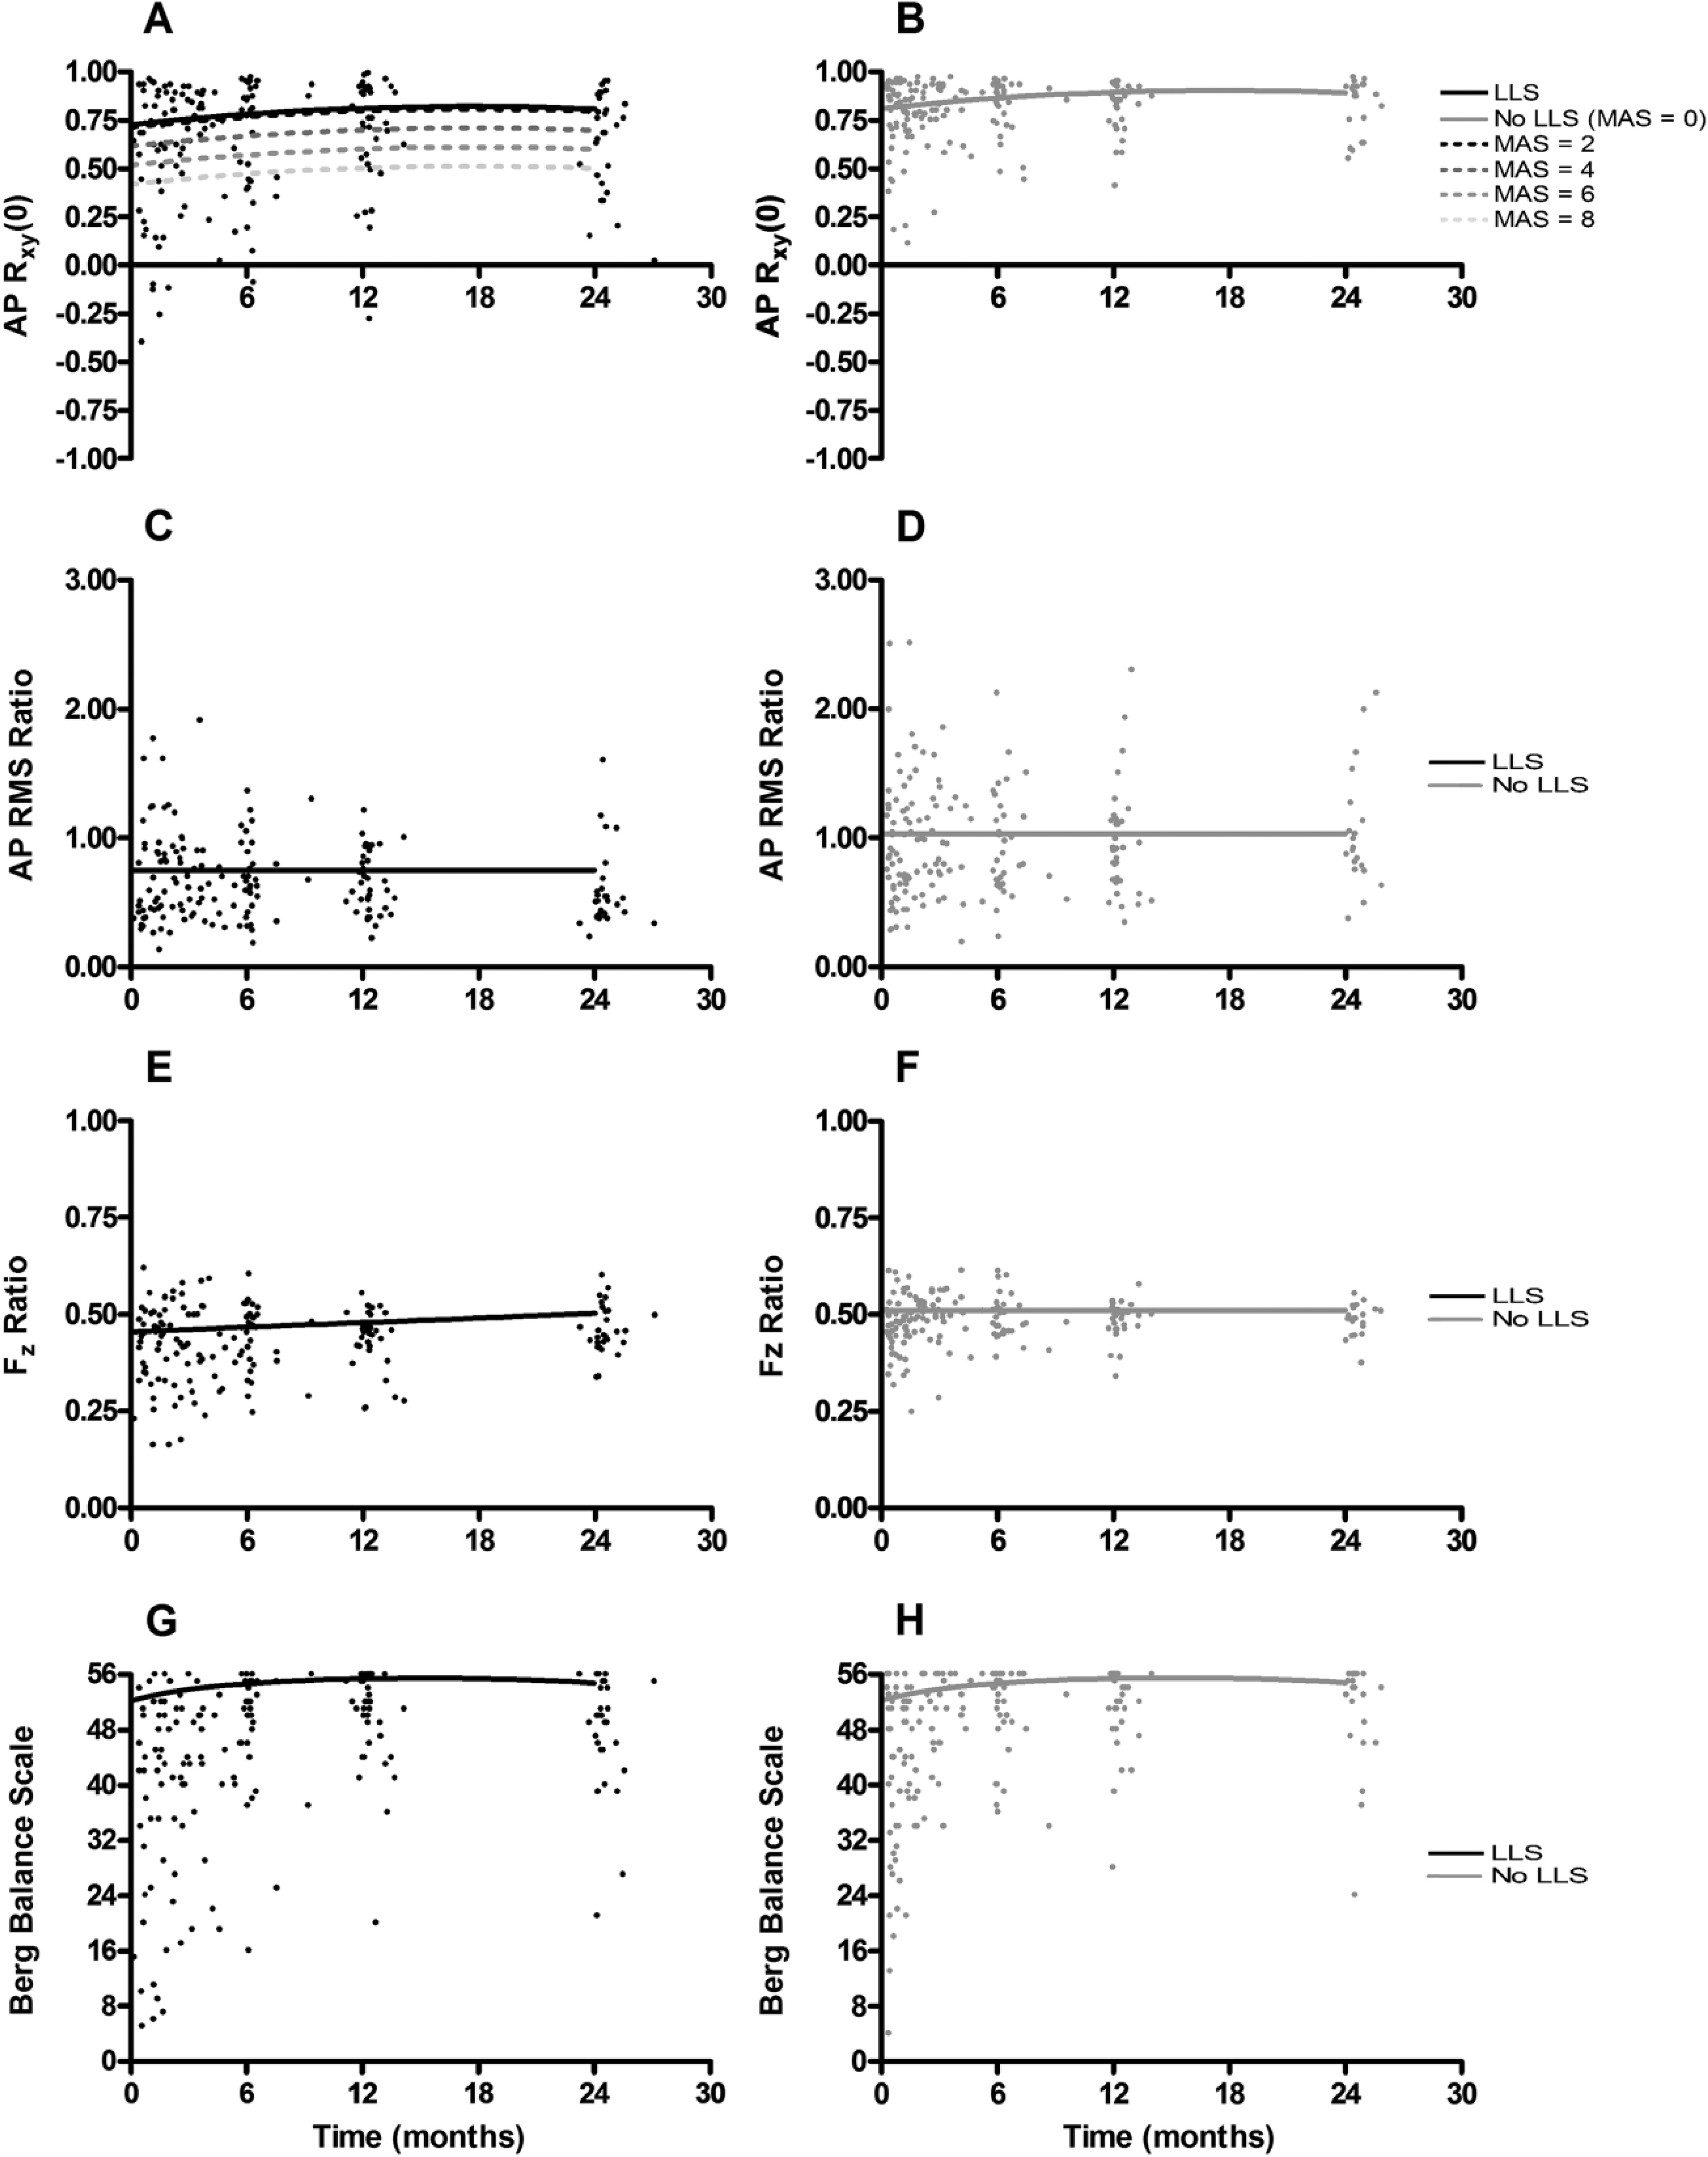
Estimated mean growth curves (lines) superimposed on individual participant data points (dots) for participants with lower-limb spasticity (LLS; panel A; left) and those without LLS (panel B; right). Temporal synchrony [Rxy(0)] is presented in panels A and B. Solid lines signify average growth curves for those with (black, right) and without LLS (gray, left). Dotted lines signify average growth curves stratified by Modified Ashworth Score (MAS). Spatial symmetry (AP root mean square [RMS] ratio) appears in panels C and D for individuals with (left) and without LLS (right). Weight-bearing symmetry (Fz ratio) is presented in panels E and F for individuals with (left) and without (right) LLS. Berg Balance Scale is presented in panels G and H for individuals with (left) and without LLS (right).
Examination of the random effects (Table 2) revealed significant within-person variance in the final model after inclusion of level-1 covariates. The within-person variance in the UCGM was 0.027, which decreased only slightly to 0.026 in the final model (4% change). Significant between-person variability in cross-correlation coefficients at 6 months poststroke also continued to exist in the final model after inclusion of level-2 covariates, as indicated by the random-effects intercept. The variance in the UGCM was 0.039, which was reduced by 33% with the inclusion of level-2 covariates in the final model. Removal of the random slope did not adversely affect model fit [χ2(1:2) = 1.67; P = .32], nor did removal of nonsignificant fixed effects [χ2(3) = 3.12; P = .37].
Spatial Symmetry
The final model (Table 2), after inclusion of significant covariates, suggested a significant difference based on spasticity status (ie, presence or absence of LLS). Specifically, the intercept of 1.034 represents the RMS ratio at 6 months poststroke in the reference group (ie, No_LLS); the LLS group exhibited a 0.283-unit reduction in the RMS ratio relative to the reference group (ie, 0.751). Removal of nonsignificant fixed effects did not adversely affect model fit: χ2(6) = 7.03; P = .32 (Figures 1C and 1D).
Examination of the random effects suggested that there remained significant within-person variance in the final model after inclusion of level-1 covariates. The variance in the UCGM (0.050) decreased by only 4% in the final model (0.048). The random-effects intercept suggested that significant between-person variability in the RMS ratio at 6 months poststroke remained after inclusion of level-2 covariates in the final model. This variance component in the UGCM (0.110) was reduced by 21% in the final model (0.087). There was also significant between-person variability in the rates of change of the random effects, which remained unchanged in the final model. Finally, there was significant covariance between the 2 random effects, suggesting that an individual with a higher COP symmetry at 6 months poststroke exhibited a reduced rate of change.
Weight-Bearing Symmetry
After including covariates within the full model (Table 2), a significant difference was observed between groups at 6 months poststroke, as revealed by the spasticity status parameter. Specifically, the intercept revealed that the reference group (ie, No_LLS) bore 51.1% of their weight on the affected limb; the LLS group bore 4.4% less weight on the affected limb (ie, 46.7%). The significant linear time-by-spasticity interaction in the rate of change indicated a differential effect of spasticity on the linear time trend. The absence of a significant linear time parameter indicated no time-varying change among the reference group (ie, No_LLS). The linear time-by-spasticity status parameter indicated that the LLS group increased the weight placed on the affected limb by 0.2% per month relative to the No_LLS group (Figures 1E and 1F).
Examination of the random effects revealed that significant within-person variance remained in the final model, which remained unchanged after inclusion of level-1 covariates. Significant between-person variability in both the between-person intercepts and rates of change in weight-bearing symmetry remained in the model after inclusion of level-2 covariates. There was significant covariance between the 2 random effects, suggesting than an individual with more symmetrical between-limb loading exhibited a smaller rate of change.
Berg Balance Scale
After the inclusion of covariates within the final model (Table 2), neither spasticity status nor MAS score were significant predictors of the transformed score on the BBS. The linear time and quadratic time parameters continued to indicate an increase in the score on the BBS over time, with diminishing amounts of improvement with increasing time poststroke (Figures 1G and 1H).
A significant amount of within-person variance remained in the final model (0.327), which was reduced by only 4.4% relative to the UCGM (0.342). Significant between-person variation also existed in the intercept. Such variability in the final model (0.522) was reduced by 33.8% relative to the initial model (0.789) by the inclusion of level-2 covariates. Removal of the random slope parameter did not adversely affect model fit [χ2(1:2) = 3.06; P = .15], nor did removal of nonsignificant fixed effects [χ2(4) = 3.87; P = .42].
Secondary Analyses: Individual-Limb AP RMS Displacements
Analysis of the less-affected limb RMS COP displacement revealed no group differences: both groups exhibited an RMS COP displacement of 6.87 mm (P = .057) at 6 months poststroke. Furthermore, this value remained unchanged throughout the duration of the study because there were no linear or quadratic time changes (P = .623 and P = .597, respectively).
There were, however, between-group differences in the RMS displacement for the affected limb. Individuals in the No-LLS group exhibited an RMS displacement of 6.02 mm at 6 months poststroke. Individuals with LLS exhibited an RMS displacement that was 1.24 mm less than that in the No_LLS group (ie, 4.78 mm; P < .001). There was a small but statistically significant linear improvement in the RMS displacement of the COP beneath the affected limb of 0.11 mm per month (P < .001). Because there was no time-by-spasticity interaction effect, this linear increase was consistent for both groups.
Discussion
The present study examined the temporal evolution of standing balance control after stroke among individuals with LLS. All variables, with the exception of the measure of spatial symmetry, indicated an initial improvement followed by a deceleration in the rate of balance control recovery poststroke. All limb-specific measures indicated that individuals with LLS exhibited deficits in balance control. The recovery trajectories, however, were not different between groups, suggesting a similar rate, but reduced extent, of balance control recovery among individuals with LLS relative to stroke survivors without LLS. Only temporal synchrony was altered by changes in the MAS combined ankle score.
Consistent with previous research of motor recovery among stroke survivors,27-30 the initial model suggested group-average recovery trajectories for temporal synchrony and weight-bearing symmetry, and the BBS did show initial improvement, followed by plateau and subsequent decline (as a result of the quadratic time parameter in the model). In contrast to our hypotheses, but consistent with previous research, 15 the average recovery trajectory for interlimb spatial symmetry did not change over the duration of the study. This may have occurred as a result of a ceiling effect, in that individuals within the study appeared to have an atypically high extent of interlimb spatial symmetry in COP displacements (ie, higher than healthy controls 18 ).
Each of the limb-specific measures of balance control identified additional balance control challenges among the group with LLS, characterized by a similar rate but reduced extent of recovery. These results align with previous work 23 suggesting that between-group differences are a result of spasticity and associated pathologies, rather than a function of greater impairment alone. The additional sensorimotor impairment may explain the reduced extent of recovery among the group with LLS, without the emergence of a different recovery trajectory. It should be noted, however, that the groups formed within the present work were based on the presence or absence of LLS at any time during the study. This would suggest that an increase in the level of spasticity-related impairment at any time may affect the eventual extent of balance control recovery rather than solely being influenced by the initial level of severity of neurological deficit. 28
Whereas all limb-specific variables differentiated groups of stroke survivors with LLS from those without, only the measure of temporal synchrony in COP displacements was altered by time-varying, individual-level fluctuations in the extent of LLS. Given the velocity-dependent nature of spasticity, 20 which also includes a temporal parameter, it is possible that spasticity and associated pathologies affecting the ankle joint may impede the timing of gastrocnemius/soleus net force and moment generation, thereby disrupting the typical phase relationships between individual-limb COP displacements. This may occur independently of alterations in the “extent” of COP displacement or lower limb strength, which would be specifically revealed by alterations in the interlimb RMS ratio of COP displacements and weight-bearing symmetry, respectively. It is important to note that the group differences remained after inclusion of the MAS within the final model. This suggests that the differences between groups in the ability to temporally regulate force output may stem from additional variables that are not either not readily accounted for by the MAS and/or were not included within the present study. These results highlight the necessity to parse the contributions of the UMN syndrome that are not directly characterized by the MAS to determine the relative contribution of each of these features to the challenges in balance control faced by stroke survivors.
All 3 limb-specific indices included in the study discriminated between groups with and without LLS. Although the BBS did reveal the typical motor recovery trajectory among poststroke patients, it did not reveal differences between groups. This may have arisen as a result of the BBS representing a more global index of balance impairment, as opposed to the limb-specific metrics that may target specific challenges in force generation and modulation faced by stroke survivors with LLS. Future work will be necessary to determine if treatment-related reductions in the level of spasticity translate into improvements in the BBS and falls risk.
Study Limitations
Although the present results regarding the temporal synchronization of COP displacements suggest that they are potentially useful metrics to quantify balance control among stroke survivors with LLS, this work does have limitations. First, a problem inherent with the simple quadratic time parameter is its parabolic nature, which predicts that improvements will eventually begin to decline. In contrast, a more complex model may suggest that the linear increase would begin to decelerate and then reach a plateau. Second, likely as a result of the requirement for participants to have undergone at least 3 assessments, individuals within the study were high functioning, as related to previously reported values.18,23 The high-functioning status of the present sample may have contributed to fairly stable recovery trajectories, such that the inclusion of time-varying covariates did not substantially reduce the extent of within-subject variance. Finally, because data were retrospectively drawn from a larger database, not all potential covariates that could inform recovery were available. Other potentially important factors include the following: influence of upper-limb spasticity in modifying the total body center of mass 26 or in altering compensatory arm movements 37 that could alter standing balance control, quantitative biomechanical and electrophysiological measures of spasticity 38 in addition to the MAS, or information concerning any spasticity-specific rehabilitation received by participants. Nevertheless, alterations in spasticity (as quantified by the MAS) arising from rehabilitation would be captured by the inclusion of the extent of spasticity as a covariate within the statistical model for each outcome measure.
Conclusion
The present study is the first to examine the influence of LLS on the temporal evolution of balance control recovery poststroke. Whereas all limb-specific measures dissociated groups by the presence/absence of LLS, measures of between-limb temporal synchronization of COP displacements suggested that reductions in the extent of LLS may be beneficial in restoring the capacity for appropriately timed force production from the affected limb. The present results suggest that minimization of poststroke LLS may be beneficial for facilitating recovery of balance control.
Footnotes
Acknowledgements
The authors would like to thank Dr W. McIlroy, C. Danells, V. Closson, and E. Cohen for access to data through the Heart and Stroke Foundation Canadian Partnership for Stroke Recovery Rehabilitation Affiliates Longitudinal Database.
Declaration of Conflicting Interests
The authors declared no potential conflicts of interest with respect to the research, authorship, and/or publication of this article.
Funding
The authors disclosed receipt of the following financial support for the research, authorship, and/or publication of this article: JCS was supported by a postdoctoral fellowship through the Heart and Stroke Foundation of Canada. GM is supported by the Heart and Stroke Foundation Canadian Partnership for Stroke Recovery Kevin Duffy Stroke Rehabilitation Scientist Award.