
Abstract
Background. Rehabilitation after severe stroke is often limited because of impairments in sensorimotor function. Functional and physiological recovery after severe stroke is poorly understood and has not been studied extensively. Objective. This study’s purpose was to examine functional and physiological recovery of standing balance during inpatient rehabilitation in people with severe impairments after stroke. Methods. A total of 10 participants with severe impairments after stroke were evaluated monthly in a stroke rehabilitation unit with the following functional outcome measures: Berg Balance Scale (BBS), Clinical Outcome Variables Scale (COVS), and Chedoke McMaster Stroke Assessment (CMSA). Weight bearing (WB), center of pressure (COP) velocity, and electromyography (EMG) data were collected during quiet standing and during internal perturbation with a rapid nonparetic arm raise. Results. Cross-sectionally, there were moderate to strong correlations for EMG area and WB with CMSA and COVS. Additionally, the BBS was correlated with WB on the paretic side. Longitudinally, statistically significant improvement was found for functional measures but not for physiological measures. The mean BBS and COVS improved by 23 and 21 points, respectively. COP velocity decreased by 60.1% on the paretic leg but not significantly. Conclusions. During stroke rehabilitation, all participants improved functionally. Some patients improved physiologically, though near discharge, all participants remained very impaired. Future studies with larger sample sizes are needed to explore the capacity for physiological recovery in this population.
Introduction
Many people who have sustained a severe stroke do not receive organized stroke care despite best-practice recommendations. 1 Approximately 50% of patients after sustaining a stroke are not considered to be good candidates for inpatient rehabilitation either because their stroke is too mild or too severe 2 and are discharged either home or directly to long-term care, respectively. Severe stroke is difficult to define. Original research, systematic reviews, and admission criteria to in-patient rehabilitation have used different criteria to characterize the severe impairments after stroke. Commonly the Functional Independence Measure (FIM) has been used, but even with a standard measure of post-stroke impairment, one study used admission total FIM as <54, 3 whereas another used total FIM <46 4 ; yet others used motor FIM scores between 13 and 44 5 to define severe stroke.
Many inpatient rehabilitation hospitals have raised their admission FIM requirements, such that people with severe impairments have limited access to dedicated stroke care units and remain on general recovery units where therapy intensity remains low, 6 despite evidence that improvements on the motor FIM are possible months later.7,8
Very little is known about the capacity for physiological recovery in people with severe impairments after stroke. Many studies exclude people with severe stroke; for example, brain imaging research often excludes people who have sustained a severe stroke, though when severe stroke patients are imaged, physiological improvements can be demonstrated. 9 If researchers tend to avoid this patient population because it is challenging to study, it can lead to a lack of evidence-based practice and rehabilitation, making research with this patient population imperative. Prior to developing rehabilitation programs specifically for this patient population, it is important to explore how these patients recover, both physiologically and functionally. Little research has been performed on standing balance after severe stroke despite the fact that the rehabilitation of patients after severe stroke has been identified as a priority area of research. 10
Recovery of standing balance is important for ambulation, which is a commonly cited goal post-stroke. Falls are significantly more common post-stroke than in healthy community-dwelling people and are related to reduced physical abilities, 11 such that the incidence of falls is higher for those who have severe walking impairments. 12 Falls often occur while walking as a result of perturbations to standing balance,13,14 so it stands to reason that the ability to withstand internal and external perturbations would be linked to reduced falls risk. Response to perturbations has been used as a laboratory measure of the motor control of standing balance to explore the mechanisms underlying functional recovery. Improvement in responses to internal perturbations in standing involving a unilateral arm raise is suggested to be a result of compensatory stabilization from the nonparetic leg, patient-limited speed and amplitude of internal perturbations, and increased self-confidence, with evidence of recovery noted to include changes in anticipatory paretic hamstring activity prior to movement. 15
The purpose of this descriptive case series was to examine the functional and physiological recovery of standing balance during inpatient rehabilitation in people with severe impairments after stroke.
Methods
Participants
Participants admitted to Parkwood Hospital Stroke Rehabilitation Unit (St Joseph’s Health Care) in London, Ontario, between October 2008 and February 2009, met the inclusion criteria for this study if they had a hemorrhagic or ischemic stroke and were able to stand for 20 s independently. In addition, an admission motor FIM score between 13 and 37 or severe standing balance impairment as identified by the admitting physician was used to ensure that participants with severe impairments affecting motor function were included. If participants were unable to stand for 20 s independently at admission but met other inclusion criteria, first testing was delayed until the minimum standing criterion was met. Participants were permitted to have a physical therapist help them attain standing but had to be able to remain standing independently to meet the inclusion criteria.
Participants were excluded if they had sustained a bilateral stroke, had severe comorbidity or any condition that would interfere with testing, had coexisting peripheral neuropathies, had acute musculoskeletal injury, and/or were not able to communicate in English. Participants were tested at approximately 1-month intervals. The University of Western Ontario’s ethics review board approved the study.
Experimental Procedures
Functional Measures of Balance and Mobility
The treating physical therapist administered functional outcome measures at regular intervals during inpatient rehabilitation. The Berg Balance Scale (BBS), the Clinical Outcome Variables Scale (COVS), and the Chedoke-McMaster Stroke Assessment Inventory (CMSA) were used.
The BBS is commonly used to measure change in functional balance during inpatient physical therapy. It has 14 tasks on a 5-point scale, with a total score of 56. A higher score indicates improvement in balance. It has been demonstrated to be a valid and reliable tool for evaluating functional balance poststroke (intraclass correlation coefficient [ICC] = 0.99) 16,17 A minimal detectable change of 6 points is needed for 90% confidence of change in functional balance. 18 The COVS is a functional mobility scale with 13 items and a total score of 91. A higher score indicates improved mobility. The reliability of this scale is ICC = 0.97. 19 The clinically important change is seen with ≥5 points. 20 The leg, foot, and postural control components of the CMSA were assessed. The CMSA provides a functional measure of stage of recovery and impairment level, with a score of 0 equivalent to no palpable movement and a score of 7 equivalent to normal movement. It also has high intrarater and interrater reliability. 21
Physiological Measures of Balance
Based on well-established protocols from our laboratory,22-24 we performed the following experimental procedures. Participants stood on 2 adjacent AccuGait force platforms (AMTI, Watertown, MA) in a standardized stance with feet approximately 18 cm apart. Participants were asked to stand in a comfortable position, and the outlines of the feet were traced on paper and taped to the force platform to ensure that participants assumed the same position on the force platform on subsequent testing occasions. Force and moment signals from the force platforms were collected with NetForce and analyzed with BioAnalysis software (AMTI).
Muscle activity was recorded using surface electromyography (EMG) of the bilateral hamstrings, quadriceps, tibialis anterior, and soleus muscles. The EMG activity was recorded using differential sensors (DE-2.3), 1.0 × 0.1 cm2 strips with 1 cm interelectrode distance, equipped with a preamplifier (gain = 1000 V/V; bandwidth = 20-450 Hz; Delsys Inc, Boston, MA). A ground electrode was positioned over the lateral malleolus. The EMG signals were recorded using Myomonitor IV Wireless Transmission & Datalogging System with EMGWorks software (Delsys Inc) at a 2000-Hz sampling rate.
First, postural control in quiet stance was measured with 5 trials of 10 s in duration. Participants were instructed to “look straight ahead and stand as still as you can.” Second, postural control during internal perturbations of upright standing posture was assessed as the participants produced quick shoulder flexion of the nonparetic arm to 90° and maintained the arm in a horizontal position for 2 to 3 s following the instruction, “When you are ready, swing your arm as fast as possible to shoulder height and hold it there.” In the web space of the first and second digits of the moving arm, a linear uniaxial accelerometer was taped and used to detect the onset of arm movement during internal postural perturbations. A total of 10 trials were performed, with rest breaks as needed to prevent fatigue. All participants wore a safety harness, which did not provide body weight support when they were standing. Also, physical therapists were in close proximity to the participants for safety. Between measurements, the harness and/or the physical therapist supported the participants if required. No adverse events were reported during or after data collection.
Data Analysis
EMG data were analyzed offline using Spike2 software (CED, Cambridge, UK). Signals were rectified and averaged after being aligned to the onset of acceleration (arm raise task) or the beginning of the trial (quiet stance task). For the arm raise task, the EMG was averaged for 2 s starting 0.7 s prior to the onset of movement. Area of the baseline EMG activity was measured for 200 ms starting at 650 ms prior to the arm raise. EMG activity associated with postural adjustment to internal perturbation (arm raise task) was measured for 200 ms immediately before (Area 200 Pre) and for 200 ms after (Area 200 Post) the onset of the arm raise acceleration (Figure 1A). In healthy participants, the unilateral arm raise produces a burst of muscle activity in the ipsilateral hamstring muscle prior to initiation of movement in a feed-forward manner (Area 200 Pre) and a second burst of contralateral hamstring muscle activity (Area 200 Post) just after the onset of movement 24 (Figure 1A). Therefore, Area 200 Pre was the chosen measure for the nonparetic hamstrings and Area 200 Post for the paretic hamstrings. 24 The baseline area was subtracted from Area 200 Pre and Area 200 Post, and the resultant EMG values were normalized by dividing by the baseline area. Peak-to-peak arm acceleration was measured during the arm raise perturbation.
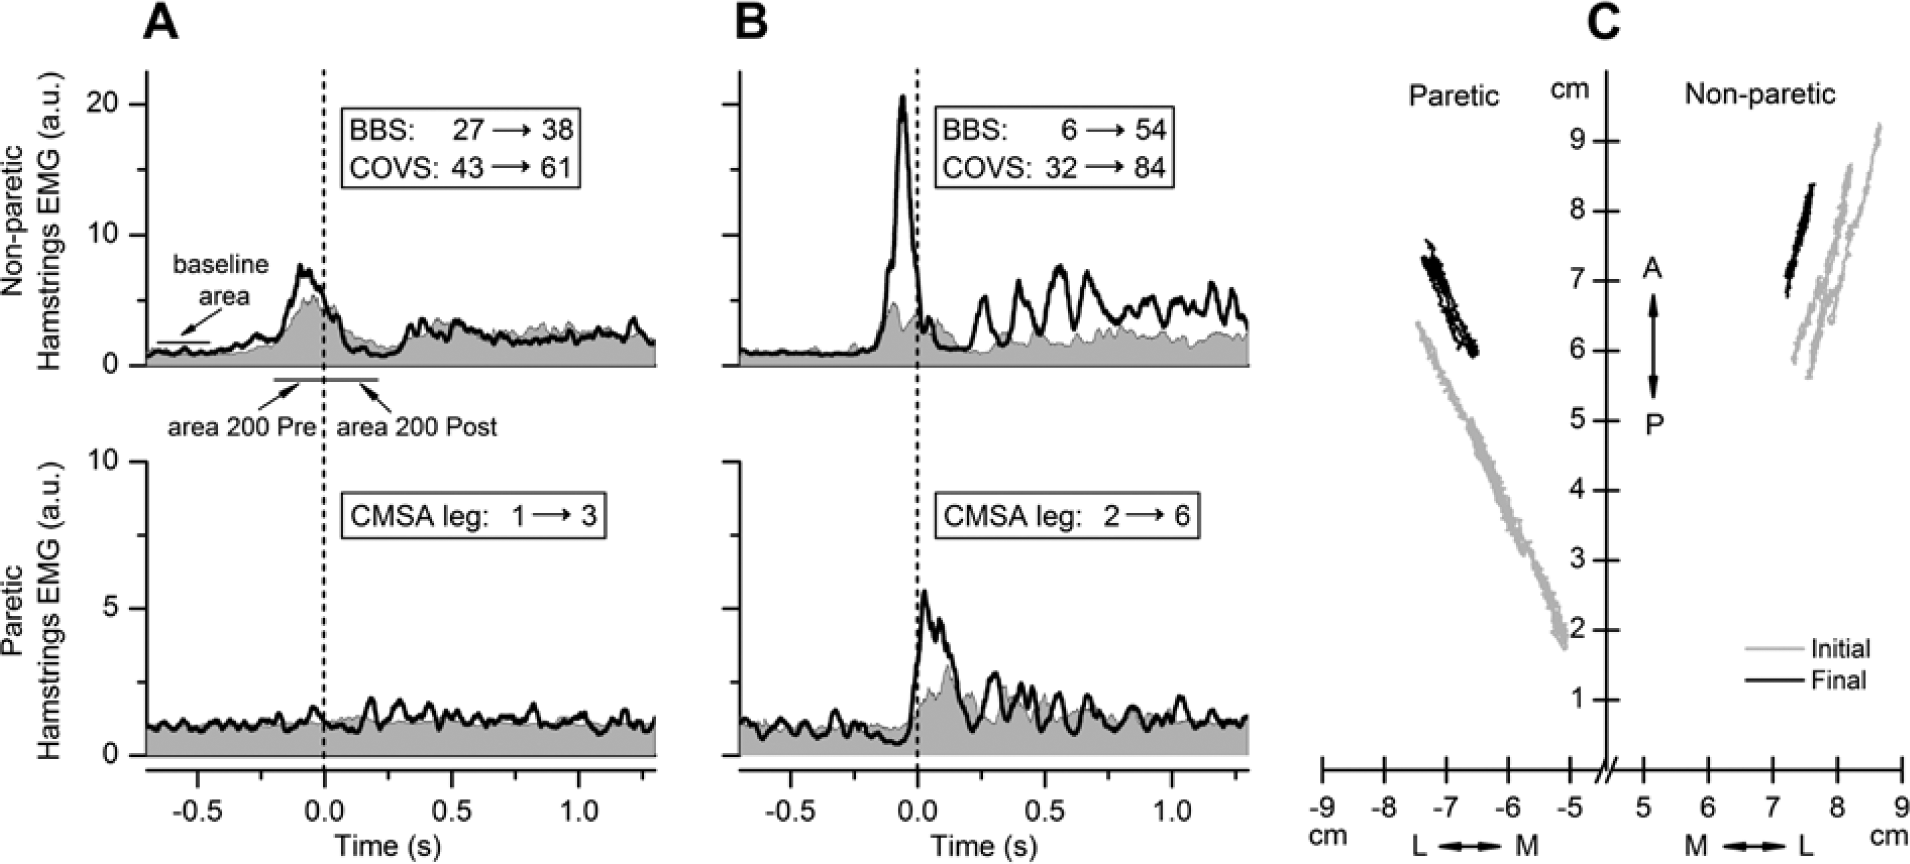
EMG tracings (A and B) from first (shaded gray area) and last (thick black line) testing of 2 representative participants showing the activation of hamstring muscles from the nonparetic (upper row) and paretic (lower row) sides during the arm raise postural task. Vertical hatched lines indicate onset of arm movement. Baseline area, Area 200 Pre, and Area 200 Post are shown by horizontal lines in A. In each column, inserts show the first and last BBS, COVS, and CMSA leg scores. Admission motor FIMs were 27 and 31 for participants represented in A and B, respectively. Note the larger increase in functional measure and the defined burst of the paretic hamstring for the patient in B despite similar first motor FIM scores. Participants had comparable arm raise accelerations at both first (21.5 and 23.5 m/s2 for A and B, respectively) and last test (28.3 and 33.1 m/s2 for A and B, respectively). C: Center of pressure (COP) excursions during a quiet standing trial for the individual depicted in B are presented for the first (gray line) and last (black line) testing. Paretic side is the left; anterior-posterior (A/P) and medial-lateral (M/L) orientation of the platform are shown by double arrows. There is a noticeable decrease in COP excursions at the last test.
Center of pressure (COP) measurements were performed using BioAnalysis software. For quiet stance, the average COP velocity of the paretic and nonparetic limbs was examined separately and was used as the measure of postural sway; the mean of the 5 trials was calculated. In addition, the vertical ground reaction force measured the amount of weight bearing (WB) on each leg and was represented as a percentage of the total body weight (WB%) for each participant.
SPSS (version 20.0; SPSS Inc, Chicago, IL) was used to analyze the data. Descriptive statistics of the patient characteristics were calculated. To determine if there were changes in the functional and physiological outcomes between the first and last testing days, paired t tests were calculated with significance set at P < .05. Three participants remained on the unit long enough for a third data collection day; for these 3 participants, the third testing day data were used as the last day’s data in the analysis. Spearman correlation analysis was performed to assess the association between variables using the mean of the first and last testing sessions for functional and physiological test data. All statistics with the CMSA used the sum of the 3 scores (postural control, leg, and foot) for a possible maximum of 21. 23 Values are reported as mean ± standard deviation, unless noted.
Results
Functional Participant Characteristics
Participant characteristics are summarized in Table 1. The average age of the participants at the time of the stroke was 58 ± 15.1 years. There were 5 women and 5 men in the study, with 6 of the participants having right-sided strokes. The mean length of stay in the rehabilitation hospital was 73 ± 20.7 days. Total admission FIM scores were 53 ± 13.1, with a motor FIM of 27.8 ± 8.59, which is similar to the median reported in another study with motor FIM scores of 26.5. 5 Thus, our sample was consistent with those in other studies investigating people with severe impairments after stroke. The study participants were admitted to the rehabilitation hospital an average of 30.5 ± 27.5 days after their stroke. The first testing day was 26.3 ± 11.8 days after admission because some participants required some therapy prior to meeting the baseline inclusion criteria for this study. The second testing day was on average 48.4 ± 15.6 days after admission, with 3 of the participants staying long enough to allow a third testing day, at a mean of 71.0 ± 33.8 days after admission.
Patient Characteristics.
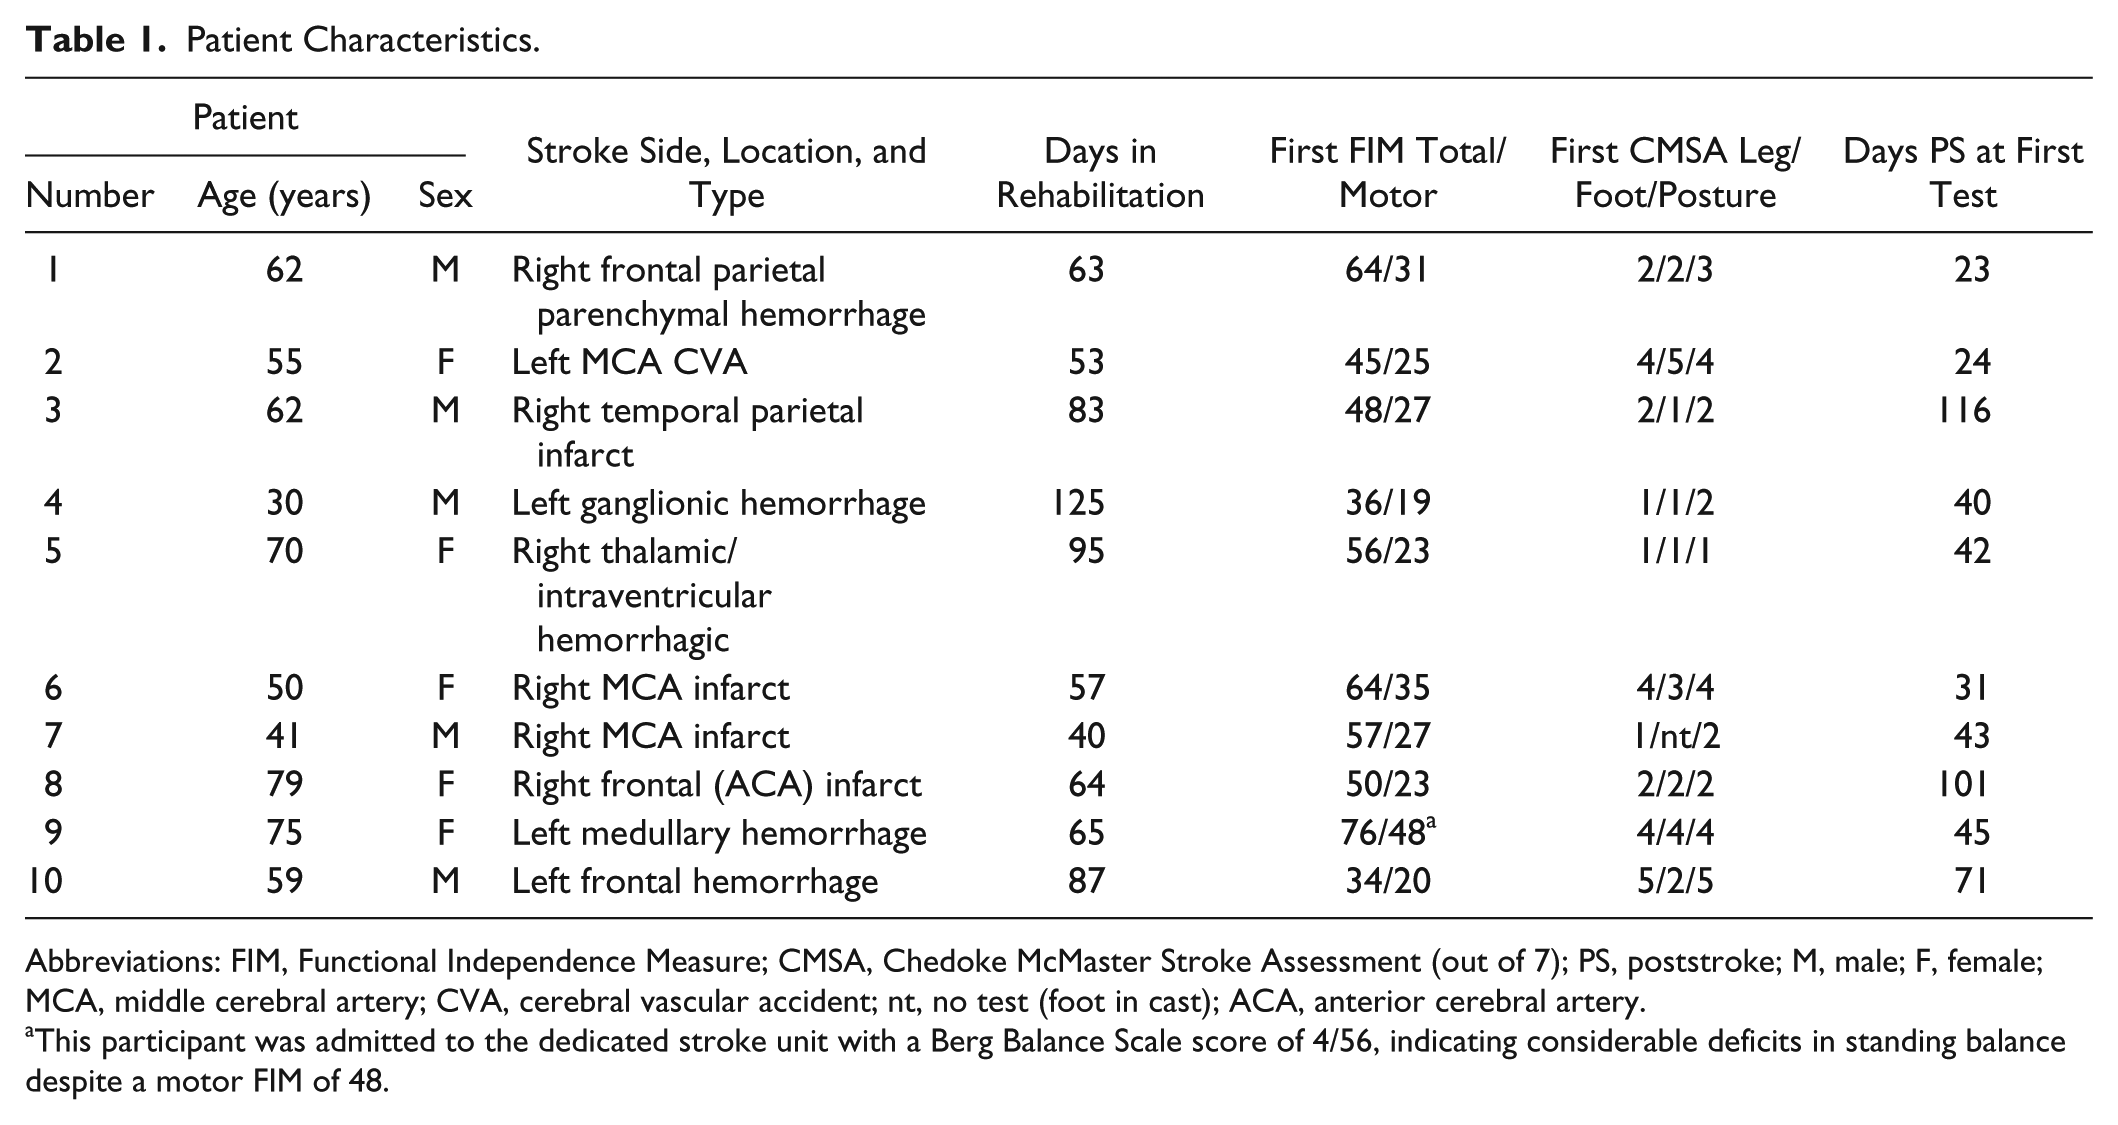
Abbreviations: FIM, Functional Independence Measure; CMSA, Chedoke McMaster Stroke Assessment (out of 7); PS, poststroke; M, male; F, female; MCA, middle cerebral artery; CVA, cerebral vascular accident; nt, no test (foot in cast); ACA, anterior cerebral artery.
This participant was admitted to the dedicated stroke unit with a Berg Balance Scale score of 4/56, indicating considerable deficits in standing balance despite a motor FIM of 48.
Functional Outcomes
Participants showed statistically significant improvements in all functional measures during inpatient rehabilitation. Table 2 presents averaged measures across all 10 participants from the first and last testing days. The mean BBS improved by 23.1 points, and the mean COVS improved by 20.9 points. The mean of the combined CMSA scores increased by 50% from 8/21 to 12/21. There was a strong relationship between scores on the BBS and the COVS, with a significant correlation of ρ = 0.85, as well as between scores on the CMSA and the BBS (ρ = 0.65) and the COVS (ρ = 0.87).
Functional and Physiological Measures. a
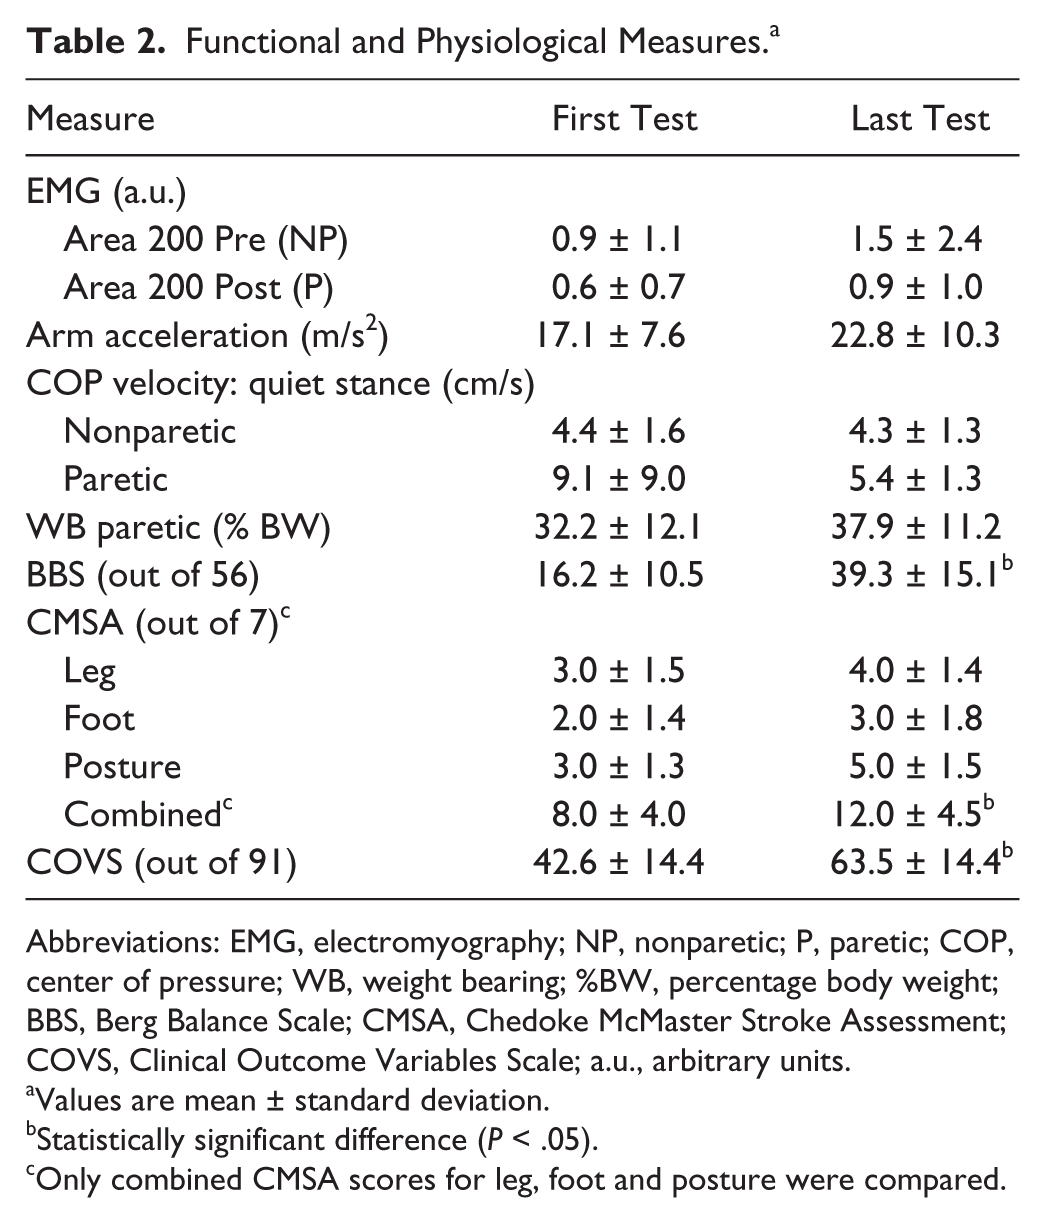
Abbreviations: EMG, electromyography; NP, nonparetic; P, paretic; COP, center of pressure; WB, weight bearing; %BW, percentage body weight; BBS, Berg Balance Scale; CMSA, Chedoke McMaster Stroke Assessment; COVS, Clinical Outcome Variables Scale; a.u., arbitrary units.
Values are mean ± standard deviation.
Statistically significant difference (P < .05).
Only combined CMSA scores for leg, foot and posture were compared.
Physiological Measures
Average physiological measures across all 10 participants for the first and last testing days are summarized in Table 2. As a group, no significant changes were seen in any physiological parameter over the course of rehabilitation (Table 2). However, on examination of individual data, it was clear that some participants exhibited no change over time in the paretic or nonparetic hamstring muscles (Figure 1A), whereas others had improvements in hamstring EMG activity during the arm raise task (Figure 1B). It was found that 7 participants had increased EMG Area 200 Post on the paretic side on the last testing (Figure 2A), and 3 of the 10 participants tested had reduced EMG area or no change on the paretic side. A moderately strong correlation was found on the paretic side with Area 200 Post (paretic hamstrings) and WB% (ρ = 0.76; P < .05). There was no relationship between Area 200 Pre (nonparetic hamstrings) and other physiological measures.
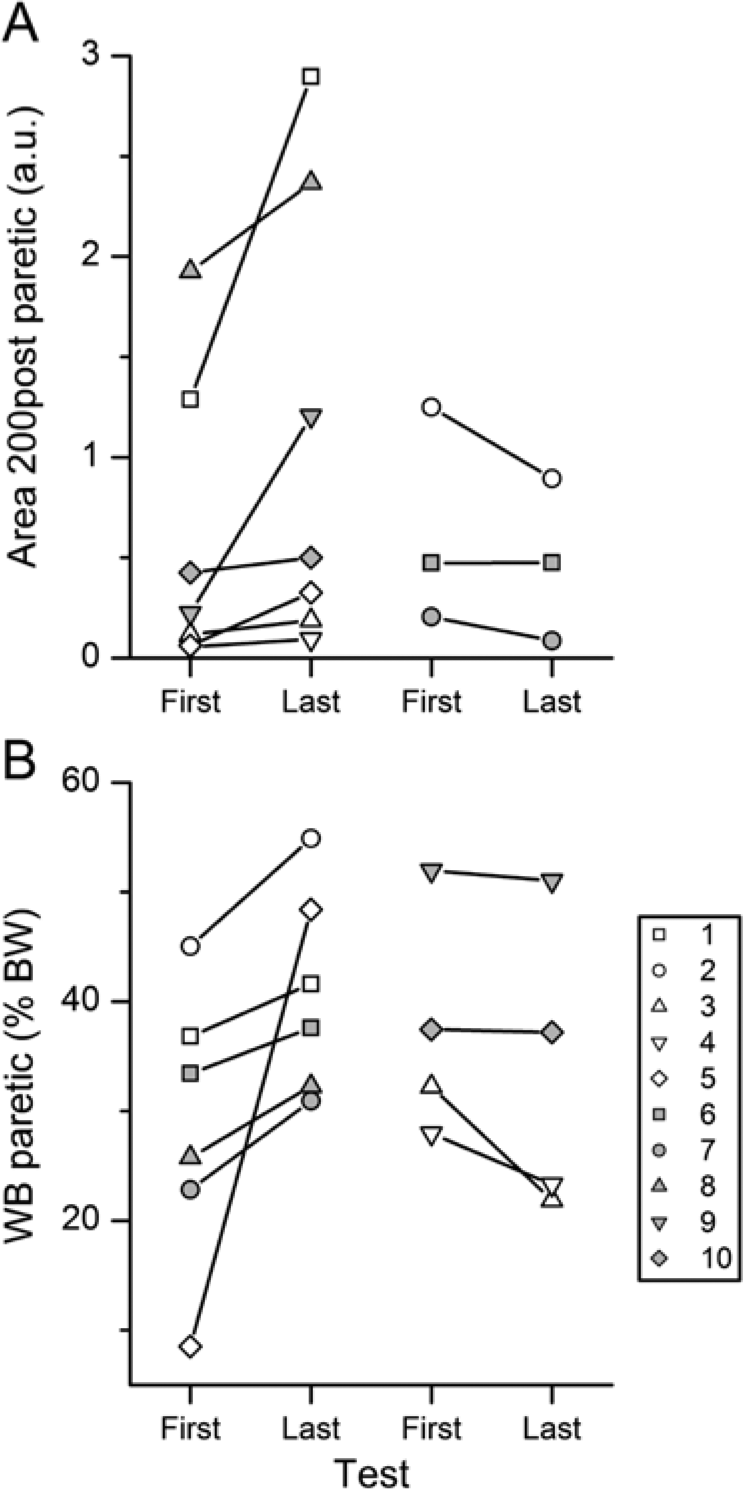
Paretic weight bearing (WB) and hamstrings EMG on first and last testing days. EMG Area 200 Post (A) and WB on paretic side (B) as percentage of body weight (BW) for all participants are presented. The first and last testing day measurements for each participant are connected by a straight line. Participants who demonstrated an increase in the Area 200 Post or WB% on the paretic side on the last testing day are shown on the left, and participants who demonstrated no change or a decrease of these parameters are shown on the right of the corresponding panel.
As depicted in Figure 2B, 6 participants increased WB on the paretic limb at the last testing, with 1 participant who was WB only 8.5% on the paretic limb initially demonstrating 3 times the first WB% at last testing. For the remaining 4 participants, there was a slight reduction in WB on the paretic limb (Figure 2B). There was a significant relationship between WB% and COP velocity on the paretic limb (ρ = −0.72; P < .05).
The COP excursion for 1 participant is depicted in Figure 1C, showing a progression from a large excursion on the paretic side in anterior/posterior and medial/lateral directions to a smaller excursion on the last testing day. Figure 3 depicts the COP velocity measures for all participants on the paretic and nonparetic sides for the first and last testing days. In all, 8 participants decreased their COP velocity on the paretic side, and 2 increased the COP velocity (Figure 3A). The COP velocity changes on the nonparetic limb were modest, decreasing in 6 participants and increasing in the other 4 (Figure 3B).
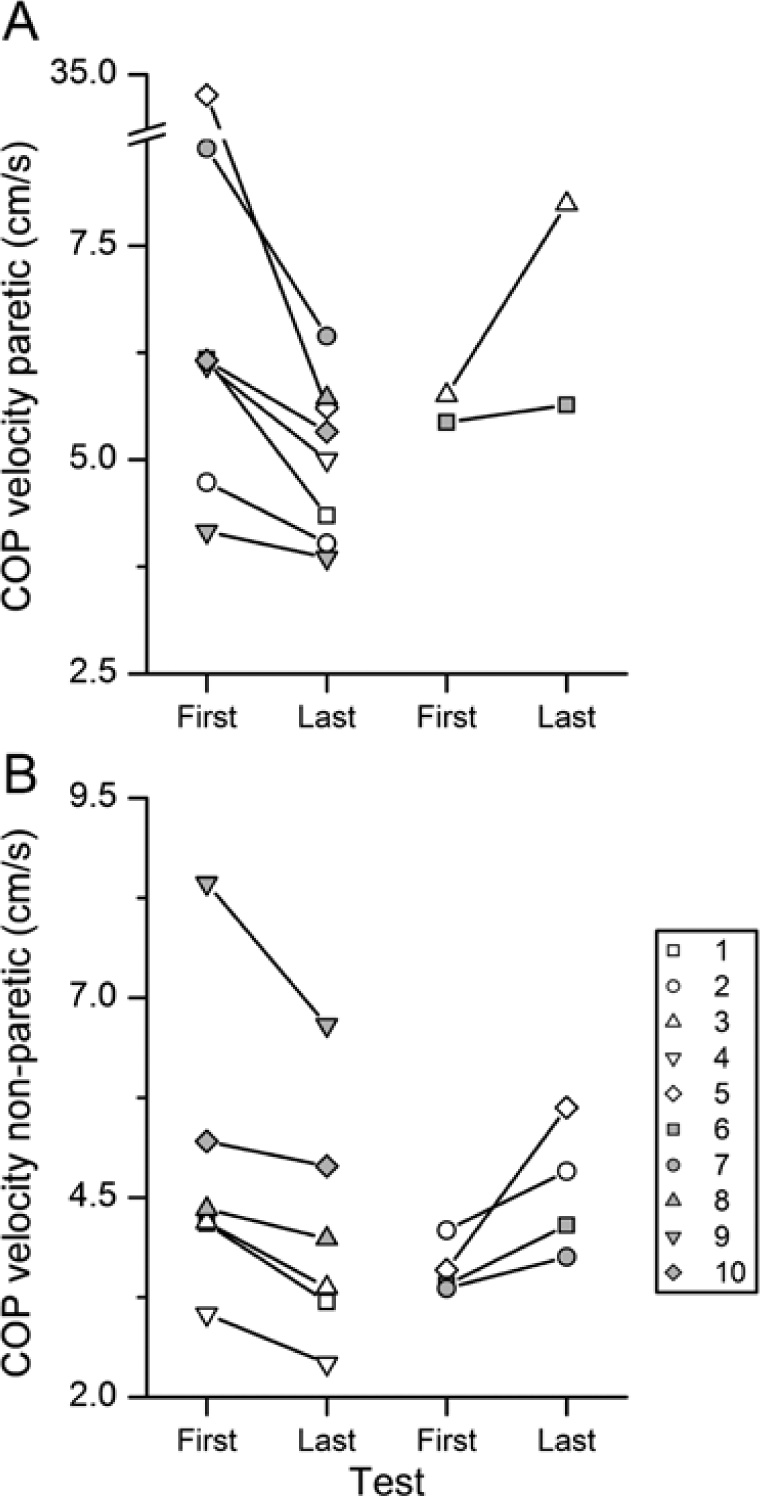
Center of pressure (COP) velocity on first and last testing days: COP velocities on the paretic (A) and nonparetic (B) sides for all participants are presented. The first and last testing day measurements for each participant are connected by a straight line. Participants who demonstrated a decrease in the COP velocity on the last testing day are shown on the left, and those who did not change or increase their COP velocity are shown on the right of each panel.
Relationship Between Functional and Physiological Outcomes
Cross-sectionally, when the first and last testing scores were averaged for each participant, higher functional scores were associated with better physiological scores. That is, significant correlations (P < .05) were found for the CMSA and COVS with Area 200 Post and WB% on the paretic side; additionally, the BBS was also moderately correlated with paretic WB% (Table 3). There was no correlation between the first total FIM or motor FIM and the functional or physiological scores.
Spearman’s Correlations of Physiological and Functional Measures.
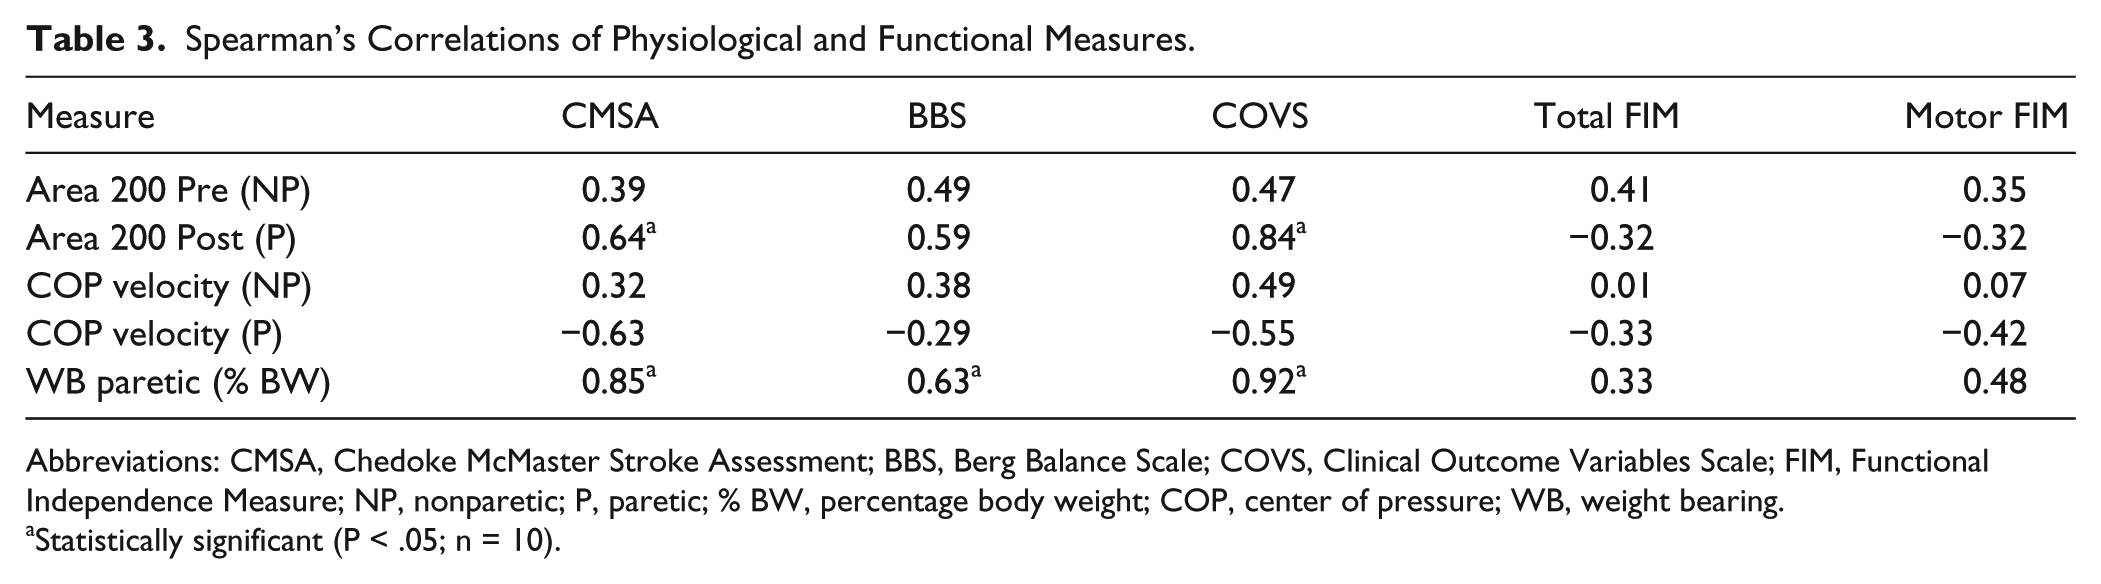
Abbreviations: CMSA, Chedoke McMaster Stroke Assessment; BBS, Berg Balance Scale; COVS, Clinical Outcome Variables Scale; FIM, Functional Independence Measure; NP, nonparetic; P, paretic; % BW, percentage body weight; COP, center of pressure; WB, weight bearing.
Statistically significant (P < .05; n = 10).
Discussion
The main finding of this study is that functional recovery after inpatient rehabilitation was found in all participants, and physiological recovery was observed in many of the participants with severe impairments after stroke. Functional improvements were not only statistically significant, but the changes on the BBS (on average 23 points) and the COVS (on average 21 points) were significantly greater than the minimal detectible change of 6 points for the BBS 18 and clinically important change score of 5 points for the COVS, 20 respectively. Although, as a group, the physiological measures did not reach statistical significance for change over time, there were significant relationships between physiological and functional measures, a finding that is consistent with other studies in patients with less severe impairments.25,26
Physiological Performance of Standing Balance
The motor recovery of standing balance in our sample was characterized by large variability and low muscle activity. Area 200 Pre/Post, COP velocity, and WB% had very high standard deviations on all test days (Table 2); at times, the variability for the EMG measures was greater than the group mean, indicative of the inconsistency in motor performance across the participants.
Increases in Area 200 Pre/Post would indicate a larger amount of muscle activity in the hamstrings during internal perturbation, signifying improved feed-forward activation (Figure 1B). However, for some participants (Figure 1A), muscle activity in the hamstrings did not increase, so that a burst of muscle activity could be seen. The severity of the stroke may produce difficulty in recruiting motor units, leading to poor muscle activity and low EMG values. In this sample of 10 participants, we were unable to identify any participant characteristics that could discriminate between those that improved physiologically and those that did not.
When comparing the participants in this study with participants in a previous study done in our laboratory with 9 young healthy participants, 24 our participants with severe impairments after stroke achieved only 12.0% of the muscle activation of the healthy group in the Area 200 Pre and 8.5% of the Area 200 Post. This indicates a large deficit in the amount of muscle activity for these stroke patients even at the end of inpatient rehabilitation. In a recent study of people with mild to moderately severe impairments post-stroke (mean BBS = 52.1/56) after discharge from inpatient rehabilitation, participants on average bore 45.4% body weight on the paretic leg. 23 In our participants, the mean BBS on the last testing day was 39.3/56, and on average, the amount of WB on the paretic limb was 37.9%, with most not reaching symmetry. The physiological complexities of standing balance go beyond standing symmetry. It has been suggested that without improved motor control in the paretic limb, improved symmetry of standing in and of itself may not benefit standing balance. 27
At the first testing, the paretic limb COP velocity for each participant was larger than that on the nonparetic limb, a finding that differs from recent reports in which the COP velocity was lower on the paretic leg.27,28 Possible explanations for this difference is that our participants were in the subacute phase of recovery, because the COP excursion/velocity at the end of inpatient rehabilitation, at a comparable point in time with the study by Genthon et al, 29 is similar. It is possible that the COP excursion on the paretic limb in a more acute stroke population is higher than in the nonparetic population because of altered WB after a stroke. If WB is decreased, there is less of an ability to use a stabilizing strategy with the paretic limb.
Beyond the sample itself, instructions and positioning of participants were different across studies.27,28 In our study, participants stood in their normal comfortable position versus a standardized foot placement and instruction to maintain symmetrical stance. Adopting a natural foot placement may have influenced the measurement of the participant’s WB and altered the COP excursion but may reflect the participant’s performance during daily activities.
Functional Performance of Standing Balance
As stated above, the mean BBS score of our sample at last testing was 39.3 ± 15.1. This remains below the often-cited 45/56 required for independent safe ambulation.30,31 Age-predicted means on the BBS for 60- to 69-year-olds is 51/56 for men and 54.6/56 for women, so our sample is well below those reported for people who have not sustained a stroke. 32 A recent study found that a BBS score ≤42/56 was the best predictor of falls. 12 Near discharge, study participants were still at a high fall risk, likely affecting discharge destination decisions, cost of care, and quality of life. Rehabilitation after stroke typically includes interventions for improving standing balance and functional mobility. This study extends findings from other studies33-35 to show that inpatient rehabilitation for people with severe impairments after stroke improves clinical measures of functional balance, though recovery is far from complete.
What is interesting is that some patients who have severe impairments after stroke are capable of both clinical and physiological improvement, albeit we are unable to determine whether the physiological improvement caused the functional improvement. Indeed, the fact that the clinical functional measures demonstrated more significant change than physiological measures suggests that some of the functional improvements may be a result of compensation or spontaneous recovery. It is possible that in this patient population, physiological change occurs more slowly than in patients with mild to moderate stroke25,36; that is, functional changes are seen before physiological ones. Another possibility is that the physiological measures used in this study are not adequate enough to detect the physiological recovery that took place. Also, our study did not evaluate the treatment the physical therapists were providing. It is possible that physical therapists design treatments based on their functional assessments, and that they are not directed toward physiological impairments.
Further research is required to understand the factors underlying the recovery of physiological standing balance and then determine the relevant physiological measures. Perhaps the rehabilitative needs of people with severe impairments after stroke are not met by an increased length of stay with emphasis on function but rather by physiologically based rehabilitation protocols yet to be designed and tested.
Limitations
Our study was limited by a small sample size, which may have affected the ability to show significant changes. Based on the results of this case series, it was determined that 50 to 80 participants with severe impairments after stroke would be needed to demonstrate statistically significant changes after usual inpatient rehabilitation on physiological measures. 37
The patients in our study had different types, location, and sides of stroke and were treated and assessed by different therapists, possibly leading to interrater reliability issues, though this reflects real-world practice and thus increases generalizability to other rehabilitation settings. The participants were limited to a single center’s stroke rehabilitation unit as well.
Conclusion
This study demonstrated that all patients with severe impairments after stroke improved in their functional outcomes, and some had the ability to improve their physiological balance. At the last testing, these patients continued to have impaired physiology, which may impair their activities of daily living, standing balance, and walking. Patients are often selected for inpatient rehabilitation based on admission FIM that may not reflect the full potential of an individual’s functional and physiological recovery. Future studies are needed to further investigate how these patients recover from hemiparesis physiologically to determine the most effective rehabilitation strategies.
Footnotes
Declaration of Conflicting Interests
The author(s) declared no potential conflicts of interest with respect to the research, authorship, and/or publication of this article.
Funding
The author(s) disclosed receipt of the following financial support for the research, authorship, and/or publication of this article: This study was funded in part by the Academic Development Fund at Western University, London, Ontario, Canada.