
Abstract
Background. Secondary-progressive multiple sclerosis (SPMS) patients have structural cortical damage resulting in increased compensatory cortical activity during (submaximal) performance. However, functional effects of changed cortical output are difficult to measure. The interpolated-twitch technique allows for measurement of voluntary activation (VA) necessary for force production. This study aimed to determine VA, force, and muscle fatigue during brief and sustained contractions in SPMS patients. Because fatigue effects are not confined to the motor system, we additionally examined fatiguing effects on cognitive performance. Methods. Twenty-five SPMS and 25 sex-, age-, and education-matched participants performed brief (5 seconds) and sustained (2 minutes) maximal index finger abductions. To evaluate VA, double-pulse twitches were evoked before, during, and after contractions. Additionally, data were compared with data obtained in relapsing–remitting multiple sclerosis (RRMS) patients. Subjects also performed choice-reaction time tasks before and after the sustained contraction. Results. During brief contractions, VA (85% vs 94%, P = .004) and force (25 N vs 32 N, P = .011) were lower for SPMS patients than controls. During sustained contractions, VA (P = .001) was also lower, resulting in greater force decline (73% vs 63%, P < .001) and reduced peripheral fatigue (19% vs 50%, P < .001). Comparisons with RRMS resulted in lower VA, greater force decline, and greater estimated central fatigue in SPMS. SPMS patients were slower (P < .001) and made more errors (P < .001) than controls, but neither group reduced their performance after the sustained contraction. Conclusion. SPMS patients had lower VA than RRMS patients and controls. The importance of voluntary activation for muscle force and fatigability warrants targeted rehabilitation strategies.
Keywords
Introduction
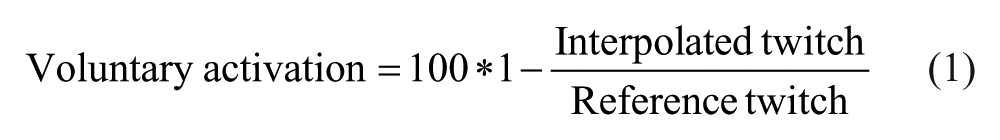
The clinical course of multiple sclerosis (MS) is characterized by relapses and disease progression. 1 Most patients start with the relapsing–remitting form of MS (RRMS) and progress to the secondary-progressive state (SPMS). The RRMS phase is characterized by phases of acute inflammation followed by recovery, whereas during the SPMS chronic neurodegeneration is more predominant. 2 SPMS patients have more structural damage to both white and gray matter,3-5 which eventually limits cortical plasticity.2,6 Functional changes due to axon demyelination and axonal ion dysfunction 7 probably already result in altered cortical activation during task performance, even before damage is visible on magnetic resonance imaging (MRI). Recent functional MRI (fMRI) studies indeed showed increased cortical activation in RRMS patients during the execution of a submaximal task compared to controls, and an even greater increase for SPMS patients.8,9 The increased activation conceivably conserves cortical output despite axonal demyelination and cortical damage. The net effects of changes in brain activation on cortical output are nonetheless difficult to quantify. 10 Using the twitch interpolation technique it is possible to estimate changes in cortical output necessary for force production (ie, the voluntary activation [VA]). 11 During maximal contractions, the nerve or muscle is electrically stimulated and the evoked twitch superimposed on the contraction provides an index of the VA (see Equation 1). Lower VA indicates a lower drive to the muscle and a decrease of VA over time reflects central fatigue.12,13
Sustained contractions evoke both changes in the peripheral neuromuscular system (peripheral fatigue 14 ) and in sites proximal to the peripheral nerve (central fatigue 13 ), resulting in a decline in muscle force (ie, muscle fatigue13,15). Although force decline is predominantly caused by peripheral factors, in MS patients the contribution of central factors are larger than in controls, as indicated by greater central fatigue.7,10,16-20 Causes for the reduced activation include demyelination, inflammation-related release of cytokines, axonal damage, and structural damage to cortical brain areas.2,7,21 It is expected that RRMS patients during remission are less prone to show signs of reduced VA than SPMS patients. However, studies that used twitch interpolation to determine VA did not differentiate between RRMS and SPMS patients,10,17 or only included RRMS 20 or SPMS patients. 19
Force and muscle fatigue are affected by age, 22 and since RRMS patients are generally younger than SPMS patients, it is difficult to directly compare these groups. Previously, we have investigated VA, force, and muscle fatigability in RRMS patients and in sex- and age-matched controls, 20 and the present study aims to investigate these parameters in SPMS patients and sex- and age-matched controls. We will then compare the results of both studies.
Our previous study in RRMS patients showed no difference in VA, maximal force, muscle fatigue, or peripheral fatigue compared to controls, but a greater central fatigue in RRMS patients. We hypothesize that, as a result of more structural damage and reduced cortical reserve capacity, 2 SPMS patients will have lower VA during brief maximal contractions (MVC) and at the start of a sustained MVC compared to both RRMS patients and controls. In addition, we hypothesize that SPMS patients will present more central fatigue compared to both controls and RRMS patients. The reduction in VA may result in both lower maximal force and more muscle fatigue.
Fatigue-related changes evoked by sustained contractions are not limited to cortical motor areas, but cognitive processing and cognitive areas are also affected.23-25 Controls showed increased activation in orbitofrontal areas during cognitive performance directly following a fatiguing motor task, without changes in cognitive performance. 23 SPMS patients already showed strong activation in multiple areas during both motor and cognitive task performance.9,26 We hypothesized that SPMS patients would not be able to intensify their cortical activation sufficiently to preserve prefatigue task performance and would subsequently reduce their cognitive performance after the fatiguing task. Hence, we assessed cognitive performance (choice reaction time task [CRT]) before and after a sustained contraction.
Methods
Participants
Forty-six SPMS patients that visited the Department of Neurology of the University Medical Center Groningen (UMCG) were approached for participation. Twenty-five SPMS patients 27 and 25 controls matched on a subject-to-subject basis for sex, age, and education were included. An experienced neurologist determined the EDSS. 28 Participants were right-handed, although 1 patient and 2 controls were ambidextrous according to the Edinburgh Handedness questionnaire (−9 to 100). 29 Subjects were excluded if diagnosed with neurological disorders other than MS, or if they had other disorders that might interfere with fatigue or force measurements (eg, cancer, cardiovascular disease). The study was approved by the Medical Ethical Committee of the UMCG. All participants signed an informed consent before participation, and the experiments were performed according to the Declaration of Helsinki.
Experimental Setup
With regard to force measurements, the setup largely followed Steens et al. 20 Force of the right index finger was recorded with a handheld force transducer (Figure 1). 30 The proximal interphalangeal joint of the index finger was taped to a wedge connected to a bar equipped with a strain gauge. The other fingers were taped to the transducer to prevent position changes. Force data were amplified and sampled at 200 Hz by a PC equipped with an acquisition interface (1401 Plus, CED, Cambridge, UK) and the accompanying software (Spike 2, version 7).
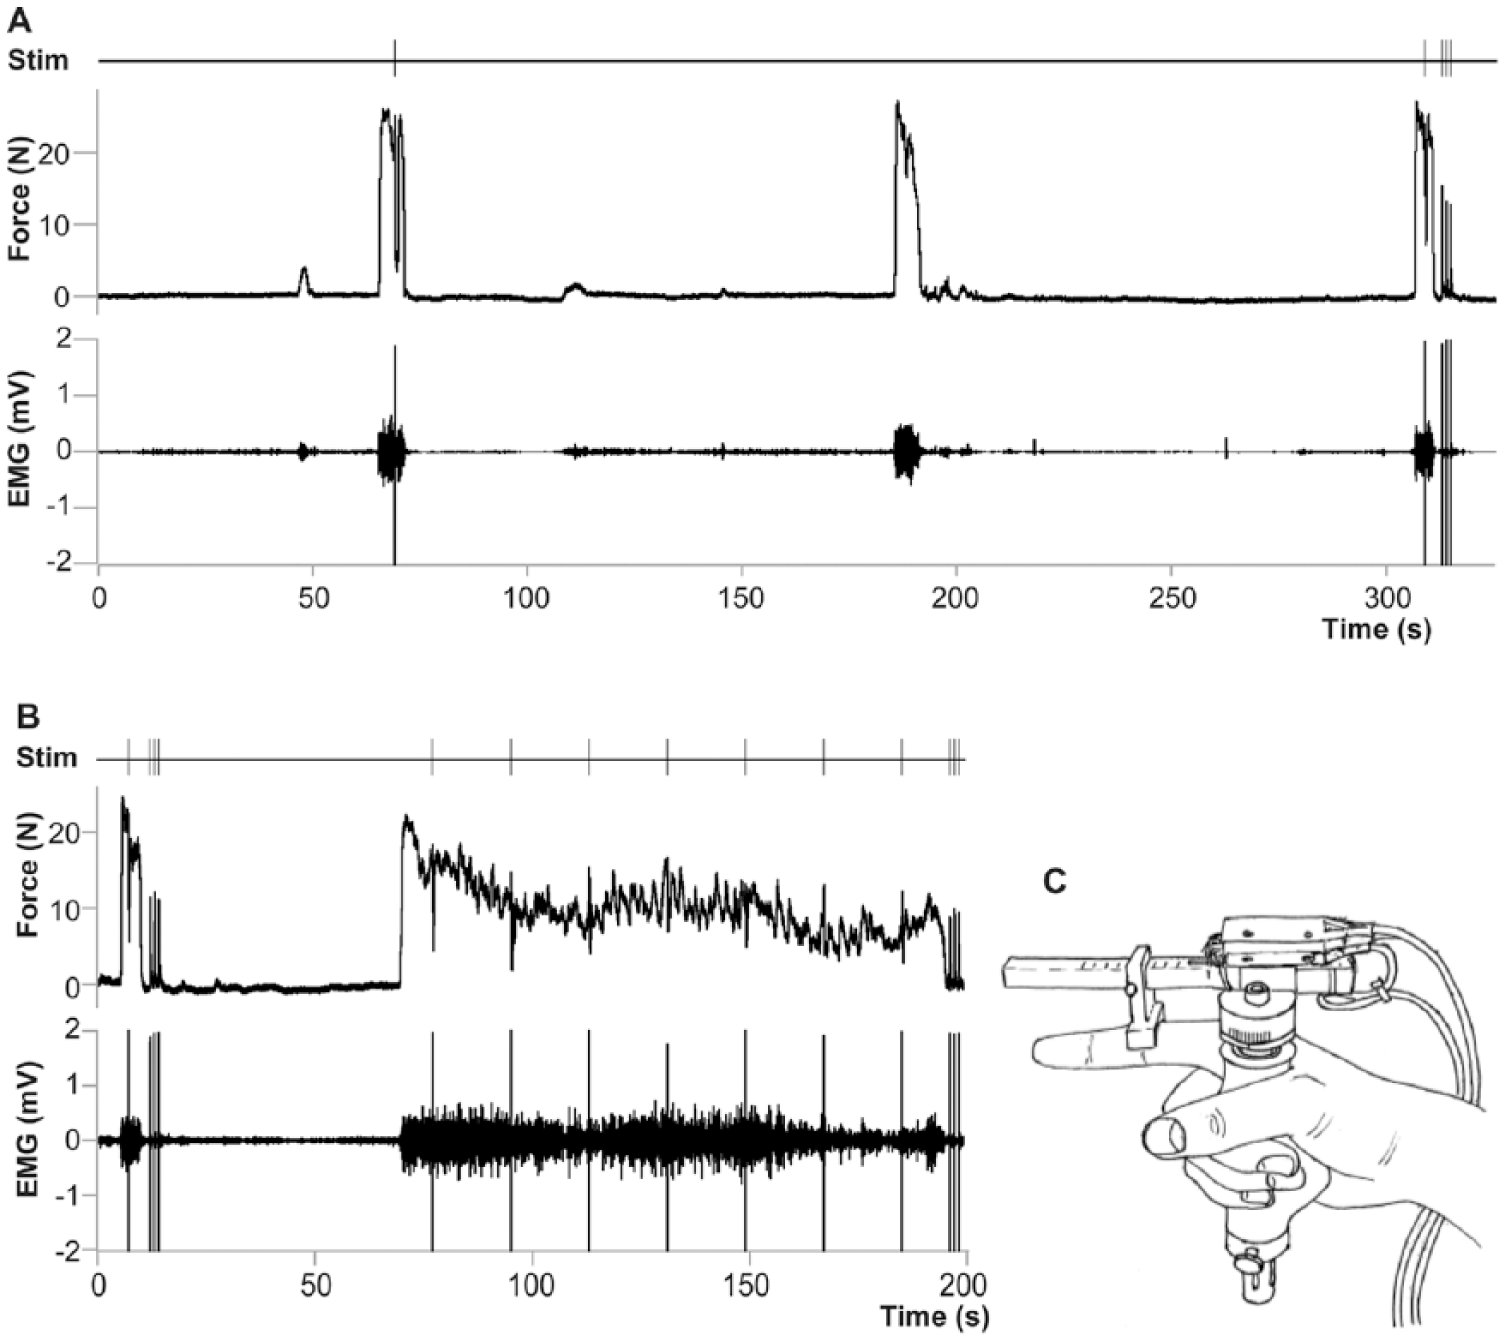
Force transducer and force data. (A) Maximal force and EMG of a single patient, with timing of paired-pulse stimulations. (B) Force decline and accompanying EMG during a 2-minute sustained maximal contraction with timing of paired-pulse stimulations. (C) Handheld force transducer. EMG, electromyogram.
Electromyographic activity (EMG) of the right first dorsal interosseus (FDI) muscle was recorded with sintered Ag/AgCl electrodes taped above the muscle and the first metacarpophalangeal joint. EMG signals were amplified (500×), bandpass filtered (<8 and >1 kHz), and collected (2 kHz) together with the force data.
Electrical Nerve Stimulation
The right ulnar nerve was stimulated by 2 electrodes placed over the nerve in close proximity to the proximal head of the ulna. Stimulation intensity was increased with increments of 5 mA, until a maximal EMG response (M-wave) was evoked. Paired-pulses (200 µs; interstimulus interval: 10 ms) were given at an intensity of 120% of the maximal M-wave (Digitimer DS7, Welwyn Garden City, UK). To obtain measures of VA superimposed twitches (paired-pulse stimulation) were evoked during maximal force (MVC). 12
Cognitive Measurements
The cognitive task 25 consisted of a CRT. A serial response box was placed in front of the participants. Loudspeakers in front of the participants delivered 2 tones at 70 dBA (50 ms), either at 500 Hz or 900 Hz. The interstimulus interval varied between 1100 and 1300 ms. The probability of occurrence was 70% for one of the tones and 30% for the other tone. Participants were instructed to respond quickly and accurately by pressing a button with either their left index or middle finger. Presentation of the tones and recording of the responses was done using E-Prime version 1.2 (Psychology Software Tools, Inc, Sharpsburg, PA). Between participants we randomized the stimulus that occurred more frequently and the expected response. Participants were informed that the first stimulus of every block was always the frequent stimulus.
Protocol
Participants filled out questionnaires regarding fatigue (Fatigue Severity Scale [FSS], Modified Fatigue Impact Scale [MFIS])31,32 and depression (Hospital Anxiety and Depression Scale [HADS]) 33 prior to the experiments.
Participants sat at a table, with a force transducer in their right hand, and their left hand on a serial response box. Participants received feedback of their force online on a computer screen. For a graphical overview of the protocol, see Figure 1.
Task I. Practice of the CRT. Responding to 150 stimuli.
Task II. Electrical nerve stimulation. Determination of maximal M-wave.
Task III. Practice of the CRT. Responding 3 times to 50 stimuli, with 5 seconds of rest in between.
Task IV. MVC. Assessment of MVC of the right FDI, 3 attempts (5 seconds) with 120 seconds of rest between attempts. During the first and third MVC, superimposed twitches were evoked. Immediately after the third MVC, 3 paired-pulse stimulations were given at rest. The largest evoked force response (potentiated twitch) was used as reference.
Task V. Prefatigue CRT. Six times 33 stimuli, with 6 seconds of rest in between. After the second, fourth, and sixth blocks, a short MVC was performed with the right FDI.
Task VI. Sustained contraction. Participants started with a brief MVC (4 seconds). Paired-pulse stimulations were given during (1) and after (3) the MVC. The largest twitch at rest was considered the prefatigue twitch. After 60 seconds participants started with a sustained maximal contraction (124 seconds) of the FDI during which 7 paired-pulse stimulations were given. Followed by 3 paired-pulse stimulations directly after the contraction; the largest twitch was considered the postfatigue twitch. Throughout the fatiguing task, participants received oral encouragement from the investigators and had visual feedback of their force production.
Task VII. Postfatigue CRT. Similar to Task V. Started within 1 minute after the end of task VI.
Outcome Measures
Descriptive information included scores on fatigue and depression questionnaires and EDSS scores.
Force outcome measures included MVC and VA. The maximal force obtained during task IV was taken as the reference MVC, except for 2 patients and 1 control, who had higher MVCs during task V. The maximal root mean square (RMS) EMG of the FDI was determined for a 500-ms window. VA was determined by the twitch interpolation technique and calculated as follows:
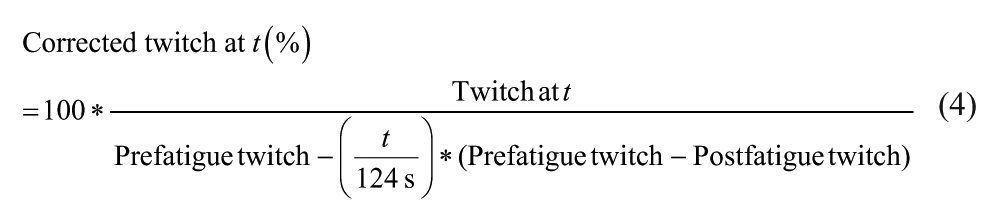
Fatigue outcome measures included muscle fatigue (Equation 2) and peripheral fatigue (Equation 3). We calculated VA during the fatiguing task; because peripheral fatigue also develops over time, we corrected the VA for peripheral fatigue using Equation 4. 34 Besides the superimposed twitch during the sustained contraction, we also estimated central fatigue by Equation 5.


Cognitive outcome measures consisted of the percentage of incorrect responses and reaction times. The first 2 responses of each block were discarded. Responses faster than 100 ms were counted as incorrect; only correct responses were used in the analyses. In order to minimize the influence of outliers, 20% trimmed means were used for calculating the means of the reaction times, that is, the 10% highest and 10% lowest scores per participant per task were disregarded.
Statistical Analyses
Patient characteristics, VA, estimated central fatigue, and peripheral fatigue between groups were compared with independent t tests. MVCs were compared using univariate ANOVA, with Group (MS or C) and Sex as between-subject factors. Changes in force and EMG over time were analyzed with repeated-measures ANOVA with Time (data averaged per 2 seconds) as a within-subjects factor and MS as between-subjects factor.
Mixed multilevel analyses were performed with SPSS to study VA during the sustained contraction. Group was included as a factor, with Time as covariate. The fit of the model was evaluated by comparing the −2 restricted log likelihood (−2LL). The model that allowed for a random variation of the intercept and slope resulted in the lowest −2LL.
Repeated-measures ANOVA with Time (pre- and postfatigue) as within-subjects effects and MS as between-subjects effects were used to study accuracy and reaction times of the CRT.
Associations were investigated using Pearson’s correlation coefficients, and for perceived fatigue, with a previously proposed model, 20 including HADS depression scores, MVC, and muscle fatigability.
We performed univariate ANOVAs with MS (SP or RR) as fixed factor, and for analyses to compare RRMS patients with SPMS patients, Group (MS or C) (sex was included as a factor for MVC, muscle fatigue, estimated central fatigue, and peripheral fatigue but not for VA). In general, SPMS patients have higher disability scores than RRMS patients. We therefore examined multicollinearity between phenotype and EDSS using regression analysis.
To investigate possible differences in changes in VA over time we used mixed models with (a) time and MS and (b) time, group, and MS as variables. For all analyses we were mainly interested in the effect of MS (RRMS vs SPMS) and the interaction effect of Group by MS, indicating differences between RRMS and SPMS patients, in relation to age- and sex-matched controls.
To check whether EDSS scores could explain possible differences between phenotypes, analyses were repeated with EDSS scores instead of phenotype.
Results
Two participants (1 patient) did not perform the force tasks as required and were excluded from the force analysis. Four participants (3 patients) produced less than 75% of their MVC at the time of the superimposed twitch during the brief contraction, and 1 patient had a very low VA (<50%) and deviated more than 3 SDs. Twitches of 1 control were greater during contractions than at rest and deviated more than 2 SDs. For these participants we excluded their twitch data from the statistical analyses. Patient characteristics (and number of observations) are presented in Table 1.
Patient Characteristics a .
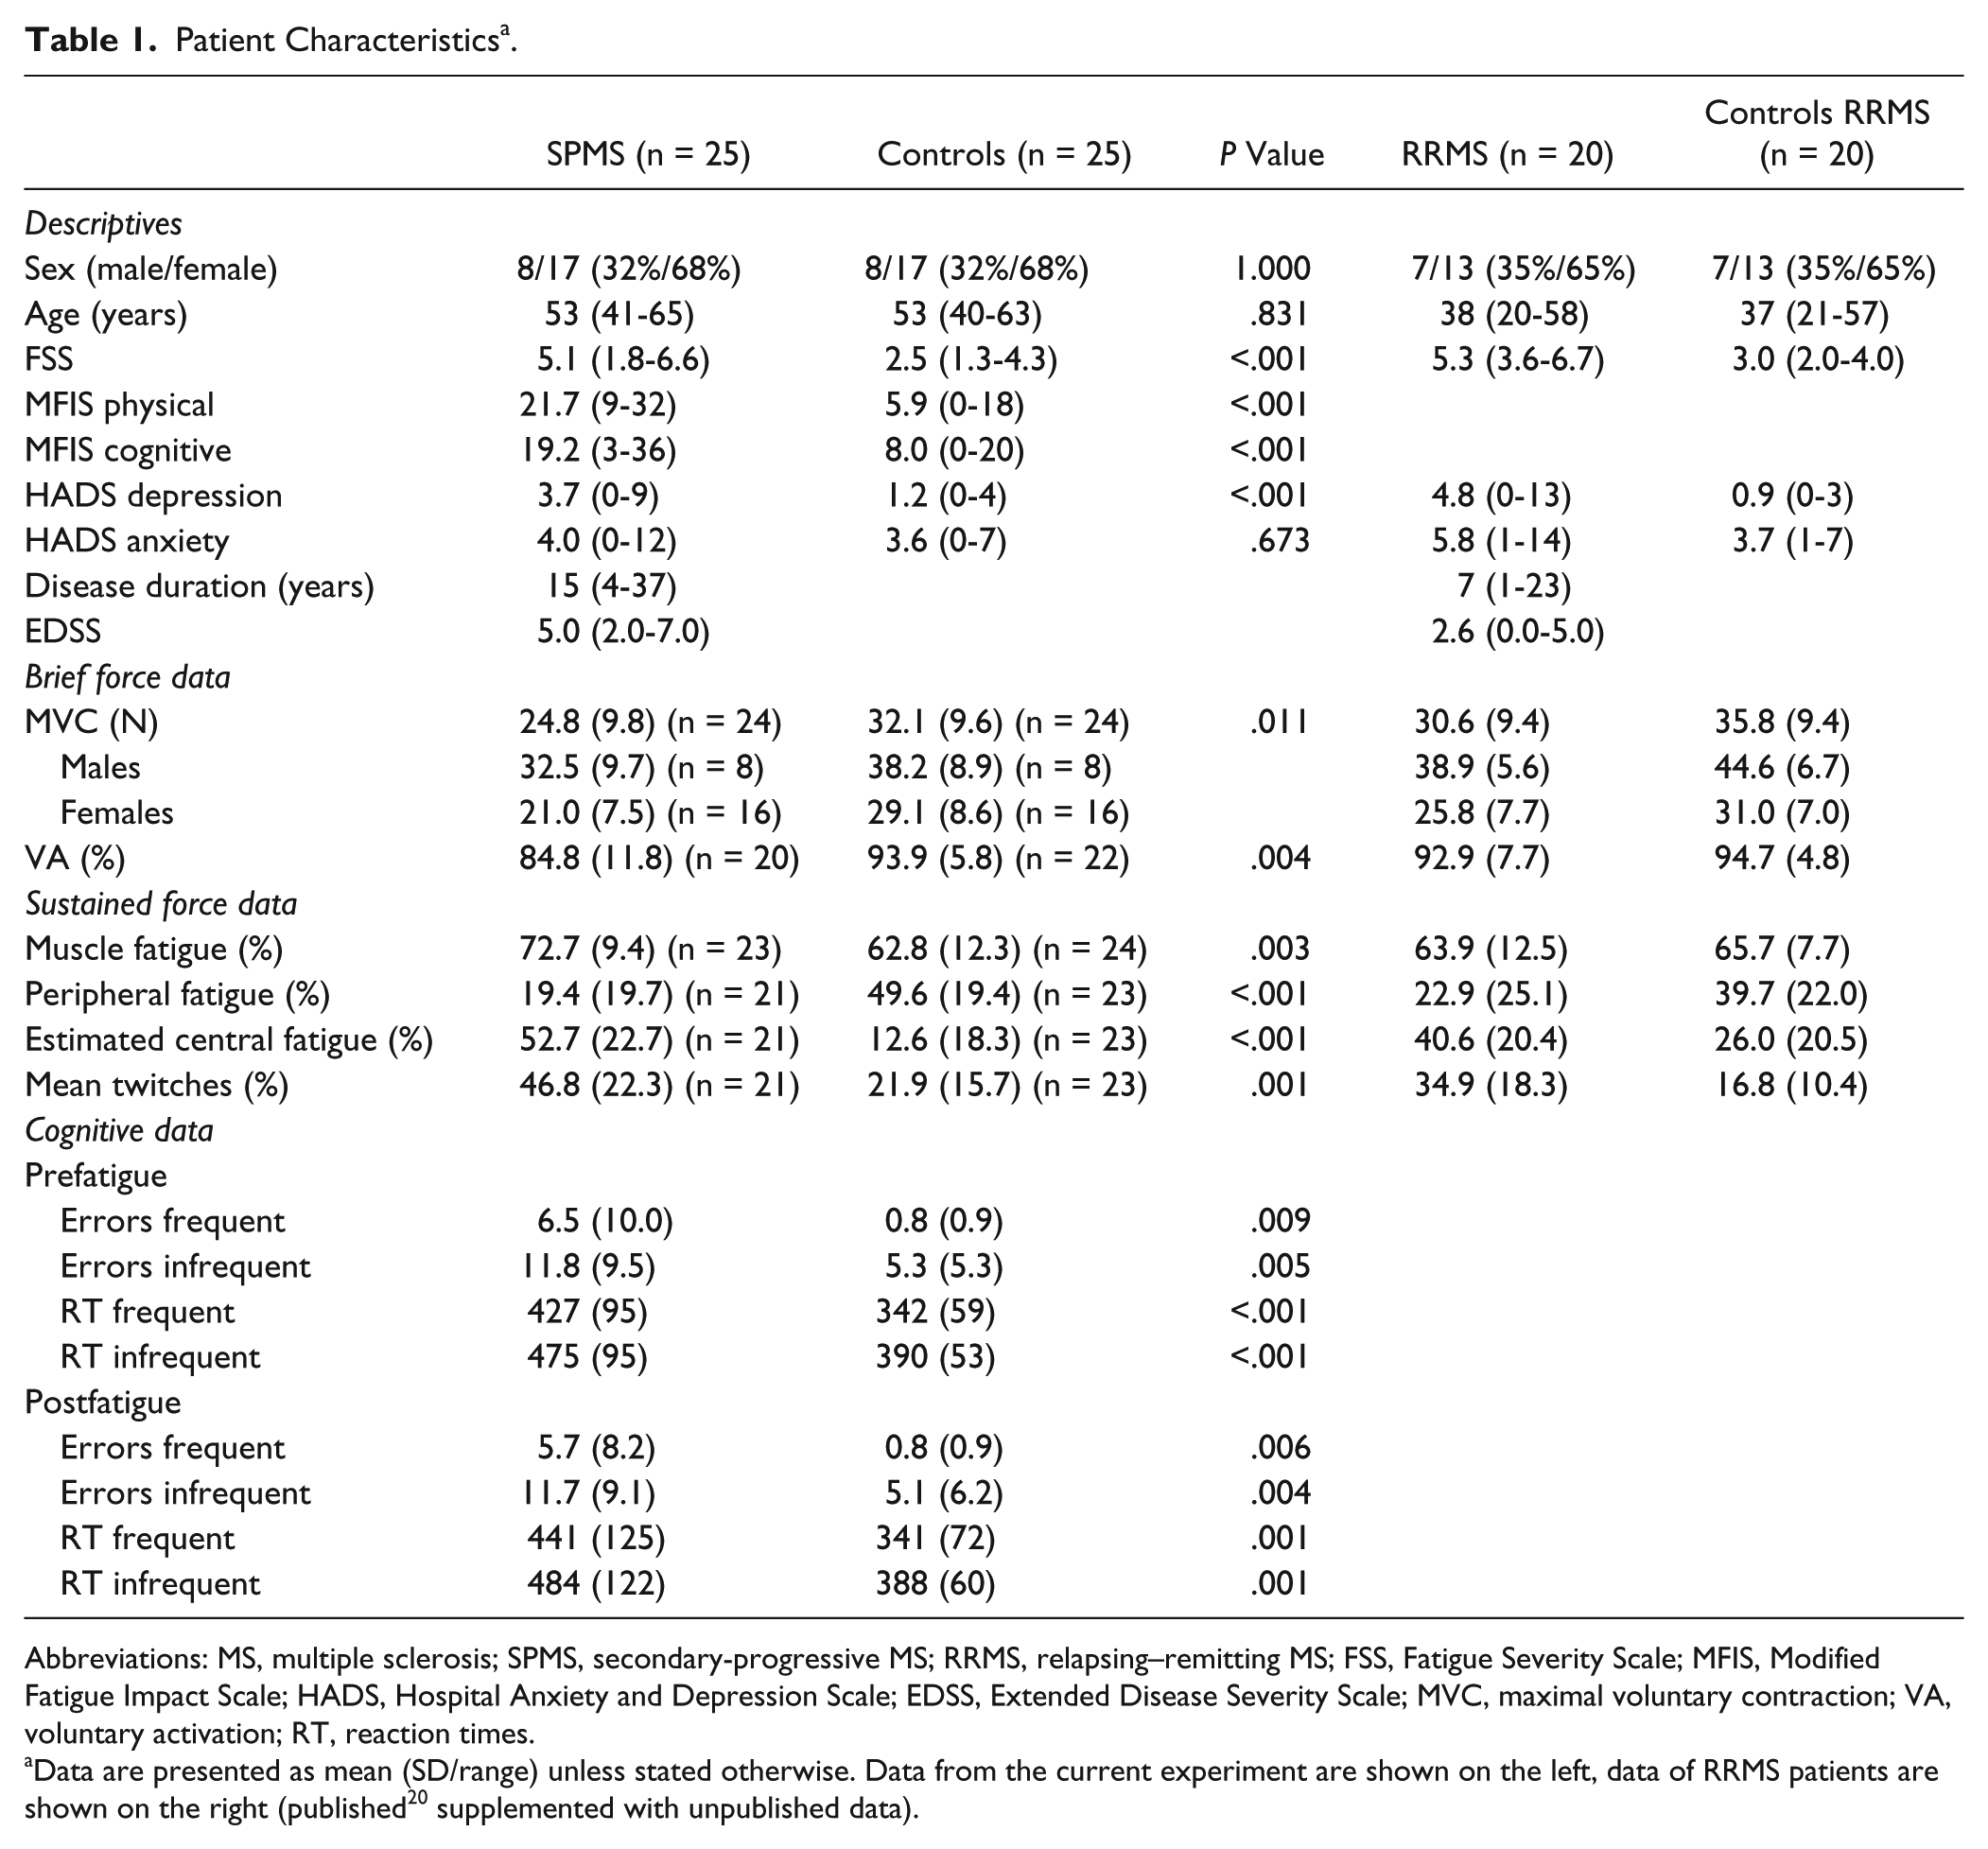
Abbreviations: MS, multiple sclerosis; SPMS, secondary-progressive MS; RRMS, relapsing–remitting MS; FSS, Fatigue Severity Scale; MFIS, Modified Fatigue Impact Scale; HADS, Hospital Anxiety and Depression Scale; EDSS, Extended Disease Severity Scale; MVC, maximal voluntary contraction; VA, voluntary activation; RT, reaction times.
Data are presented as mean (SD/range) unless stated otherwise. Data from the current experiment are shown on the left, data of RRMS patients are shown on the right (published 20 supplemented with unpublished data).
Force Data
SPMS patients were weaker (MVC: 24.8 N, SD 9.8) and had reduced VA (84.8%, SD 11.8) in comparison with controls (MVC: 32.1 N, SD 9.6; P = .011; VA: 93.9%, SD 5.8, P = .004; Table 1). SPMS patients with better activation were stronger (MVC vs VA, r = .70, P = .001).
Fatigue Data
During the sustained contraction, force and EMG declined more in SPMS patients (force: 72.7%; EMG 57.9%) than in controls (force: 62.8%, F61,2745 = 2.68, P < .001; EMG 48.2%, F61,2684 = 1.57, P = .003; Figure 2A and B). Muscle fatigue was associated with age (r = −0.33, P = .023) and MS (r = .42, P = .003) but not with MVC (P = .922).
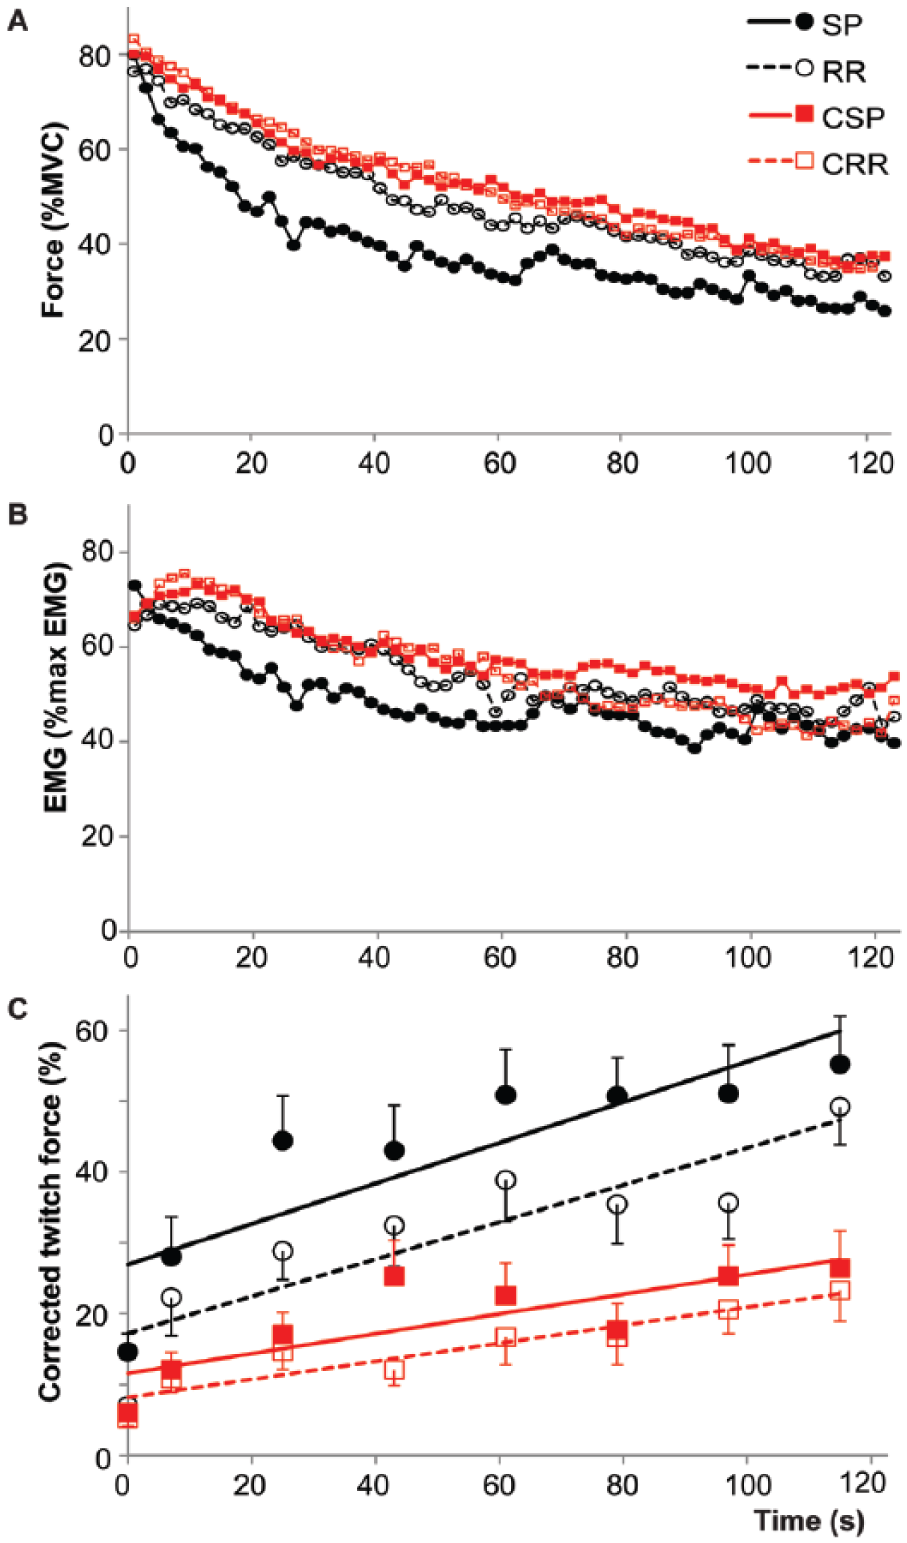
Force (A) and EMG (B) during the 2-minute sustained maximal contraction for SPMS and RRMS patients and their respective controls (data averaged over 2-second intervals). (B) Amplitude of the corrected twitches during the experiment (see Equation 4). The first data point was obtained during the brief MVC before the sustained contraction, the rest during the sustained contraction. Error bars depict standard errors. MS, multiple sclerosis; SPMS, secondary-progressive MS patients; RRMS, relapsing–remitting MS patients; CSP, controls for SPMS patients; CRR, controls for RRMS patients.
Furthermore, during the sustained contraction the evoked twitch was larger for SPMS patients than controls (F1,49.7 = 13.57, P = .001), reflecting an overall lower VA in SPMS. Over time the twitch increased in both groups (F1,1686.3 = 39.67, P < .001) but the increase, and thus central fatigue, was larger in SPMS patients (F1,956.8 = 5.16, P = .023; Figure 2). This observation was underscored by higher estimated central fatigue for the SPMS patients (52.7, SD 22.7 vs 12.6, SD 18.3; P < .001). Higher estimated central fatigue was associated with a larger mean superimposed twitch (r = .68, P < .001).
The post-fatigue twitch declined less in SPMS patients (19.4 ± 19.7%) than in controls (49.6 ± 19.4%, P < .001), indicating less peripheral fatigue in SPMS patients. This decline was inversely associated with the mean superimposed twitch during the sustained contraction (r = −.67, P < .001).
In short, SPMS patients displayed lower VA both during brief and sustained contractions, more muscle and central fatigue but less peripheral fatigue than controls.
Cognitive Task
More errors and slower responses were recorded on frequent compared to less-frequent stimuli (Table 1).
SPMS patients were slower (F1,48 = 14.71, P < .001) and less accurate (F1,48 = 12.76, P = .001) than controls (Table 1). No effect of time was present (RT: F1,48 = 0.69, P = .410; accuracy: F1,48 = 0.18, P = .670), indicating no difference in performance before and after a fatiguing motor task.
Associations With Perceived Fatigue
For SPMS patients, the FSS was not associated with any of the force parameters (muscle fatigue P = .394, MVC P = .174) nor with HADS depression (P = .541). A previously described model including HADS depression scores, MVC, muscle fatigue, and sex20,25,35 did not fit the data of SPMS patients (R2 = .14, P = .599). The MFIS physical score was associated with MVC (R = −.41, P = .045) and HADS depression (R = .53, P = .006), but not with muscle fatigue (R = .30, P = .170). The model including MVC, muscle fatigue, and HADS depression could significantly explain 36% of the variation in MFIS physical scores (R2 = .36, P = .035; rpartial: HADS depression .39, P = .083; MVC −.27, P = .329; muscle fatigue .08, P = .743).
Comparison of RRMS and SPMS Patients
First, we directly compared SPMS patients to RRMS patients. SPMS patients had lower MVCs (F1,39 = 5.12, P = .029). Furthermore, SPMS patients had lower VA during both brief (F1,36 = 6.10, P = .018) and sustained contractions (F1,38.256 = 4.64, P = .038). Over time SPMS patients showed a greater decline in force (F1,39 = 6.17, P = .017) but no difference in peripheral fatigue (F1,36 = 1.14, P = .292) nor in VA (F1,35.111 = 0.11, P = .748). The estimated central fatigue was however larger (F1,36 = 5.19, P = .029).
For different dependent variables, the variance inflation factor (VIF) for phenotype and EDSS scores varied between 1.56 and 1.65. We additionally repeated the analyses above with EDSS (instead of phenotype). These analyses revealed only significant effects for the univariate analyses of MVC (P = .046), indicating that the effects of phenotype are not mainly due to associations between phenotype and EDSS.
Second, to correct for possible age effects between SPMS and RRMS patients, we inspected interaction effects of Group and MS. During the brief contraction, VA was lower in SPMS patients (F1,76 = 4.25, P = .043). Force decline during the sustained contraction was greater in SPMS (F1,79 = 5.92, P = .017; Figure 2A). However, VA during the sustained contraction (F1,84.87 = 2.51, P = .117) and the decrease of VA over time (F1,76.97 = 0.01, P = .925; Figure 2C) were not different between the groups. The estimated central fatigue did differ between the groups (F1,83 = 7.71, P = .007) but peripheral fatigue did not (F1,75 = 2.24, P = .139).
In summary, after correction for age and sex SPMS patients have lower VA than RRMS patients during brief maximal contractions. During sustained contractions, SPMS patients show greater muscle fatigability and estimated central fatigue but no difference in peripheral fatigue. Over time the VA decrease did not differ between the phenotypes.
Discussion
Compared to controls, SPMS patients had reduced VA during brief and sustained contractions. The reduced activation resulted in weaker maximal voluntary force, more muscle and central fatigue, and less peripheral fatigue. Compared to RRMS patients, SPMS patients had lower VA, greater force decline, and more central fatigue, but no difference was found for peripheral fatigue or change in VA over time. Furthermore, neither SPMS patients nor controls showed a decline in cognitive performance after a fatiguing motor task.
SPMS Patients Have Lower VA and Larger Force Decline Than Controls
In tasks that do not require maximal force, fMRI studies demonstrated stronger activation and additionally activated motor areas in MS patients compared to controls.8,9 This is most likely to compensate for reduced connectivity between cortical areas due to axonal demyelination and cortical damage.2,9 During sustained maximal contractions, RRMS patients were not able to increase cortical output as much as controls to overcome fatigue-related changes on spinal levels.36,37 Although the diminished increase resulted in poorer VA, force decline was not different from controls. 20 The present data showed, however, a greater force decline for SPMS patients, especially in the first 20 to 30 seconds. This decline was accompanied by lower VA and more central fatigue, but also lower levels of peripheral fatigue. Thus, although smaller fatigue-related changes were observed in the peripheral neuromuscular system, the reduction in VA over time resulted in greater force decline in SPMS. Less peripheral fatigue was associated with poorer activation, suggesting that the reduced peripheral fatigue was not due to MS-related changes in the intrinsic fatigability of the muscle fibers but to reduced activity in these fibers. Studies that applied electrical stimulation to induce peripheral fatigue even showed that muscles of MS patients had a tendency to be more fatigable,38,39 although this was not confirmed in hand muscles. 40 The interplay between central and peripheral factors relevant for fatigue illustrates the complexity of muscle fatigue.
SPMS Patients Present Greater Force Decline and Estimated Central Fatigue Than RRMS Patients
The comparison between phenotypes showed that SPMS patients have poorer muscle activation already at the start of the contraction. This observation is expected if cortical/corticospinal damage is evident. 2 Reduced connectivity between primary and secondary motor areas, as expected after axonal damage, demyelination,41,42 and increased damage to grey matter, reduces corticofugal output. 43 Especially in hand muscles, corticospinal connections are dense, 44 and a decline in output to the motoneuron pool reduces both maximal motor unit rate 10 and motor unit recruitment. Poor VA therefore not only reduces motor output and thus muscle force but, as aforementioned, also reduces the amount of peripheral fatigue. However, the change in VA over time was not different for SPMS and RRMS; the difference in estimated central fatigue across the phenotypes probably reflects the overall poorer VA in SPMS patients.
Interestingly, in the first half of the sustained maximal contraction controls increased their cortical activation possibly to overcome a fatigue-related decline in spinal excitability. 36 Initially, RRMS patients also showed this increase but were unable to endure this increase. 36 Our data suggest that SPMS patients may not be able to generate sufficient cortical output already at the start of the task.
Overall, participants with poorer VA had less peripheral fatigue. However, despite the lower VA in SPMS patients and probably due to the large variability, this did not result in significant differences in peripheral fatigue between SPMS and RRMS participants.
To compare SPMS patients with RRMS patients, we aimed to correct for age differences by comparing data that were normalized to sex- and age-matched controls. Older individuals in general have lower muscle fatigability during isometric force tasks. 22 In contrast to the differences across MS phenotypes, possible explanations for an age-effect focus on peripheral factors such as changes in energy-producing pathways within the muscle and a shift toward type I muscle fibers. 45 No differences are described as yet in VA.46,47
Cognitive Performance Does Not Change After a Fatiguing Motor Task
On the cognitive task SPMS patients were slower and less accurate compared to controls.48,49 Using fMRI 23 we showed in controls that cognitive performance before and after a sustained maximal contraction did not change; however, greater activation was seen in orbitofrontal areas and the fusiform gyrus after the contraction. Hence, we anticipated that SPMS patients would be less able to increase cortical activation, and consequently would reduce their cognitive performance. In contrast to our expectation, the present study demonstrates that performance after the fatiguing motor task was not affected in SPMS patients, comparable to RR and progressive patients. 50 However, another study using physical exhaustion (treadmill running) did find decreased cognitive performance afterwards. 51
Associations With Perceived Fatigue
Even though FSS and MFIS physical were themselves moderately associated in SPMS patients, FSS showed no association with neither psychological (HADS depression) nor physiological measures (MVC, muscle fatigue), whereas the MFIS physical did. Although the model for the MFIS physical showed a significant result, the model described in previous studies20,25,35 indicating that both types of measures were involved in sensing fatigue did not seem to fit the data of the current SPMS patients well. Whether this is a result of the small sample size or whether this model does not fit data obtained in SPMS patients remains to be determined.
Limitations
This study involved a hand muscle. Muscle fatigability and central fatigue are task and muscle dependent.52,53 Hand muscles receive a strong corticospinal projection, 44 and these muscle are therefore ideally suited for the examination of VA. Furthermore, since the FDI muscle is the main index finger abductor, EMG and force recordings are relatively selective for this muscle. 54 Since leg muscles of MS patients are more likely to be affected by disuse,40,55 it is uncertain whether the results of the current study can be extrapolated to those muscles. However, the greater contribution of central fatigue to muscle fatigability was also present in lower extremities in RRMS patients. 18 Whether additional effects due to muscle disuse are present requires further examination.
To compare the 2 phenotypes we related patient data to age- and sex-matched controls. The inclusion of 4 experimental groups (instead of 2 groups) increased the difficulty of data interpretation. We cannot conclude based on our current data whether the underlying neurophysiological mechanism in SPMS patients differs from RRMS patients, or that changes in SPMS patients are only due to progression of the disease. However, it is our interpretation, based on existing literature, 2 and the analyses where phenotype was substituted for EDSS, that mechanisms might differ (loss of axonal integrity vs neuronal and axonal damage).
Future Directions and Conclusion
SPMS patients had poorer muscle activation and were subsequently weaker and displayed greater muscle and estimated central fatigue, compared to both RRMS patients and controls. These data suggest that increased cortical damage reduced compensatory mechanisms in SPMS patients, which resulted eventually in functional loss. 56 Considering the differences in motor performance and estimated central fatigue, future studies using motor tasks will benefit from differentiating between RRMS and SPMS patients. 56 In cognitive research it is already more common to distinguish across phenotypes.48,49
Reduced muscle activation will eventually result in a decline in muscle force and muscle atrophy.38,39 Therefore, rehabilitation programs that focus on maintaining or even improving VA are essential, especially since current treatment options in SPMS patients are limited. Studies in controls have shown the possibility to improve VA through exercise. 57 Few studies have investigated the effect of training on VA in MS patients.58-60 Their data indicate a possible improvement of VA. It is therefore warranted to design exercise studies for MS patients in which the effects on VA will be followed.
Footnotes
Acknowledgements
We would like to thank Cobi Bolwijn, Tjalling Nijboer, Janine Kamphuis, Manon Harmelink, and Menno Stellingwerff for their contributions.
Declaration of Conflicting Interests
The authors declared no potential conflicts of interest with respect to the research, authorship, and/or publication of this article.
Funding
The authors received no financial support for the research, authorship, and/or publication of this article.