
Abstract
Background. Exercise therapy could potentially modify metabolic risk factors and brain physiology alongside improving function post stroke. Objective. To explore the short-term metabolic, brain, cognitive, and functional effects of exercise following stroke. Methods. A total of 40 participants (>50 years, >6 months post stroke, independently mobile) were recruited to a single-blind, parallel, randomized controlled trial of community-based exercise (19 weeks, 3 times/wk, “exercise” group) or stretching (“control” group). Primary outcome measures were glucose control and cerebral blood flow. Secondary outcome measures were cardiorespiratory fitness, blood pressure, lipid profile, body composition, cerebral tissue atrophy and regional brain metabolism, and physical and cognitive function. Results. Exercise did not change glucose control (homeostasis model assessment 1·5 ± 0·8 to 1·5 ± 0·7 vs 1·6 ± 0·8 to 1·7 ± 0·7, P = .97; CI = −0·5 to 0·49). Medial temporal lobe tissue blood flow increased with exercise (38 ± 8 to 42 ± 10 mL/100 g/min; P < .05; CI = 9.0 to 0.1) without any change in gray matter tissue volume. There was no change in medial temporal lobe tissue blood flow in the control group (41 ± 8 to 40 ± 7 mL/100 g/min; P = .13; CI = −3.6 to 6.7) but significant gray matter atrophy. Cardiorespiratory fitness, diastolic blood pressure, high-density lipoprotein cholesterol, physical function, and cognition also improved with exercise. Conclusion. Exercise therapy improves short-term metabolic, brain, physical, and cognitive function, without changes in glucose control following stroke. The long-term impact of exercise on stroke recurrence, cardiovascular health, and disability should now be explored.
Introduction
Stroke affects 152 000 individuals in the United Kingdom per year 1 and is the leading cause of adult disability. 2 Approximately a third of individuals with stroke will have another stroke, 3 and 75% present with cardiac disease. 4 There is a need to develop practical interventions that reduce disability levels and prevent stroke recurrence and cardiovascular disease.
Stroke recurrence is influenced by a number of modifiable metabolic risk factors, including impaired glucose control, dyslipidemia, hypertension, obesity, and low cardiorespiratory fitness. 5 Metabolic abnormalities promote cellular changes that result in the alteration of the structure and function of blood vessels, and this damage can, in turn, lead to stroke and other vascular dysfunctions such as reduced cerebral blood flow (CBF).6-8 In the healthy population, increasing physical activity has been shown to be an inexpensive, safe, and effective method of improving metabolic risk factors and vascular control, with minimal side effects.9,10 Prospective observational studies in healthy individuals also indicate that a physically active lifestyle may be neuroprotective, preventing age-related decline in CBF, brain atrophy, and cognitive function.11,12 Whether exercise can be used for similar benefit following stroke, where low levels of physical activity are a particular problem, 13 has yet to be fully defined. 14
Strong evidence demonstrates that structured exercise leads to short- and long-term functional benefits post stroke. 14 What has not been determined is whether exercise therapy can be used to improve function but also to modify metabolic and cerebrovascular control in the short-term leading to long-term reduction in stroke recurrence and improved cardiovascular health. The limited translation of current exercise and stroke research findings into clinical care 15 also highlights a need for the development of feasible exercise interventions that can be incorporated into the stroke pathway.
This pilot randomized controlled trial aims to explore the effects of structured community exercise on metabolic risk factors and brain, physical, and cognitive function post stroke. The primary hypothesis was that structured exercise would improve glucose control and brain blood flow. Secondary hypotheses were that structured exercise would improve cerebral atrophy/metabolism, cardiorespiratory fitness, blood pressure, lipid profile, body composition, and clinical outcomes (walking ability, balance, cognition, and quality of life) and that exercise would be more effective than a home stretching program in improving metabolic risk factors, CBF/atrophy/metabolism, and clinical outcomes.
Methods
Study Design
This was a single-center, single-blind, parallel, randomized controlled trial of community exercise therapy compared with a control group that did stretching. The study was approved by the County Durham and Tees Valley Research and Ethics Committee. All participants gave informed written consent for the study according to the Declaration of Helsinki. The study was conducted from May 2011 to February 2012.
Participants
Eligible participants were >50 years old, had had a stroke (>6 months previously), were able to complete the 6-minute walk test (with/without stick), were living at home, had completed all NHS physiotherapy, and were not already undertaking regular exercise (≥3 times/wk, moderate intensity). Exclusion criteria were the following: absolute and relative contraindications to exercise testing (American Heart Association guidelines), 16 insulin-dependent diabetes, neurological disorders other than stroke, pain on walking (>5 on the Visual Analogue Scale), inability to follow 2-stage commands, cognitive problems (Mini Mental State Examination score <24), untreated major depression, and contraindications to magnetic resonance (MR) imaging.
Setting
Participants were recruited from stroke services in the North East via referral from stroke health professionals or advertisement in the local newspaper.
Structured Exercise Intervention
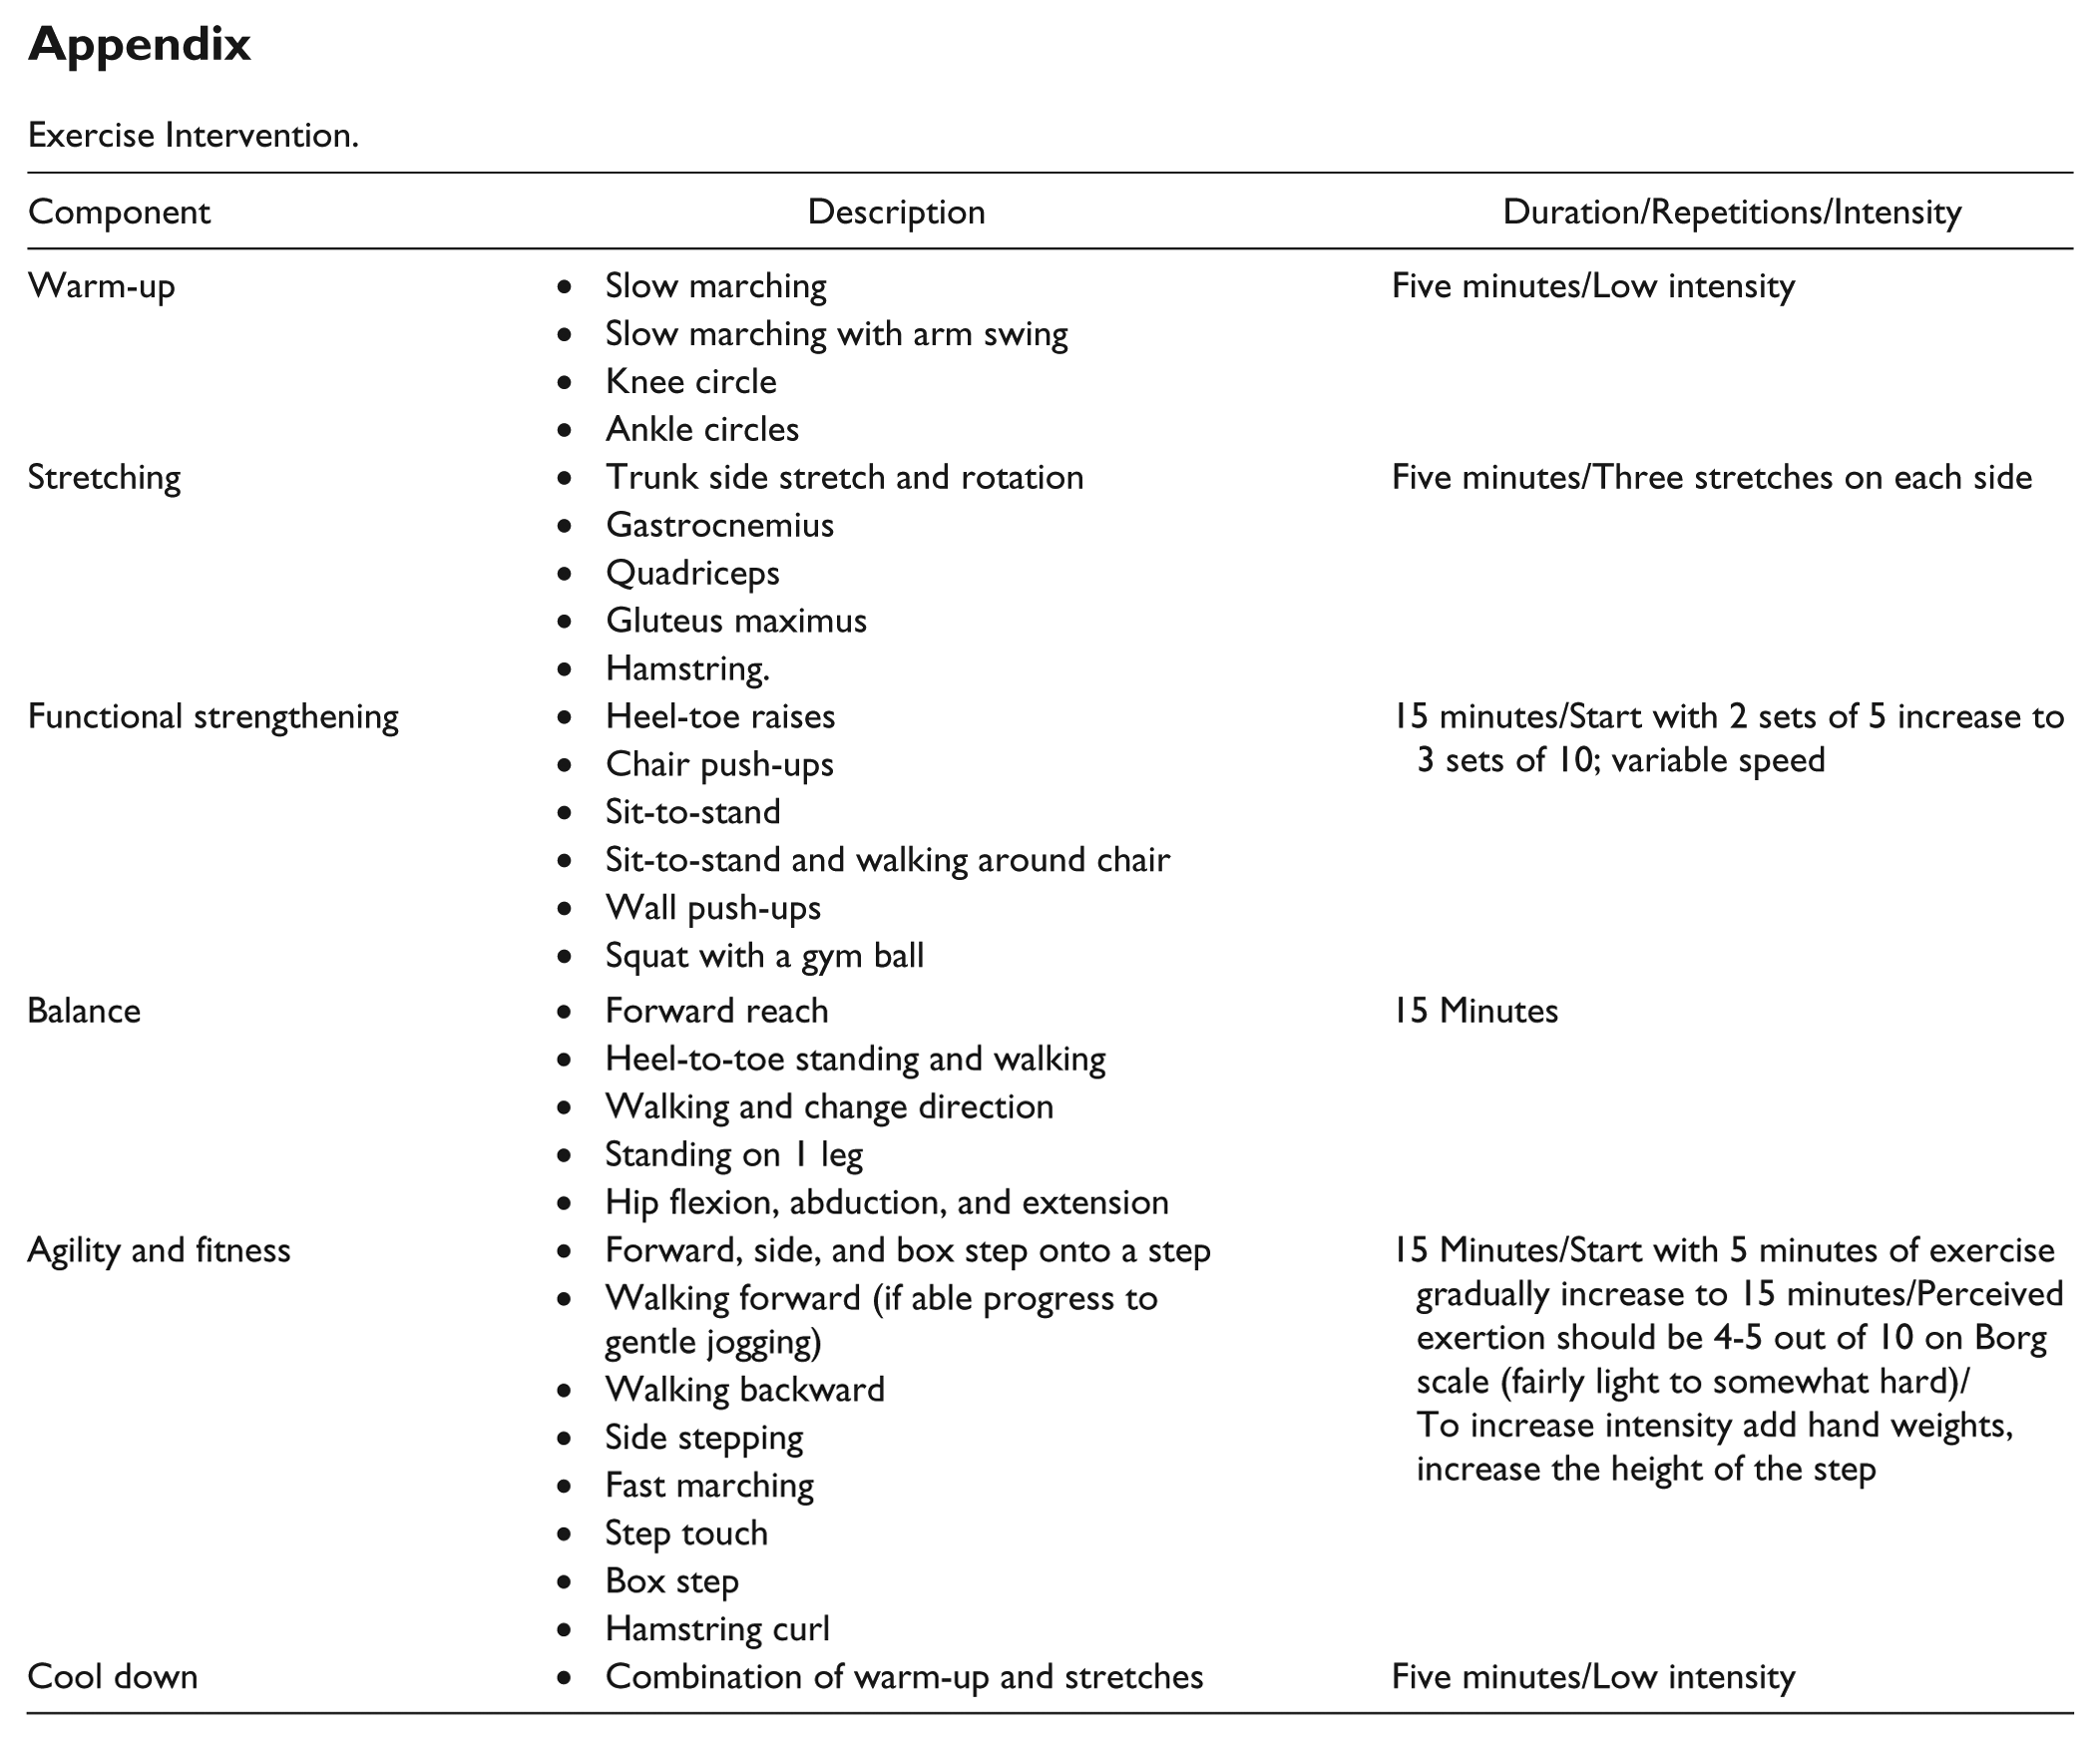
The intervention was adapted from the Fitness and Mobility Exercise program 17 (see the appendix) a mixed exercise intervention incorporating functional movement and previously demonstrated to be effective and feasible following stroke.18,19 Briefly, community leisure-center classes were run by a physiotherapist and physical activity instructor for 19 weeks (3 times/wk, 45-60 minutes). This duration was selected because interventions of a similar length have improved both function 20 and glucose control post stroke. 21 To progress the cardiovascular element of the exercise program, a heart rate training zone was calculated for participants using the Karvonen formula: [(Heart rate reserve × Training %) + Resting heart rate]. 22 Initially, participants trained at 40% to 50% of their maximum heart rate, measured by a heart rate monitor (Polar, Finland), with increasing increments of 10% every 4 weeks up to 70% to 80%, as tolerated. Strength/balance exercises were progressed by increasing repetitions and loading.
Control Intervention
The control group completed a matched-duration home stretching program. Stretching was chosen because other potential control interventions such as yoga or Tai chi can improve metabolic risk factors, 23 whereas these benefits have not been demonstrated with stretching. Participants were given an instruction booklet and diary to record stretches and changes in medication/diet/physical activity and contacted fortnightly to check progress.
Outcomes
Outcomes were assessed at baseline and within 1 week postintervention by assessors blinded to the study hypotheses and group assignment.
Glucose Control
After a 12-hour fast, glucose and insulin were measured before and after a 75-g glucose load, as described previously. 24 The Homeostasis Model Assessment of Insulin Sensitivity (HOMA) was used to calculate insulin sensitivity at baseline: [(Fasting insulin in U/mL × Fasting glucose in mmol/L)/22.5]. 25
Gray Matter Atrophy, CBF, and Regional Metabolism
MR imaging was undertaken preintervention and postintervention to measure cerebral tissue atrophy, blood flow, and regional metabolism. This protocol was selected because exercise can increase global CBF 26 and volume 27 and specifically increase blood flow in the dentate gyrus. 28 Imaging was performed using a whole-body 3.0T MR scanner (Achieva, Philips Medical Systems, Best, Netherlands).
Anatomical T1-weighted images were collected (FOV = 240 × 180 × 216 mm3; TR = 8.3 ms; TE = 4.6 ms) and were segmented in SPM8 to produce gray and white matter masks from which longitudinal changes in brain structure over time were examined using voxel-based morphometry.
CBF was measured using arterial spin labeling (FAIR method: TE = 23 ms; TR = 4 s; 4 × 4 × 6 mm3 resolution; FOV = 256 × 256 × 84 mm3), with inflow times from 900 to 2400 ms (300-ms steps). The imaging volume was positioned parallel to the anterior commissure–posterior commissure line, with lower slices covering the hippocampus. Perfusion-weighted and magnitude images were computed for each inflow time, from which T1 and proton density maps were derived. The inflow transit delay was computed by fitting the perfusion signal versus inflow time to a general kinetic model. CBF was then quantified based on perfusion signal, proton density images, and transit delay, assuming T1 of the blood to be 1550 ms and blood-brain partition coefficient to be 0.9. Global CBF was measured using the gray and white matter masks. Medial temporal lobe gray matter blood flow was assessed because it was defined as a region of interest from the volumetric scans.
Metabolite data (N-acetylaspartate to total creatine ratio) were collected from a single voxel of 40 × 15 × 10 mm3 covering the dentate gyrus using MR spectroscopy (PRESS; TE of 38 ms, TR of 3 s, 128 averages). Spectra were analyzed in jMRUI software, using the QUEST algorithm. 29
Cardiorespiratory Fitness
A maximal progressive recumbent bicycle exercise test was undertaken following a previously devised protocol. 30 Briefly, expired gases were analyzed at rest (5 minutes) and continuously during the test using a mixing chamber methodology (Metalyzer 3B Cortex, Leipzig, Germany). A 3-minute warm-up (20 W) was followed by 10-W increments every minute until the patient was unable to pedal at 50 revolutions per minute or voluntarily terminated the test.
Resting Blood Pressure
Resting diastolic and systolic blood pressure was recorded twice using a semiautomated sphygmomanometer after 10 minutes sitting.
Lipid Profile
Fasted total cholesterol, triacylglyceride, low-density lipoprotein cholesterol (LDL-C), and high-density lipoprotein cholesterol (HDL-C) were determined preintervention and postintervention. Calculation of LDL was done using the Friedewald formula. 31
Body Composition
Height and weight were measured using a standard rigid stadiometer, to the nearest 0.1 cm, and calibrated scales, to the nearest 0.2 kg (Seca medical 769 column scale, Chino, CA). Body mass index was calculated in kg/m2. Body composition was measured using air displacement plethysmography (BodPod, Life Measurement Inc, CA). 32
Physical and Cognitive Outcomes
Preintervention and postintervention assessments consisted of the following: (1) physical performance: 6-minute walk test, 33 10-m walk test, 34 and Berg Balance Scale 35 ; (2) cognitive function: Addenbrooke’s Cognitive Examination Revised (ACE-R) 36 ; and (3) quality of life: Stroke Impact Scale Version 2.0. 37
Feasibility Assessment
Protocol feasibility criteria were compliance with the study protocol (≥90%); attrition rate (≤10%); clinical safety (100%) and effective data processing (100%). Ratings used to define study feasibility were: (1) protocol feasible (all success criteria achieved); (2) protocol feasible with minor modifications (≥75% success criteria achieved); (3) protocol feasible with major modifications (≥50% success criteria achieved), and (4) protocol not feasible (none of success criteria achieved). 38
Safety Outcomes
Exercise testing followed ACSM safety guidelines. 39 Trial safety reporting was undertaken in line with national guidelines. 40
Sample Size
For CBF, sample size calculation was based on our previous CBF measurements, which showed intraparticipant reproducibility of 8.5%. Effect size was postulated at 10%, which is a conservative estimate when compared with animal data showing the effect of exercise in a mouse model. 28 These data indicate that the method has >95% power to detect a 10% change in CBF, at a significance of P = .01, using pairwise measurements in a group of 16 participants.41,42 Sample size was increased to 20 participants to allow for 20% dropout. The sample size for metabolic control was determined from the published data on the effect of aerobic exercise on metabolic control following stroke. 21 Based on changes in basal insulin (delta 23 ± 35 vs −9 ± 42) and 5% confidence level, a sample size of 20 gives >80% power. To provide sufficient power to explore both primary outcomes, we recruited 20 patients into the intervention and 20 into the control group.
Randomization
A computerized random number generator was used to allocate treatment by an independent administrator after screening. After establishing participant eligibility and consent, the administrator was telephoned for the next number in the sequence to enable participant randomization.
Statistical Methods
Data were inspected for outliers and assessed for normality of distribution. Groups were compared at baseline using an independent-sample t test if data conformed to the assumptions of normality; if not, the independent-samples Mann Whitney U test was applied. Between- and within-group differences were assessed from change scores compared using independent-sample t tests. Preintervention and postintervention within-group analyses were performed using a paired t test if data conformed to the assumptions of normality; if not, the Wilcoxon signed-rank test was applied. Statistical significance was indicated if P < .05. Data are presented as means ± SD unless otherwise indicated.
Results
Participant Flow
Participants were recruited from 2 local stroke services over a 6-month period. In all, 400 possible participants were screened (see Figure 1 for participant flow) to recruit 40 participants.
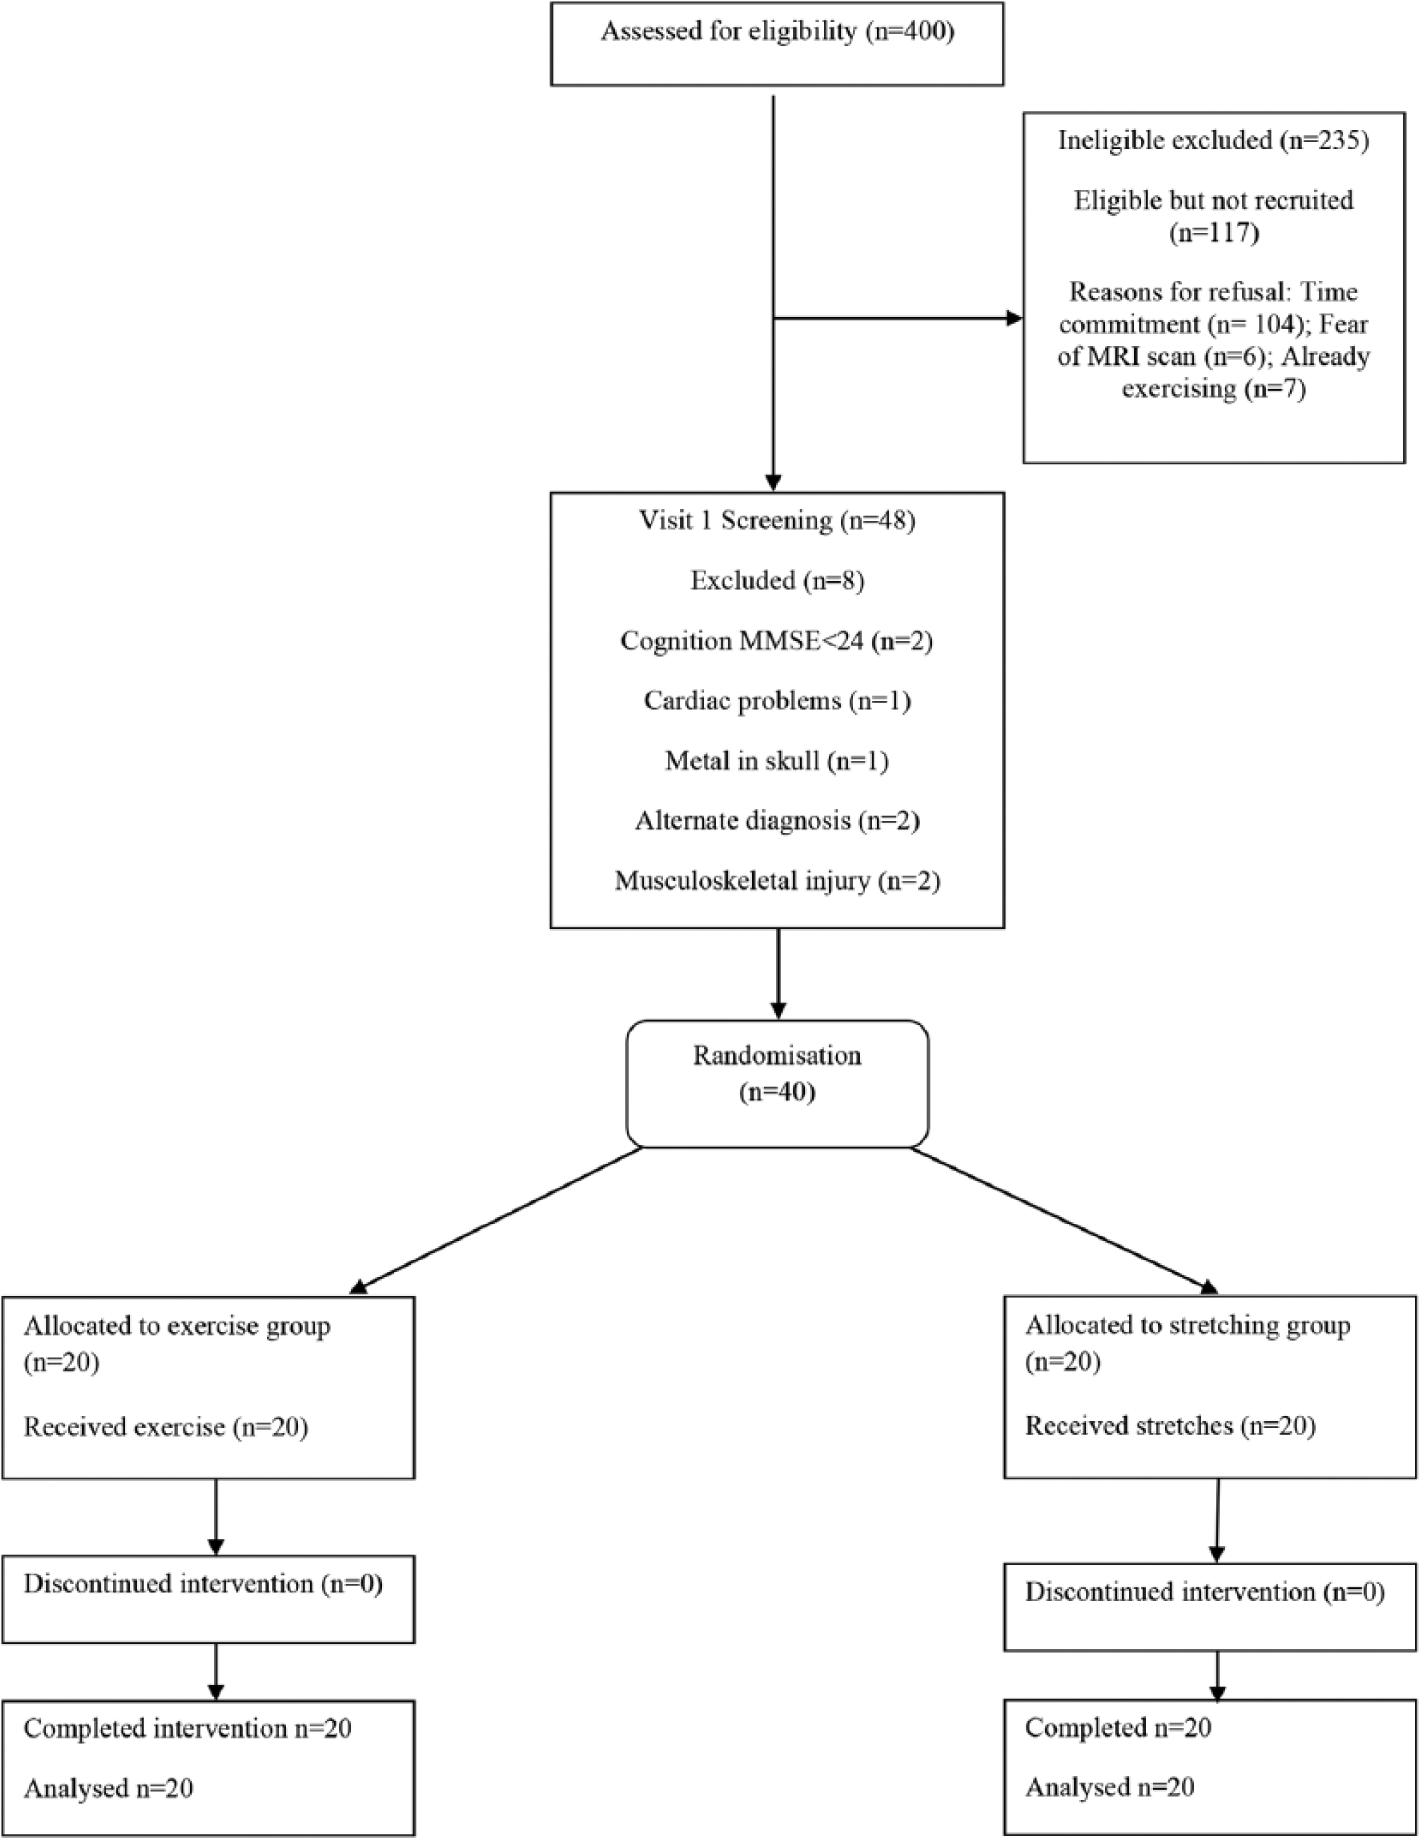
Participant flow diagram.
Participant Characteristics
Of the 40 participants, 34 were male and 37 had an ischemic stroke. Impairment levels were mild to moderate (National Institute for Health Stroke Scale range = 0-8), with 55% of participants not achieving age- and gender-related distances on the 6-minute walk test. There were no significant differences in baseline measures between the exercise and control groups (Table 1). To test the primary and secondary hypotheses within- and between-group differences were investigated for all outcomes.
Baseline Demographics and Clinical Characteristics. a
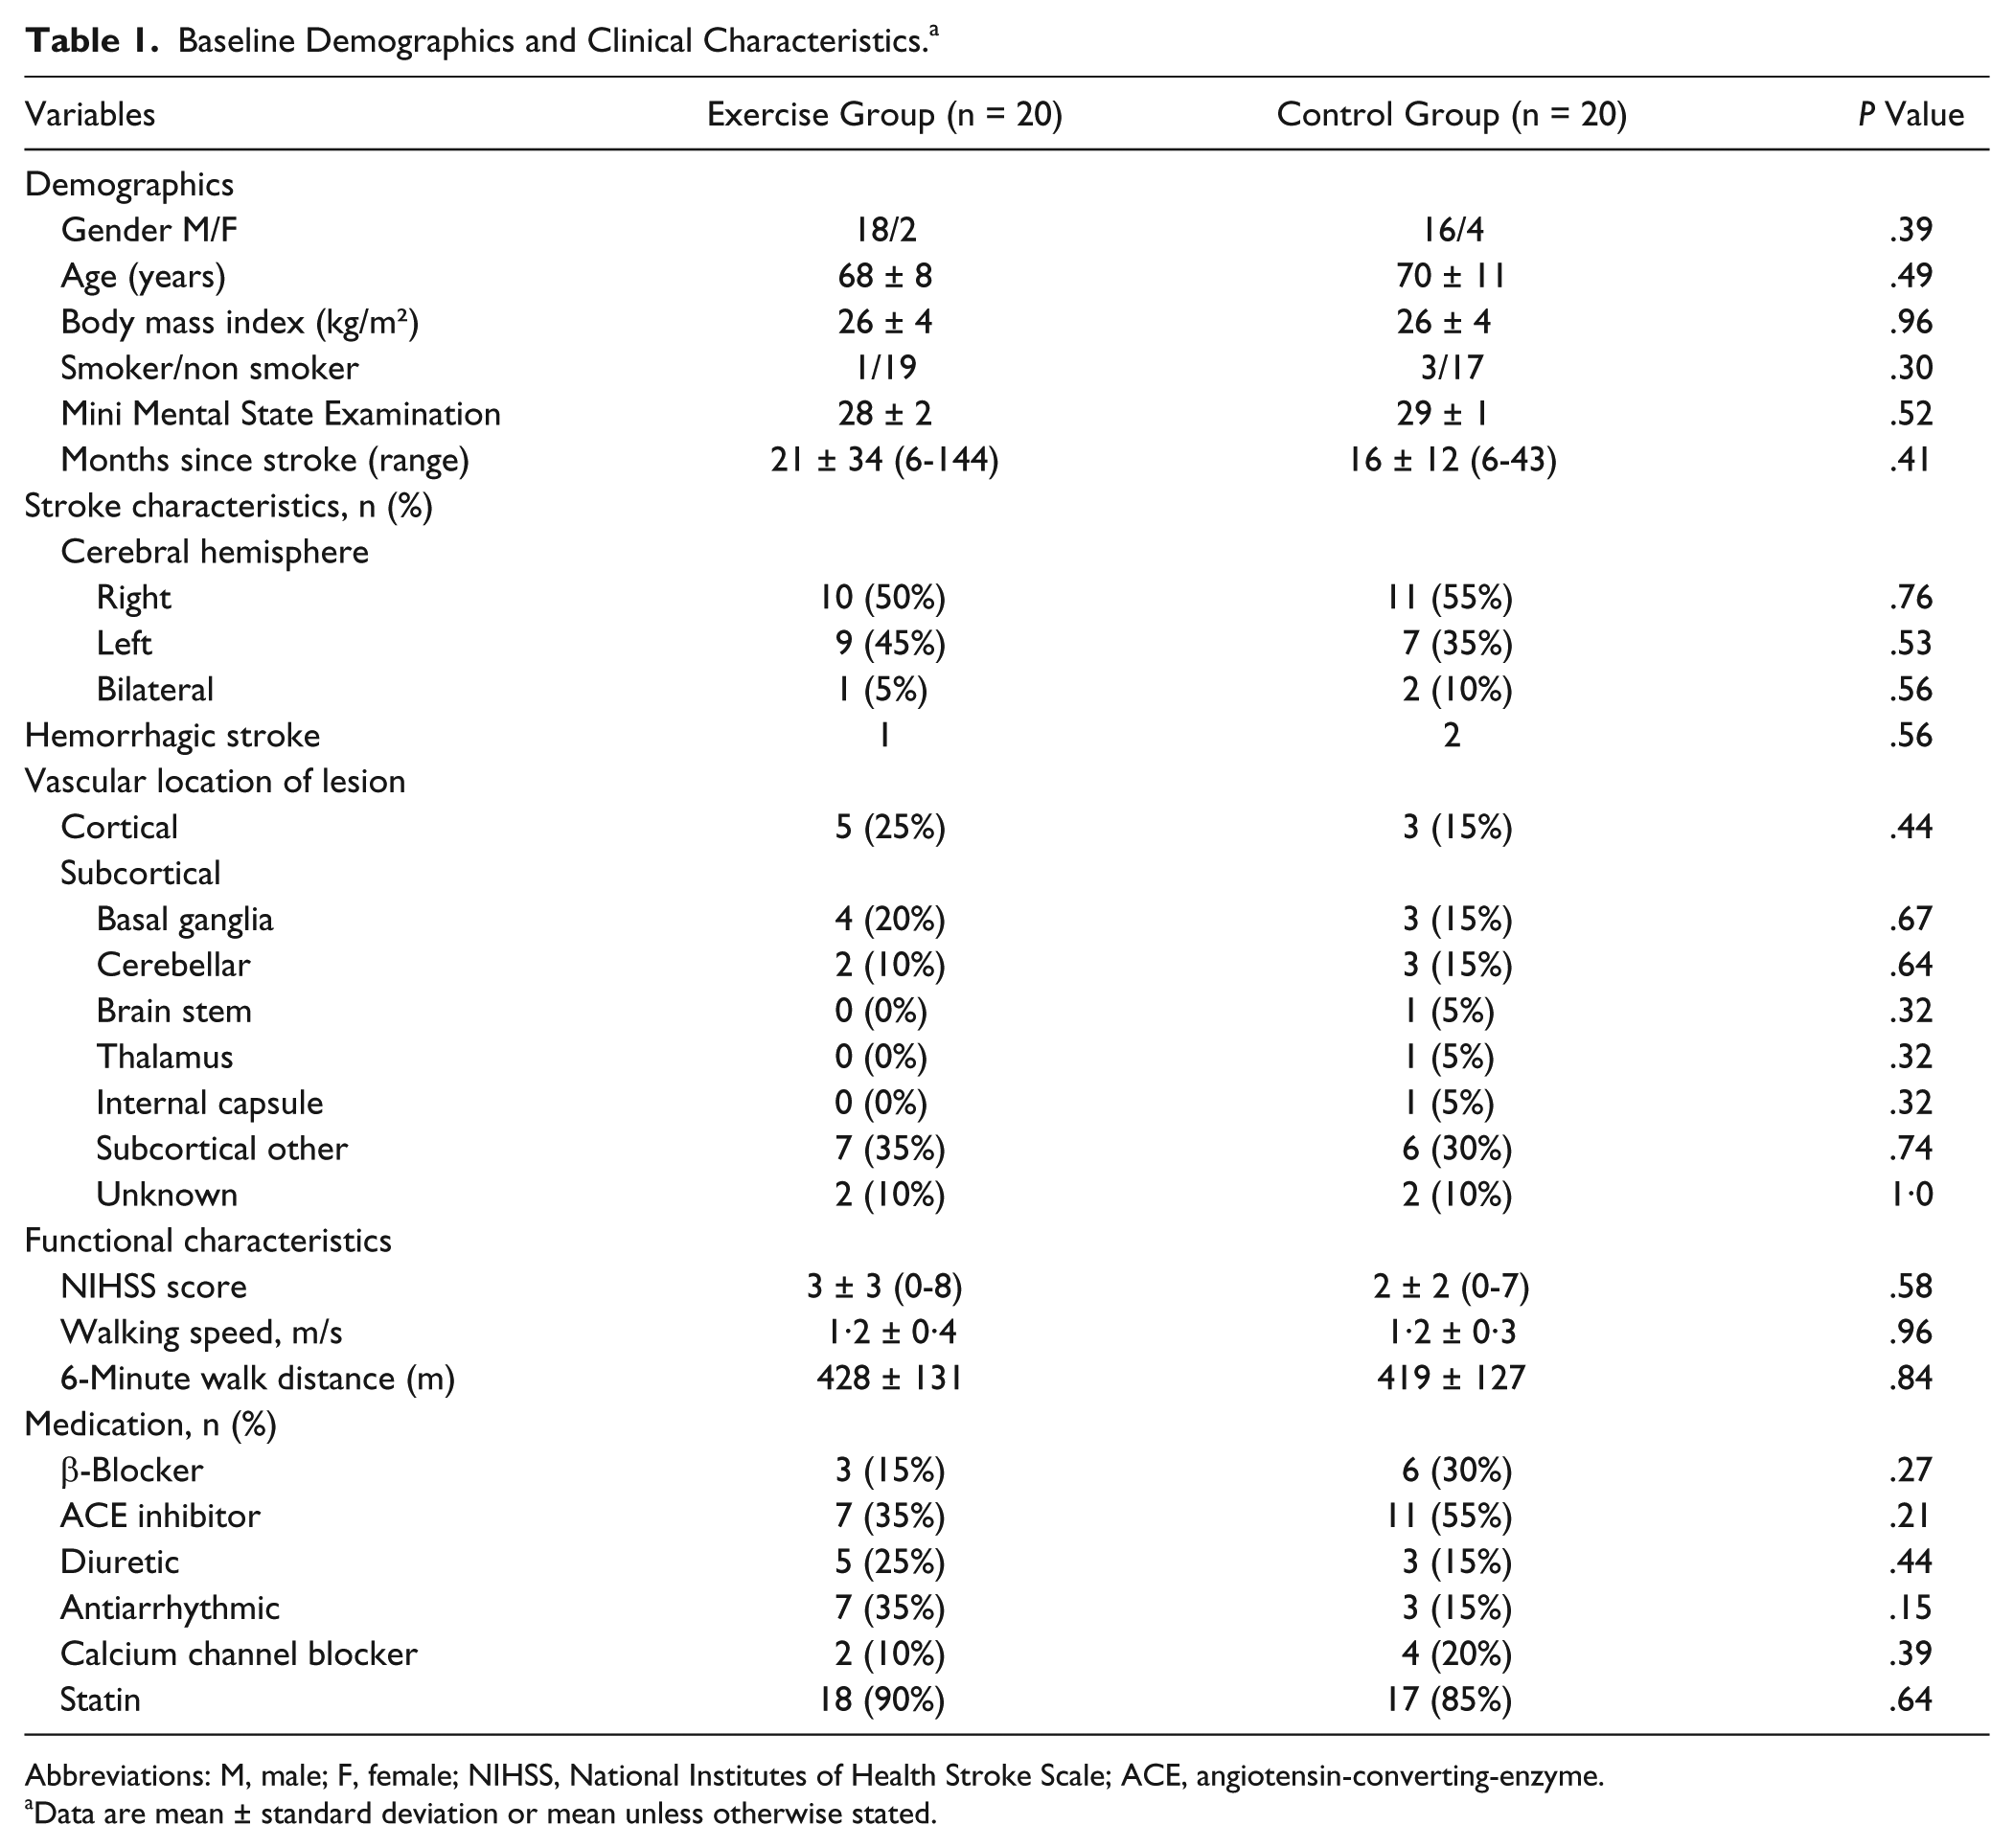
Abbreviations: M, male; F, female; NIHSS, National Institutes of Health Stroke Scale; ACE, angiotensin-converting-enzyme.
Data are mean ± standard deviation or mean unless otherwise stated.
Primary Outcomes
The effects of structured exercise on glucose control
Baseline fasted glucose levels in both groups were normal (<7·8 mmol/L; Table 2). At baseline, 6 individuals (3 exercise and 3 control) had impaired glucose tolerance (IGT; >7·8 to <11·1 mmol/L), and 3 (1 exercise and 2 control) had newly diagnosed type 2 diabetes mellitus (T2DM; >11.1 mmol/L). Neither a within- or between-group difference was demonstrated postintervention in 2-hour glucose or baseline insulin sensitivity (HOMA)(Table 2). Of the 3 exercisers starting with IGT status, 2 changed to levels within normal limits, and the individual with T2DM changed to IGT status. Of the 3 controls with IGT, 1 changed to levels within normal limits, and the 2 with T2DM changed to IGT status.
Metabolic Risk Factors, Cerebral Blood Flow and Spectroscopy Outcomes. a
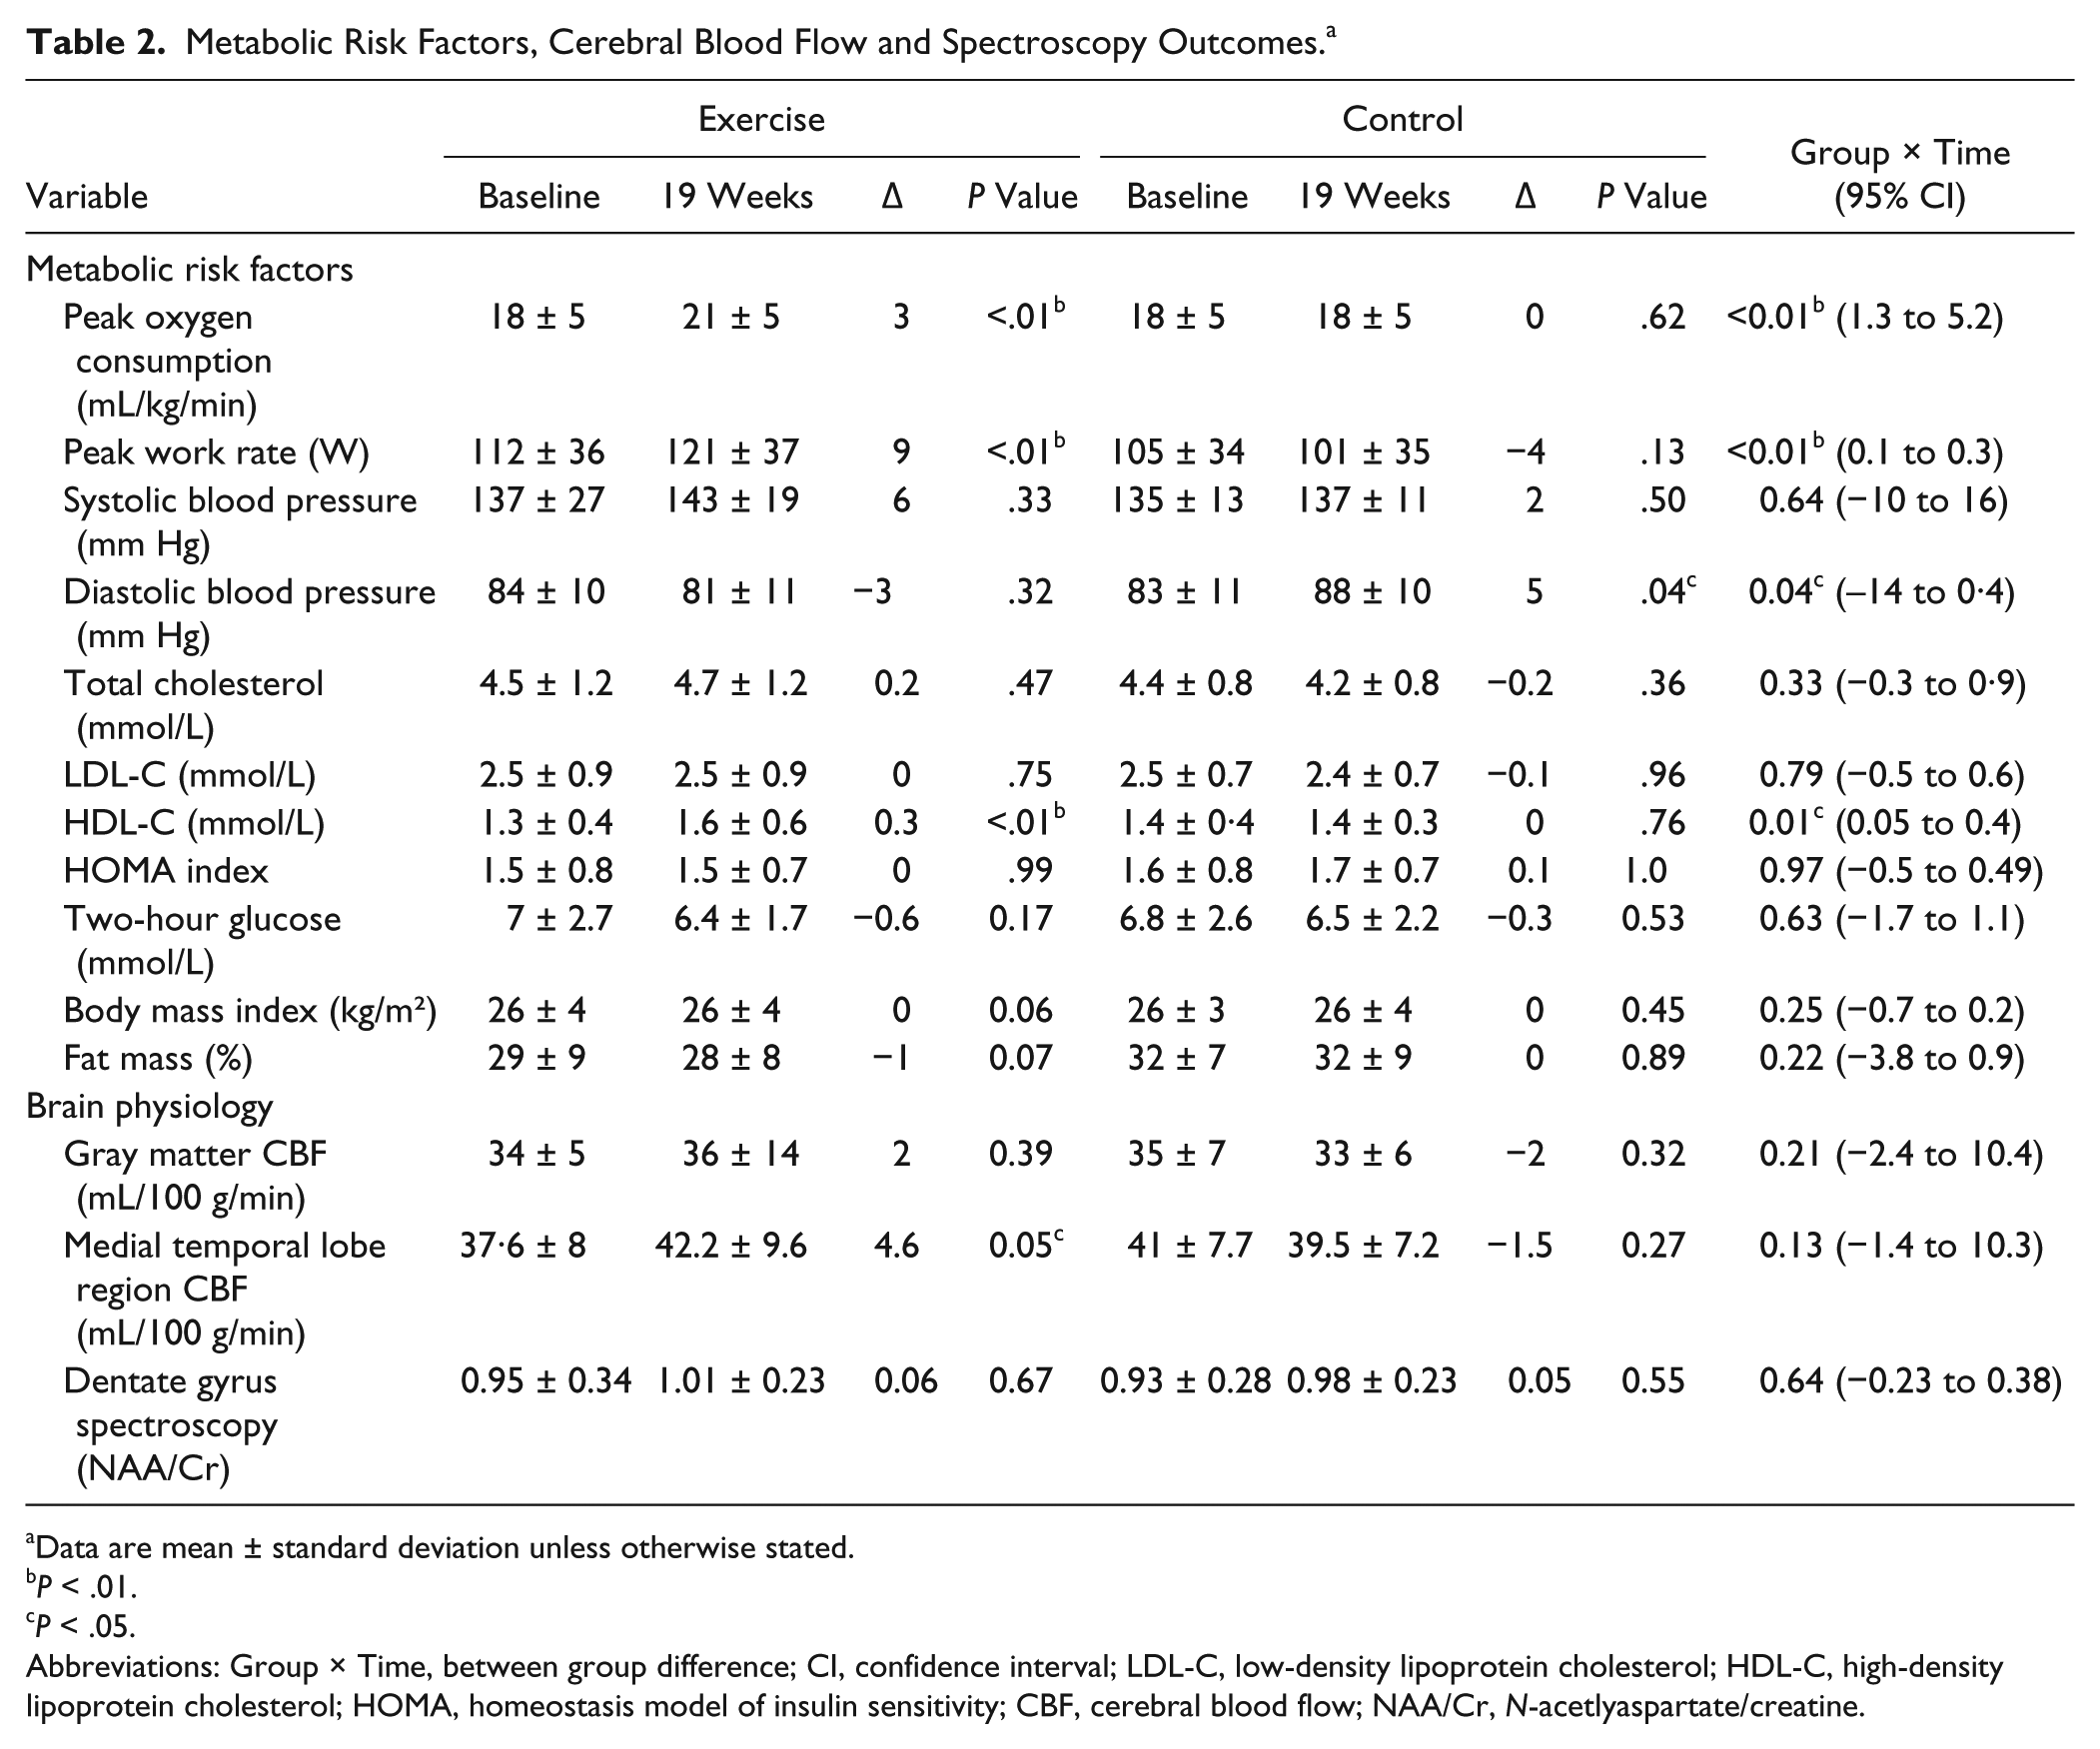
Data are mean ± standard deviation unless otherwise stated.
P < .01.
P < .05.
Abbreviations: Group × Time, between group difference; CI, confidence interval; LDL-C, low-density lipoprotein cholesterol; HDL-C, high-density lipoprotein cholesterol; HOMA, homeostasis model of insulin sensitivity; CBF, cerebral blood flow; NAA/Cr, N-acetlyaspartate/creatine.
The effects of exercise on CBF
There was no change in global gray matter CBF postintervention (Table 2). Regional analysis of medial temporal lobe CBF in the areas seen to suffer structural change (Figure 2: clusters 1 and 2) revealed a paired group increase in flow in the exercise group (38± 8 vs 42 ± 10 mL/min/100 g, P = .05) but not in controls (41 ± 8 vs 40 ± 7 mL/min/100 g, P = .27). A between-group difference in regional CBF was not observed.
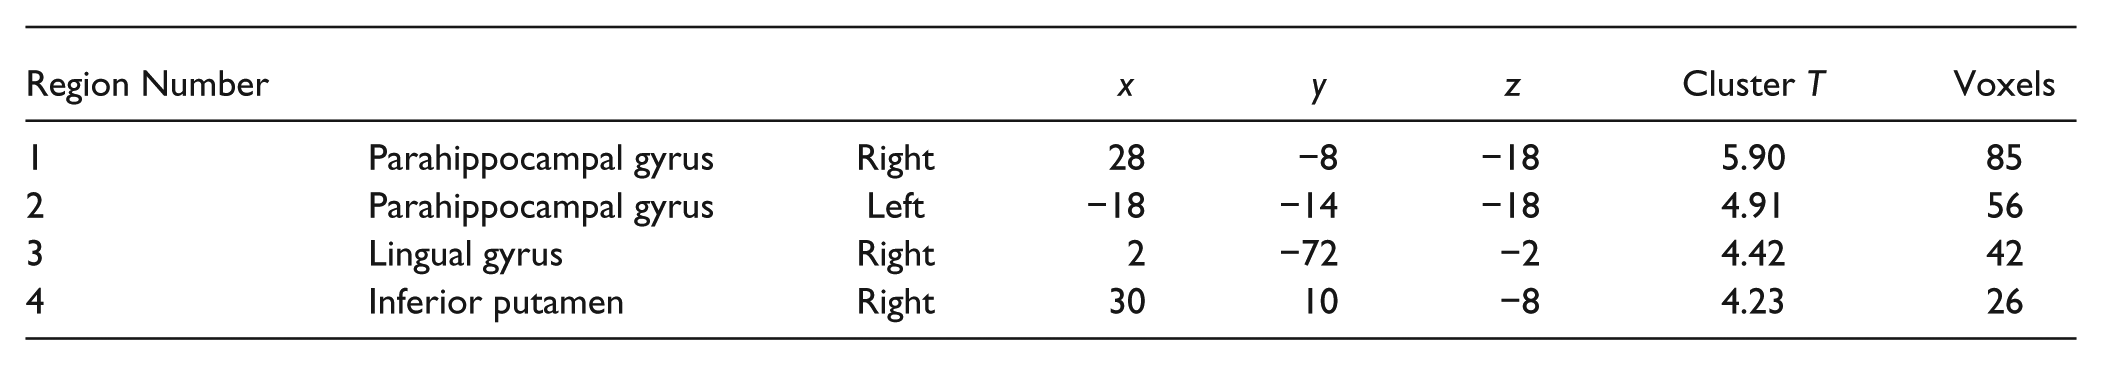
SPM glass brain view and coordinates of specific gray matter atrophy in the control group after the intervention. Within-group comparison showed significant bilateral atrophy of the medial temporal lobe in the control group (P < .05), whereas the exercise group showed no significant changes. Data are thresholded at P < .001 (uncorrected), applying a minimum cluster size (k > 10). Coordinates of the significant differences are as follows:
Secondary Outcomes
Cerebral tissue volume
Paired regional analysis revealed a significant bilateral atrophy of the medial temporal lobe in the control group that was not observed in the exercise group (Figure 2). A between-group difference was not observed in cerebral tissue volume.
Cerebral metabolism
Good quality MR spectroscopy data were available only in 16 exercisers and 15 controls because of the technical challenges of acquiring spectroscopy in the dentate gyrus. Analysis of the spectra of the ratio of N-acetylaspartate to creatine demonstrated no change following the intervention (Table 2).
Cardiorespiratory fitness
Significant within-group changes were demonstrated with exercise in peak oxygen consumption (increased by 17%) and work rate (Table 2; Figure 3, panel A). There were significant between-group differences in peak oxygen consumption and peak work rate in favor of the exercise group (Table 2).
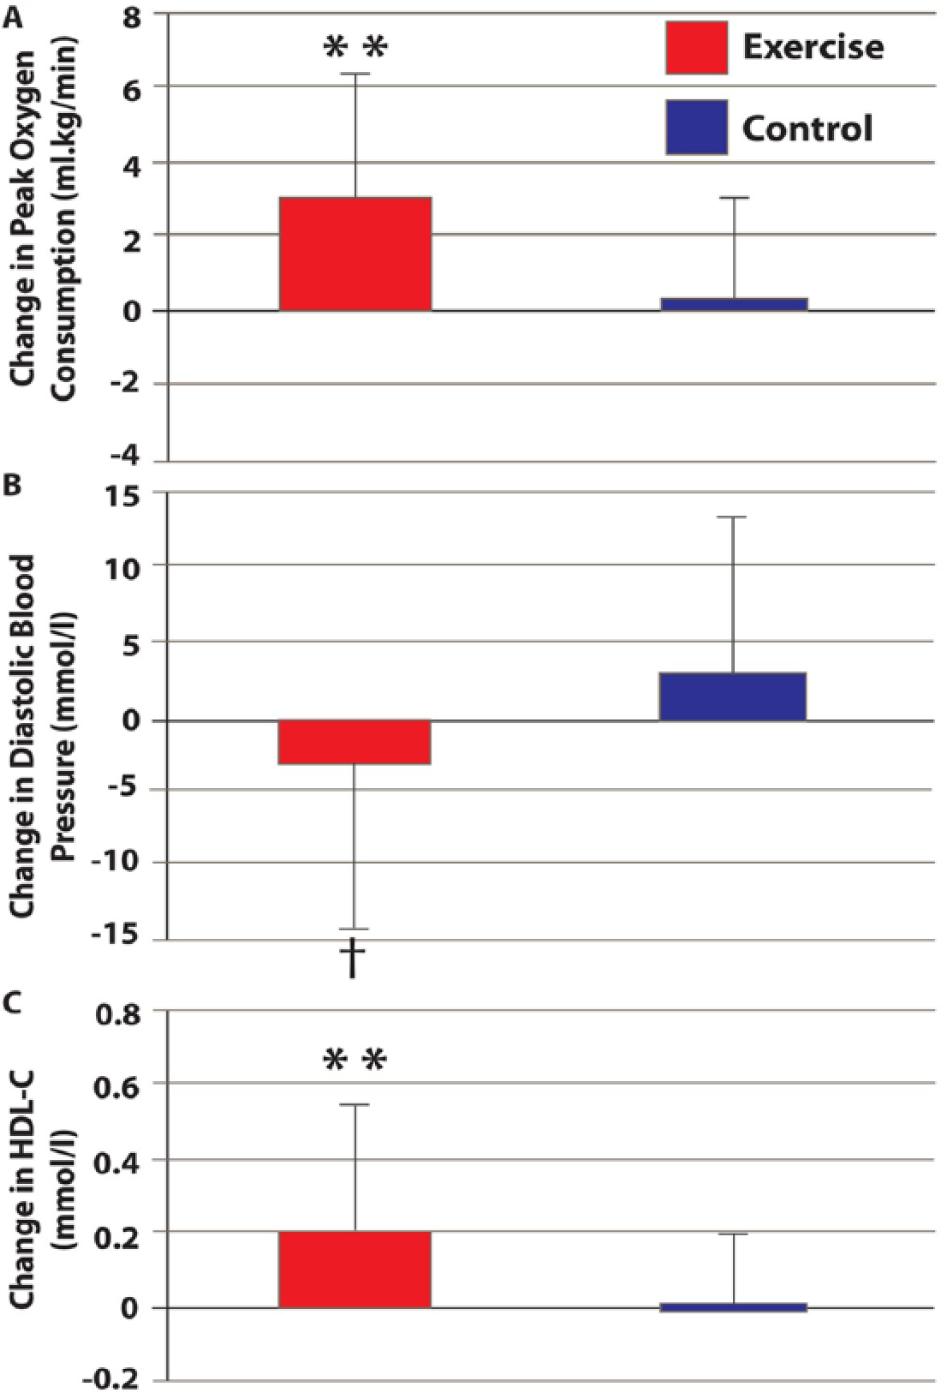
Changes in peak oxygen consumption (panel A), diastolic blood pressure (panel B), and high-density lipoprotein cholesterol HDL-C; panel C) preintervention and postintervention for exercise and control groups.a
Blood pressure
A significant within-group increase was demonstrated in diastolic BP in the control group (Table 2). There was a significant between-group difference in resting diastolic but not systolic BP in favor of exercise (Table 2; Figure 3, Panel B).
Lipid profile
A significant within-group improvement in HDL-C was observed with exercise (Table 2). HDL-C levels increased significantly in the exercise group compared with controls (Table 2; Figure 3, panel C). Total cholesterol and LDL-C levels were unchanged in both groups following the intervention (Table 2).
Body composition
Body mass index and composition were unchanged in both groups following the intervention (Table 2).
The Effects of Exercise on Clinical Outcomes
Significant within-group improvements were observed in both groups in measures of walking and balance. Significant within-group improvements were only made in the exercise group in cognition and stroke recovery, mood, strength, and overall physical activity. Significant between-group differences were demonstrated in favor of the exercise intervention in walking ability, balance, cognition, mood, and overall stroke recovery (Table 3).
Clinical Outcomes: Walking Ability, Balance, Cognition, and Quality of Life. a
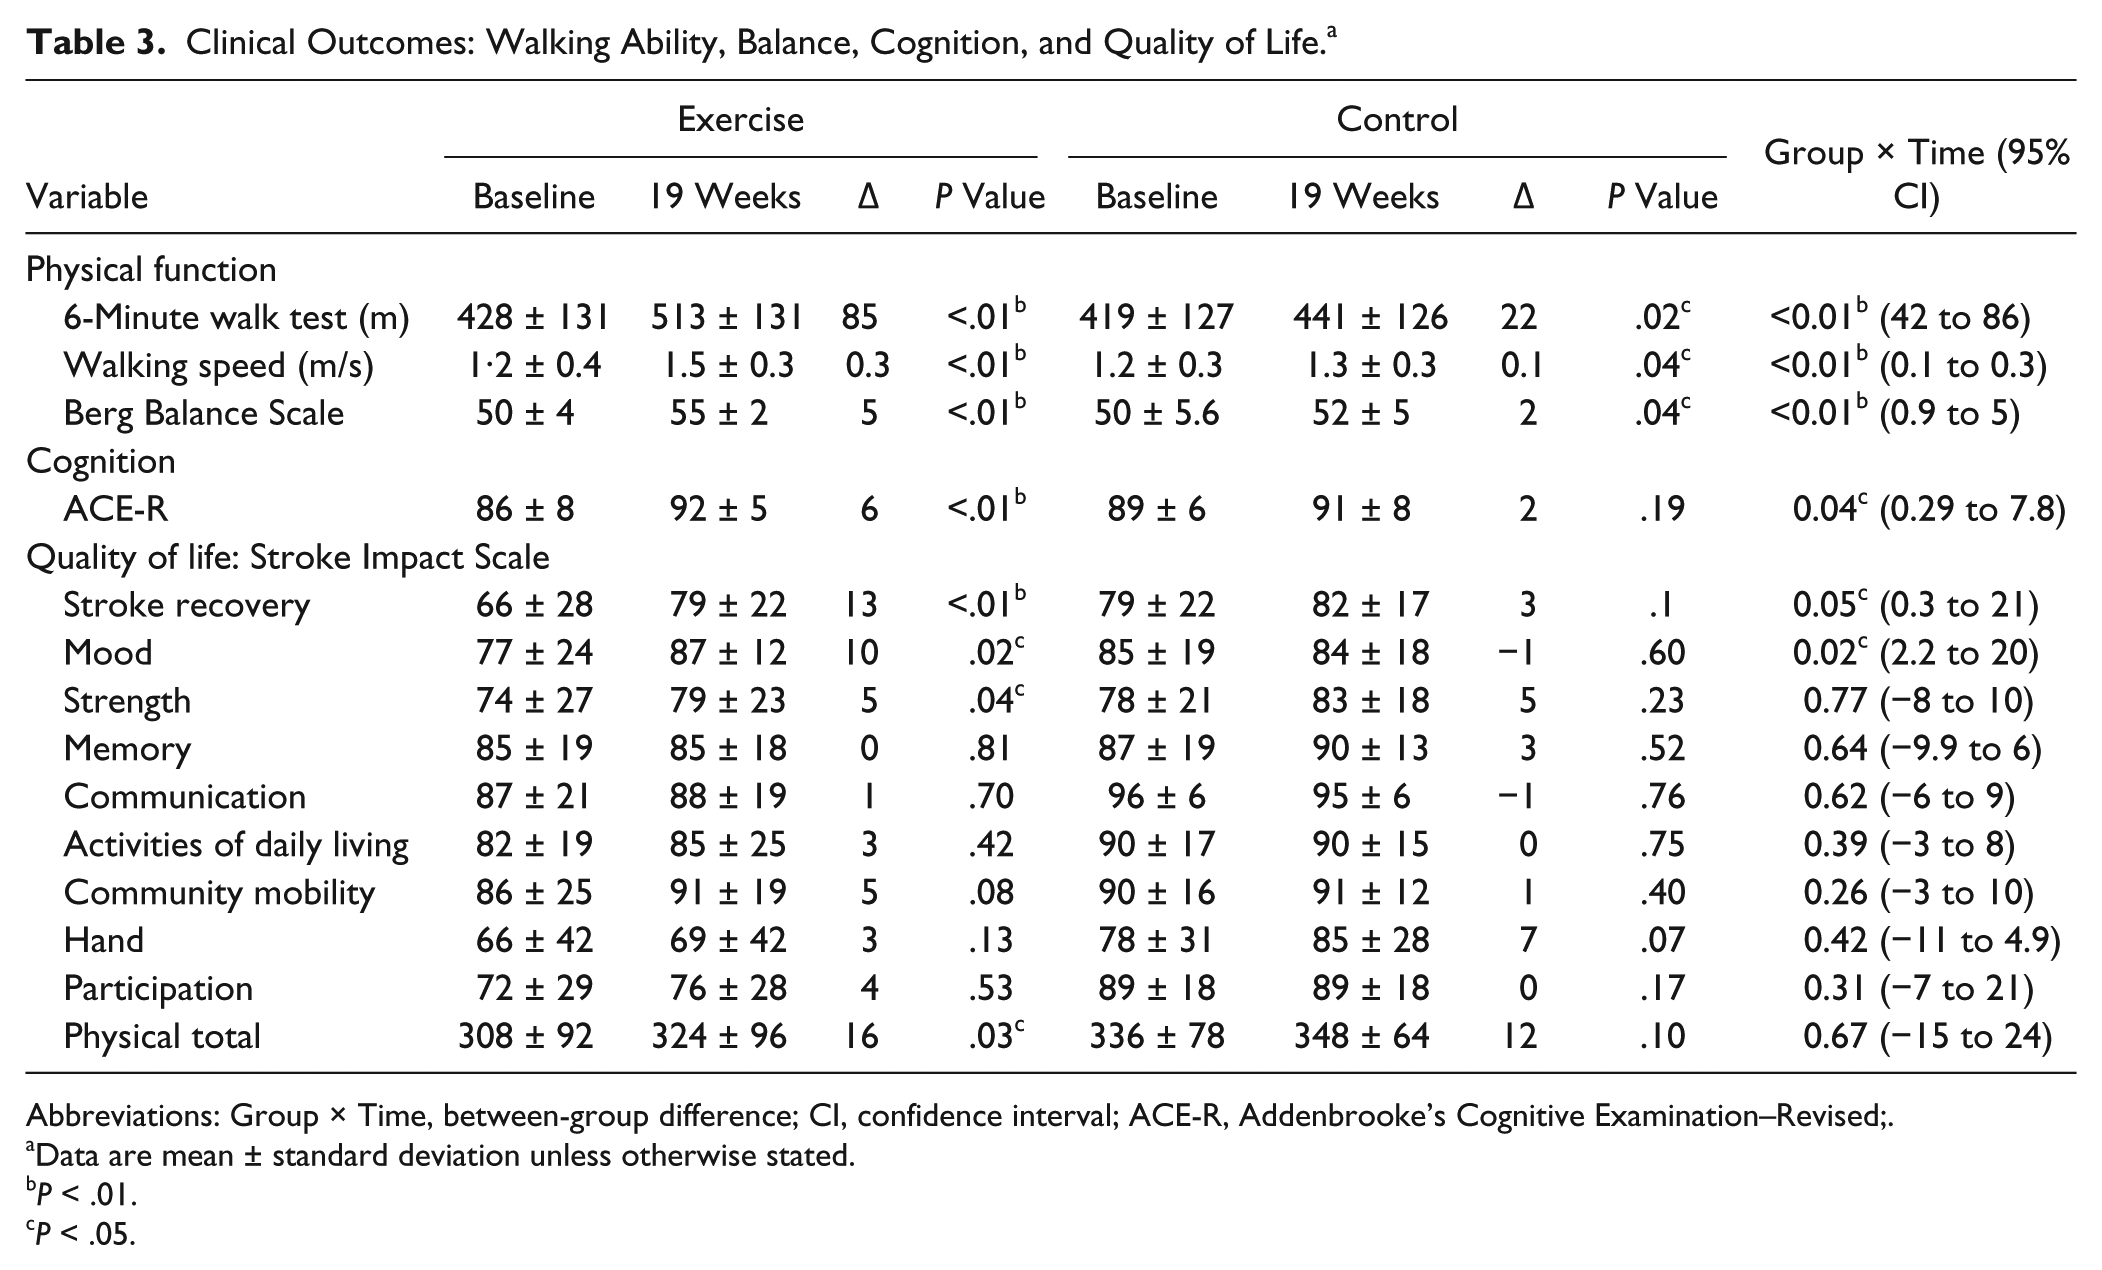
Abbreviations: Group × Time, between-group difference; CI, confidence interval; ACE-R, Addenbrooke’s Cognitive Examination–Revised;.
Data are mean ± standard deviation unless otherwise stated.
P < .01.
P < .05.
Protocol Feasibility
The trial protocol was deemed feasible because all the criteria defined for success were achieved. It was found that 100% (20/20) of the participants in the exercise group completed the intervention undertaking >90% of the outcome assessments and exercise sessions. No serious adverse events or other adverse events were reported over the course of the trial, indicating that interventions were safe and that the exercise protocol was delivered at the right intensity. Participants randomized to the exercise intervention group completed an average of 53 hours out of a possible 57 hours of exercise.
Discussion
This pilot study demonstrated for the first time that community-based exercise therapy is a feasible short-term method of modifying metabolic risk factors and maintaining cerebral tissue volume in the medial temporal lobe, alongside improving physical function, cognition, and some aspects of quality of life, independent of changes in glucose control.
In contrast to our original hypothesis and data published previously by another group, 21 exercise did not have a significant effect on glucose control at a group level. It should be noted, however, that only 23% were defined as having T2DM or IGT following an oral glucose tolerance test in the present group, compared with 50% in the previous study. 21 It is possible that the apparent stability in glucose control following exercise reflects the number of study participants who already had adequate glucose control, rather than a lack of effect of exercise therapy on glucose regulation. Indeed, of the 4 participants with impaired glucose control in the exercise group, 3 made clinically significant changes in glucose control. Independent of glucose control, however, there are significant benefits of structured exercise for people living with stroke, which will now be discussed.
Analysis of the brain imaging data revealed significant atrophy of the medial temporal lobe in the control group over the 19-week study. In comparison, medial temporal lobe tissue structure was maintained, and regional blood flow was increased following exercise. Memory loss and brain atrophy occur with age. 27 Age-related losses in brain volume are, however, not uniform, and interestingly, the medial temporal lobe is one of the areas where significant age-related loss occurs. 43 It is also an area that plays a vital role in cognition. 44 The fact that volume was maintained in this area with exercise and regional blood flow increased as well as the changes in cognition observed may indicate that exercise is a possible means of ameliorating age-related atrophy poststroke and improving long-term cognition. The only other study to observe the effect of exercise on CBF after stroke reported the impact of treadmill training on CBF assessed by transcranial Doppler and noted improvements in vasomotor reactivity. 45 Our findings extend this work by using a quantitative direct measure of CBF with regional analysis. Our results demonstrate promising exercise-related changes in blood flow and cerebral atrophy, and although differences noted were within-group rather than between-group differences, these novel promising findings warrant further exploration in larger, better-powered studies.
Exercise produced significant short-term improvements in cardiorespiratory fitness, lipid profile, and blood pressure. Cardiorespiratory fitness increased by 17% (3 mL/kg/min) following exercise. Although this improvement may appear small, increasing cardiorespiratory fitness by 3 mL/kg/min could potentially enable individuals with stroke to sustain light activities of daily living (requiring approximately 10.5 mL/kg/min) and undertake more vigorous activities such as fast walking/jogging (requiring approximately 21 mL/kg/min). 46
Exercise resulted in a 23% increase (0.3 mmol/L) in HDL-C. A 0.06 mmol/L increase has been linked to a 6% reduction in coronary heart disease, 47 and because 75% of stroke survivors present with cardiac disease, 48 this is a finding worthy of further long-term exploration. Previous stroke studies have demonstrated no change in lipid profile 49 or changes in cholesterol and LDL-C, but not HDL-C, with exercise. 50 Our study is unique in demonstrating that exercise can improve HDL-C poststroke; this improvement may have been a result of the length of the intervention and warrants further investigation.
Exercise reduced diastolic blood pressure by 3 mm Hg, which again could have led to reduction in stroke recurrence because a reduction of diastolic blood pressure of 4 mm Hg has been shown to reduce the relative risk of recurrent stroke by 28%. 51 Only a small number of previous studies have observed the effect of exercise on blood pressure poststroke, with variable findings.50,52 A recent systematic review of lifestyle interventions for secondary stroke prevention demonstrated that lifestyle interventions could potentially reduce blood pressure when combined with medication and medical guidelines. 53 The effect on blood pressure should be further explored in a larger study because blood pressure is the main driver of vascular risk following stroke. 5
Exercise led to clinically significant improvements in both walking speed (0·3 ± 0·14 m/s) and endurance (85 ± 47 m), supporting recent findings. 14 Overall cognition, as measured by the ACE-R, improved with exercise, and this finding was in line with previous interventional studies in healthy individuals. 54 Quality of life also increased in terms of mood and recovery, with promising within-group improvements in physical function and strength. At present, the impact of exercise on quality of life poststroke has yet to be determined, 55 but the few trials that have explored this area demonstrate that exercise can potentially improve quality of life, particularly in terms of mood and physical functioning.56-58
Reviewing all the results, it was encouraging to find significant between-group differences in so many outcomes, given the size and the pilot nature of the study. This highlights the potential positive impact of this type of exercise intervention poststroke.
No participant left the exercise intervention or experienced any adverse events, and participants attended more than 90% of the sessions over the 19 weeks. One of the most commonly reported barriers to exercise poststroke is transport. 59 Although transport was not provided to the intervention and not all participants had access to a car, the high attendance rates indicate that in this instance, travel was not a barrier to adherence. Adherence to an exercise intervention is a key determinant of its success, so these findings are very encouraging.
Our study has some limitations. The groups were not matched for contact time with the research team, meaning that quality of life measures may have improved as a result of socialization rather than exercise. Because the primary outcome of the trial was based on physiological measures and not quality of life, an attention-matched control group was not deemed a primary objective. The decision not to have an attention-matched control group was made to optimize retention because a matched control group with a stretching protocol similar to our own experienced high drop-out rates (>40%). 21 The high drop-out rates could have confounded results, so it was decided that adherence with the intervention was more important than an attention-matched control program. Although the exercise intervention resulted in multiple short-term effects, our sample was relatively small and larger multicenter studies are needed to establish if these changes can be maintained over time and influence stroke recurrence and comorbidities. The cohort was predominantly male. The fact that women have higher prestroke disability, are more likely to live alone or in care, and have worse poststroke function 60 may have led to low female recruitment and have implications for translating research findings for women into clinical care. Finally, the participants were self-selected and only had mild-moderate deficit (median National Institutes of Health Stroke Scale score = 3; range = 0-8), which may limit extension of these findings to people with more severe deficit.
Conclusions/Implications
In conclusion, this randomized controlled pilot trial demonstrates that structured, community-delivered exercise therapy after stroke results in short-term improvements in metabolism, physical function, cognition, and quality of life and promising changes in cerebral atrophy/blood flow, independent of changes in glucose control. The study protocol was deemed feasible, and larger studies should now be conducted exploring the long-term effects of structured exercise on stroke recurrence, cardiovascular health, and disability.
Footnotes
Appendix
Exercise Intervention.
| Component | Description | Duration/Repetitions/Intensity |
|---|---|---|
| Warm-up | • Slow marching | Five minutes/Low intensity |
| • Slow marching with arm swing | ||
| • Knee circle | ||
| • Ankle circles | ||
| Stretching | • Trunk side stretch and rotation | Five minutes/Three stretches on each side |
| • Gastrocnemius | ||
| • Quadriceps | ||
| • Gluteus maximus | ||
| • Hamstring. | ||
| Functional strengthening | • Heel-toe raises | 15 minutes/Start with 2 sets of 5 increase to 3 sets of 10; variable speed |
| • Chair push-ups | ||
| • Sit-to-stand | ||
| • Sit-to-stand and walking around chair | ||
| • Wall push-ups | ||
| • Squat with a gym ball | ||
| Balance | • Forward reach | 15 Minutes |
| • Heel-to-toe standing and walking | ||
| • Walking and change direction | ||
| • Standing on 1 leg | ||
| • Hip flexion, abduction, and extension | ||
| Agility and fitness | • Forward, side, and box step onto a step | 15 Minutes/Start with 5 minutes of exercise gradually increase to 15 minutes/Perceived exertion should be 4-5 out of 10 on Borg scale (fairly light to somewhat hard)/To increase intensity add hand weights, increase the height of the step |
| • Walking forward (if able progress to gentle jogging) | ||
| • Walking backward | ||
| • Side stepping | ||
| • Fast marching | ||
| • Step touch | ||
| • Box step | ||
| • Hamstring curl | ||
| Cool down | • Combination of warm-up and stretches | Five minutes/Low intensity |
Acknowledgements
The authors would like to acknowledge the Research Councils UK Newcastle Centre for Brain Ageing and Vitality; The National Institute for Health Research (Senior Fellowship Award to MIT, Senior Investigator award to GAF); The Medical Research Council (ref: G0802536); National Institute for Health Research (NIHR) Newcastle Biomedical Research Centre for Ageing and Age Related Disease based at Newcastle upon Tyne Hospitals NHS Foundation Trust and Newcastle University; and The NIHR North East Stroke Research Network.
Declaration of Conflicting Interests
The authors declared no potential conflicts of interest with respect to the research, authorship, and/or publication of this article.
Funding
The authors disclosed receipt of the following financial support for the research, authorship, and/or publication of this article: The authors would like to acknowledge the Research Councils UK (RCUK) Newcastle Centre for Brain Ageing and Vitality; The National Institute for Health Research (Senior Fellowship Award to MIT, Senior Investigator award to GAF); The Medical Research Council (ref: G0802536); National Institute for Health Research (NIHR) Newcastle Biomedical Research Centre for Ageing and Age Related Disease based at Newcastle upon Tyne Hospitals NHS Foundation Trust and Newcastle University; The NIHR North East Stroke Research Network. The views expressed are those of the authors and not necessarily those of the RCUK, NHS, the NIHR or the Department of Health. The funders had no role in study design, data collection and analysis, decision to publish, or preparation of the manuscript. SAM, KH, DGJ, AMB, JH, GAF, LR, MIT have no financial interests that may be relevant to the submitted work.