
Abstract
Background. Somatosensory stimulation (SS) is a potential adjuvant to stroke rehabilitation, but the effect on function needs further investigation. Objective. To explore the effect of combining SS with task-specific training (TST) on upper limb function and arm use in chronic stroke survivors and determine underlying mechanisms. Methods. In this double-blinded randomized controlled trial (ISRCTN 05542931), 33 patients (mean 37.7 months poststroke) were block randomized to 2 groups: active or sham SS. They received 12 sessions of 2 hours of SS (active or sham) to all 3 upper limb nerves immediately before 30 minutes of TST. The primary outcome was the Action Research Arm Test (ARAT) score. Secondary outcomes were time to perform the ARAT, Fugl-Meyer Assessment score (FM), Motor Activity Log (MAL), and Goal Attainment Scale (GAS). Underlying mechanisms were explored using transcranial magnetic stimulation stimulus–response curves and intracortical inhibition. Outcomes were assessed at baseline, immediately following the intervention (mean 2 days), and 3 and 6 months (mean 96 and 190 days) after the intervention. Results. The active group (n = 16) demonstrated greater improvement in ARAT score and time immediately postintervention (between-group difference; P < .05), but not at 3- or 6-month follow-ups (P > .2). Within-group improvements were seen for both groups for ARAT and GAS, but for the active group only for FM and MAL (P < .05). Corticospinal excitability did not change. Conclusions. Long-lasting improvements in upper limb function were observed following TST. Additional benefit of SS was seen immediately post treatment, but did not persist and the underlying mechanisms remain unclear.
Keywords
Introduction
Stroke is a leading cause of long-term adult disability. 1 Despite rehabilitation, only 38% of people recover some dexterity by 6 months 2 and the majority have persistent disability. 3 Recovery could be facilitated by adjuvant strategies that facilitate brain plasticity. 4
Somatosensory stimulation (SS) involves low-intensity electrical stimulation of peripheral nerves, inducing paraesthesia without substantial motor output. Corticospinal excitability increases beyond the stimulation period in healthy adults.5-7 In chronic stroke survivors, improvements in pinch strength, 8 functional task performance, 9 and motor training10,11 have been observed after a single session. Several studies have examined the cumulative effect of SS and motor training in chronic stroke.12-14 McDonnell et al 13 found small improvements in hand dexterity, which were not accompanied by changes in corticospinal excitability. This study had a small sample size and a relatively short intervention (9 sessions) which may have limited the effect. Two studies trialed home-based SS with motor training.12,14 Dos Santos-Fontes et al 12 found improvements in function only for the active stimulation group that appeared to persist for at least 4 months, whereas Sullivan et al 14 found no between-group differences. The main difference between the studies lies in the method of SS, as Dos Santos-Fontes et al stimulated the median nerve whereas Sullivan et al used a glove electrode to stimulate the hand. Nerve stimulation may be more effective at priming the motor system than nonspecific hand stimulation. Simultaneously stimulating all of the forearm nerves may further improve the effectiveness of SS.
Our aim was to extend understanding of SS effectiveness in chronic stroke by combining stimulation of all 3 forearm nerves with task-specific training (TST).15-17 We hypothesized that active stimulation would yield greater improvements than sham for functional ability (Action Research Arm Test [ARAT] 18 ), impairment (Fugl-Meyer Assessment Scale [FM] 19 ), and arm use (Motor Activity Log [MAL] 20 ) with associated changes in corticospinal excitability (transcranial magnetic stimulation [TMS]).
Methods
Participants
Thirty-three participants (13 women, mean age 61.5 years, range 24-84 years) with first ever stroke ≥3 months’ duration (average 37.7 months, range 3-130 months) were included (Table 1). Time since stroke and stroke location were determined from medical records when possible (Table 1). In some cases, only limited information regarding stroke location was available. Participants were recruited between July 2010 and 2012 from 5 National Health Service sites, the South London Stroke Register, stroke support groups, and informal networks. All appointments were conducted in a laboratory at King’s College London. Original inclusion criteria were as follows: age >65 years, unilateral upper limb weakness, physically able to participate (including being ambulant and able to negotiate a flight of stairs with assistance), completed upper limb rehabilitation, and the presence of motor-evoked potentials (MEPs) in response to TMS with the muscles at rest or preactivated. 21 Exclusion criteria were as follows: contraindications to TMS such as epilepsy or seizures, cardiac pacemakers or metal implants in the head, severe spasticity (Modified Ashworth Scale 22 ≥4), dysphasia, or cognitive dysfunction sufficient to limit ability to provide informed consent. Because of slow recruitment, the inclusion criteria were amended after ~8 months to include participants 18 to 65 years old, with contraindications to TMS (n = 4, sham) or who declined to have TMS (n = 1, active). Participants who did not undergo TMS completed all other assessments. All participants gave written informed consent and the study was approved by the National Research Ethics committee. The study was registered as a randomized clinical trial (RCT); ISRCTN 05542931.
Participant Characteristics. a
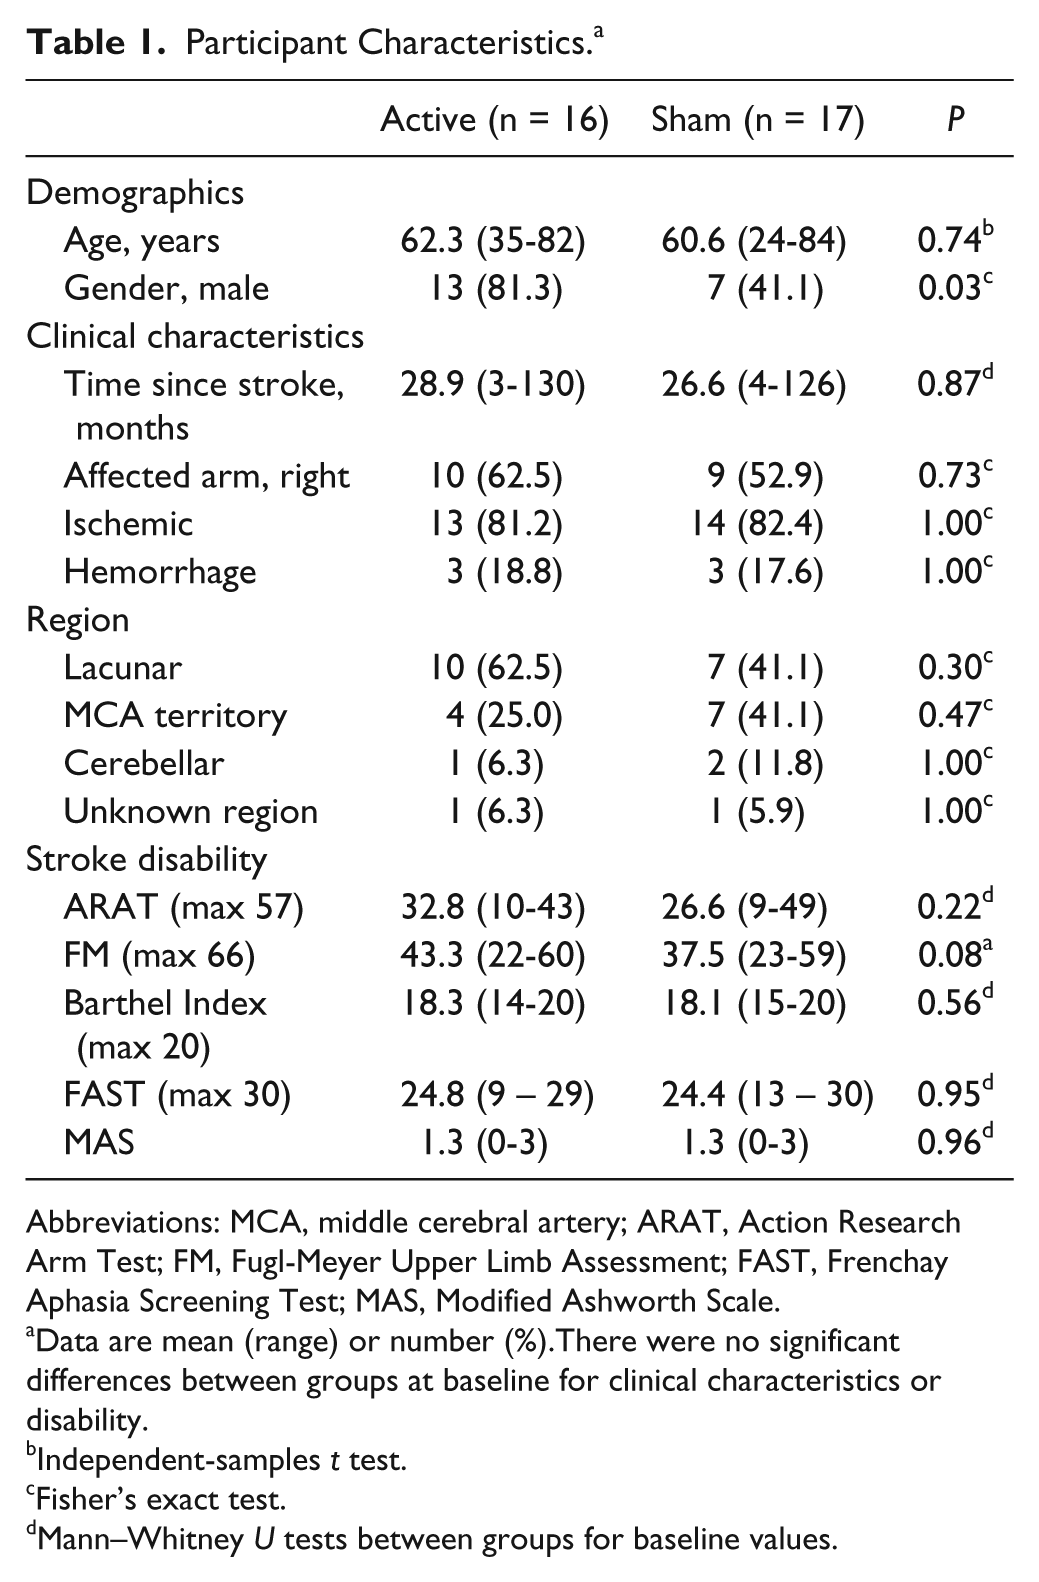
Abbreviations: MCA, middle cerebral artery; ARAT, Action Research Arm Test; FM, Fugl-Meyer Upper Limb Assessment; FAST, Frenchay Aphasia Screening Test; MAS, Modified Ashworth Scale.
Data are mean (range) or number (%).There were no significant differences between groups at baseline for clinical characteristics or disability.
Independent-samples t test.
Fisher’s exact test.
Mann–Whitney U tests between groups for baseline values.
Experimental Design
Randomization
In this double-blinded RCT (Figure 1) block randomisation (up to 6 per group) was performed by the physiotherapist using coin toss. It was necessary to block-randomise to maintain blinding by ensuring that concurrent attendees were in the same group.
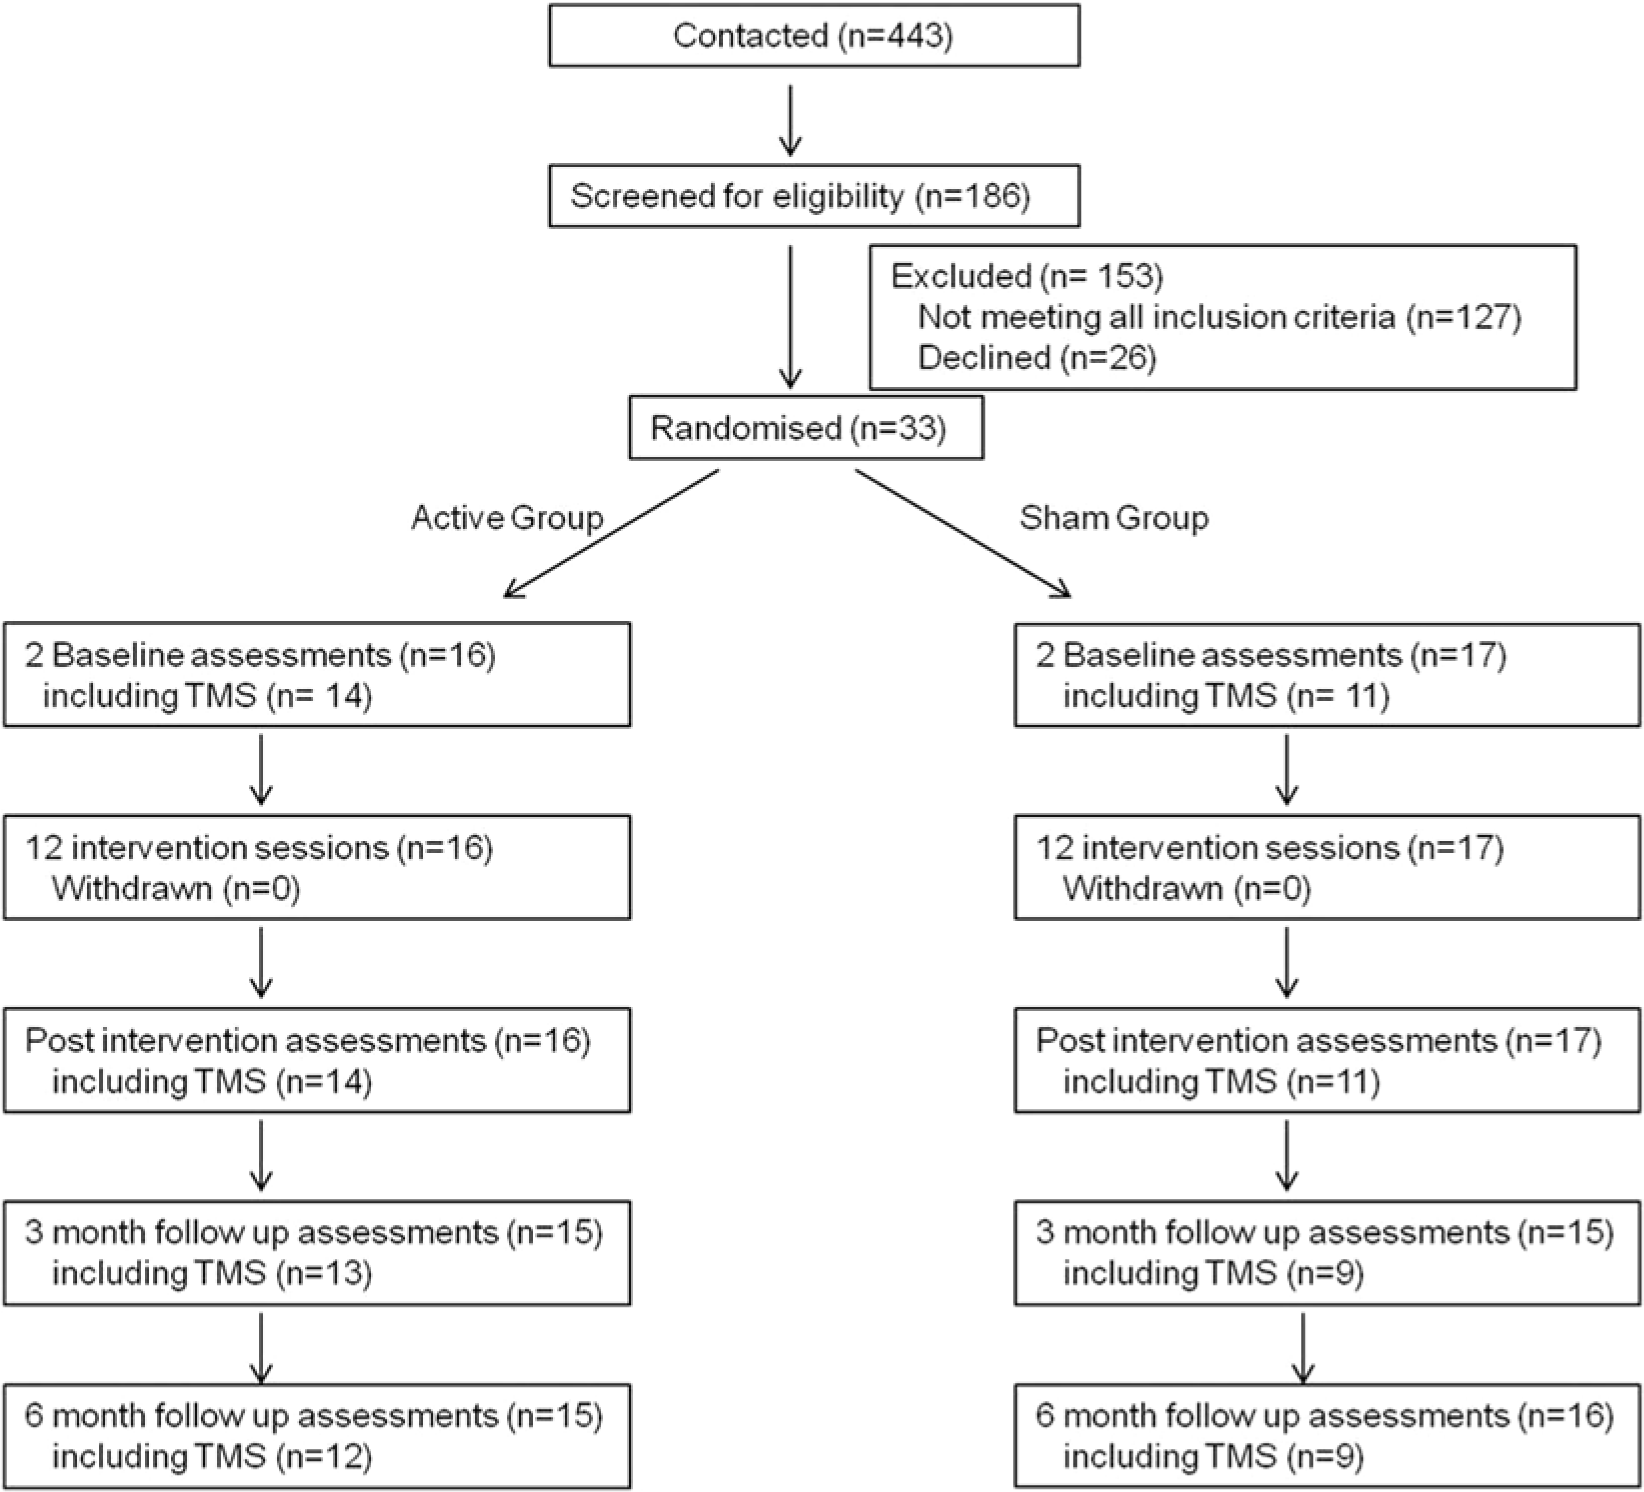
Trial profile.
Intervention
The intervention was delivered three days per week for 12 sessions by a neurophysiotherapist (SFR-L). Each session contained 2 hours of SS (active or sham) immediately prior to 30 minutes of TST.
Somatosensory stimulation
Somatosensory stimulation was applied to all 3 nerves of the affected forearm with 3 pairs of surface electrodes (13 mm Ag/AgCl Biotabs, Unomedical, Deeside, UK). Electrode positions for both groups were (1) median nerve cathode at the cubital fossa perpendicular to the anterior joint line of the elbow, anode at the midpoint of the anterior joint line of the wrist proximal to the carpal tunnel; (2) radial nerve cathode anterior to the lateral epicondyle of the elbow, anode at the lateral border of the radius proximal to the anatomical snuff box; and (3) ulnar nerve cathode at the medial epicondylar groove of the elbow, anode distal to the medial border of the ulna proximal to the pisiform bone.
The stimulator (Electro Muscle Stimulator HX K11, Harox Technologies, Serbia) delivered bursts of 10-Hz stimulation at 50% duty cycle (500 ms on and off). For active stimulation, intensities were set at 3× sensory threshold (assessed for each nerve independently) to induce sensory paraesthesia without overt muscle contraction, and adjusted if required. Both groups could see a flashing light on the stimulator and a voltage indicator. The sham setup used severed connector leads to prevent stimulation. Participants were blinded to group allocation by being told that they might or might not feel the stimulation.
Task-specific training
Both groups received standardized TST sessions one-on-one with the physiotherapist. Sessions were divided into 6 discrete sections of 5 minutes: (1) stretching and warm up, (2) grasp, (3) grip, (4) pinch, (5) gross movements, and (6) participant choice. The core sections (2-5) were based around tasks of the ARAT, practiced in a pseudo-randomized order. For example, section 2 involved practice of a range of reach and grasp functional activities.
Section 1 comprised slow passive sustained stretches of the upper limb held for ~30 seconds and active head/shoulder movements. For the core sections, each task was deconstructed to work on constituent parts as required and whole task facilitation was individually progressed. Movements were progressed from passive, to active-assisted, active movements with verbal prompting and to resisted/complex exercises once repetitive active performance was achieved. Resistance or complexity were increased by additional weights, increased range of movement, closing the eyes or standing to challenge trunk stability. All variations were tailored daily to the individual.
The “participant choice” exercise was chosen based on agreement between the participant and the therapist during the first session. Participants identified a functional activity that was important to them and they found difficult or impossible to perform with their affected upper limb and a goal 23 was agreed. Activities included buttoning a shirt, carrying a cup, writing, self-feeding, and using a light switch. These were diverse, reducing therapy standardization, but reflecting therapy in clinical scenarios and improving relevance. 24
Assessments
Participants underwent 2 baseline assessments, 1 week apart (mean 7.9 days, range 5-20 days), to ensure stability. Postintervention (P) assessments were immediately (P1; mean 2.4 days), 3 months (P2; mean 96 days), and 6 months (P3; mean 190 days) following the intervention. Assessments were conducted by a trained rater (MKF) who was blinded to group allocation.
Clinical assessments included the ARAT 18 and upper limb FM. 19 Self-reported affected arm use was assessed with the MAL. 20 Corticospinal excitability and intracortical inhibition were assessed for each hemisphere using TMS.
Action Research Arm Test
This scores upper limb function from 0 to 57 (high = good function). 18 All tasks were attempted and timed using a stopwatch. Participants were allowed up to 60 seconds for each task and 60 seconds recorded if they were unable to complete. A total score and time (ARATtime) was calculated as well as times for each subsection (grasp, grip, pinch, and gross). Because of the potential for improvements in ARATtime as a result of task familiarization, assessments are limited to testing for between-group changes only.
Motor Activity Log
According to standardized procedures, 20 participants rated how much (amount of use [AOU]) and how well (quality of movement [QUAL]) they used their affected arm for 28 activities of daily living. An average score was calculated for the amount of use (MALAOU) and quality (MALQUAL) scales.
Fugl-Meyer Assessment
The upper limb portion was used as a measure of impairment, scored from 0 to 66 (high score = low impairment). 19
Goal Attainment Scale
This was used in a standard manner25,26 to assess the outcome of the TST “participant choice” activity. Weighted scores were attributed to individual goals according to task completion over the intervention period only.
Transcranial Magnetic Stimulation
Setup
Participants with cerebellar lesions (active n = 1, sham n = 2) were not included. MEPs from ipsilesional (affected) and contralesional primary motor cortices (M1) were elicited using a flat figure-of-eight coil (70 mm diameter) with a pair of Magstim 2002 stimulators connected through a BiStim module (Magstim Company, Whitland, UK). The optimal position for evoking MEPs in the relaxed first dorsal interosseus muscle was established each session and marked directly on the scalp to ensure consistent coil placement.
The resting motor threshold (RMT) was determined for each first dorsal interosseus muscle 27 and a stimulus–response (SR) curve constructed from 10 stimuli at 5 intensities (90%, 100%, 110%, 120%, and 130% RMT) in a random order (Signal 4.07, Cambridge Electronic Design, Cambridge, UK). The intensities used for the first baseline were used for all subsequent sessions. For participants with an RMT ≥100% maximum stimulator output, only contralesional M1 was tested (active n = 3, sham n = 4). For short latency intracortical inhibition (SICI) within each hemisphere, the test stimulus (TS) was set at the intensity that produced an MEP ~50% of the participant’s maximum MEP amplitude, the conditioning stimulus (CS) at 85% RMT and the interstimulus interval (ISI) at 2.5 ms. 28 Ten non-conditioned and 10 conditioned stimuli were delivered in a random order (Signal 4.07).
Motor-Evoked Potential Analysis
Peak-to-peak MEP amplitude (mV) was determined using Signal 4.07 and averaged for each intensity. For SICI, the average conditioned MEP amplitude was expressed as a percentage of the non-conditioned then % inhibition calculated by subtracting from 100 so that positive values indicated inhibition of the test response.
The slope of the linear portion of the SR curve was calculated using a least squares method. Slope values were excluded if the fit resulted in an R2 value <.85 (<2.5% of trials). The laterality index of linear slope was calculated using the following classic formula: (Slopeipsilesional − Slopecontralesional)/(Slopeipsilesional + Slopecontralesional). This yields a value between −1 and +1, where negative values indicate relatively reduced activity of the ipsilesional corticospinal pathway.
Data Analysis
The primary outcome measure was change in ARAT immediately postintervention.
Following confirmation that the 2 baseline values were not statistically different (paired t test or Wilcoxon signed rank tests), the mean was used unless otherwise stated. For between-group comparisons change scores from baseline were calculated for ARAT, FM, MAL, and Global Attainment Scale (GAS). For ARATtime, percentage change from baseline was used. For TMS, the change in laterality index of SR curve linear slope was calculated and positive changes indicate normalizing of the balance in corticospinal excitability. For SICI, the change in percentage inhibition was calculated for each hemisphere. For within-group comparisons absolute scores were used for all assessments.
The number of participants achieving a minimum clinically important difference (MCID) in the ARAT (5.7 points) and MAL (0.5 points) 29 was recorded.
Statistical Analysis
Based on a pilot study, 13 we estimated 34 participants (17 per group) would give 80% power (at 5% level) to detect a 5-point improvement in ARAT at P1.
Per-protocol analysis was used. After Kolmogorov–Smirnov tests, parametric statistics were used for normally distributed data which are presented as mean (standard deviation) unless otherwise specified. Otherwise nonparametric statistics were used and data are presented as median (95% confidence interval) unless otherwise specified. Significance was set at P < .05 or P < .017 for multiple comparisons (Bonferroni correction). The study was designed for the primary outcome measure (change in ARAT at P1) to be tested with 5% significance level and therefore Bonferroni correction was not applied for this comparison.
Between-Group
Independent-samples t tests or Mann–Whitney U tests were used to test for differences between groups at baseline and for the change values at each postintervention time point. Participant demographics were compared between groups using independent-samples t tests (when normally distributed), Mann–Whitney U tests (when not normally distributed), or Fisher’s exact tests (when proportional).
Within-Group
For normally distributed data, one-way repeated-measures analysis of variance (rmANOVA) was conducted for the active and sham groups separately. If a significant effect of time was found post hoc pairwise comparisons were conducted (with Bonferroni correction).
For non-normally distributed data, Friedman tests were used to examine within-group effects across time. If significant, post hoc Wilcoxon signed rank tests were used to test for differences from baseline at each postintervention assessment (with Bonferroni correction).
Minimum Clinically Important Difference Analysis
The proportion of participants reaching the MCID in ARAT (Δ > 5.7) or MAL (Δ > 0.5) was compared across groups using the Fisher exact tests.
Regression Analysis
For the active group, post hoc regression analysis was performed. Potential predictor variables (resting MEP presence, baseline SR slope laterality index, ARAT, FM, MAS, duration of stroke, gender and age) were entered stepwise into multivariate linear regression analysis with change scores for ARAT, FM, and MALAOU at each postintervention time point as dependent variables.
Results
The intervention sessions were well attended (99.7%). Two participants (1 per group) were lost to 3- and 6-month follow-ups (unrelated illness and Botox treatment for preexisting spasticity) and 1 participant (sham group) failed to attend at 3 months because of unrelated illness, but did attend at 6 months. The sample size at each time point is shown in Figure 1. There were no serious adverse effects. Minor ones included dermatitis (n = 11) at the site of the active SS electrodes, which resolved spontaneously (n = 9) or with prescribed steroid cream (n = 2) and mild shoulder pain (sham n = 2, active n = 1). One participant developed short-term nausea and light-headedness during TMS, which was discontinued (remaining in the study without TMS).
The mean sensory threshold for the active group was 0.72 mA (range 0.71-0.74 mA) and the mean stimulation intensity was 2.09 mA (range 2.05-2.15 mA) across all 3 nerves. There were no significant differences between the stimulation intensities used for the 3 nerves (P = .1). Stimulation was well tolerated.
There were no differences between groups at baseline for any assessments unless specified.
Action Research Arm Test
Action Research Arm Test Score
Action Research Arm Test scores were not normally distributed (P = .01). There was a difference between groups immediately postintervention as ARAT score increased to a greater extent for the active group (Δ active 3.5 [1.5 to 8.5]; sham 1.0 [−0.5 to 5.0]; Mann–Whitney U = 76.0, P = .031; Table 2). There were no between-group differences at P2 (U = 93.0, P = .44) or P3 (U = 99.0, P = .42, Table 2).
Change From Baseline.
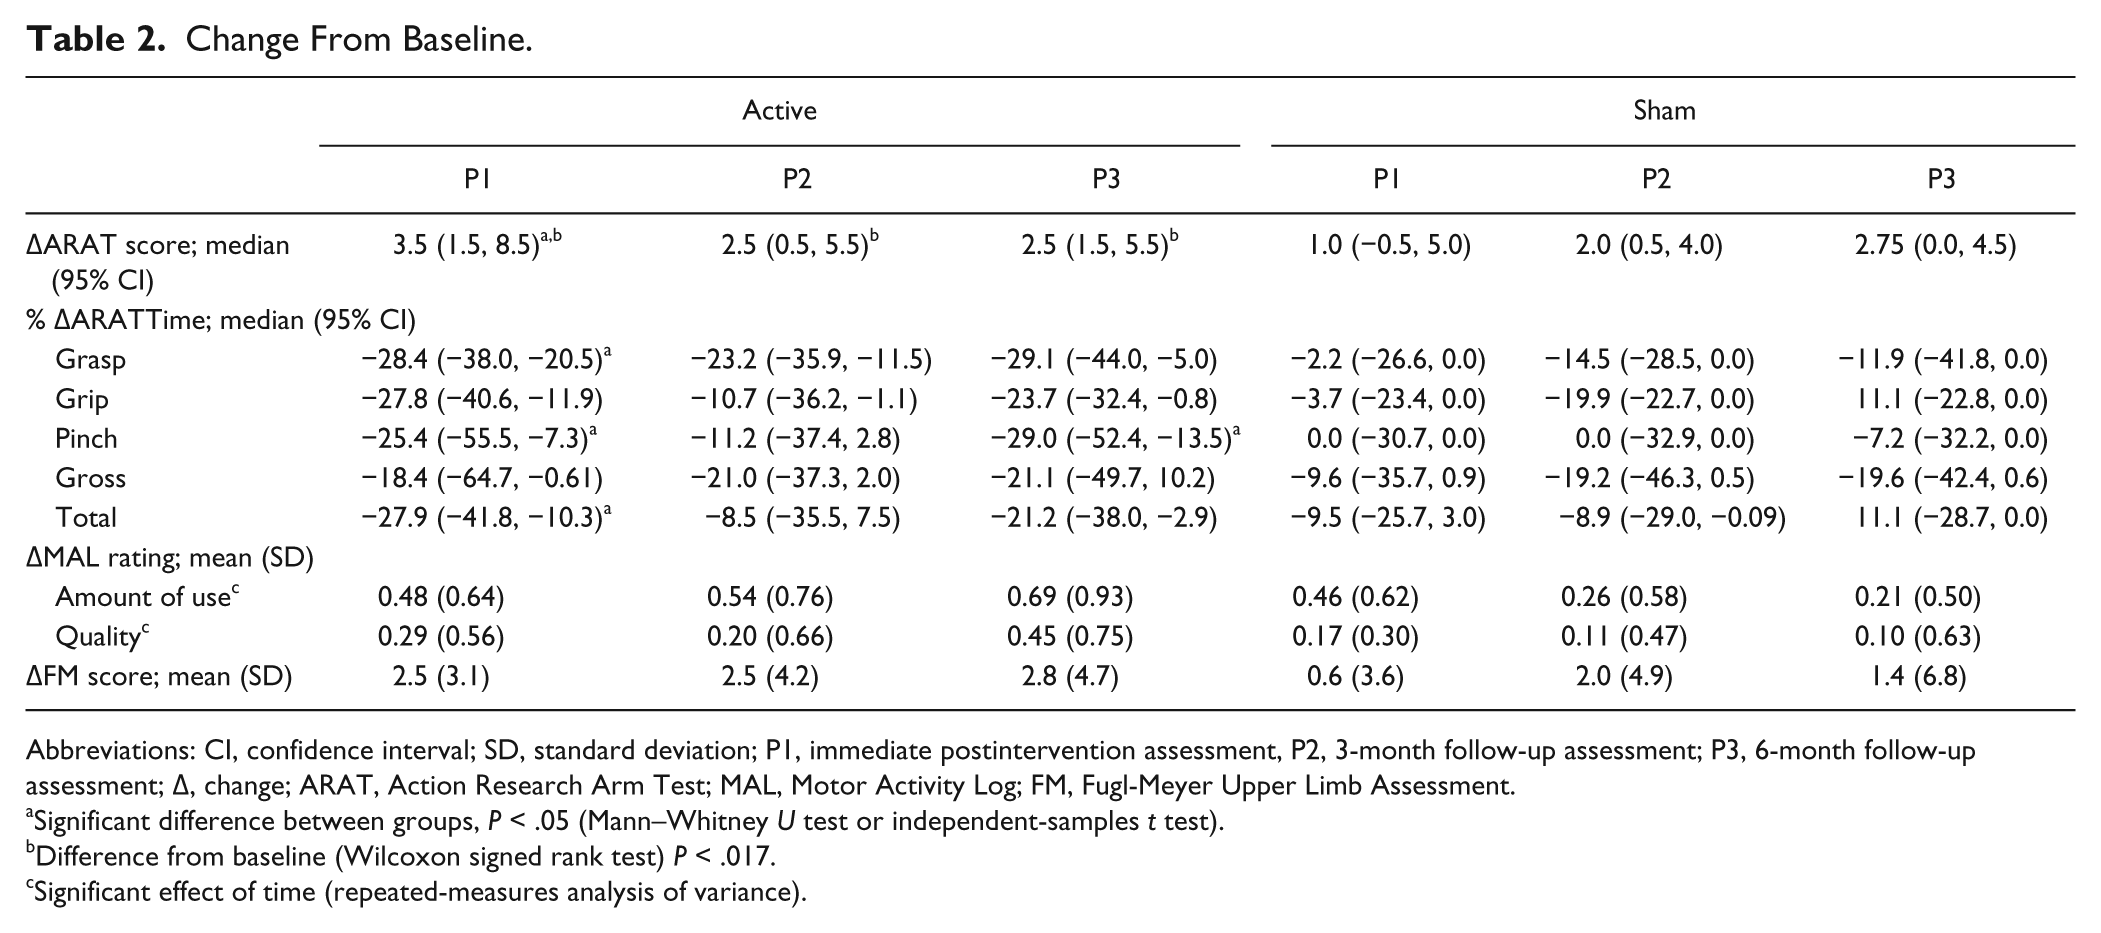
Abbreviations: CI, confidence interval; SD, standard deviation; P1, immediate postintervention assessment, P2, 3-month follow-up assessment; P3, 6-month follow-up assessment; Δ, change; ARAT, Action Research Arm Test; MAL, Motor Activity Log; FM, Fugl-Meyer Upper Limb Assessment.
Significant difference between groups, P < .05 (Mann–Whitney U test or independent-samples t test).
Difference from baseline (Wilcoxon signed rank test) P < .017.
Significant effect of time (repeated-measures analysis of variance).
Friedman tests revealed significant within-group changes for both groups: active χ2(3) = 21.0, P < .001; sham χ2(3) = 9.1, P = .028 (Table 2). Post hoc comparisons showed improvements from baseline for the active group at P1 (Wilcoxon signed rank test Z = 3.30, P = .001), P2 (Z = 2.45, P = .014) and P3 (Z = 2.91, P = .004). There were no significant improvements from baseline for the sham group at P1 (Z = 2.16, P = .031), P2 (Z = 2.22, P = .027), or P3 (Z = 2.33, P = .02).
The number of participants with a change score exceeding MCID was higher in the active group at P1 (5 vs 2) and P2 (3 vs 1). However, Fisher exact tests revealed no significant differences between groups at any time point (P > .2).
ARATtime
ARATtime was not normally distributed (P = .001). There was an improvement between baselines for the active group (B1 = 263.0 [192 to 467.5] seconds, B2 = 192.2 [123.0 to 440.2] seconds, P < .05), so baseline 2 was used to calculate percentage change for both groups. There was no difference between groups at baseline 2 (P = .26).
Only between-group differences were assessed. There was a tendency toward a significant difference between groups for the percentage change in ARATtime at P1 (Mann–Whitney U = 76.0, P = .017) with a tendency for greater reduction for the active group (Δ active −27.9% [−41.8% to −10.3%], sham −9.5% [−25.7% to 0.2%]; Table 2). There were no differences at P2 or P3 (P > .2).
For the ARAT subcomponents there was a tendency toward a difference between groups for the percentage change in ARATtime for grasp at P1 (U = 200.5, P = .019) with the active group showing greater reduction (Table 2).
Motor Activity Log
Amount of Use
Ratings were normally distributed (P = .2). There were no differences between groups in the change in MALAOU at any assessment: independent-samples t test P1 t(31) = 0.07, P = .946; P2 t(28) = 1.14, P = .264; P3 t(29) = 1.82, P = .079 (Table 2).
The rmANOVA for the active group revealed a significant effect of time (F1.6,22.4 = 6.54, P = .009). Post hoc pairwise comparisons indicated an increase in rating from baseline for P1 (P = .015), P2 (P = .015), and P3 (P = .012). The rmANOVA for the sham group revealed no significant effect of time (F1.9,26.1 = 2.87, P = .078).
The number of participants with a change score exceeding MCID was higher in the active group across all assessments (P1 7 vs 6, P2 8 vs 4, P3 9 vs 4). However, Fisher exact tests revealed no significant differences between groups at any time point (P1 P = .728, P2 P = .264, P3 P = .073).
Quality
Ratings were normally distributed (P = .2). There were no differences between groups in the change in MALQUAL at any assessment: independent-samples t test P1 t(23.1) = 0.73, P = .474; P2 t(27) = 0.41, P = .688; P3 t(28) = 1.41, P = .170 (Table 2).
The rmANOVA for the active group revealed a significant effect of time (F1.7,23.8 = 3.82, P = .042). Post hoc pairwise comparisons indicated no significant changes in rating from baseline (P1 P = .061, P2 P = .272, P3 P = .033). The rmANOVA for the sham group revealed no significant effect of time (F3.0,39.0 = 0.596, P = .571).
Fugl-Meyer Assessment
Fugl-Meyer Assessment scores were normally distributed (P = .09). There were no differences between groups for the change at any assessment: independent-samples t test P1 t(131) = 1.67, P = .104; P2 t(28) = 0.32, P = .750; P3 t(29) = 0.677, P = .504 (Table 2).
The rmANOVA for the active group revealed a significant effect of time (F3.0,42.0 = 3.74, P = .018). Post hoc pairwise comparisons indicated a significant increase in rating from baseline for P1 (P = .006) but not P2 (P = .035) or P3 (P = .036). The rmANOVA for the sham group revealed no significant effect of time (F1.7,23.2 = 1.0, P = .369).
Goal Attainment Scale
Goal Attainment Scale scores were not normally distributed (P < .001). There was a tendency for the change to be greater for the active group (Δ active 20.0 [10.0 to 32.1], sham 10.0 [0.0 to 20.0]; Mann–Whitney U = 37.5, P = .07). Wilcoxon signed rank tests indicated that the within-group increase was significant for both groups (active Z = 2.68, P = .007; sham Z = 2.83, P = .005).
Transcranial Magnetic Stimulation
Resting Motor Threshold
Resting motor threshold was normally distributed for ipsilesional M1 (P = .055) but not contralesional (P = .026), so nonparametric statistics were used for both hemispheres. Ipsilesional M1 had a higher RMT than contralesional for both groups (ipsilesional active 69 [49 to 96], sham 77.5 [56.5 to 100]; contralesional active 50.25 (45 to 67.5), sham 57 (44 to 69); Wilcoxon signed rank test active Z = −2.67, P = .008; sham Z = −2.60, P = .009). There were no between-group differences at any postintervention time point (all Ps >.2) and no within-group effects for either hemisphere (all Ps >.4).
Laterality Index of Stimulus–Response Curve Linear Slope
Laterality indices were not normally distributed (P = .008). Baseline laterality index was −0.64 [−0.98 to −0.34] for active and −0.88 [−1.0 to −0.17] for sham. There were no differences between groups for the change in laterality index at any postintervention time point (P1 Mann–Whitney U = 33.0, P = .076; P2 U = 42.5, P = .603, P3 U = 50.0, P = .603; Figure 2A) and no within-group effects: active χ2(3) = 3.8, P = .284; sham χ2(3) = 1.2, P = .753.
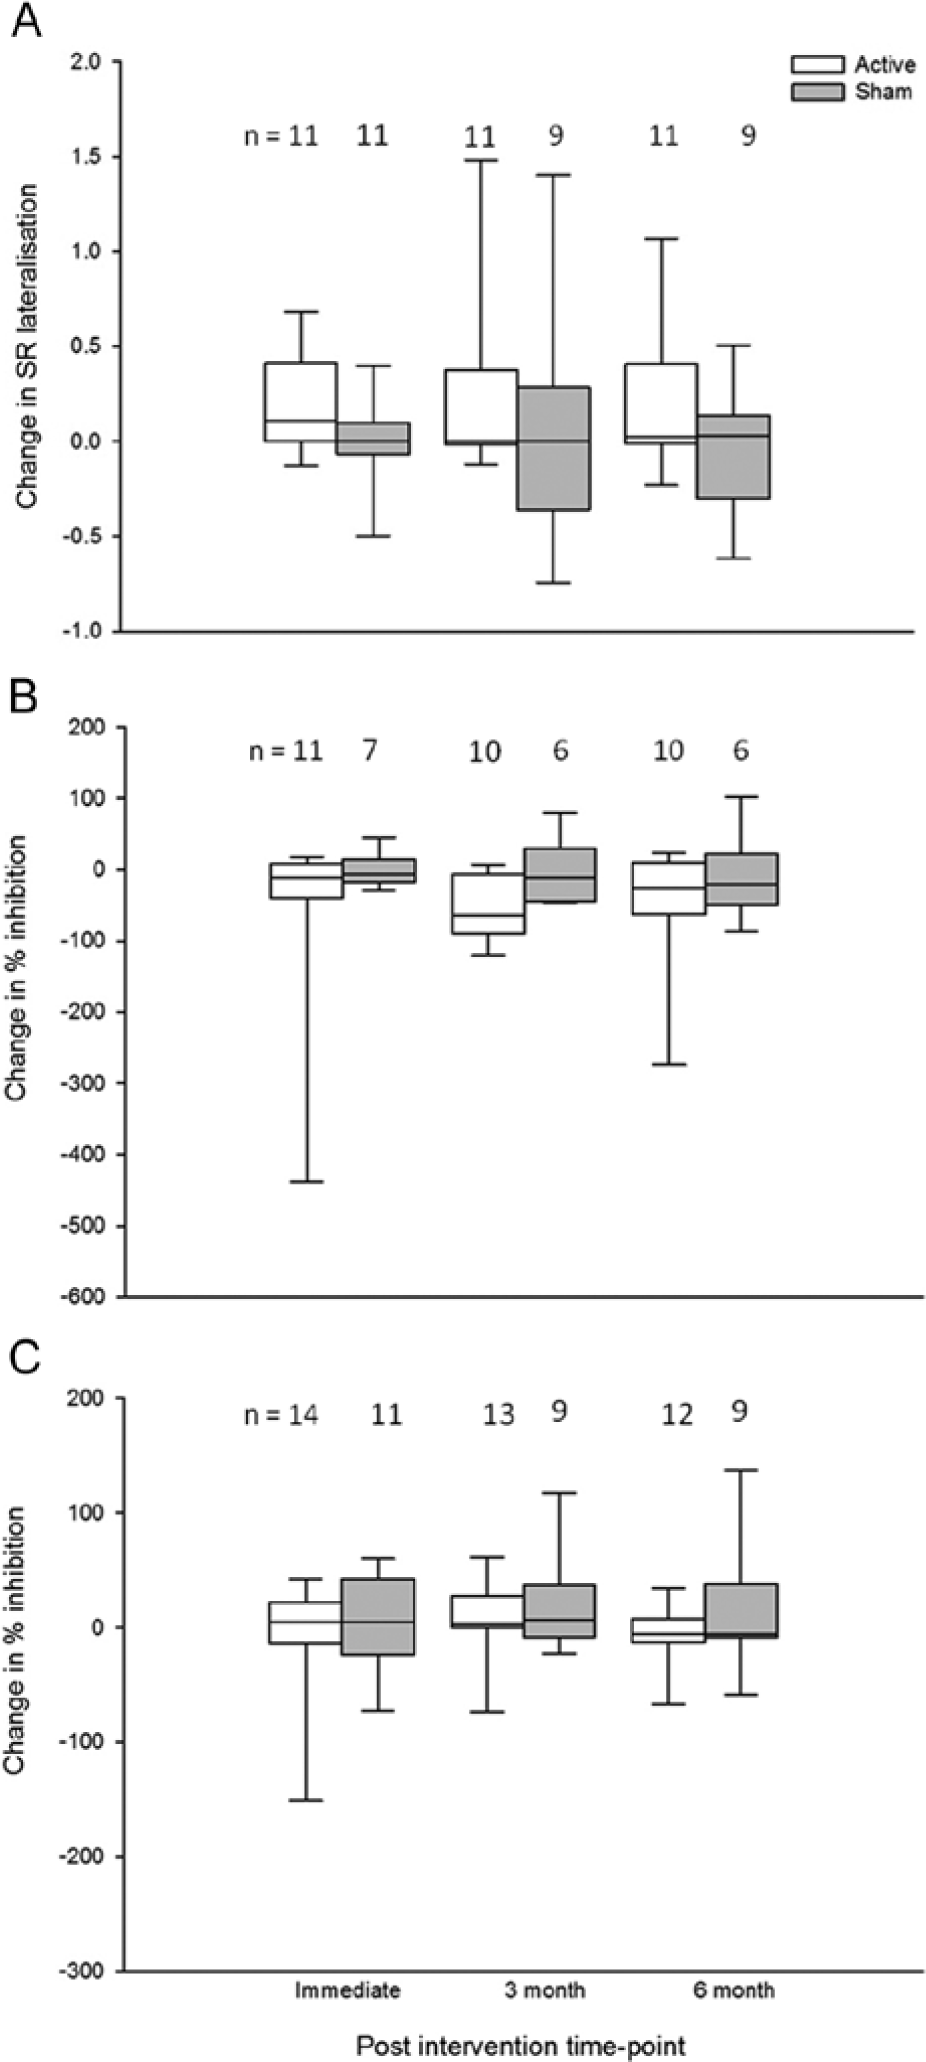
Box-and-whisker plot showing change in transcranial magnetic stimulation (TMS) measures (with outliers removed). (A) Stimulus–response (SR) curve lateralization index. Positive changes indicate improved balance in excitability between hemispheres. (B) Percentage inhibition of ipsilesional primary motor cortex (M1). Negative values indicate reduction in short latency intracortical inhibition (SICI). There was a significant within-group effect of time for the active group and SICI was lower at P2 than baseline (P = .013). (C) Percentage inhibition of contralesional M1. Positive values indicate increased SICI. n = sample size for each group at each time point.
Short Latency Intracortical Inhibition
The percentage inhibition was normally distributed for ipsilesional hemisphere (P = .2) but not contralesional (P = .018), so nonparametric statistics were used for both.
Ipsilesional hemisphere
There was a significant increase in percentage inhibition between baselines for the active group (B1 = 12.4% [−10.0% to 66.1%], B2 = 40.5% (13.7% to 77.3%); P < .021), so baseline 2 was used. There was no difference between groups at baseline 2 (Mann–Whitney U = 43.0, P = .724).
There were no significant between-group differences for the change in percentage inhibition at P1 (U = 53, P = .211), P2 (U = 48, P = .056), or P3 (U = 33, P = .792).
Friedman tests indicated a significant within-group effect for active, χ2(3) = 8.0, P = .045, but not sham, χ2(3) = 2.0, P = .564. Post hoc comparisons for the active group showed that percentage inhibition was significantly reduced at P2 compared with baseline (Wilcoxon signed rank test Z = −2.5, P = .013) but not at P1 (Z = −1.69, P = .091) or P3 (Z = −1.78, P = .074). However, at P2 it was noted that 6 participants (of 10) in the active group showed facilitation of the test response, rather than inhibition.
Contralesional hemisphere
There were no differences between groups in the change in percentage inhibition at any assessment (P > .3, Figure 2C) and no within-group effects (P > .08).
Regression Analysis
Baseline FM predicted 30% of the variability in change in ARAT score at P1 (F1,11 = 5.8, P < .05). There were no other significant predictors of change in ARAT, FM, or MALAOU following SS.
Discussion
Four weeks of combined SS and TST induced short-term improvements in ARAT that were greater than after TST alone. Despite the intensive nature of the study, adherence, and follow-up rates were good. Both groups achieved their goals but only the active group showed increased self-reported amount of paretic arm use. However, these functional changes were not accompanied by significant modulations of corticospinal excitability.
Functional Improvements
Somatosensory stimulation combined with TST elicited greater improvements in function immediately postintervention than TST alone. However, this was a short-term effect with differences between groups not persisting at 3 or 6 months. The study was powered to detect a 5-point change in ARAT immediately postintervention based on the information available when the study commenced 13 and adherence to the intervention was good. However, the anticipated effect may have been optimistic and as such post hoc power calculations indicated that the power was lower than expected at all time points (P1 = 65%, P2 = 16%, P3 = 20%). Despite this, the between-group difference at P1 was significant; however, conclusions about the persistence of this effect should be drawn cautiously.
Goal Attainment Scale scores improved for both groups over the intervention period suggesting that TST helped the participants to achieve their goals. There was also a within-group effect of time on ARAT score for both groups and for the active group only for FM and MALAOU, suggesting that TST was effective. With Bonferroni correction the improvements from baseline for ARAT were only significant for the active group, strengthening the conclusion that SS enables greater benefits from TST.
Previous studies12-14 have found mixed results with regard to SS specific changes in arm function. McDonnell et al 13 found no between-group differences in ARAT change after motor point stimulation and TST. It may be that stimulation of all three forearm nerves in our study provided sufficient extra input for a difference in ARAT, at least transiently. However, Dos Santos-Fontes et al 12 did find between-group differences in Jebsen Taylor Test (JTT) 30 performance in a home-based study involving daily SS of the median nerve with training. They had more frequent sessions, suggesting that SS dosage might be a significant factor needing further investigation. Additionally, impairment severity was less for the study by Dos Santos-Fontes et al 12 (FM range 48-64) compared with this study (22-61). In our study, baseline FM predicted 30% of the variability in change in ARAT following combined SS and TST, suggesting that SS may be more effective for those who can actively use the upper limb for motor practice. However, baseline ARAT was not a significant predictor and further investigation into the factors that affect response to SS is needed. There was a significant imbalance in gender distribution across our groups, with more male participants in the active group, which could potentially influence findings. However, gender was not found to be a significant predictor of response to SS.
By recording the time taken to perform each ARAT task we attempted to capture any subtle improvements, particularly in the middle range where participants scored 2 out of 3 for most tasks. Because of the potential for improvements in ARATtime as a result of task familiarization, only between-group changes were considered. Consistent with ARAT score, the active group demonstrated a tendency toward a greater improvement in total time immediately postintervention compared with sham, indicating that SS facilitated faster movement as well as overall score. This supports previous findings of improved time to perform tasks of the JTT following SS and training. 12 Future work is needed to examine the validity and reliability of ARAT time measurement and to compare it with other time-based functional tests, for example, JTT 30 or Wolf Motor Function Test. 31
Neurophysiological Mechanisms
The median laterality index was negative at baseline, demonstrating an imbalance in corticospinal excitability with relative under- and overexcitability of the ipsilesional and contralesional motor cortices respectively. This has been demonstrated in this population previously. 32 There were no between- or within-group changes for the lateralisation of M1 excitability, so SS and TST were not associated with changes in cortical excitability. This is consistent with previous work 13 and post hoc power calculations indicate that we were adequately powered at the immediate postintervention assessment (91%), although not at the longer-term follow-ups (power <30%). SS may improve function through mechanisms not assessed here, such as changes in motor programming. The lack of change in corticospinal excitability could also potentially explain why the magnitude of ARAT improvement was less than we were expecting 13 and why it did not persist.
Inhibition (SICI) within the ipsilesional hemisphere was reduced 3 months following active SS compared with baseline. A decrease in SICI following a single session of SS has been shown, 10 but to our knowledge, this is the first study to demonstrate a longer-term effect following repeated SS and TST sessions. However, this must be interpreted with caution as there were no significant between-group differences in the change in percentage inhibition and many of the participants demonstrated facilitation of the test response rather than inhibition at this time-point. Since we did not optimize the conditioning parameters for each participant it is possible that we were not specifically targeting the intracortical network. However, it is difficult to understand why this would be the case at P2 only. Further investigation is required with a larger sample before conclusions can be drawn.
Conclusions
Somatosensory stimulation combined with TST induces short-term improvements in function, as measured by ARAT, compared with TST alone. However, the mechanisms underlying the effect of SS remain unknown.
Footnotes
Acknowledgements
We are grateful to the participants for their enthusiastic involvement and to everyone who assisted with recruitment, particularly at the South London Stroke Register and the Stroke Research Network. Thank you to Dr McDonnell, University of Adelaide, for generously sharing pilot data for designing the study, Tony Christopher and Lindsey Marjoram for technical support and Professor Toby Prevost and Dr Kun Liu for statistical advice.
Authors’ Note
Melanie K. Fleming and Isaac O. Sorinola contributed equally to the study. The funders had no role in study design, data collection and analysis, decision to publish, or preparation of the article.
Declaration of Conflicting Interests
The author(s) declared no potential conflicts of interest with respect to the research, authorship, and/or publication of this article.
Funding
The author(s) disclosed receipt of the following financial support for the research, authorship, and/or publication of this article: The study was financially supported by the Dunhill Medical Trust (grant number R102/0209) and the South London Clinical Local Research Network. CDW and IW acknowledge financial support from the Department of Health through the National Institute for Health Research (NIHR) Biomedical Research Centre award to Guy’s and St Thomas’ NHS Foundation Trust in partnership with King’s College London and King’s College Hospital NHS Foundation Trust.