
Abstract
Background. Fatigue is a chronic symptom for people with multiple sclerosis (PwMS). Objective. Symptoms of fatigue were investigated during and following a single exercise session. Methods. In all, 58 PwMS and 15 healthy, low-active controls performed a cycle ergometer incremental exercise test to voluntary exhaustion. Physiological intensity (expired air and heart rate), perceived breathlessness, and leg fatigue (Rating of Perceived Exertion [RPE] CR-10 Scale) were measured during and for 10 minutes following exercise. Measures of baseline disability (Barthel Index), activity (Physical Activity Scale for the Elderly), vitality (Subjective Vitality Scale), and general fatigue (Fatigue Severity Scale [FSS]) were recorded. Results. PwMS had reduced exercise capacity (P = .00 to .01), but sensations of breathlessness and leg fatigue were the same at voluntary exercise termination in both groups (P = .09). PwMS with fatigue (FSS ≥ 4) exhibited reduced exercise capacity (P = .03 to .05) but reached the same physiological intensity, breathlessness, and leg fatigue symptoms at test termination as nonfatigued peers (P = .16 to .59). During recovery, there was no difference in observed means between groups, except for leg RPE, which was higher in the MS group (P = .047) and higher at 3 and 5 minutes after exercise in the fatigued MS group (P = .02). Physiological markers and breathlessness recovered at the same rate in both groups (P = .33 to .67). Conclusion. Monitoring leg fatigue symptoms during and through recovery from physical activities may help guide participation in physical activities for PwMS, particularly in people managing high levels of fatigue.
Introduction
Participation in short-term moderate physical activity (PA) has been shown to benefit mobility, isometric muscle strength, physical fitness, and mood in people with multiple sclerosis (PwMS). 1 However, activity levels remain low, and PwMS report low levels of energy and overwhelming feelings of fatigue as a major barrier to participation in PA. Fatigue is a pervasive and disabling symptom,2,3 reported to affect mobility and participation in work, and social activities in the majority of PwMS. 4 The underlying mechanism causing fatigue in MS is a complex phenomenon, with both central and peripheral components implicated.3,5-9 Fatigue symptoms can be both physical and cognitive and include feelings of exhaustion, a lack of energy, low motivation, and physical tiredness.10,11
Fatigue symptoms are also acutely experienced during and following PA. 12 These symptoms can be described as perceived exertional symptoms and, typically, are dominated by physical symptoms of breathlessness and muscle fatigue. 12 It is well known that these symptoms increase with exercise intensity. 13 PA is defined as bodily movement caused by skeletal muscle contraction that results in quantifiable energy expenditure, with the exercise intensity being proportional to the amount of energy being expended. 14 The intensity determines the type of fuel used and the physiological response during and after exercise. 15 Exercise intensity correlates with how hard the activity is perceived to be and how long an individual takes to recover. 12 In healthy individuals, the peak performance during exercise is constrained by subjective symptoms arising from muscles, joints, and the cardiorespiratory system.13,16,17 Individuals choose to terminate exercise at the point when exercise symptoms can no longer be tolerated, with respiratory distress and leg fatigue described as the limiting exertional symptoms during cycling in healthy individuals and people with clinical conditions.13,18-20
During incremental cycling exercise, PwMS have been shown to report levels of overall perceived exertion that are similar to that of healthy controls when exercise intensity is relative to peak performance. 21 However, overall perceived exertion as measured in previous studies does not distinguish between breathlessness and muscle fatigue symptoms. Considering the importance of muscle fatigue in this group, 3 a differentiated response, exploring both breathlessness and leg fatigue, should be explored. In interviews, PwMS have reported feelings of physical fatigue following exercise.16,17,22 This fatigue response has not been quantified or reported empirically, but PwMS describe feelings of fatigue (aching and heaviness) in working muscle groups during PA that take both time and rest to recover.11,17,22,23 The relationship between exertional response and recovery from exercise and chronic fatigue has not been explored. Both moderate-intensity exercise and high-intensity, low-volume strength training have been shown to improve symptoms of chronic fatigue in MS.24-26 However, high-intensity exercise (>90% of maximal heart rate [HR]) produced greater improvements in mobility and function in some PwMS than lower-intensity exercise, but the higher exercise intensity was less well tolerated, with some individuals reporting reduced well-being and failing to complete the 12-week program. 27 Considering that subjective symptoms and the consequent enjoyment of exercising have been shown to affect adherence to exercise programs,28-31 these studies collectively support the need to explore the subjective recovery from exercise in PwMS and its relationship to chronic fatigue.
The impairments and pathology of MS may affect the symptomatic response to exercise and recovery. 32 For example, PwMS are observed to have reduced movement efficiency, 33 reduced exercise capacity, 34 an altered (not reducing) corticospinal output during fatiguing muscular activity, 35 altered functional corticomuscular coherence, 8 higher levels of cortical activation for a given muscle force output, 36 reduced strength and power, 37 higher levels of muscle fatigability, 3 and reduced muscle oxidative capacity. 38 These underlying pathologies may be contributing to symptoms of limb muscle fatigue during and following exercise. PwMS have greater activation of the cortex (contralateral primary motor cortex, insula, and cingulate gyrus during simple motor tasks) than controls. 31 Fatigued individuals also have greater activation of the cortex and motor-attentional network when performing a simple motor task,31,39 an increased motor-evoked potential amplitude after fatiguing exercise suggesting failure to inhibit intracortical circuits,6,7 and a delayed post-exercise normalization of the motor threshold. 31 Recent work exploring mechanisms of muscle fatigue in PwMS has linked decreased intracortical inhibition with increased cortical activation at low force outputs and this, in turn, to higher within-exercise fatigue symptoms. 9 When PwMS attempt to exercise at higher intensities or force outputs, unlike healthy individuals, brain activation is not further increased as intensity increases.36,39 Thus, during sustained high-intensity exercise in PwMS, changes in voluntary activation are not sufficiently compensated by increased cortical activation. 9 These altered neurophysiological responses together may affect recovery of muscle fatigue symptoms. Considering this, we hypothesize that as individuals exercise at an increasing intensity, they will be limited by leg fatigue symptoms. In addition, because deficits in central drive are related to an amplified effort sense, 32 we further hypothesize that the delayed cortical recovery observed in PwMS following exercise will result in a delayed recovery of symptoms of leg fatigue, which will be observable following high-intensity exercise.
Methods and Materials
After obtaining National Health Service (NHS) ethical approval (08/H0604/3), people with MS were recruited from the Thames Valley, UK. Prior to participation, individuals gave informed consent in accordance with the Declaration of Helsinki. Candidates for the study were people with a diagnosis of MS, confirmed by a neurologist, and older than 18 years. To provide a sample representative of individuals participating in exercise, participants with a range of ability and disability levels were identified through local neurologists and from individuals attending local MS society events. People were not admitted to the study if any of the following criteria were present: (1) a medical condition or complication that would preclude safe participation in exercise, as indicated by the referring neurologist or their general practitioner; (2) inability to walk for 2 minutes, with walking aid as necessary; (3) inability to sit on a cycle ergometer and complete 60 s of unloaded exercise; (4) a relapse or sudden change in MS symptoms within the previous 2 weeks; (5) a condition affecting the central nervous system other than MS; or (6) insufficient mental capacity to consent. A healthy control group recruited from an advert for low-active healthy participants (n = 15) aged 30 to 60 years, free from any injury or other condition or symptoms that would limit exercise performance, and with no known reason precluding safe participation in exercise (from the PAR-Q 40 and self-reported declarations), also participated in the study. On entry to the study, low PA (achieving less than the UK government recommendation of 5 × 30 minutes of moderate PA) 41 was confirmed and measured using the Physical Activity Scale for the Elderly (PASE), a self-reported activity questionnaire. 42
Prior to testing sessions, all participants were asked to refrain from the consumption of alcohol, cigarettes, food, and caffeine and to avoid exercise for a period of 3 hours. They were also screened for suitability to take part in testing using the PAR-Q readiness to safely participate in exercise questionnaire 43 and blood pressure (BP) measurement.
All assessments were carried out in the Movement Science University Laboratory, Oxford Brookes University, between 9.30
Each participant received a full description of the exercise test procedure and was familiarized with Borg’s Rating of Perceived Exertion (RPE) CR-10 Scale (0-10) using a set standard text. 20 Individuals received descriptions of the changes that they could expect to their breathing and the likely sensations they would expect to feel in their legs as exercising progressed. To standardize the procedure, participants were instructed in the use of the numerical and verbal anchors of the CR-10 Scale and to report differential ratings of exertion in breathing and leg fatigue sensations using a standard text. 20 The text offers likely rating scenarios and emphasizes that the only correct response is how an individual reports.
In all participants, a stepwise incremental exercise assessment was then conducted on a cycle ergometer (Ergomedic 874E, Monark Exercise AB, Vansbro, Sweden). Saddle heights were adjusted to accommodate partial flexion of the knee between 170° and 175°. Feet were firmly supported in the pedals by toe clips, straps, and taping where necessary to ensure that both feet remained secure in the pedals and that the heel was held away from the pedal crank. Oxygen consumption and carbon dioxide production were measured by collecting expired air via a face mask (Hans Rudolf, Kansas City, MO) connected to a breath-by-breath gas analyzer (Metamax 3B, Cortex Biophysik GmbH, Leipzig, Germany). The gas analysis system was calibrated according to manufacturer’s instructions with known concentrations of oxygen and carbon dioxide (~15% O2 and ~5% CO2, balance N). Breath-by-breath measures of gas concentrations and volumes were digitally stored on a personal computer. HR was recorded from a chest monitor (Polar Electro, Kempele, Finland). A continuous, multistage graded exercise test was used for all participants. The assessment started with 2 minutes unloaded cycling at the target cadence of 50 revolutions per minute (rpm), set from pilot testing. Participants who were unable to achieve the selected cadence of 50 rpm unloaded pedaling maintained a lower cadence of at least 45 or 40 rpm. Every 2 minutes, the work rate was increased by 25-W increments. Measures of work rate, HR, RPE breathing and legs, and tympanic temperature were taken in the last 30 s of each incremental stage. Participants received verbal encouragement throughout the test to perform to maximal effort. In view of the broad range of physical impairment and individual fitness levels, a set end point for all participants based on meeting all clinical maximum criteria was not suitable. The exercise test was symptom limited; individuals being instructed to pedal until discomfort, pain, or fatigue set in prevented them from maintaining the required cadence. On stopping exercise, participants were asked their reason for stopping. The face mask was removed, their BP and temperature were recorded, and they were then assisted to a chair positioned within 1 m of the cycle ergometer. During the postexercise recovery phase, HR and RPE were recorded at 3, 5, and 10 minutes (Figure 1).
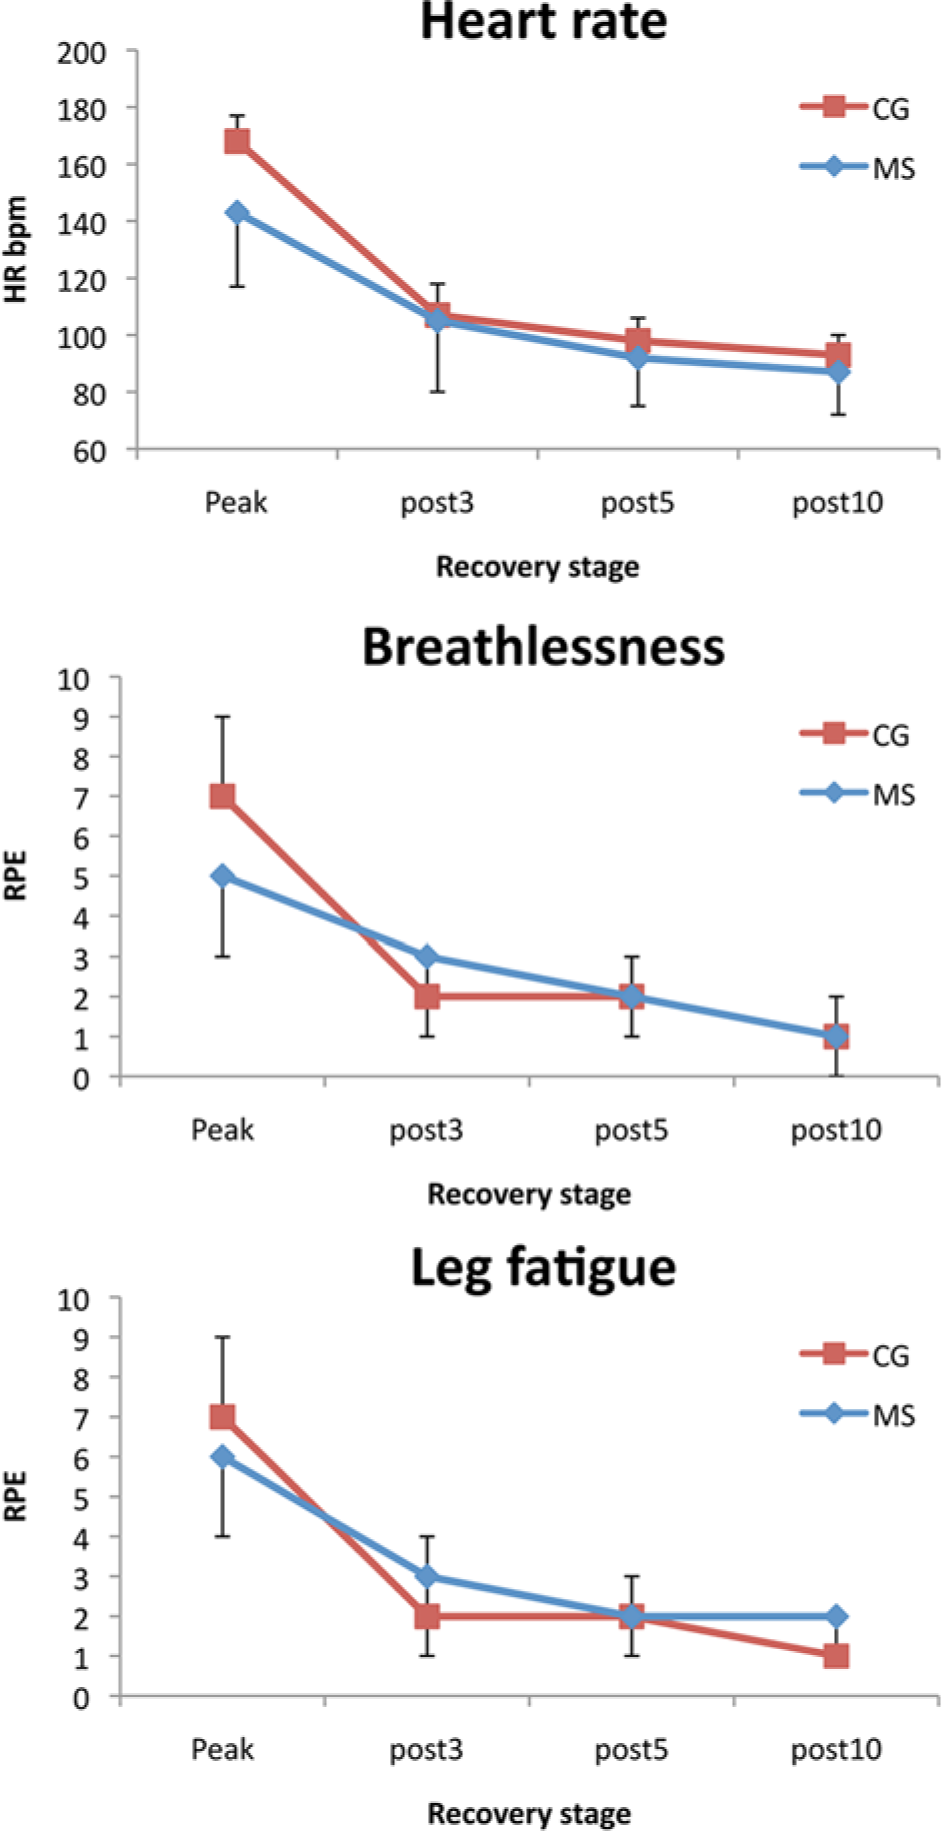
Recovery of multiple sclerosis (MS; blue) and control (CG; red) groups for HR, breathlessness, and leg fatigue during recovery. Phases: peak; post3, post–3 minutes; post5, post–5 minutes; and post10, post–10 minutes.
Data Analysis
Expired air measures of VO2(mL/kg/min) and respiratory exchange ratio (RER) calculated from oxygen consumed/carbon dioxide produced were averaged over 6 breaths and calculated as mean values from the last 15 s of each stage.
Data were imported into SPSS v 17.0 (SPSS Inc, Chicago, IL) software for statistical analysis. Normal distribution of data was determined using a Shapiro-Wilks test. Descriptive analyses were performed on participant information and exercise response and recovery data. Participants’ medications were categorized and presented according to MS type.
Data from peak exercise response were compared between the MS and control groups using independent t tests (equal/unequal variance as appropriate). A mixed model of repeated measures (at time point 3, 5, and 10) and between groups (MS and control) was used to examine recovery variables.
Individuals with MS were then categorized using fatigue FSS scores into those with no fatigue (0-3), mild fatigue (4), and severe fatigue (≥5). However, data revealed unequal group sizes, with only 8 individuals reporting mild fatigue. Mild and severe fatigue groups were compared using independent t tests. No differences emerged between the mild and severe groups in regard to the variables of interest. Consequently, data were dichotomized into those with no fatigue (<4) and those with fatigue (≥4). 48 Baseline data for variables were then compared using independent t tests (equal/unequal variance as appropriate). A mixed model of repeated measures (factors: time points 3, 5, and 10) and between group (factors: no fatigue and fatigue) was used to explore recovery variables of the 2 MS groups. Multiple comparisons were based on least-squares means adjusted by the Tukey-Kramer method.
Results
Descriptive details of participants and resting measures are detailed in Table 1. The group was moderately impaired with a range of background independence in daily-living and mobility levels. There was no significant difference between groups in terms of age, activity levels, or weight.
Participant Descriptive Data.
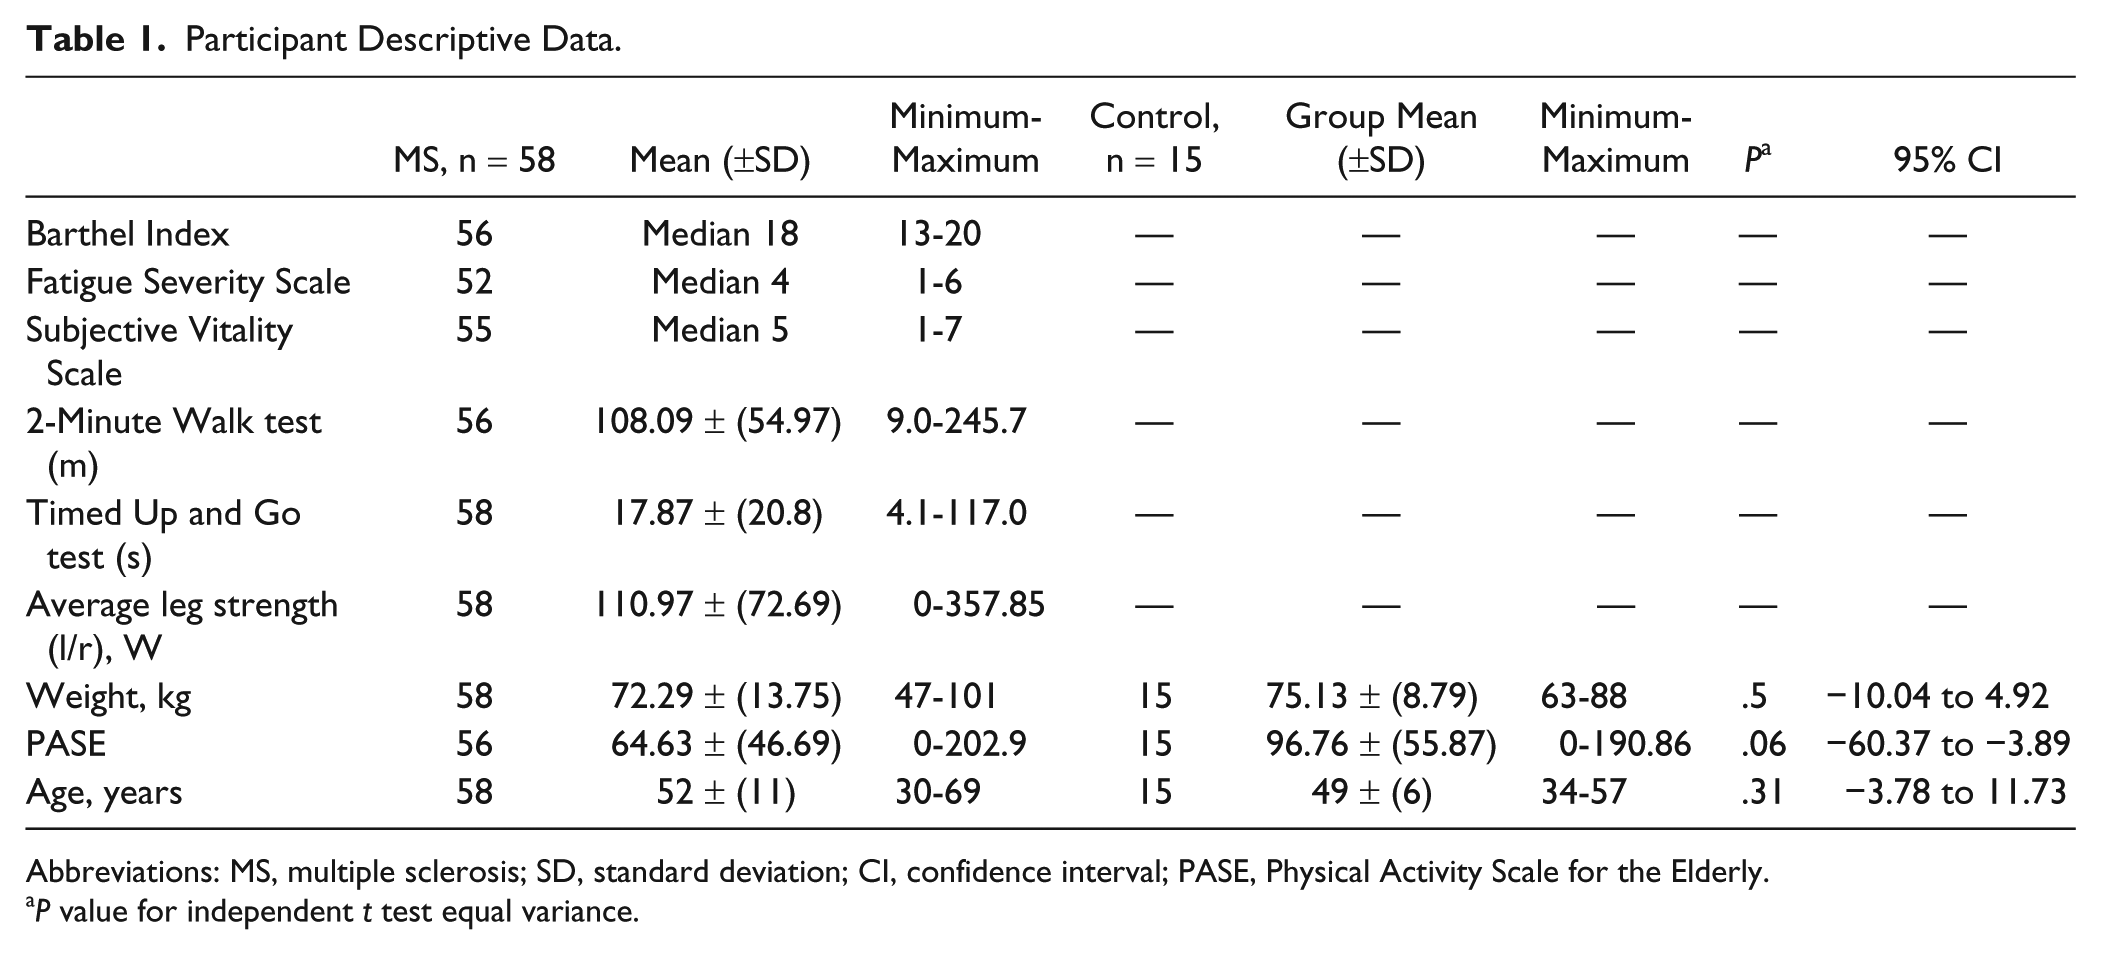
Abbreviations: MS, multiple sclerosis; SD, standard deviation; CI, confidence interval; PASE, Physical Activity Scale for the Elderly.
P value for independent t test equal variance.
Participant medication details are as follows: no medication, 7; disease modifying treatments (not including steroids), 16; stimulants (modafanil and amantadine), 6; sedating medication (all antidepressants, all antispastics, all anticonvulsants, and all tranquillizers), 32; other medications (antihypertensives, urinary tract disorder treatment, analgesics, osteoporosis treatment, statins, anti-infective medication, gastrointestinal medication, antidiabetics, antiasthmatics, antiemetics, eye drops, and oral contraceptive), 35.
When dichotomized into no fatigue and fatigue groups, details were as follows. Individuals in the no-fatigue group (n = 21): no medication, 4; disease-modifying treatments, 6; stimulants, 2; sedating medication, 7; and other medications, 10. Individuals in the fatigue group: (n = 32) no medication, 3; disease-modifying treatments, 8; stimulants, 4; sedating medication, 21; and other medications, 20.
A total of 58 PwMS (33% males) and 15 (17% males) healthy controls completed the exercise test. Participants had primary progressive MS (n = 7), secondary progressive MS (n = 25), and relapsing remitting MS (n = 26) No adverse reactions were reported from individuals of either group during the test. People in the MS group had a normal exercise response, with normal levels of VO2 (9.1 ± 3.4 mL/kg/min) at rest and a VO2 slope of 10.0 mL/W ± 0.4, which was within normal limits. 14 In the MS group, 28 cited muscle pain or weakness and hence inability to maintain the cadence as the reason for terminating the test. The remainder of the MS group and all members of the control group cited nonspecific reasons such as “had enough” or “unable to continue” as reasons for terminating the test. Further exercise test data are shown in Table 2. The control group means reached recognized criteria for peak testing: mean HR of within ±10 beats of age-predicted HRmax and an RER value greater than 1.10. 14 There were significant differences between groups in all peak exercise measurements except RPE leg (P > .05), where both groups reached the same level. The MS group failed to reach the criteria considered to represent peak performance, achieving only 82.5% of age-predicted HRmax, compared with 98% for the control group.
Comparison of Exercise Performance Values Recorded at the Termination of the Graded Exercise Test.
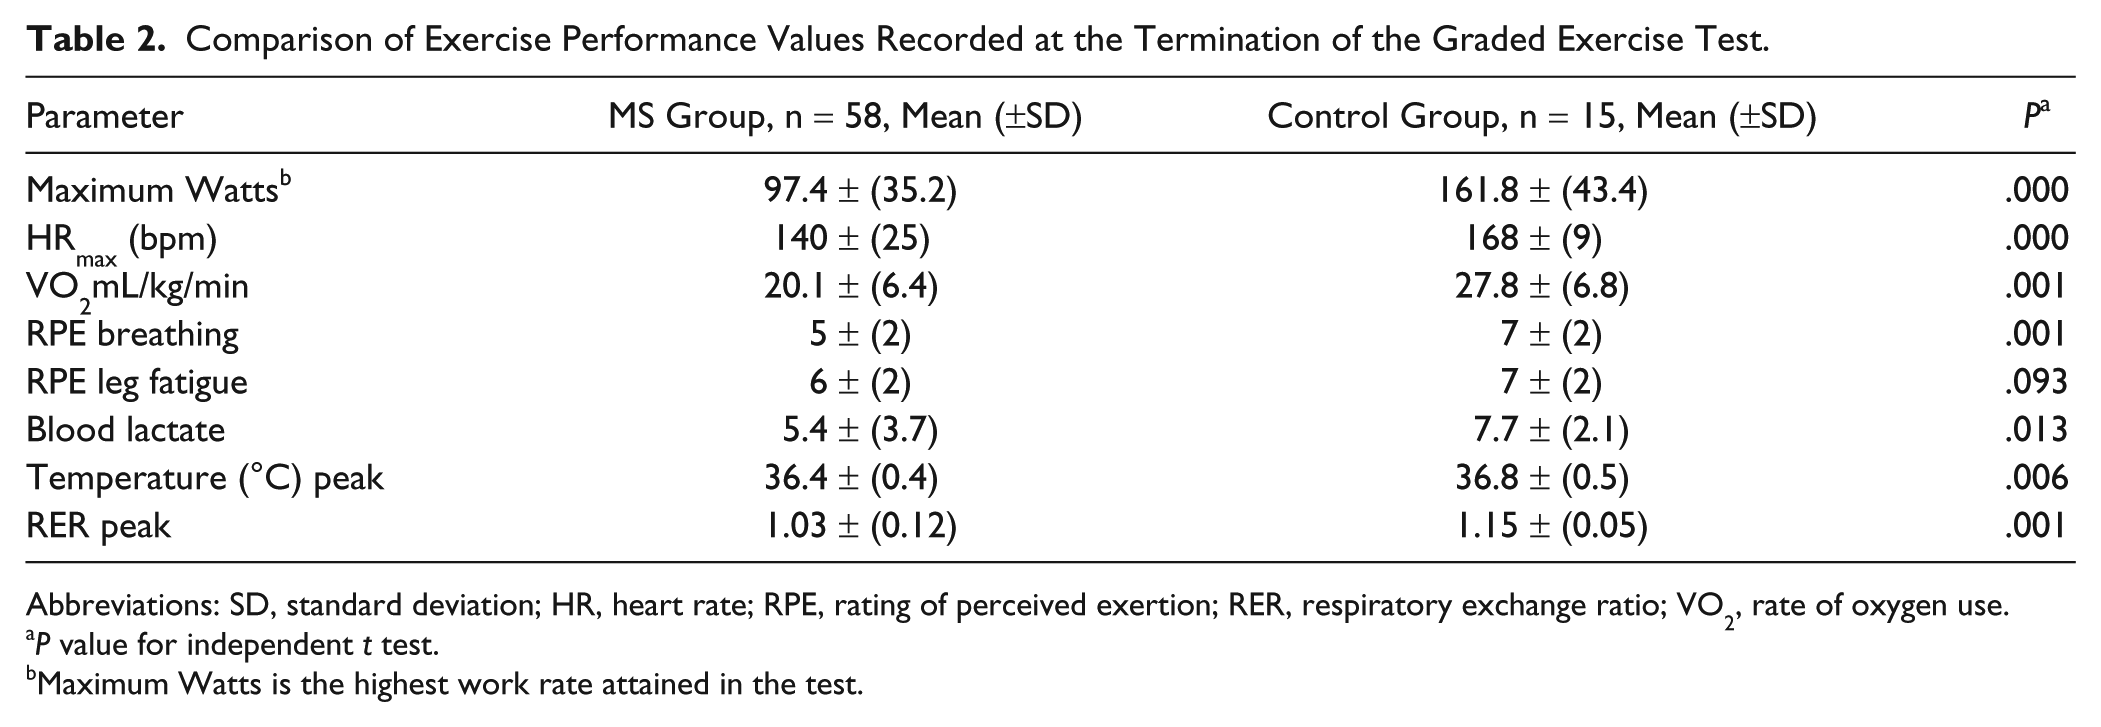
Abbreviations: SD, standard deviation; HR, heart rate; RPE, rating of perceived exertion; RER, respiratory exchange ratio; VO2, rate of oxygen use.
P value for independent t test.
Maximum Watts is the highest work rate attained in the test.
In Table 3, we show that HR, leg, and breathlessness RPE measures significantly reduced over the recovery period and that there was no difference in observed means between groups except for leg RPE, which was higher in the MS group. There were no interaction effects.
Exercise Recovery Values for Heart Rate, Breathlessness, and Perceived Leg Fatigue Taken at 3, 5, and 10 Minutes Following Exhaustive Exercise for PwMS and the CG.
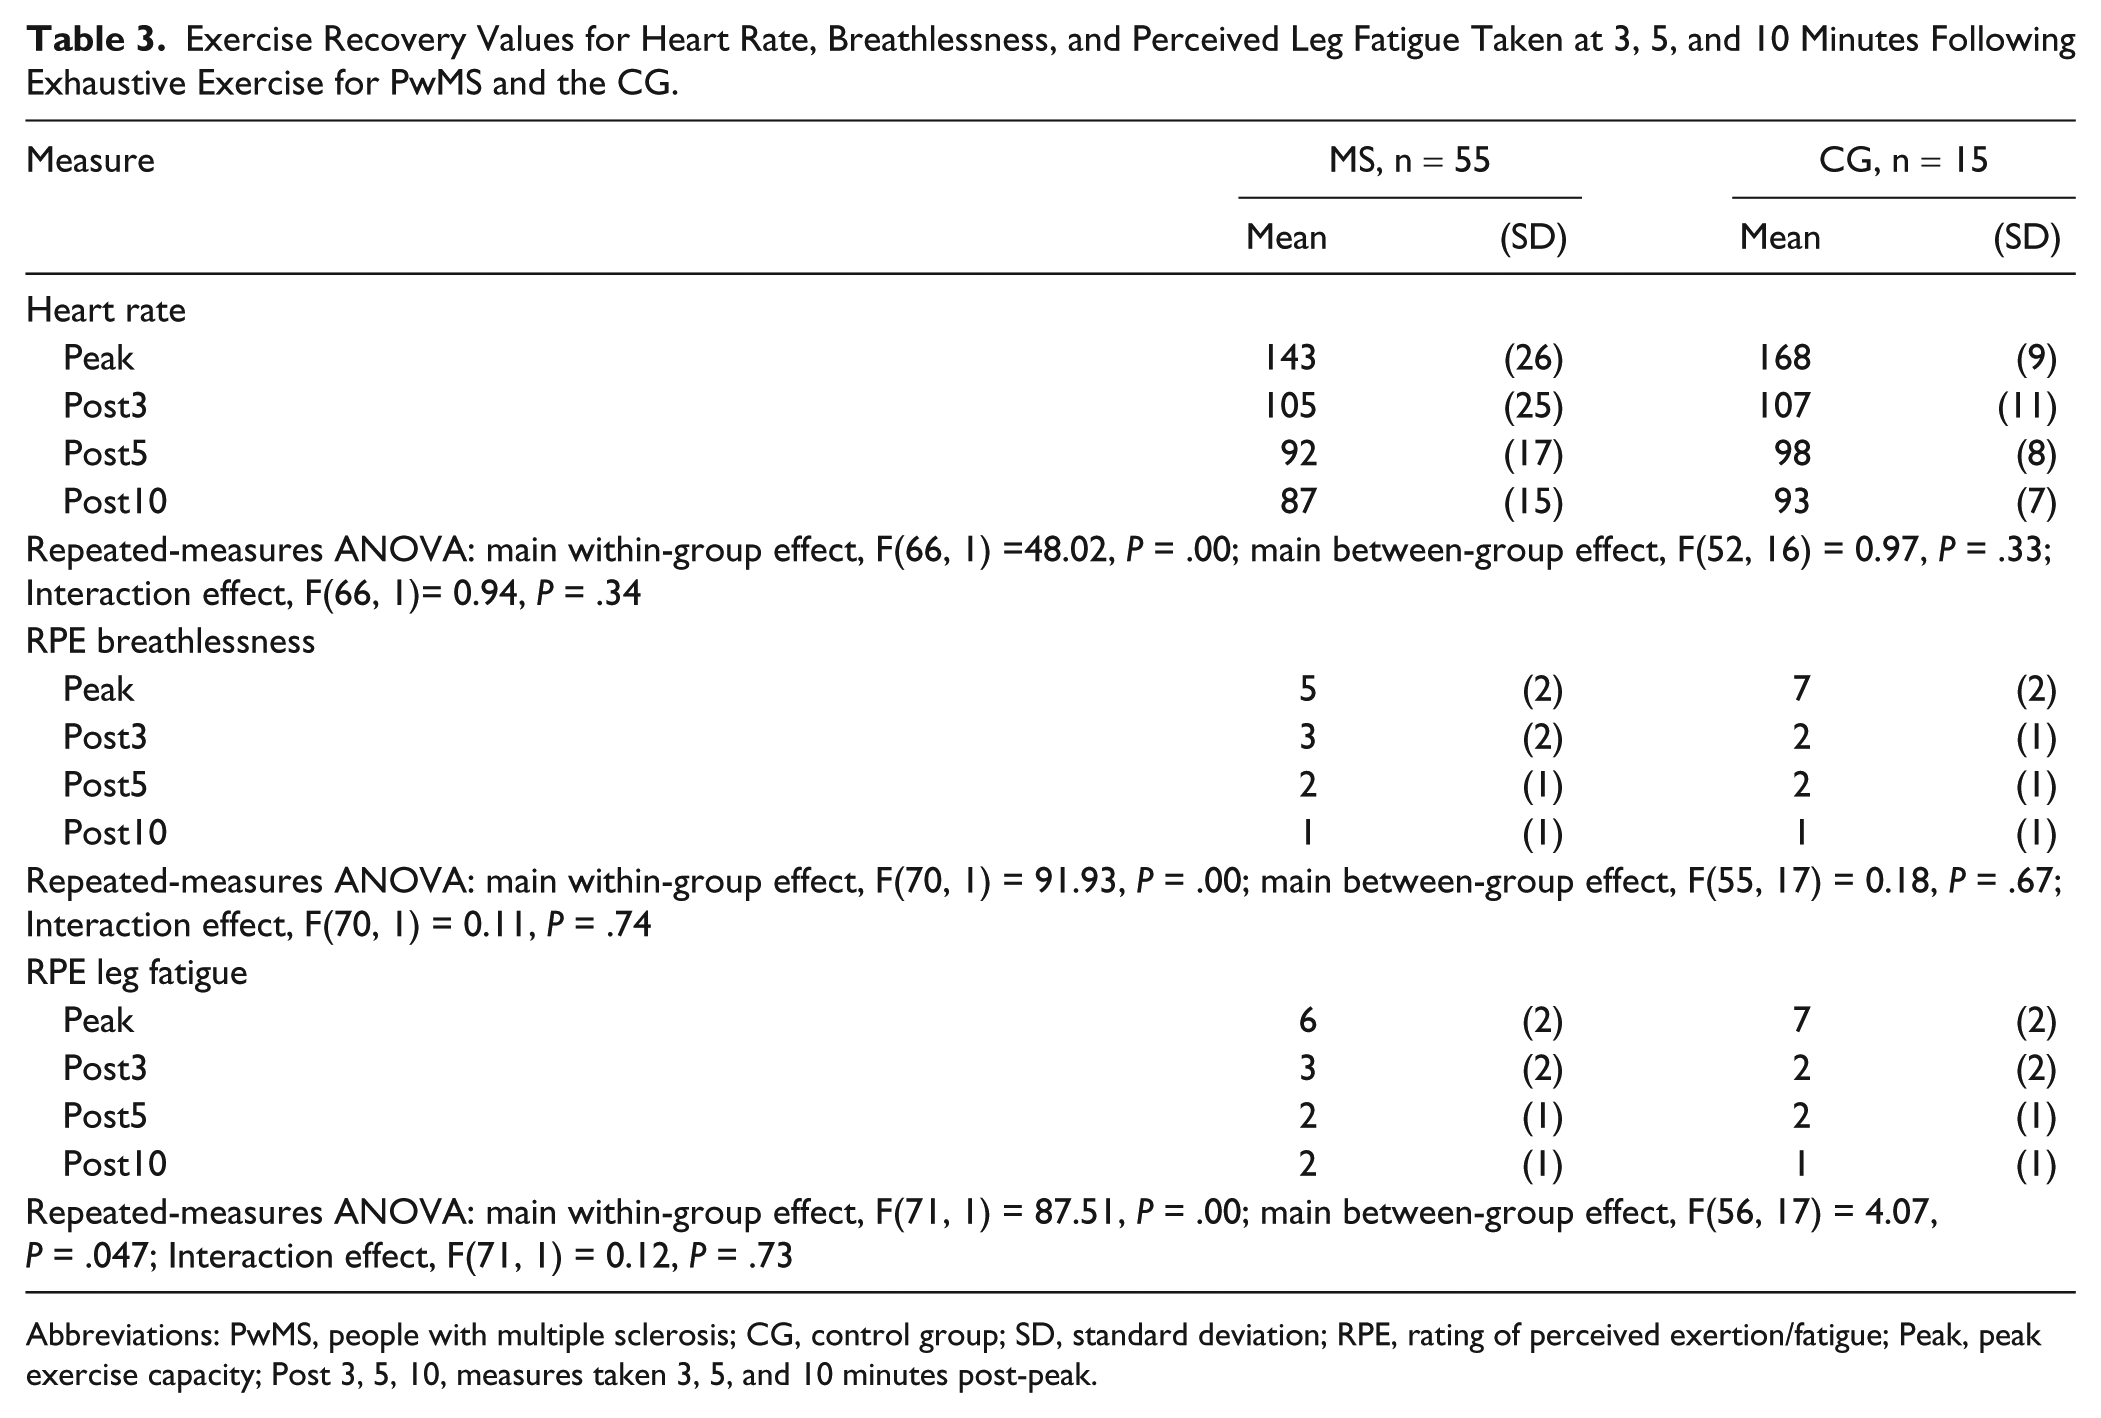
Abbreviations: PwMS, people with multiple sclerosis; CG, control group; SD, standard deviation; RPE, rating of perceived exertion/fatigue; Peak, peak exercise capacity; Post 3, 5, 10, measures taken 3, 5, and 10 minutes post-peak.
Table 4 shows that there was a significant difference between the fatigue and no-fatigue groups in disability (Barthel Index), mobility (Timed Up and Go, walking distance), and PA levels but not in leg power, vitality, cognition, or age.
Disability Measures of PwMS Presenting With and Without Fatigue. a
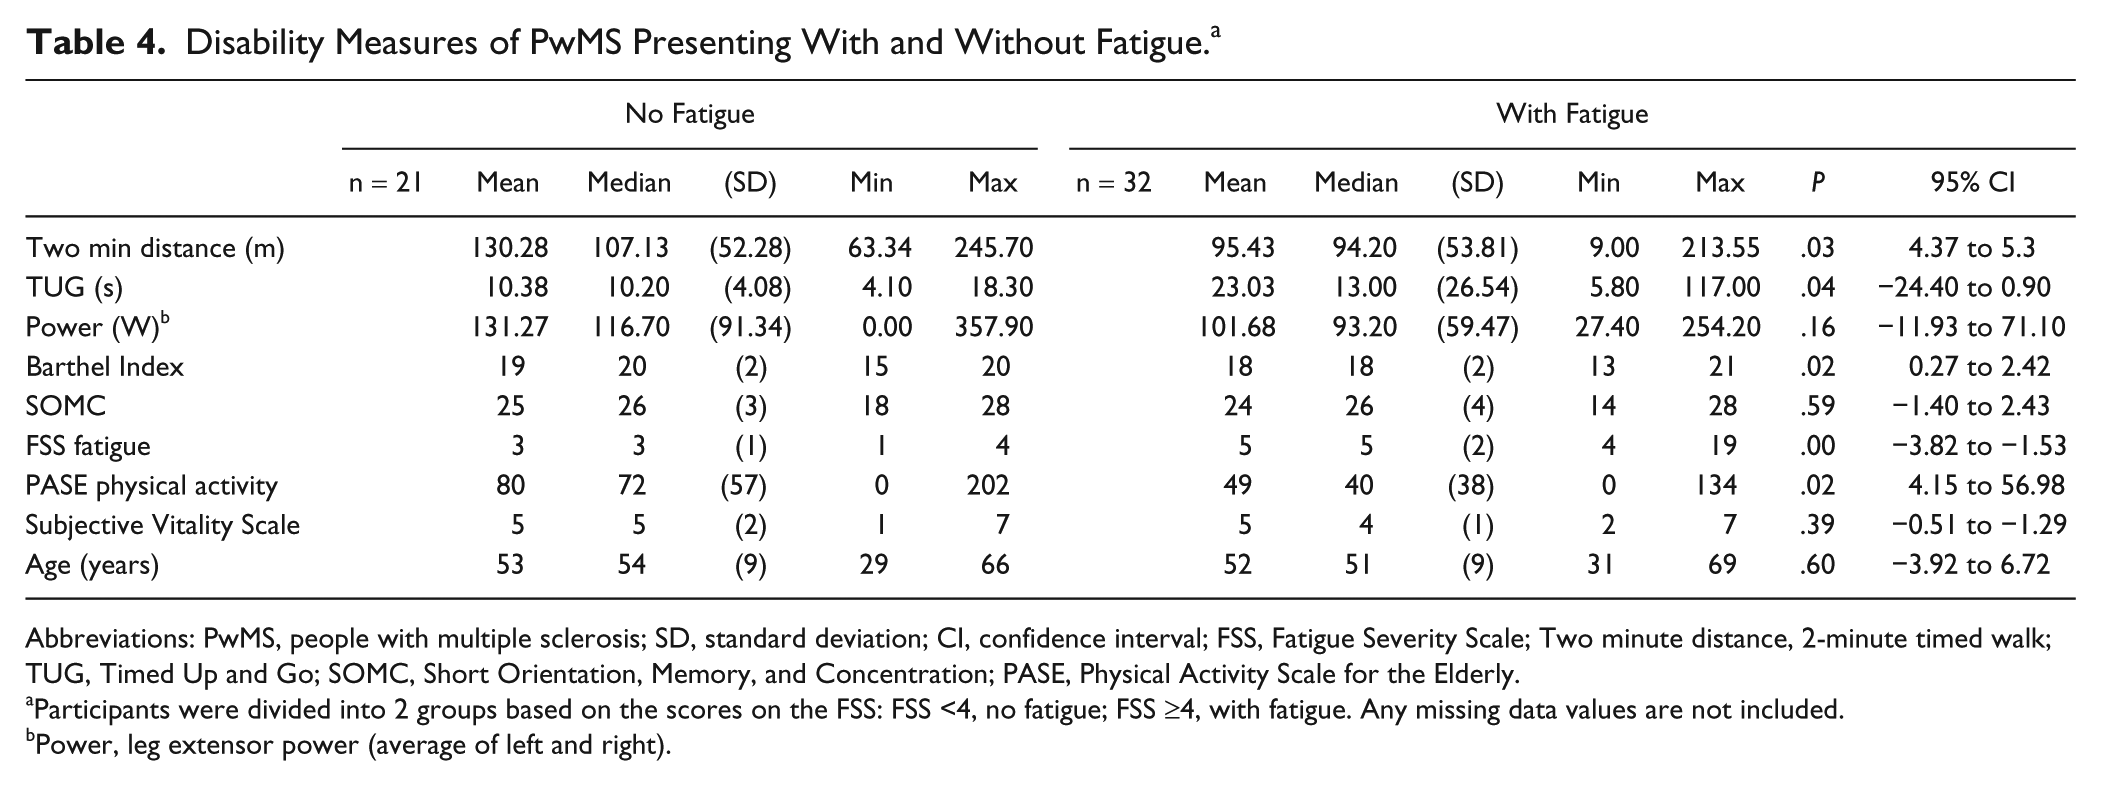
Abbreviations: PwMS, people with multiple sclerosis; SD, standard deviation; CI, confidence interval; FSS, Fatigue Severity Scale; Two minute distance, 2-minute timed walk; TUG, Timed Up and Go; SOMC, Short Orientation, Memory, and Concentration; PASE, Physical Activity Scale for the Elderly.
Participants were divided into 2 groups based on the scores on the FSS: FSS <4, no fatigue; FSS ≥4, with fatigue. Any missing data values are not included.
Power, leg extensor power (average of left and right).
Table 5 shows that the fatigued group reached the same peak exercise intensity on all relative markers of intensity but that the nonfatigued group had a higher absolute exercise capacity as measured by performance on the ergometer and VO2peak
Comparison of Exercise Performance Values Recorded at the Termination of the Graded Exercise Test for PwMS Presenting With and Without Fatigue. a
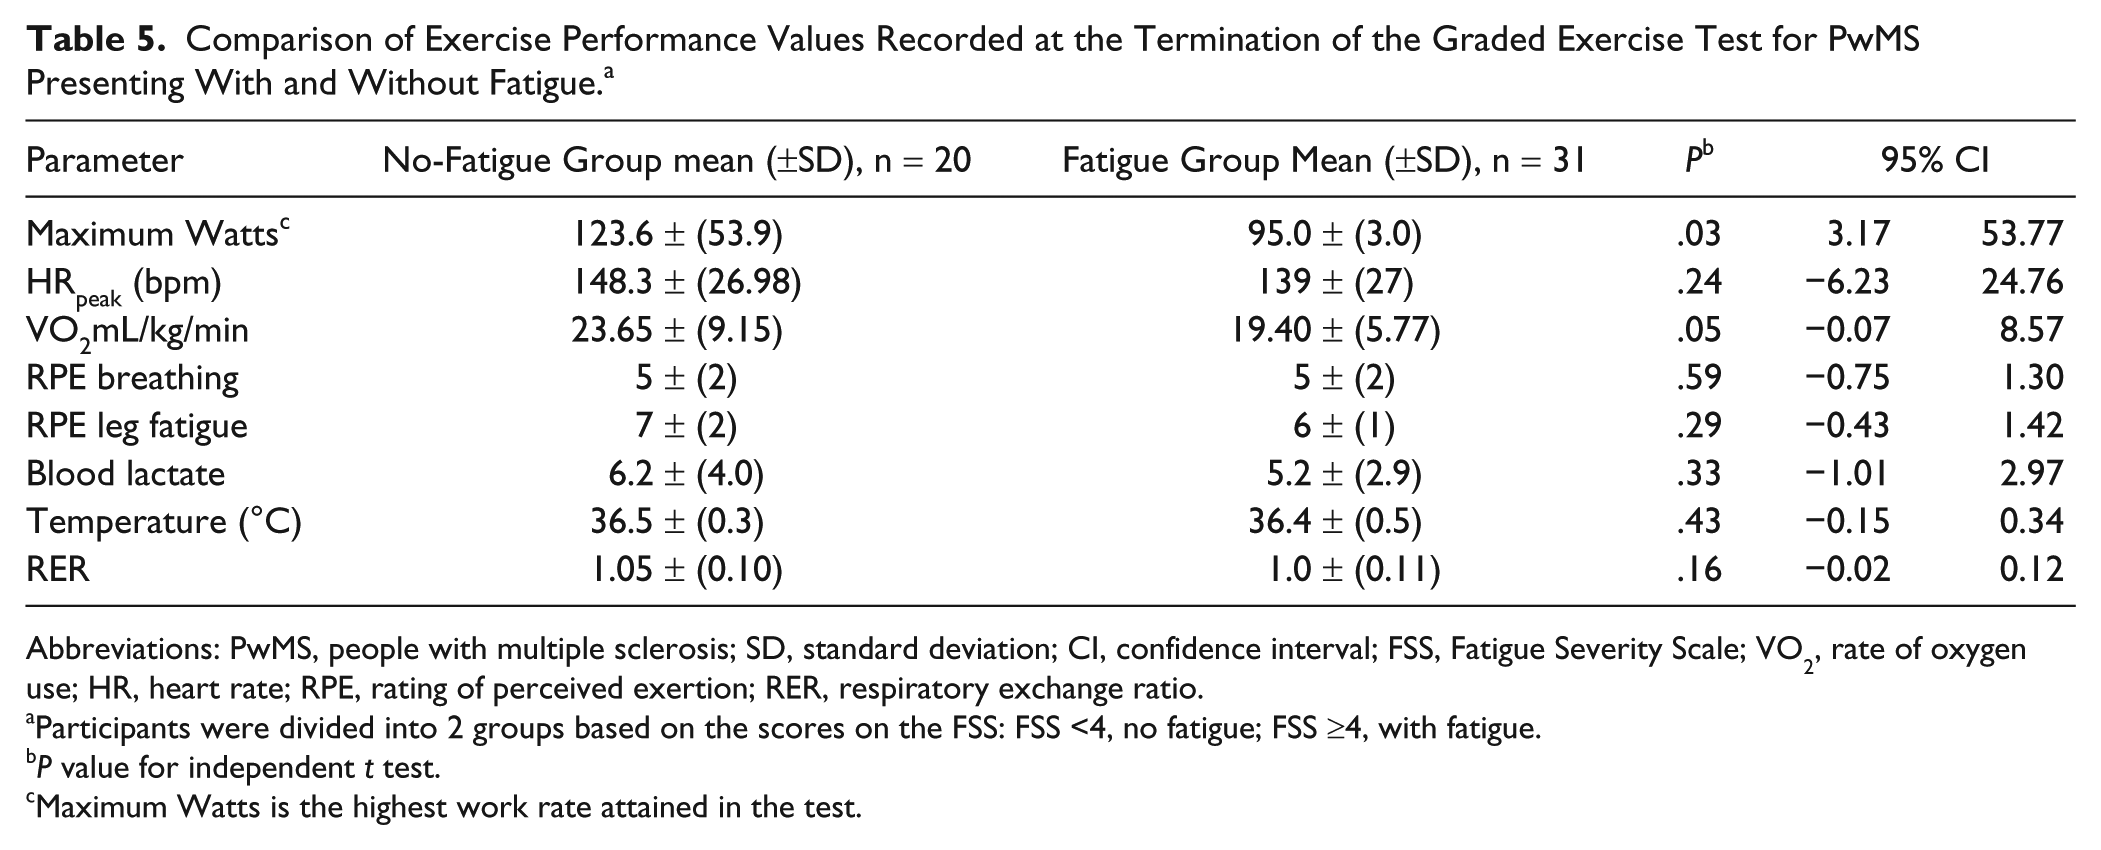
Abbreviations: PwMS, people with multiple sclerosis; SD, standard deviation; CI, confidence interval; FSS, Fatigue Severity Scale; VO2, rate of oxygen use; HR, heart rate; RPE, rating of perceived exertion; RER, respiratory exchange ratio.
Participants were divided into 2 groups based on the scores on the FSS: FSS <4, no fatigue; FSS ≥4, with fatigue.
P value for independent t test.
Maximum Watts is the highest work rate attained in the test.
As can be seen in Table 6, a within-group effect of all measures significantly reducing over time emerged, but no significant between-group or interaction effects were revealed, except for a Time × Fatigue effect on RPE leg fatigue. The observed means indicated that exertional symptoms were higher at 3 and 5 minutes after exercise than in the fatigue group but were no different at 10 minutes after exercise.
Exercise Recovery Values for Heart Rate, Breathlessness, and Perceived Leg Fatigue Taken at 3, 5, and 10 Minutes Following Exhaustive Exercise of PwMS With and Without Fatigue. a
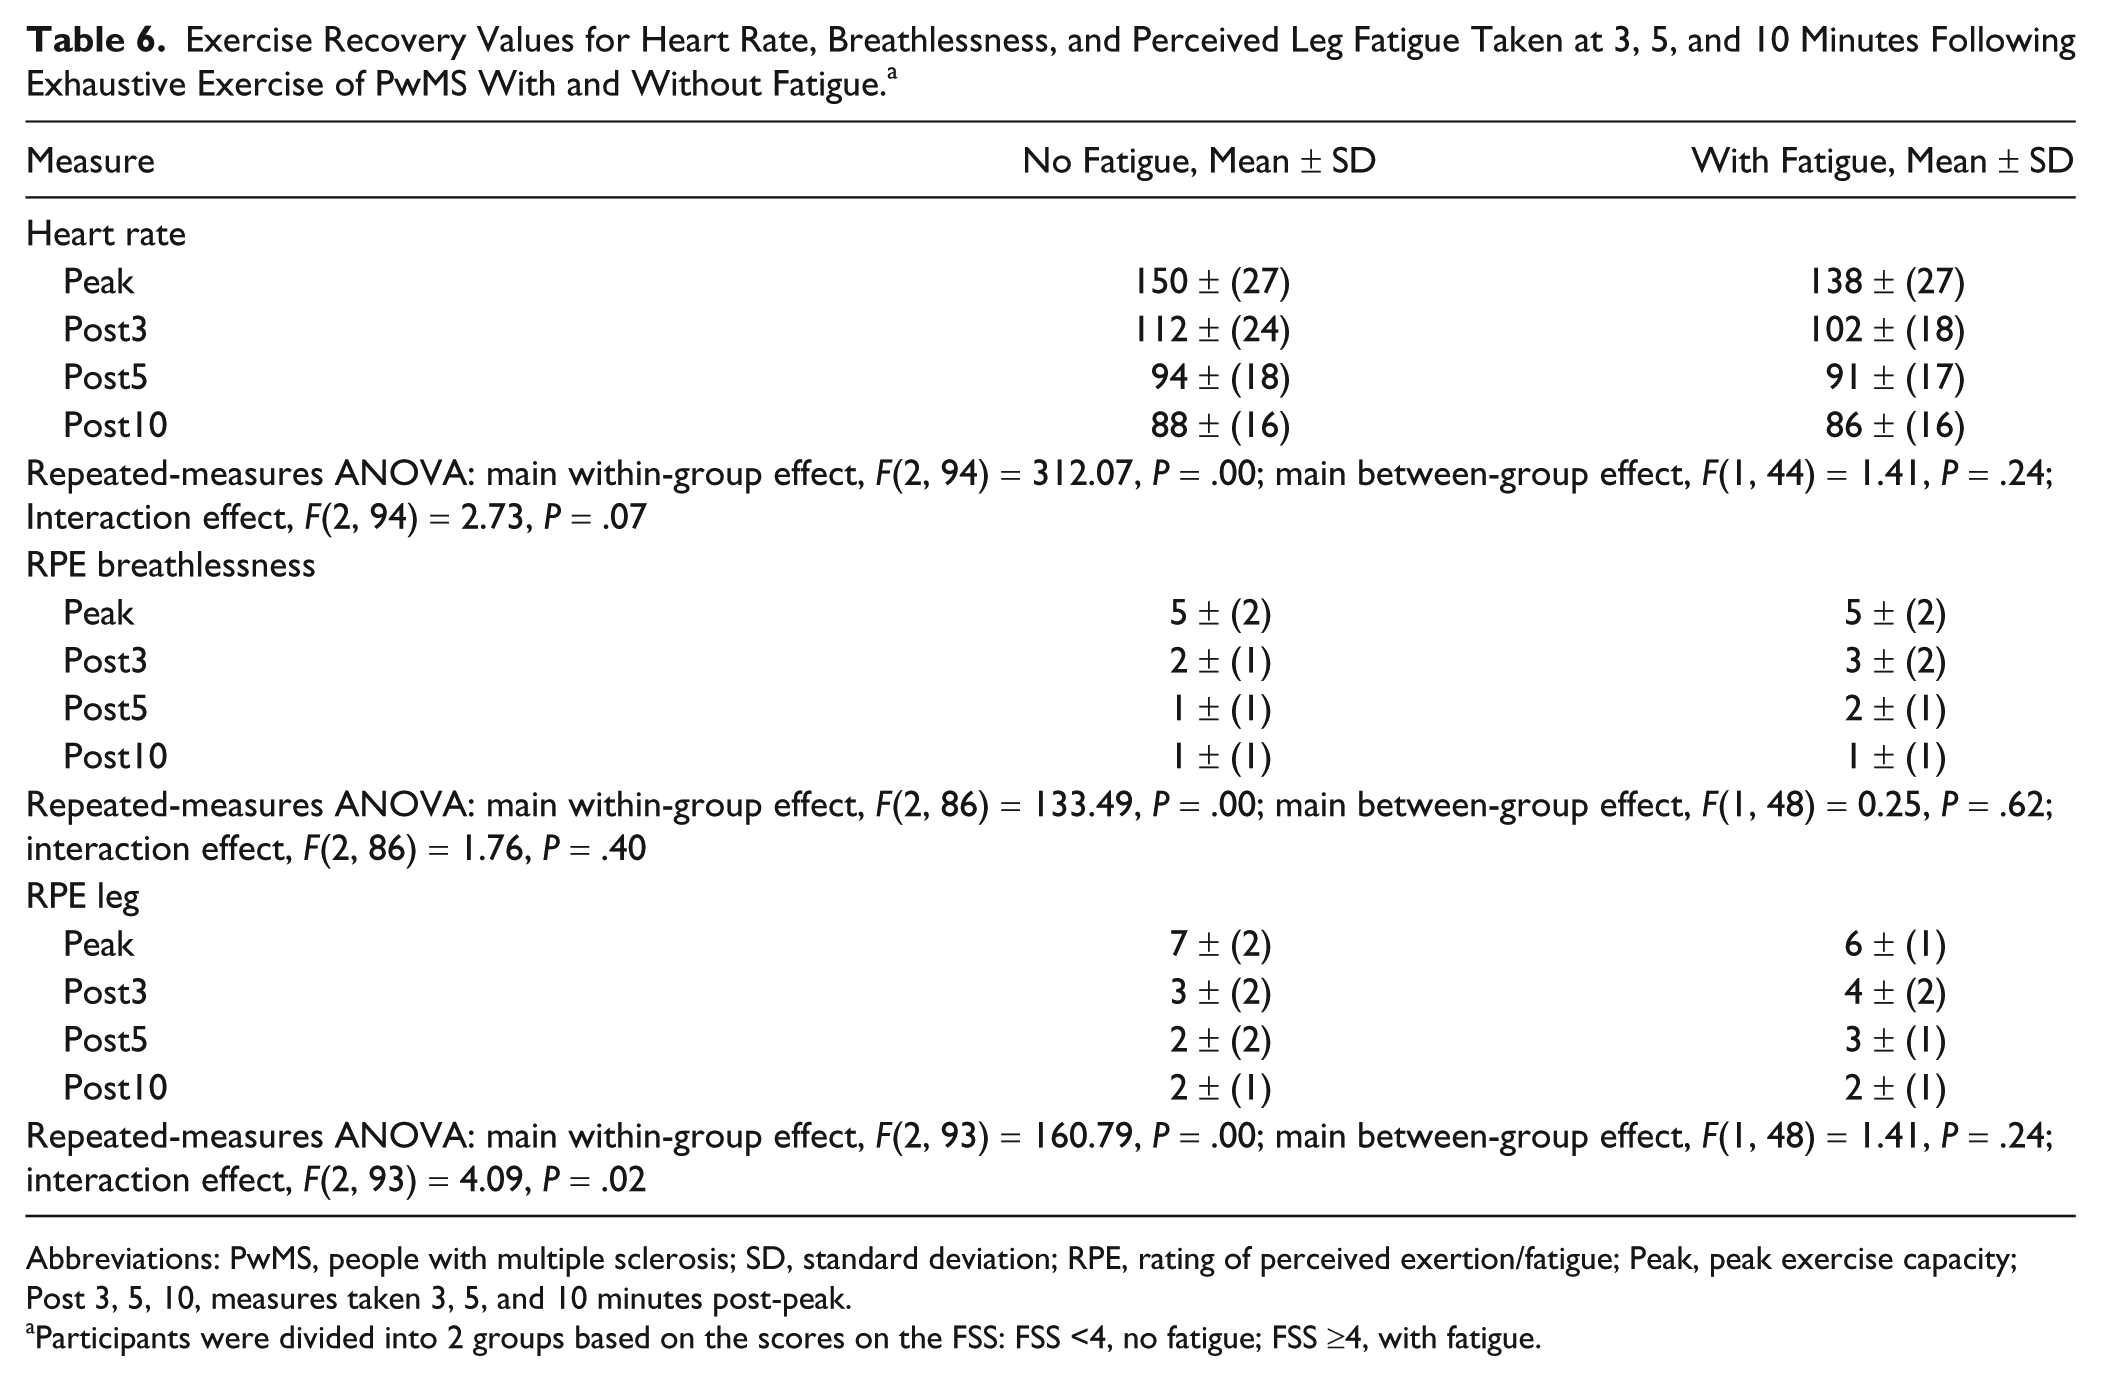
Abbreviations: PwMS, people with multiple sclerosis; SD, standard deviation; RPE, rating of perceived exertion/fatigue; Peak, peak exercise capacity; Post 3, 5, 10, measures taken 3, 5, and 10 minutes post-peak.
Participants were divided into 2 groups based on the scores on the FSS: FSS <4, no fatigue; FSS ≥4, with fatigue.
Discussion
Following exercise to voluntary exhaustion, feelings of leg fatigue were higher throughout the recovery period in PwMS than in healthy controls. All other physiological and self-report measures recovered similarly and by the same amount. Both groups terminated exercise as a result of leg fatigue symptoms, with no difference between groups in the reported level of leg fatigue symptoms. PwMS had a normal physiological response through exercise but terminated exercise at lower levels in all physiological markers and in perceived breathlessness. PwMS who reported chronic fatigue exhibited reduced exercise capacity but reached physiological and perceptual exercise intensities at test termination similar to that of their nonfatigued peers. People in the fatigued group reported higher levels of leg fatigue at 3 and 5 minutes after exercise than the group without fatigue. The findings indicate a normal physiological response to and following exercise but delayed recovery of leg fatigue symptoms particularly in people reporting general fatigue. Monitoring leg fatigue symptoms during and through recovery from PA may provide an easy-to-use self-management tool to guide the impact of participating in PA for PwMS.
We recruited a control group that had comparable background PA levels. This was supported by HR recovery rates (HRRs), which relate to fitness and were not different across MS and control groups. 49 HRR has been found to be significantly impaired in people suffering from other chronic inflammatory disorders, such as sarcoidosis, Behçet’s disease, and systemic lupus erythematosus. 50 Our data support the fact that moderately disabled PwMS have a normal HRR. The MS group failed to achieve the criterion measure of VO2max, averaging only 74% of age-predicted HRmax, and with RER values less than 1.1; therefore, the assumptions for maximal testing were not met. This has important implications for practice because exercise prescription based on age-predicted HRmax is at risk of substantially overestimating the exercise capacity of moderately impaired PwMS. Considering the previously described normal cardiovascular and respiratory exercise response in PwMS 51 and in view of the observed normal oxygen response (8.5-11 mL/min/W 14 ) and recovery to baseline measures within 10 minutes of test termination the fact that none of the MS group reported adverse reactions, it seems reasonable to suggest that performance from an incremental cycling test to voluntary exhaustion remains the gold standard for assessing exercise capacity in PwMS. Less-able individuals, in contrast to previously reported data in mildly-affected PwMS who reported a normal response, started exercising at higher levels of oxygen consumption than expected and as such estimated VO2max from HR response could be underestimated in some PwMS. 52
When considering the possible mechanism of our observations, deficits in central drive in PwMS occur typically in the lower-limb muscle groups, reducing the ability to generate and maintain fast powerful movements.53-55 Deficits in central drive may be related to an amplified effort sense, 32 possibly explaining the lower intensity of exercise achieved and altered recovery of leg fatigue symptoms. It should be noted that more individuals in the fatigue group were taking sedatives than the nonfatigued group. This study was not powered to explore the impact of medication on the exercise response, and it may be that the higher levels of sedative drugs simply reflect the higher level of disability in this group.
The MS group was recruited through neurologist referral, which introduces possible bias; however, individuals were also recruited through local MS society meetings to dilute this effect. The MS group was heterogeneous, containing individuals with different disease courses and levels of disability. A further consideration when comparing the MS and control group is that the control group was smaller and, therefore, groups were not matched (1:1); however, the MS and control groups were composed of participants of similar age, gender, weight, and activity levels. Consequently, differences in exercise test performance and recovery could be attributed to impairments and deficits caused by MS. Individual cardiorespiratory fitness levels, different levels of impairment to central motor drive, intolerance to environmental factors, or the mode of exercise may have contributed to the variability in exercise performance in the MS group, but testing was as far as possible performed under standard conditions. When compared with other investigations, we included a broad range of ambulatory abilities.56,57 However, the exclusion criteria meant that nonambulatory PwMS and those with contraindications that precluded maximal exercise testing were not represented. Our control group was small, and some statistical differences may have been obscured because of this; however, the control group was fairly homogenous. Finally, there is the question of whether MS participants fully understood the verbal anchors and numerical value of the RPE scale. However, we would argue for the face validity of their responses; also, the agreement of RPE leg values at maximal effort with those of the control group gives a clear indication that the MS group fully understood and complied with the instructions for reporting sensations. When considering if a higher percentage of males in the control group was a factor affecting our observation of a slower rate of recovery of leg fatigue in PwMS, we propose that because rating of breathlessness was not different between groups and the percentage difference of male to female participants was small, this did not influence our findings.
We suggest that our findings are useful for patient education and advice regarding PA management. We acknowledge that reports of leg fatigue during the recovery period did vary between all individuals in both fatigue and nonfatigue groups. However, this variability may be important, and PwMS may benefit from a tailored approach to daily activity management that includes RPE. We suggest that using RPE to rate leg fatigue symptoms during and following exercise could empower PwMS to take control of their own PA management.
Professionals should be encouraged to consider the recovery of leg fatigue symptoms when prescribing exercise (intensity and dose) and in scheduling the frequency of sessions. Our findings suggest that because leg fatigue recovery rates differ between individuals with and without fatigue, leg fatigue recovery could be used as a guide to help determine appropriate exercise prescription without increasing chronic fatigue. This may assist in addressing the important goal that PwMS participate in exercise while maintaining participation in social roles, leisure pursuits, and community interactions. More informed advice about exercise, fatigue, and planned recovery times may assist in improving rehabilitation programs and help more people manage their own PA while maintaining important work and social roles. Further research in a larger sample should be considered to explore the utility of monitoring leg fatigue symptoms to effectively manage PA. Finally, our findings have applications for other neurological conditions where fatigue is an overwhelming symptom, and a tool for self-managing subjective exercise symptoms in these groups may offer an insight into novel approaches for fatigue management.
Footnotes
Acknowledgements
The authors would like to thank Dr J. Palace for her support and extend gratitude to the participants of the study. We would also like to thank the movement science steering group (user researchers) and participating multiple sclerosis society branches. We would also like to thank our study user steering group for their critical review of the study proposal.
Declaration of Conflicting Interests
The authors declared no potential conflicts of interest with respect to the research, authorship, and/or publication of this article.
Funding
The authors disclosed receipt of the following financial support for the research, authorship, and/or publication of this article: This work was supported by the Multiple Sclerosis Society of Great Britain and Northern Ireland (Grant Number 840/06, primary funder) and from Oxfordshire Primary Care Trust extension to the MS funding NIHR (#1022) and Research Institute for Movement Disorders Trust (#040110-1) extension funding for supporting the research assistant.