
Abstract
Background. Kinematic analysis is a powerful method for an objective assessment of movements and is increasingly used as an outcome measure after stroke. Little is known about how the actual movement performance measured with kinematics is related to the common traditional assessment scales. The aim of this study was to determine the relationships between movement kinematics from a drinking task and the impairment or activity limitation level after stroke. Methods. Kinematic analysis of movement performance in a drinking task was used to measure movement time, smoothness, and angular velocity of elbow and trunk displacement (TD) in 30 individuals with stroke. Sensorimotor impairment was assessed with the Fugl-Meyer Assessment (FMA), activity capacity limitation with the Action Research Arm Test (ARAT), and self-perceived activity difficulties with the ABILHAND questionnaire. Results. Backward multiple regression revealed that the movement smoothness (similarly to movement time) and TD together explain 67% of the total variance in ARAT. Both variables uniquely contributed 37% and 11%, respectively. The TD alone explained 20% of the variance in the FMA, and movement smoothness explained 6% of the variance in the ABILHAND. Conclusions. The kinematic movement performance measures obtained during a drinking task are more strongly associated with activity capacity than with impairment. The movement smoothness and time, possibly together with compensatory movement of the trunk, are valid measures of activity capacity and can be considered as key variables in the evaluation of upper-extremity function after stroke. This increased knowledge is of great value for better interpretation and application of kinematic data in clinical studies.
Introduction
Impaired upper-extremity function has been reported for approximately 70% of persons after stroke in the acute phase and for 40% in the chronic phase.1,2 This impairment results in poor movement control and has a major impact on the level of activity 3 and participation in different life situations. 4 To target these multiple aspects of functioning after stroke, the multidimensional model of the International Classification of Functioning, Disability and Health (ICF) 5 can successfully be used because the aspects of impairments, activity, and participation limitations together with contextual factors are incorporated into the same conceptual framework.
The upper-extremity function can be assessed with different outcome measures, and the choice of assessment scale depends on what aspects of functioning are of main interest. The selection of an appropriate outcome measure is crucial for detecting a possible treatment effect and has a major impact on the interpretation and implication of the results.6-9 In the area of upper-extremity rehabilitation after stroke, the outcome measures with adequate psychometric properties and clinical relevance have been identified for robot-assisted exercise trials7,8 and for measures reflecting “real-life” functioning. 6 In these reviews, the Fugl-Meyer Assessment (FMA), Action Research Arm Test (ARAT) and ABILHAND were identified, among others, as scientifically appropriate and clinically relevant stroke specific scales. These scales also correspond to different components of the ICF framework and represent a combination of clinician-rated and patient-reported measures.
The traditional clinical outcomes are in general observational rating scales, and the disadvantage of the ordinal scaling and subjectivity in scoring cannot be denied. The objective and quantitative measures (eg, kinematics) of upper-extremity function can provide more sensitive and specific information about movement performance and quality.8,10-13 Kinematic analysis is increasingly used in clinical research to evaluate the effects of various therapeutic interventions14-17 or to study motor recovery after stroke.18,19
The most common movements studied with kinematics are simple pointing or reaching, although the number of studies using more functional reach-to-grasp tasks with real objects is increasing.20-24 Because the kinematic properties of movement performance depend on the constraints of the task, 25 the measurements on natural and purposeful activities should be more suitable for assessing the actual upper-extremity functioning after stroke. In the current study, a drinking task is used for kinematic movement analyses26,27 to capture natural movement performance during this common daily task.
Several investigators suggest that the use of multiple clinical outcomes together with objective measurements is necessary to understand the impact of disability or to capture important treatment effects in clinical trials.7,8,10,11 This development toward multilevel testing supports the further need to investigate the patterns and relationships between different outcome measures, so that the most appropriate measures can be used.
There are a limited number of studies where the relationships between kinematics and upper-extremity functioning have been assessed,13,28-30 but to our knowledge, there are no studies that have investigated the associations between kinematics from a daily task such as drinking and activity limitations after stroke. Moreover, the information of how the actual movement performance, measured with kinematics, is related to the activity limitations, measured with traditional clinical assessments, is central in rehabilitation research and essential for better interpretation of the kinematic data and for improved application in clinical studies.
The purpose of this study was to determine the relationships between movement performance kinematics from the drinking task and the impairment or activity limitation level after stroke assessed with traditional clinical measures. The specific objectives were the following: to determine the amount of variance in the traditional clinical outcome that can be explained by the kinematic variables and to identify which kinematic variables explain most of the variance in these clinical measures.
Methods
Participants
We included 30 individuals with first-time stroke and existing hemiparesis, 1 to 12 months poststroke, in this study (Table 1). The sample was extracted from the cohort of the SALGOT-study (Stroke Arm Longitudinal Study at the Gothenburg University). 31 Participants were included if they had persistent sensorimotor impairment, identified as a score of 64 or less on the FMA for Upper Extremity, and were able to perform the drinking task with their affected arm. They were excluded if they had other musculoskeletal or neurological problems that could affect the function of the arm, were younger than 18 years old, or did not speak Swedish. The study protocol was approved by the Regional Ethics Committee of Gothenburg, Sweden, and written informed consent was obtained from all participants prior to study entrance according to the Declaration of Helsinki.
Demographic Characteristics and Mean Values for Kinematic Movement Performance Variables and Clinical Assessment Scales
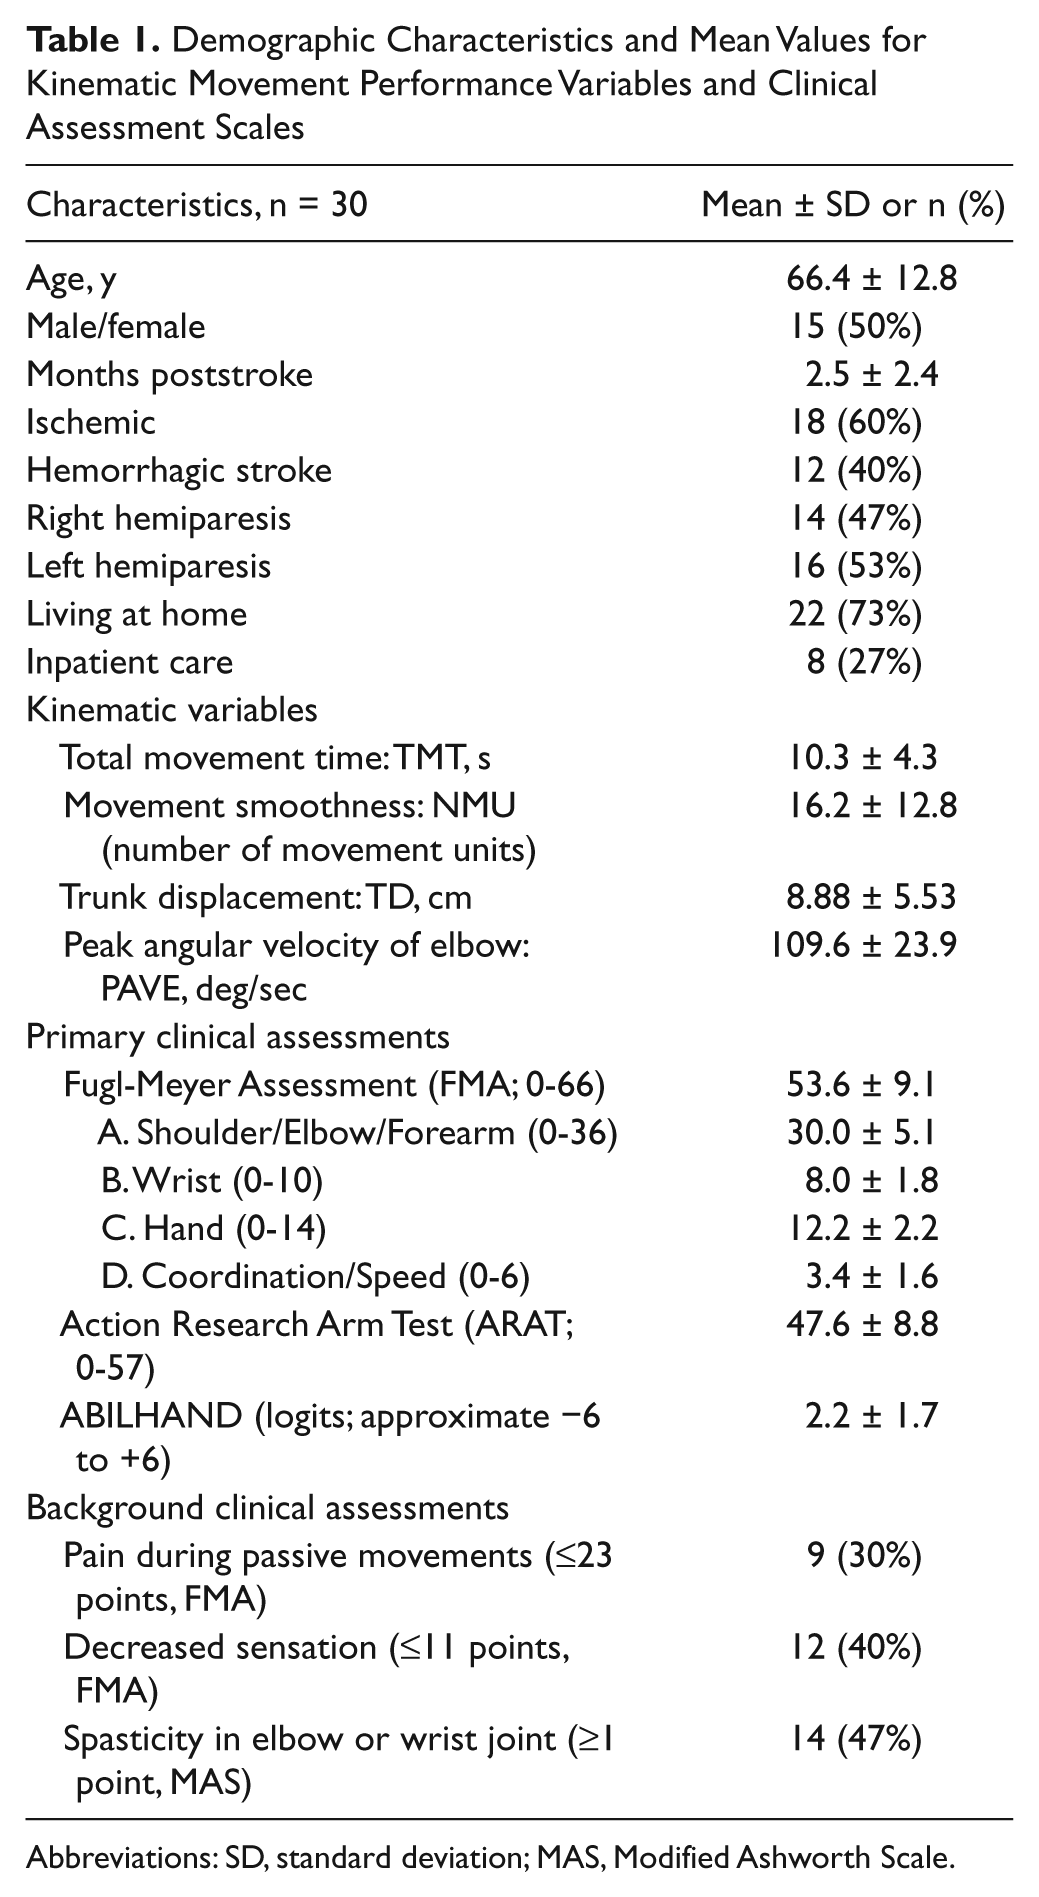
Abbreviations: SD, standard deviation; MAS, Modified Ashworth Scale.
Kinematic Testing Protocol
A standardized drinking task with good test-retest reliability was used in this study.26,27 The drinking task included reaching, grasping, and lifting the glass from the table; taking a drink (1 sip); placing the glass back on the table behind a marked line; and finally, returning to the initial position. The drinking glass was filled with 100 mL water and placed 30 cm from the table edge in the midline of the body, corresponding approximately to a distance of 80% of arm’s length. Participants were sitting in a height-adjustable chair with their back against the chair’s back, but the position was not restrained and compensatory movements were allowed if needed. In the initial position, the upper arm was in the neutral adducted position with approximately 90° flexion at the elbow; the tested hand was resting on the table with the palm downward. The drinking task was performed at a comfortable self-paced speed, and both arms were tested starting with the nonaffected arm. A total of 5 trials of the drinking task were recorded, but in statistical calculations, a mean of 3 middle trials was used.
A total of 9 spherical 12-mm retroreflective markers were placed on the tested hand (third metacarpophalangeal joint), wrist (styloid process of ulna), elbow (lateral epicondyle), right and left shoulder (middle part of acromion), thorax (upper part of sternum), and face (notch between eyebrows), and 2 markers were placed on the glass (upper and lower edge). Comparable marker positions have been used in other studies.20,32,33
Three-dimensional motion analysis was performed with a 5-camera optoelectronic ProReflex Motion Capture System (MCU240 Hz, Qualisys AB, Sweden). The capture data were transferred to MATLAB software (The Mathworks Inc, Natick, Massachusetts) for custom-made analysis and filtered with a 6-Hz second-order Butterworth filter in both forward and reverse directions, resulting in a zero-phase distortion and fourth-order filtering. The drinking task was broken down into 5 logical phases: reaching for the glass, forward transport of the glass to the mouth, drinking, back transport of the glass to the table, and returning the hand to the initial position.26,27
Kinematic Variables
The choice of kinematic variables used to characterize the drinking task was based on our previous results from principal component analysis where the number of variables needed for describing the stroke cohort was identified. Subsequently, the variables that were most effective for discriminating between mild and moderate stroke impairment and between impaired and unimpaired performance were selected for the analysis in the current study. 27 According to our earlier study, the drinking task can be described in terms of 2 major factors: first with variables measuring the movement time, velocity, and smoothness and second with variables of compensatory movement patterns and coordination. 27 In this study, the total movement time (TMT), number of movement units (NMUs), and peak angular velocity of the elbow joint (PAVE) were selected to quantify the movement performance, and trunk displacement (TD) was selected to quantify the compensatory movement pattern. The test-retest reliability has been reported by other investigators to be excellent for the kinematic variables of movement time and TD in a reach-to-grasp task with stroke participants (Intraclass Correlation Coefficient [ICC] = 0.94; 0.91). 34 Schneiberg et al 35 reported high ICC values for the TD (0.95) and for movement smoothness (0.88) in a reach-to-grasp task in children with cerebral palsy.
TMT was calculated from the onset to the offset of movement, including in all 5 defined movement phases. Movement onset was defined as the time when the tangential velocity of the hand marker exceeded 2% of the maximum velocity in the reaching phase, and the offset was detected similarly when the hand velocity was less than 2% of the maximum velocity in the returning phase. 27 Smoothness of movement was quantified by computing the NMUs during reaching, forward transport, back transport, and the returning phase. To define a movement unit, the tangential velocity profile of the hand was searched for local minima and maxima. A difference between a minimum and the next maximum velocity value that exceeded the amplitude limit of 20 mm/s signified a velocity peak. The time between 2 subsequent peaks had to be at least 150 ms. Such peaks reflect repetitive acceleration and deceleration during reaching and correspond to movement smoothness and efficiency. 36 PAVE was computed from angular data for the reaching phase.26,27 Compensatory TD was computed for the entire drinking task as the maximal displacement of the thorax marker in the sagittal plane from the initial position. The mean values and standard deviations (SDs) for the TMT, NMU, PAVE, and TD in a healthy reference sample are 6.5 ± 0.8 s, 6.5 ± 1.2 units, 122° ± 25° s−1, and 2.7 ± 1.7 mm, respectively, and have been reported earlier. 27
Clinical Assessments of Upper-Extremity Functioning
The sensorimotor function was assessed using the FMA for Upper Extremity. 37 Tested items are divided into 4 subscales (arm, wrist, hand, and coordination) and are scored on a 3-point ordinal scale. The scoring is based on the ability to perform isolated movements within and out of the synergy patterns. The maximum total score of 66 corresponds to unimpaired motor function. The nonmotor domains of FMA, sensation, and pain during passive joint motions were completed for the background data. The increased muscle tone in elbow and wrist joints (both mechanical and neural) was assessed using the Modified Ashworth Scale. 38
The activity capacity was evaluated using the ARAT, which is a performance test for upper-extremity function and dexterity. 39 The ARAT uses 4-point ordinal scoring on 19 items divided into 4 hierarchical subtests: grasp, grip, pinch, and gross movement. The scoring is based both on the movement performance and on the time limit, and the maximum total score of 57 indicates normal performance.39,40
The self-perceived manual ability was assessed using the 23-item Rasch-validated ABILHAND questionnaire for persons after stroke.41,42 ABILHAND measures the person’s perceived difficulty in performing everyday manual activities on a 3-level scale (impossible, difficult, and easy) without external help and irrespective of the limb and strategy used. The score is expressed in logits 43 and is considered as an interval linear measure in statistical calculations.41,42
Statistical Analysis
Statistical analyses were performed using SPSS (Statistical Packages for the Social Sciences, 16.0; SPSS Inc, Chicago, Illinois). A significance level of .05 was used in statistical analysis. Relationships between different variables were evaluated using the Spearman rank-order correlation and multiple linear regression with backward deletion.
Preliminary analyses were conducted to ensure no violation of the assumptions of normality, linearity, multicollinearity, and homoscedasticity by checking the normal probability plots of regression-standardized residuals and the scatterplot of standardized residuals. The limit for multicollinearity between independent variables was set at ≥0.7, and in case of collinearity, the variable with higher correlation with the dependent variable was used.
First, the univariate regressions were conducted with every variable. Then, after controlling for the influence of age and gender, multiple linear regression with backward deletion was used to assess how much variance in clinical assessment can be explained by kinematic variables and to determine which kinematic variable(s) explained the greatest amount of variance. Probability for entry in backward regression was set at .05 and removal at .10. Adjusted R2 value, unstandardized coefficient (B), and unique partial correlation coefficients were used to provide a better estimate of the true population value and to offer an estimation of the magnitude of the contribution of each predictor to the model.
Results
The mean values and SDs for the kinematic variables and for the clinical assessments are displayed in Table 1, together with the clinical background data on the presence of pain, sensation, and spasticity. Participants in this study had a moderate to mild impairment after stroke, with FMA scores varying from 32 to 64.
The tangential velocity profiles, representing different functioning levels in 3 participants are displayed in Figure 1. In contrast to normal movement performance, where the velocity profiles are typically smooth, continuous, and bell shaped with 1 predominant peak per movement phase, 27 the performance for those with stroke demonstrated segmented velocity profiles with multiple peaks. When comparing these 3 examples of velocity profiles, the differences can be observed visually and also in the measure of smoothness (NMU) and movement time (TMT). The person with the lowest upper-extremity function (ARAT score of 24) demonstrates a highly segmented velocity profile together with slow TMT. In contrast, the person with the highest arm function (ARAT score of 54) shows a faster and smoother profile with more distinct movement phases.
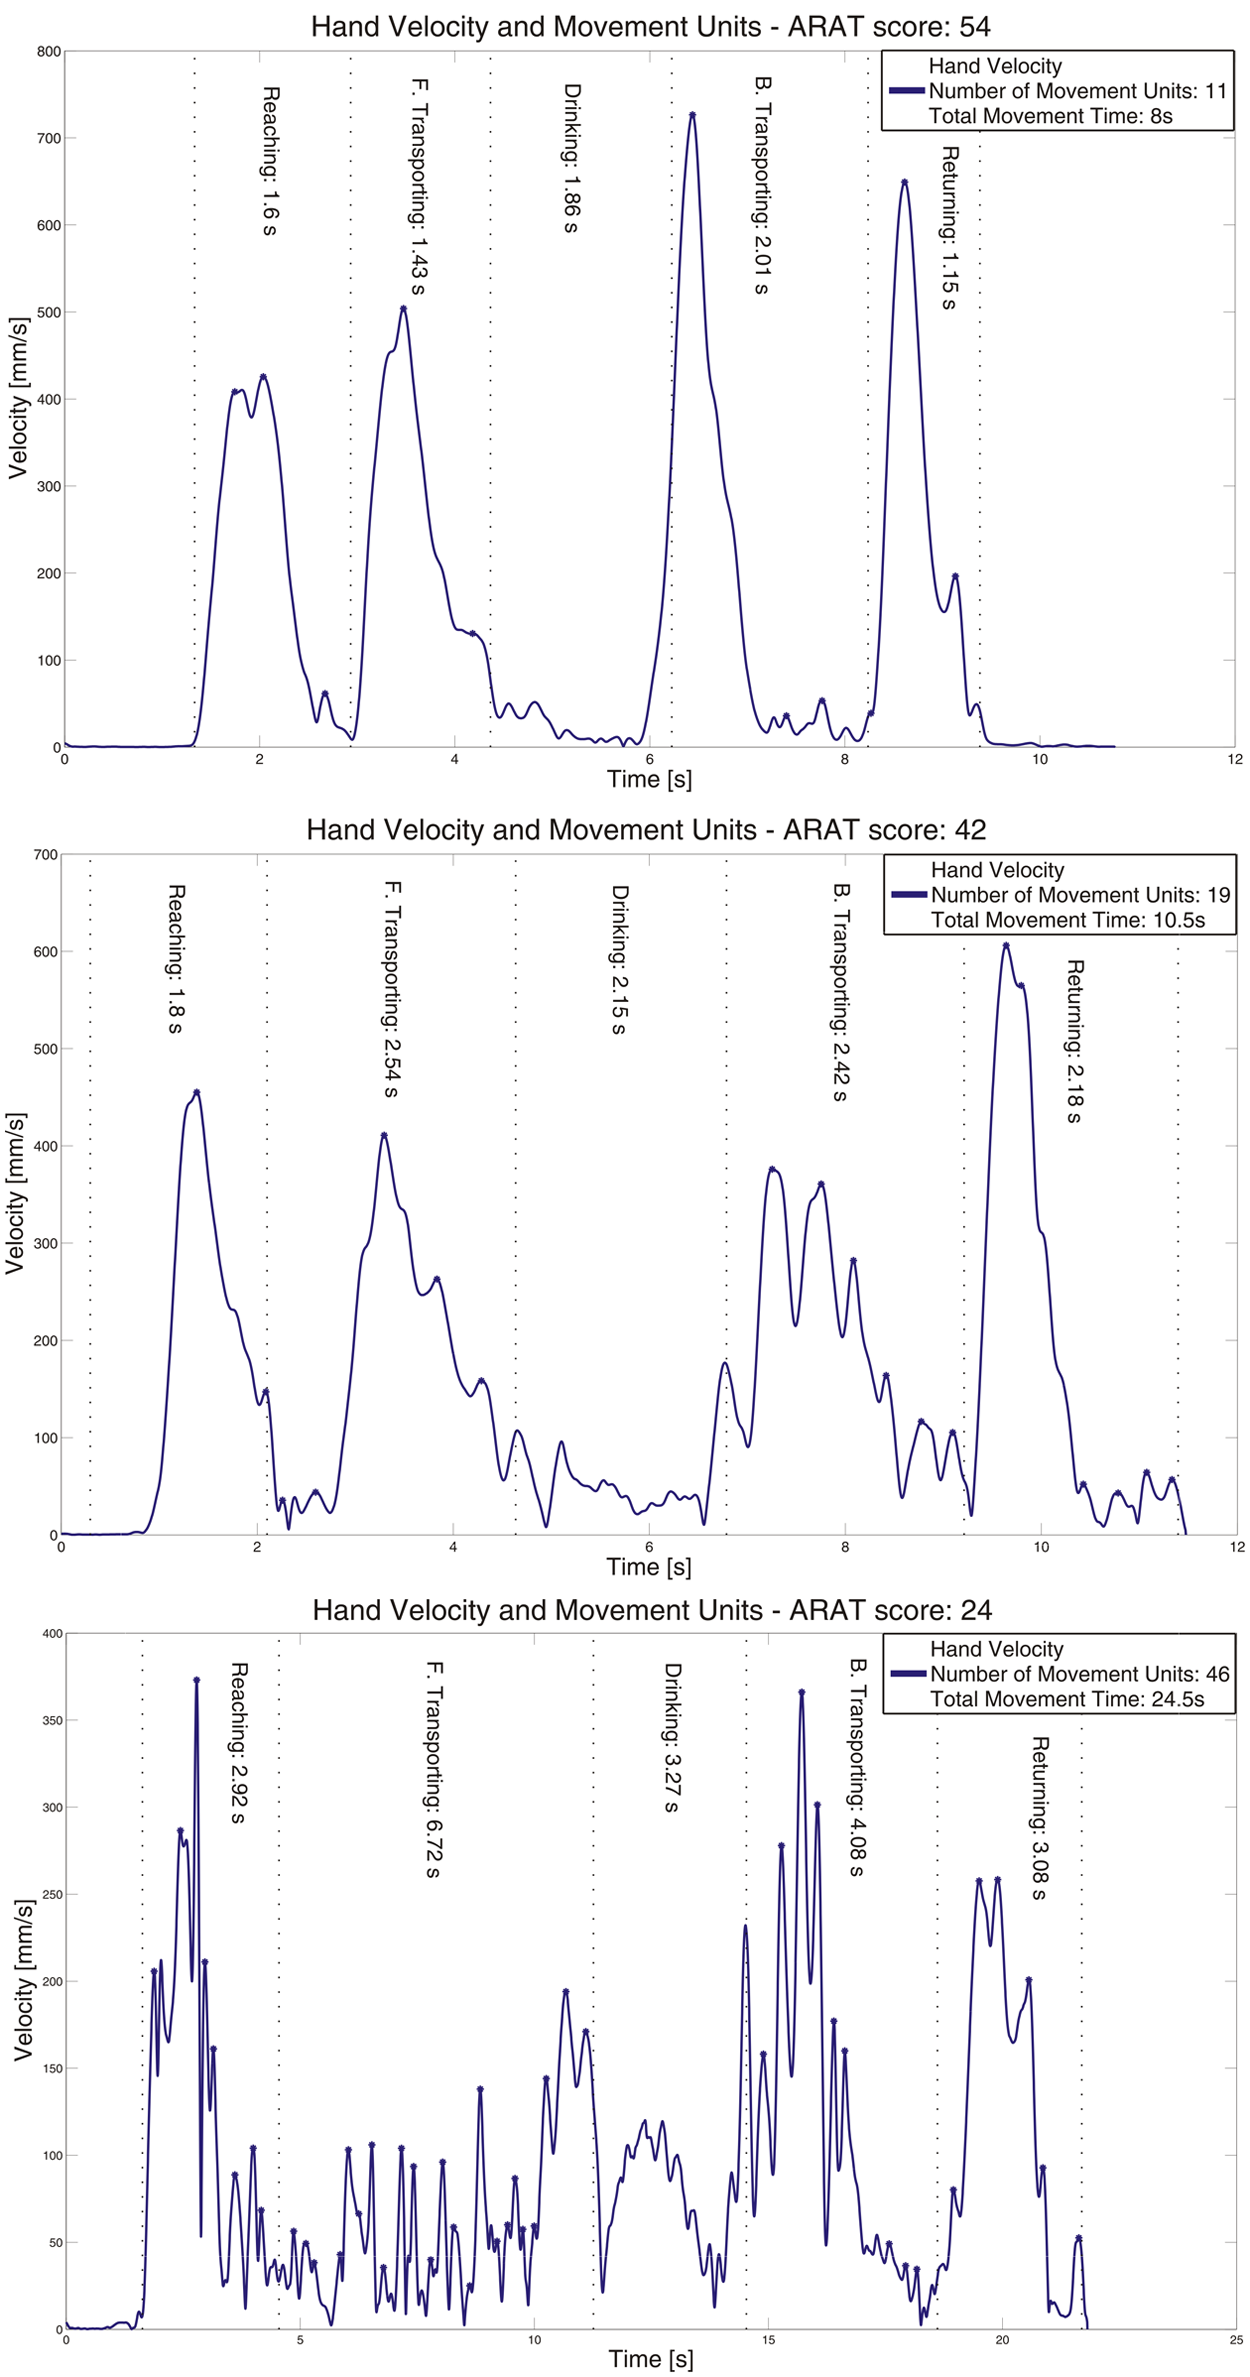
Tangential velocity profiles of the hand marker in 3 individuals with different functioning levels, according to the Action Research Arm test (ARAT). The measure of smoothness (number of movement units) and the total movement time are presented for every participant. Note that the movement time is different in these 3 examples.
All correlations between the clinical assessments and kinematics are displayed in Table 2. Activity capacity assessed with ARAT was significantly correlated with kinematic variables of smoothness (NMU, r = 0.81), movement time (TMT, r = 0.68), and compensatory TD (r = 0.63). The same kinematic variables correlated significantly with sensorimotor function, assessed with FMA, but the associations were weaker (r = 0.38-0.42).
Correlations Between Clinical Assessment Scales and Kinematic Variables a
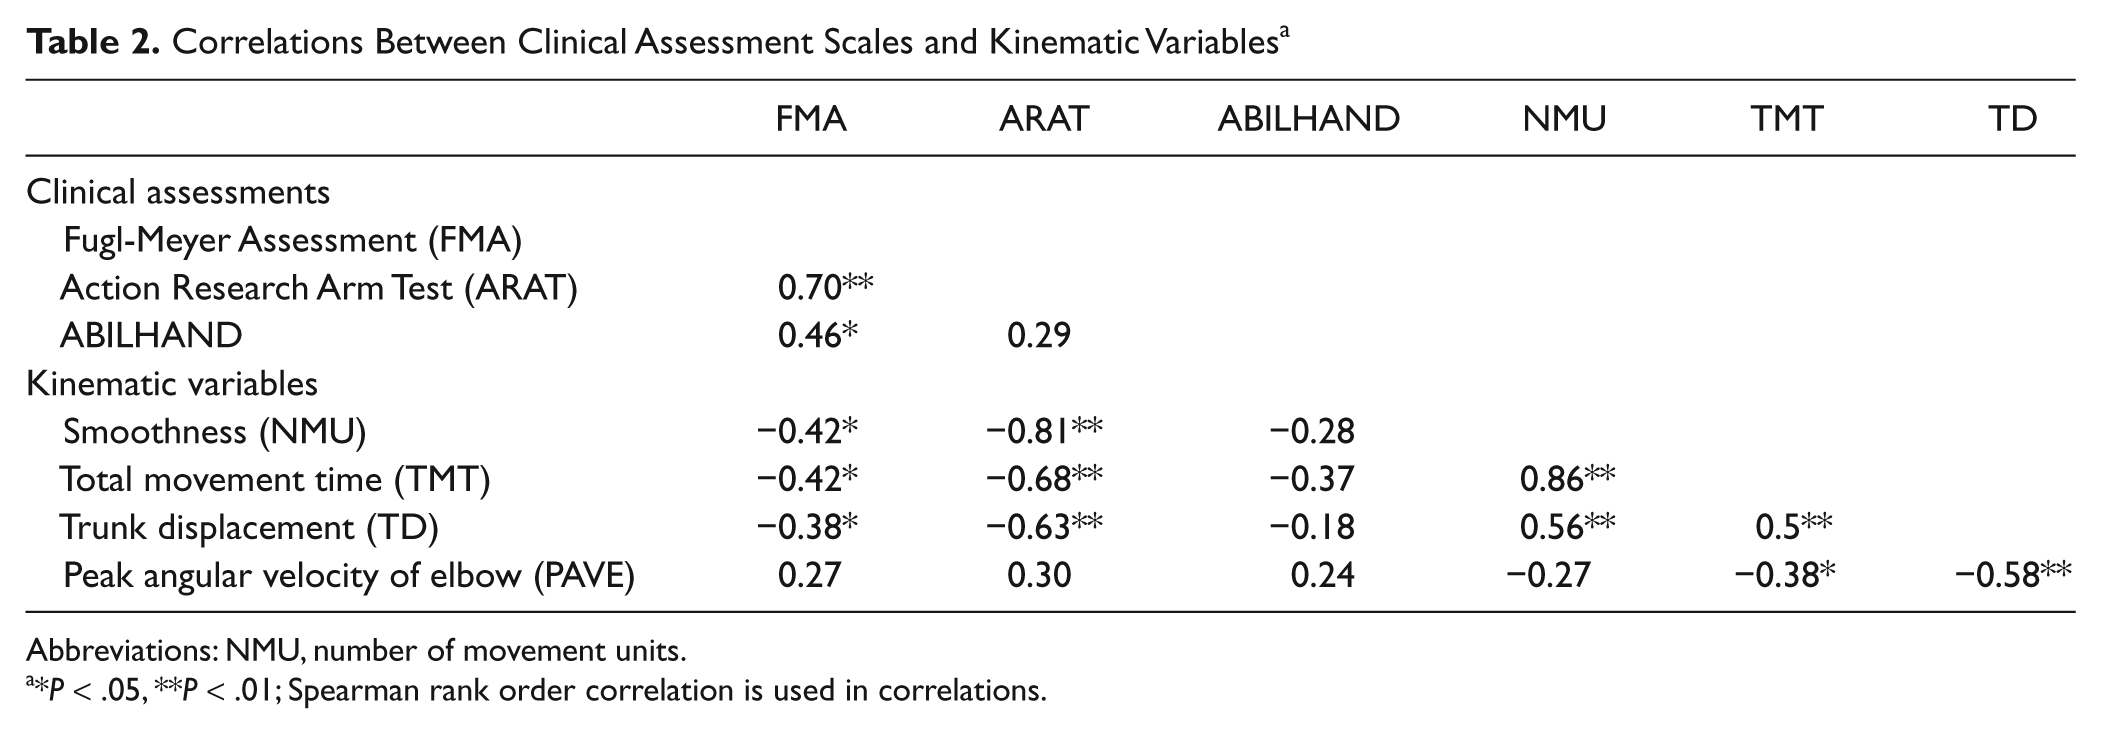
Abbreviations: NMU, number of movement units.
*P < .05, **P < .01; Spearman rank order correlation is used in correlations.
The kinematic variables, NMU and TMT, showed high collinearity and had a similar impact on the dependent variable in the regression models. For that reason, only the NMU was used in the multivariate models, but the TMT can be considered to have approximately the same impact in the regression models as the NMU. Age and gender variables showed no significant influence in any regression model.
The results of multiple linear regressions are presented in Table 3. The backward multiple regression revealed that kinematic variables could explain the largest amount of variance in the assessment of activity capacity, ARAT. The kinematic variables, NMU and TD, together explained 67% of the total variance, demonstrating a unique contribution of 37% and 11%, respectively (model 1).
Summary of Multiple Regression Analyses a
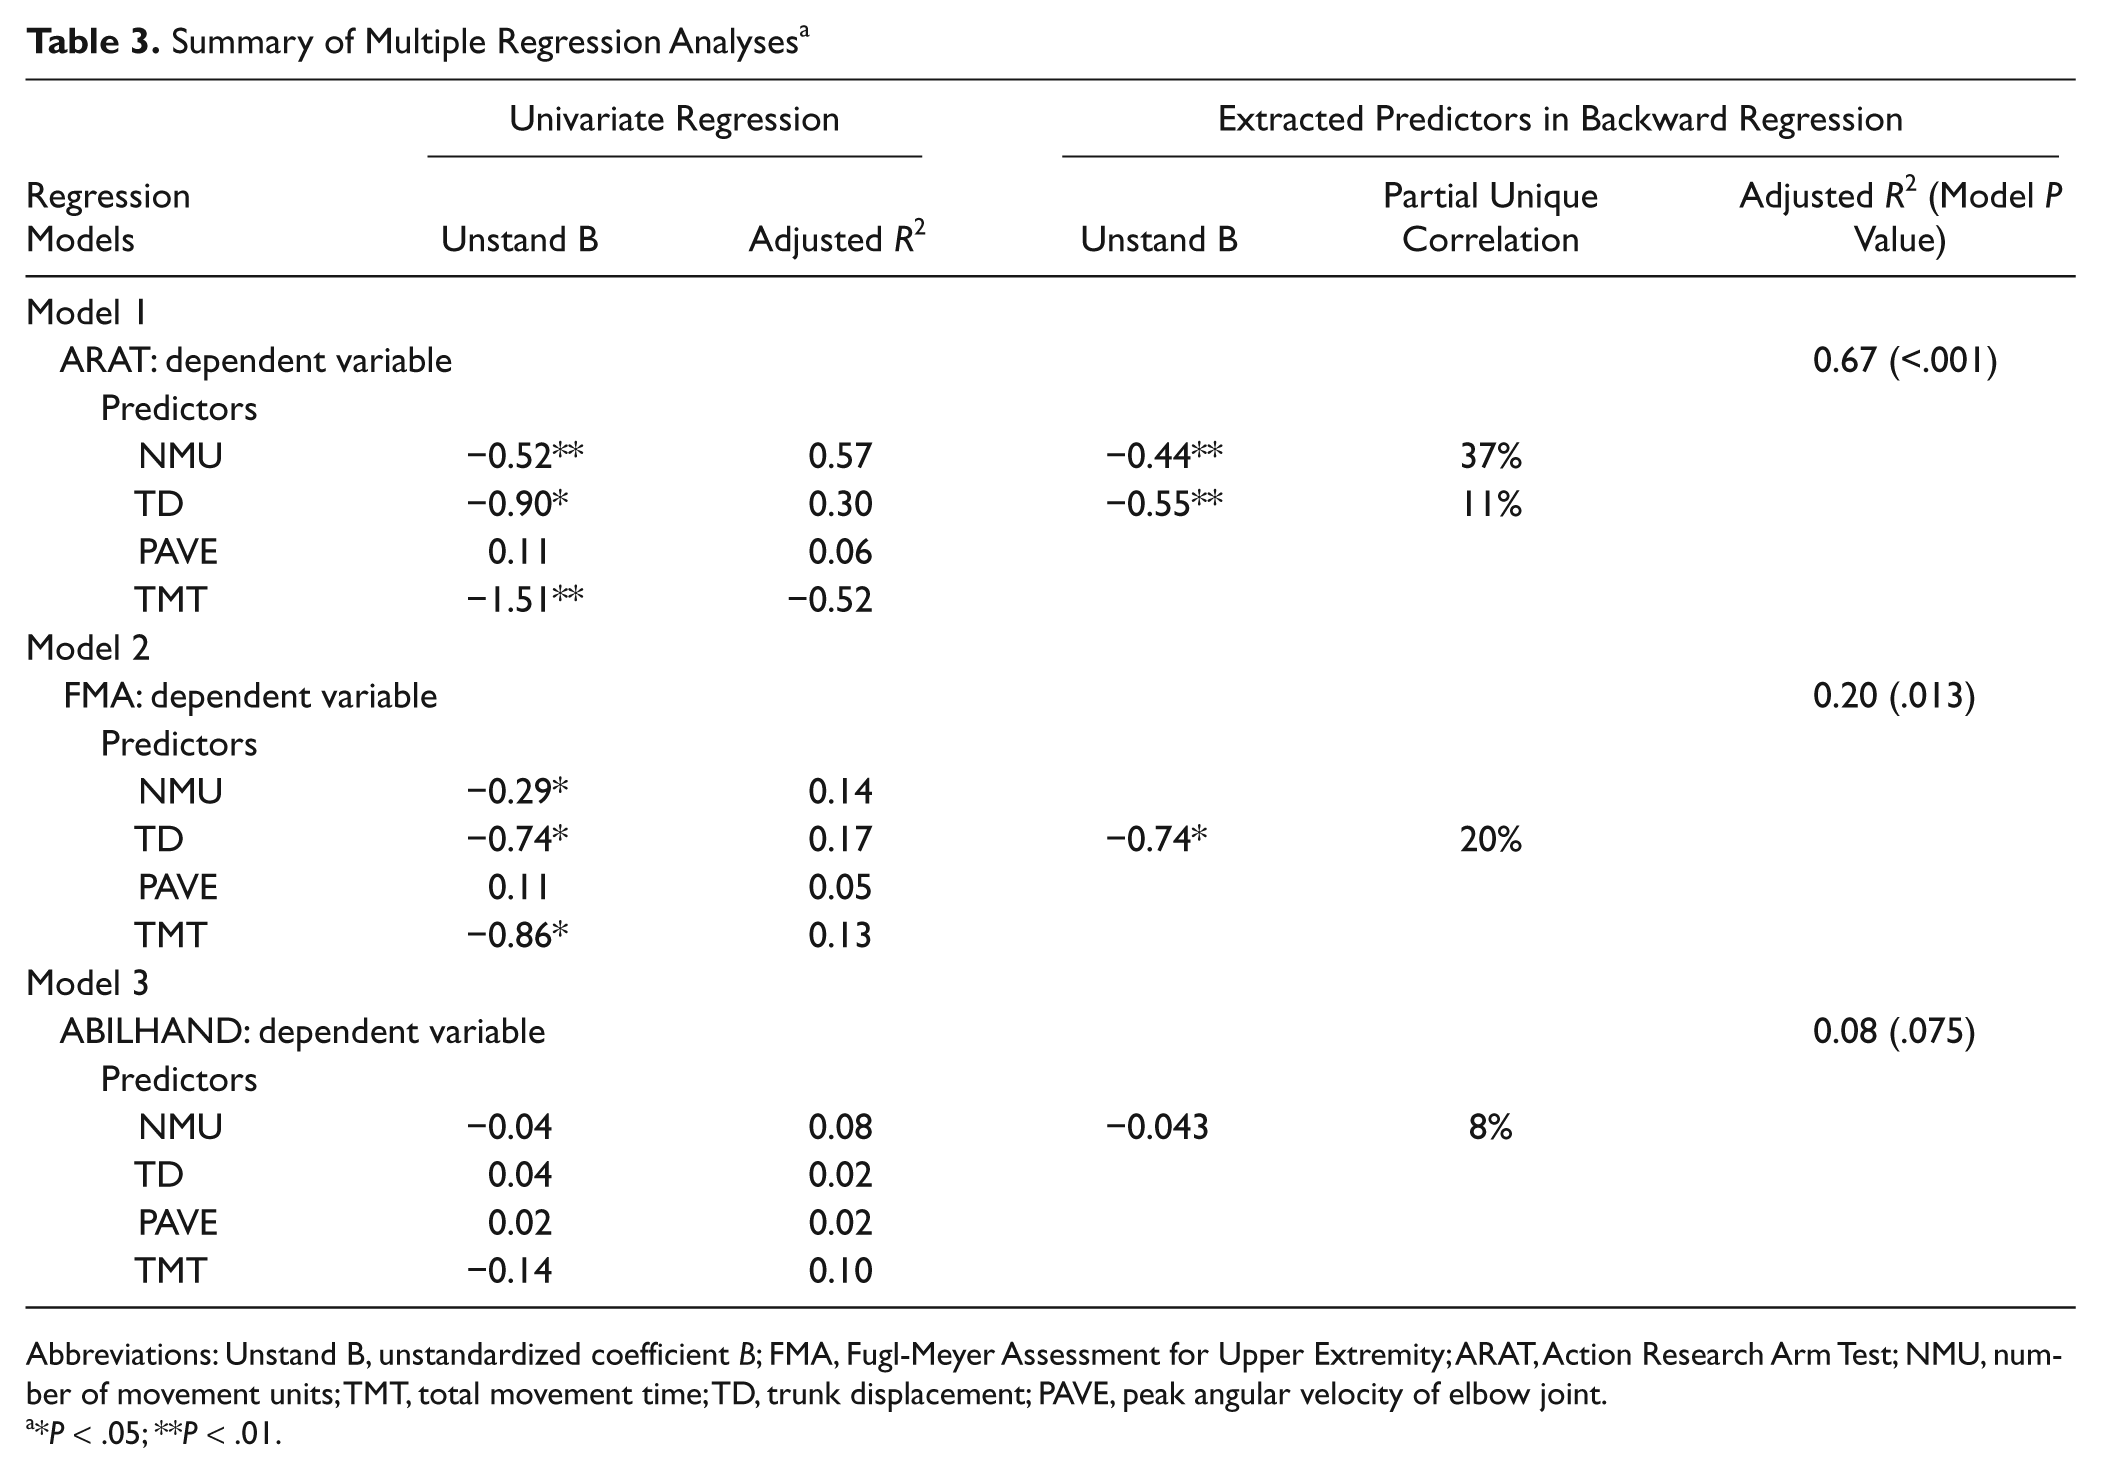
Abbreviations: Unstand B, unstandardized coefficient B; FMA, Fugl-Meyer Assessment for Upper Extremity; ARAT, Action Research Arm Test; NMU, number of movement units; TMT, total movement time; TD, trunk displacement; PAVE, peak angular velocity of elbow joint.
*P < .05; **P < .01.
In the model of FMA, the TD alone showed significant contribution to the model, accounting for 20% of the variance (model 2). In the model of ABILHAND, the kinematic variable NMU alone explained 8% of the variance (model 3).
Discussion
In this study, the objective kinematic measures of a purposeful functional activity—drinking from a glass—were examined along with traditional clinical assessments in individuals with mild to moderate impairment after stroke. Our results show that kinematic variables of a daily task are more strongly associated with activity capacity (ARAT) than with sensorimotor function (FMA). The greatest amount of variance in the activity capacity was explained by movement smoothness and TMT. TD explained a significant but smaller portion of the variance in the ARAT and in the FMA. The relationships between kinematics and self-perceived activity limitations in daily life were much weaker and not significant.
Activity Capacity
To our knowledge, this is the first study that investigates the relationships between kinematics of the upper-extremity performance and the activity capacity assessed with the ARAT. Our findings provide new information about these associations and indicate that kinematics of the upper extremity, at least the measures of movement time and smoothness, are to a large extent related to the activity or task performed by the person.
According to the ICF model, the variables of kinematic analysis describing the movement performance are generally classified at the level of body function, and the performed tasks are classified at the activity level.8,10 Thus, the purposeful movements or tasks contain elements that may be classified both in body function (analysis of movement segments) and in activity domains (task accomplishment). With reference to this rationale, we would have expected to demonstrate the strongest associations between kinematics and the measure of body function (FMA). However, the strongest associations in this study were found between kinematics and the measure of activity capacity (ARAT).
One possible explanation for our findings can be addressed to the specific components assessed on those 2 clinical scales. In ARAT scores, the aspects of task completion during a time limit, performance quality, and compensatory movements are assessed. In the FMA, the ability to perform isolated movements regardless of the time spent is assessed; the time component is assessed only in a subtest of coordination. This difference in assessment components might have influenced the degree of associations found between the ARAT scores and the movement times in our study. To illustrate this, the components assessed with clinical scales together with the results from regression analysis are presented schematically in Figure 2. Also, the movement smoothness demonstrated strong associations with ARAT scores. This can, possibly, be explained by the strong covariance between movement time and smoothness in our data set.
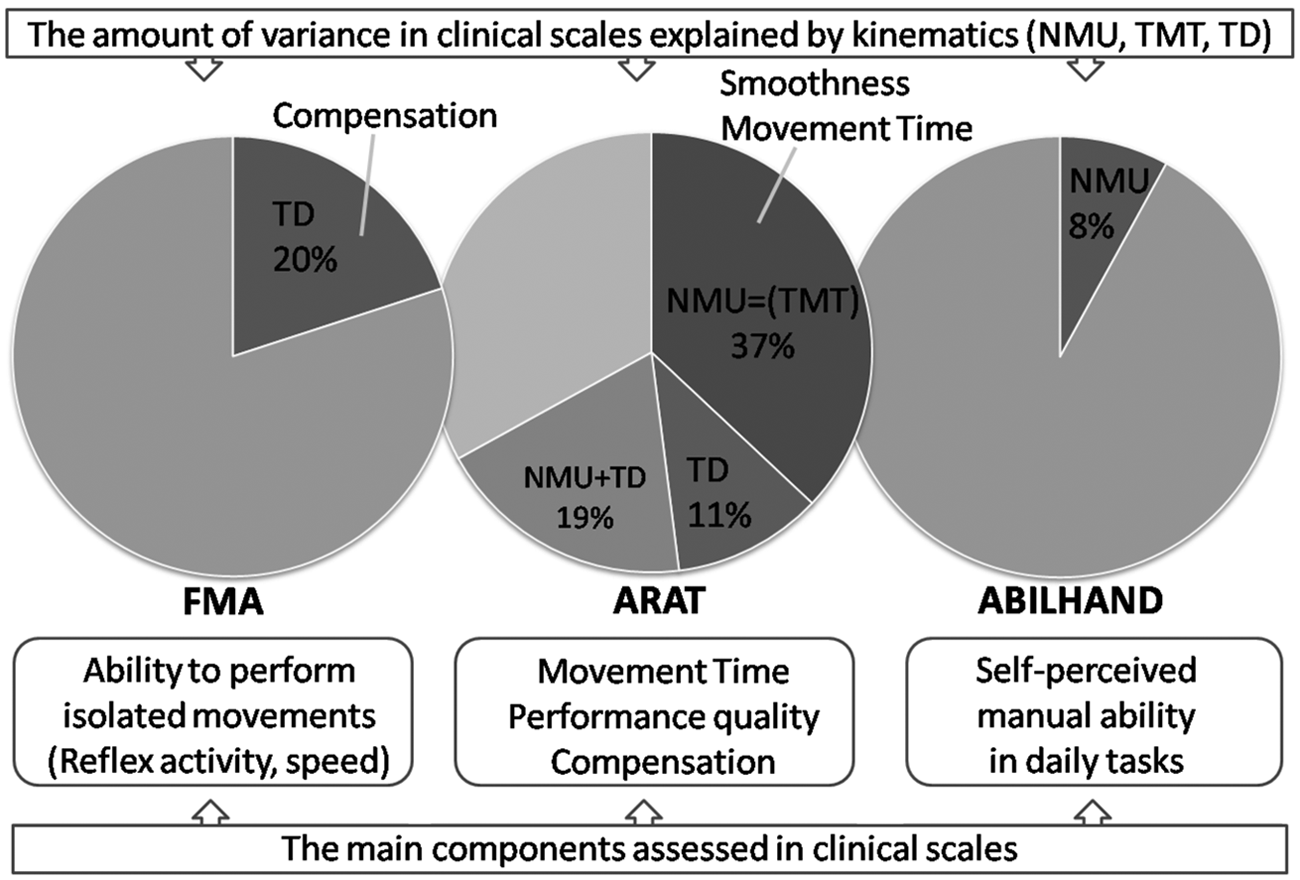
Schematic figure of the amount of variance in 3 clinical scales explained by the kinematic variables (labeled areas in circles). Nonlabeled area is the amount of variance not explained by the kinematics investigated in this study. The main components assessed with the traditional clinical scales (FMA, ARAT, and ABILHAND) are displayed on the bottom half of the figure. Abbreviations: NMU, number of movement units; TMT, total movement time; TD, trunk displacement; FMA, Fugl-Meyer Assessment for Upper Extremity; ARAT, Action Research Arm Test.
Conclusively, based on our results, the ARAT scores relate well with objective kinematic variables (movement smoothness, movement time, and TD), which indicate that the assessment with ARAT can reflect relatively closely a person’s actual movement performance in the drinking task. This finding provides valuable information about the ARAT and supports its validity as a clinical assessment scale. All 3 kinematic variables that showed significant associations with ARAT scores in this study have also proven to discriminate well between different sensorimotor impairment levels in stroke participants. 27
From the motor control perspective, the movement emerges from close interaction between the individual, the task, and the environment. 44 As the task and environmental constraints were stable in our experiment, the variations in kinematic variables mainly reflect the individual constraints resulting from stroke. According to motor control research, the movement performance on the kinematic level is considered primarily to be organized around joint-angle and end-point variables. 44 In the current study, the variable of movement time and smoothness correspond to the temporal aspects of the end-point movements, and the TD characterizes the movement of the body segment (trunk). In accordance with the motor control literature, the most common kinematic deficits described in those with stroke are prolonged movement times, discontinuous spatial and temporal movement trajectories, and abnormal movement patterns.27,28,32,33,36
Consequently, the results from our previous and current study give us increased confidence in suggesting that kinematic variables of movement time, smoothness, and compensatory movements of the trunk represent key measures of movement performance during a drinking task after stroke. There is, however, a further need to study if the same kinematic variables are valid and discriminative measures even in different tasks and in different patient groups (eg, in persons with Parkinson disease or with spinal cord injury).
Sensorimotor Function
In our study, the FMA was used to represent a clinical measure of sensorimotor impairment. The correlations between FMA and the kinematics were moderate, and TD was the only variable that showed a significant contribution to the regression model, explaining 20% of the variance in FMA scores. Somewhat stronger correlations between FMA scores and TD (r = −0.86) have been reported in a previous study with pointing movement. 32 In addition, a more recent study 13 with reach-to-grasp movement also reported strong correlations between FMA and TD (0.72) and showed that TD alone explained 52% of the variance in the FMA. Unfortunately, the measures of movement time, velocity, and smoothness were not included in the regression analyses in the above-mentioned study; thus, only comparison with TD is possible with our study. It should be noted that the participants in the above-mentioned studies13,32 were somewhat more impaired than in our study, probably because the pointing and reaching movements are less demanding compared with the drinking task. This difference in the study groups can be a possible explanation for this discrepancy in correlation coefficients between FMA and TD. In the literature, the use of compensatory TD has been shown to be larger in those with lower sensorimotor function levels.32,33
The relationships between single sensorimotor impairments after stroke and kinematics have been studied in a few other studies using reach-to-touch movements. In these studies,29,45 upper-extremity strength was strongly associated with the peak velocity and end-point error, and impaired joint individuation was associated with reach path curvature and end-point error.
Self-perceived Activity Performance
The correlations between kinematics and the ABILHAND were low in our study, suggesting that they are measuring different aspects of functioning after stroke. In addition, the ABILHAND measure is a questionnaire and not an observational measure, and it reflects the self-perceived difficulties in daily activities. It must be noted that in the ABILHAND, the person scores the difficulties during a manual task, and it is not a measure of how these tasks are performed. Additionally, the lack of self-awareness, measured as a discrepancy between patient and therapist ratings, is a common problem after stroke. It has been reported in earlier studies that 42% of persons with stroke show differences in ratings of the activities of daily living (ADL) disabilities. 46 The low correlation between kinematics and ABILHAND can, to some extent, also be a result of the fact that the difficulties in everyday activities most likely include many other contextual aspects than just a pure movement difficulty.
Clinical Relevance
In the current study, as well as in our previous study with a separate sample of individuals with stroke, we observed a high correlation between movement time and smoothness. This finding is particularly important from a clinical viewpoint and implies that movement time can be used as an indirect measure of movement smoothness. Considering the cost, availability, and knowledge needed for the kinematic analysis, the standardized timed testing could be a good alternative in the clinical setting to obtain indirect information about the quality of movements in clinical evaluation.
Although the clinical assessment scales may offer reliable information to clinicians, the objective, sensitive, and observer-independent kinematic analysis can provide even more detailed data about the movement performance and quality. Several investigators recommend that clinical trials should include traditional observational assessments along with objective measures in order to be able to identify genuine improvements and to distinguish between recovery and compensation.8,10,11 Because kinematic analysis is not available in all clinical settings, the studies combining both kinematics and clinical assessments are of great value and can lead to the development of better clinical outcome scales. Moreover, the use of more natural tasks in kinematic studies would offer even greater insight into the movement performance characteristics that are specific to these activities and of central interest to the person.
Limitations
As in other kinematic studies, our results can be generalized only to comparable tasks and variables used. Additionally, the number of kinematic variables entered into the regression model was restricted by the limited number of participants available in this study. At the same time, it has been proved that the variables included in this study discriminate well between different sensorimotor impairment levels in stroke participants 27 and are therefore of highest interest for the clinical studies.
Conclusion
This study provides new evidence in the neurological and rehabilitation research areas and demonstrates that kinematic variables obtained during a purposeful task of drinking are associated strongly with activity capacity in participants after stroke. Specifically, the person’s ability to generate smooth and well-paced movements without compensatory TD is strongly associated with higher activity capacity level on the ARAT Scale after stroke. Furthermore, the objective kinematic movement performance measures, movement smoothness, and time, possibly together with a measure of compensatory TD, are valid and predictive measures of activity capacity and can be considered as key variables in the evaluation of treatment effects or motor recovery after stroke.
Footnotes
Acknowledgements
We gratefully acknowledge the participants from Sahlgrenska University Hospital; our colleagues Hanna Persson, Anna Danielsson, and Eva-Lena Bustrén for practical help; Anna Ekman for statistical advice; and Dr Steve Murphy for customized software programming for kinematic data.
Declaration of Conflicting Interests
The author(s) declared no potential conflicts of interest with respect to the research, authorship, and/or publication of this article.
Funding
The author(s) disclosed receipt of the following financial support for the research, authorship, and/or publication of this article: This work was supported by the Local Research and Development Board for Gothenburg and Södra Bohuslän, the Regional Research and Development Board for Västa Götaland, the Norrbacka-Eugenia Foundation, the Foundation of the Swedish National Stroke Association, the Swedish Research Council (VR 2011-2718), Promobilia, Hjalmar Svensson’s Research Foundation, Greta and Einar Askers Foundation, Reneé Eanders Foundation, Rune and Ulla Amlövs Foundation, and John and Brit Wennerströms Foundation.