
Abstract
Background. Persons with stroke and hemiparesis walk with a characteristic pattern of spatial and temporal asymmetry that is resistant to most traditional interventions. It was recently shown in nondisabled persons that the degree of walking symmetry can be readily altered via locomotor adaptation. However, it is unclear whether stroke-related brain damage affects the ability to adapt spatial or temporal gait symmetry. Objective. Determine whether locomotor adaptation to a novel swing phase perturbation is impaired in persons with chronic stroke and hemiparesis. Methods. Participants with ischemic stroke (14) and nondisabled controls (12) walked on a treadmill before, during, and after adaptation to a unilateral perturbing weight that resisted forward leg movement. Leg kinematics were measured bilaterally, including step length and single-limb support (SLS) time symmetry, limb angle center of oscillation, and interlimb phasing, and magnitude of “initial” and “late” locomotor adaptation rates were determined. Results. All participants had similar magnitudes of adaptation and similar initial adaptation rates both spatially and temporally. All 14 participants with stroke and baseline asymmetry temporarily walked with improved SLS time symmetry after adaptation. However, late adaptation rates poststroke were decreased (took more strides to achieve adaptation) compared with controls. Conclusions. Mild to moderate hemiparesis does not interfere with the initial acquisition of novel symmetrical gait patterns in both the spatial and temporal domains, though it does disrupt the rate at which “late” adaptive changes are produced. Impairment of the late, slow phase of learning may be an important rehabilitation consideration in this patient population.
Introduction
Skilled human walking requires substantial flexibility to accommodate various behavioral goals and contexts. Motor adaptation, a practice-dependent alteration in movement caused by changes to feed-forward commands, 1 is one source of this flexibility. Relatively few studies have examined adaptations of human locomotion, particularly in persons with neurological deficits. 2 Hence it remains to be seen whether stroke and hemiparesis affect locomotor adaptability.
Unilateral stroke damaging leg regions of the corticospinal pathway produces a characteristic “hemiparetic gait” pattern associated with decreased speed, and asymmetric step lengths and single-limb support (SLS) times. Unfortunately, the high degree of spatial and temporal asymmetry is typically resistant to recovery via a variety of traditional gait retraining interventions.3-6 Given the notion that asymmetric walking is less energy efficient, can lead to overuse injuries, and may be related to increased risk of falls,7-9 interventions that could restore symmetric walking may have the potential to improve stroke rehabilitation outcomes. One report showed that locomotor adaptation via a split-belt treadmill temporarily restored step length and double support time symmetry in persons with poststroke hemiparesis. 2 This is significant because it suggests that there may be potential for longer term correction of asymmetric gait poststroke using locomotor adaptation strategies.
Recently, several split-belt adaptation studies have shown different effects on spatial versus temporal gait parameters, suggesting that different neural circuitry may be critical for adaptation of these 2 types of parameters.10-12 For instance, when healthy adults perform a distracting cognitive task during split-belt adaptation, presumably placing demands on cerebral cortical areas, the rate at which spatial, but not temporal, gait parameters adapt is decreased. 10 This suggests that adaptation of spatial aspects of locomotion may, in part, be mediated by cerebral connections with the cerebellum. Similarly, a study of the age-related development of split-belt adaptation found that typically developing young children show impaired spatial but not temporal parameter adaptation. 12 Because the cerebellum matures relatively late, this finding also supports a specific role for cerebrocerebellar circuits in adaptation of spatial locomotor components. In contrast, split-belt adaptation of interlimb phasing, a purely temporal measure, is disrupted in children with hemispherectomy, whereas step length is not. 11 The reason for the discrepancies among these studies, and between these and the only split-belt adaptation study in adults with stroke and hemiparesis, is not clear. It should be noted that neither of the studies examining persons with cerebral lesions separately compared purely spatial versus purely temporal locomotor components.2,11 Specifically, although step length is often viewed as a spatial measure, on a treadmill, it can be adjusted via either a spatial or a temporal shift alone. 10 Thus adaptive changes in step length could result from adjustments in either domain. Hence it is unknown whether both spatial and temporal gait parameters adapt normally in persons with stroke and hemiparesis. Similarly, rates of locomotor adaptation have not previously been examined in this patient population. It is possible that adaptability may be intact but slowed to some degree in poststroke hemiparesis.
The split-belt treadmill paradigm produces step length adaptation but not adaptation of SLS time,2,13 which is almost always asymmetric in hemiparetic gait.14,15 Recently, we developed a novel locomotor adaptation paradigm that drives adaptation of both step length and SLS time in healthy adults. 16 The paradigm involves perturbing one side with the addition of a mass resisting forward movement of the lower leg during the swing phase, 16 which differs from the split-belt paradigm in that limb dynamics are altered. As such, it may represent a more real-world adaptive condition, similar to the addition of a leg brace. Given the clear role of cerebral motor regions in controlling force production17-19 and the fact that adaptation to a change in limb dynamics is likely to differ from adaptation to changed kinematics, 20 it is unclear whether locomotor adaptation requiring overcoming such a resistance is impaired in persons with stroke and hemiparesis.
The purpose of this study was to determine whether a locomotor adaptation that requires overcoming a novel swing-phase resistance is impaired in persons with chronic stroke and hemiparesis. We specifically wanted to compare the adaptability of pure spatial versus temporal gait parameters, measure the adaptability of SLS times, and compare rates of adaptation, which heretofore have not been reported in this population. If cerebral motor structures controlling leg movements are necessary for locomotor adaptation of spatial gait parameters,10,12 we would expect persons with poststroke hemiparesis to demonstrate reduced adaptation of the step length spatial component. In contrast, if the same regions are necessary for adaptation of temporal parameters, 11 we would expect to see impaired adaptation of the step length temporal component as well as SLS time.
Methods
Participants
A total of 14 participants with stroke and hemiparesis (see Table 1) and 12 controls (60.8 ± 12.7 years, mean age ± 1 standard deviation [SD]; 7 women) enrolled in the study. All participants gave written informed consent prior to participation, and appropriate institutional review boards approved the study. Participants with stroke were included if they had a history of unilateral ischemic stroke occurring >9 months prior, resulting in contralateral lower extremity paresis, and were able to walk at ≥0.4 m/s. Lesion location was determined by CT or MRI and categorized by a neurologist as cortical, subcortical, and/or brainstem. Participants were excluded if they had evidence of damage to both hemispheres or the cerebellum, existence of another neurological or orthopedic condition affecting either leg, scored <22 on the Mini-Mental State Examination, 23 or had another medical condition that would alter performance or place them at risk during walking. Controls were required to be generally healthy and not have any significant neurological or orthopedic conditions.
Characteristics of Stroke Participants a
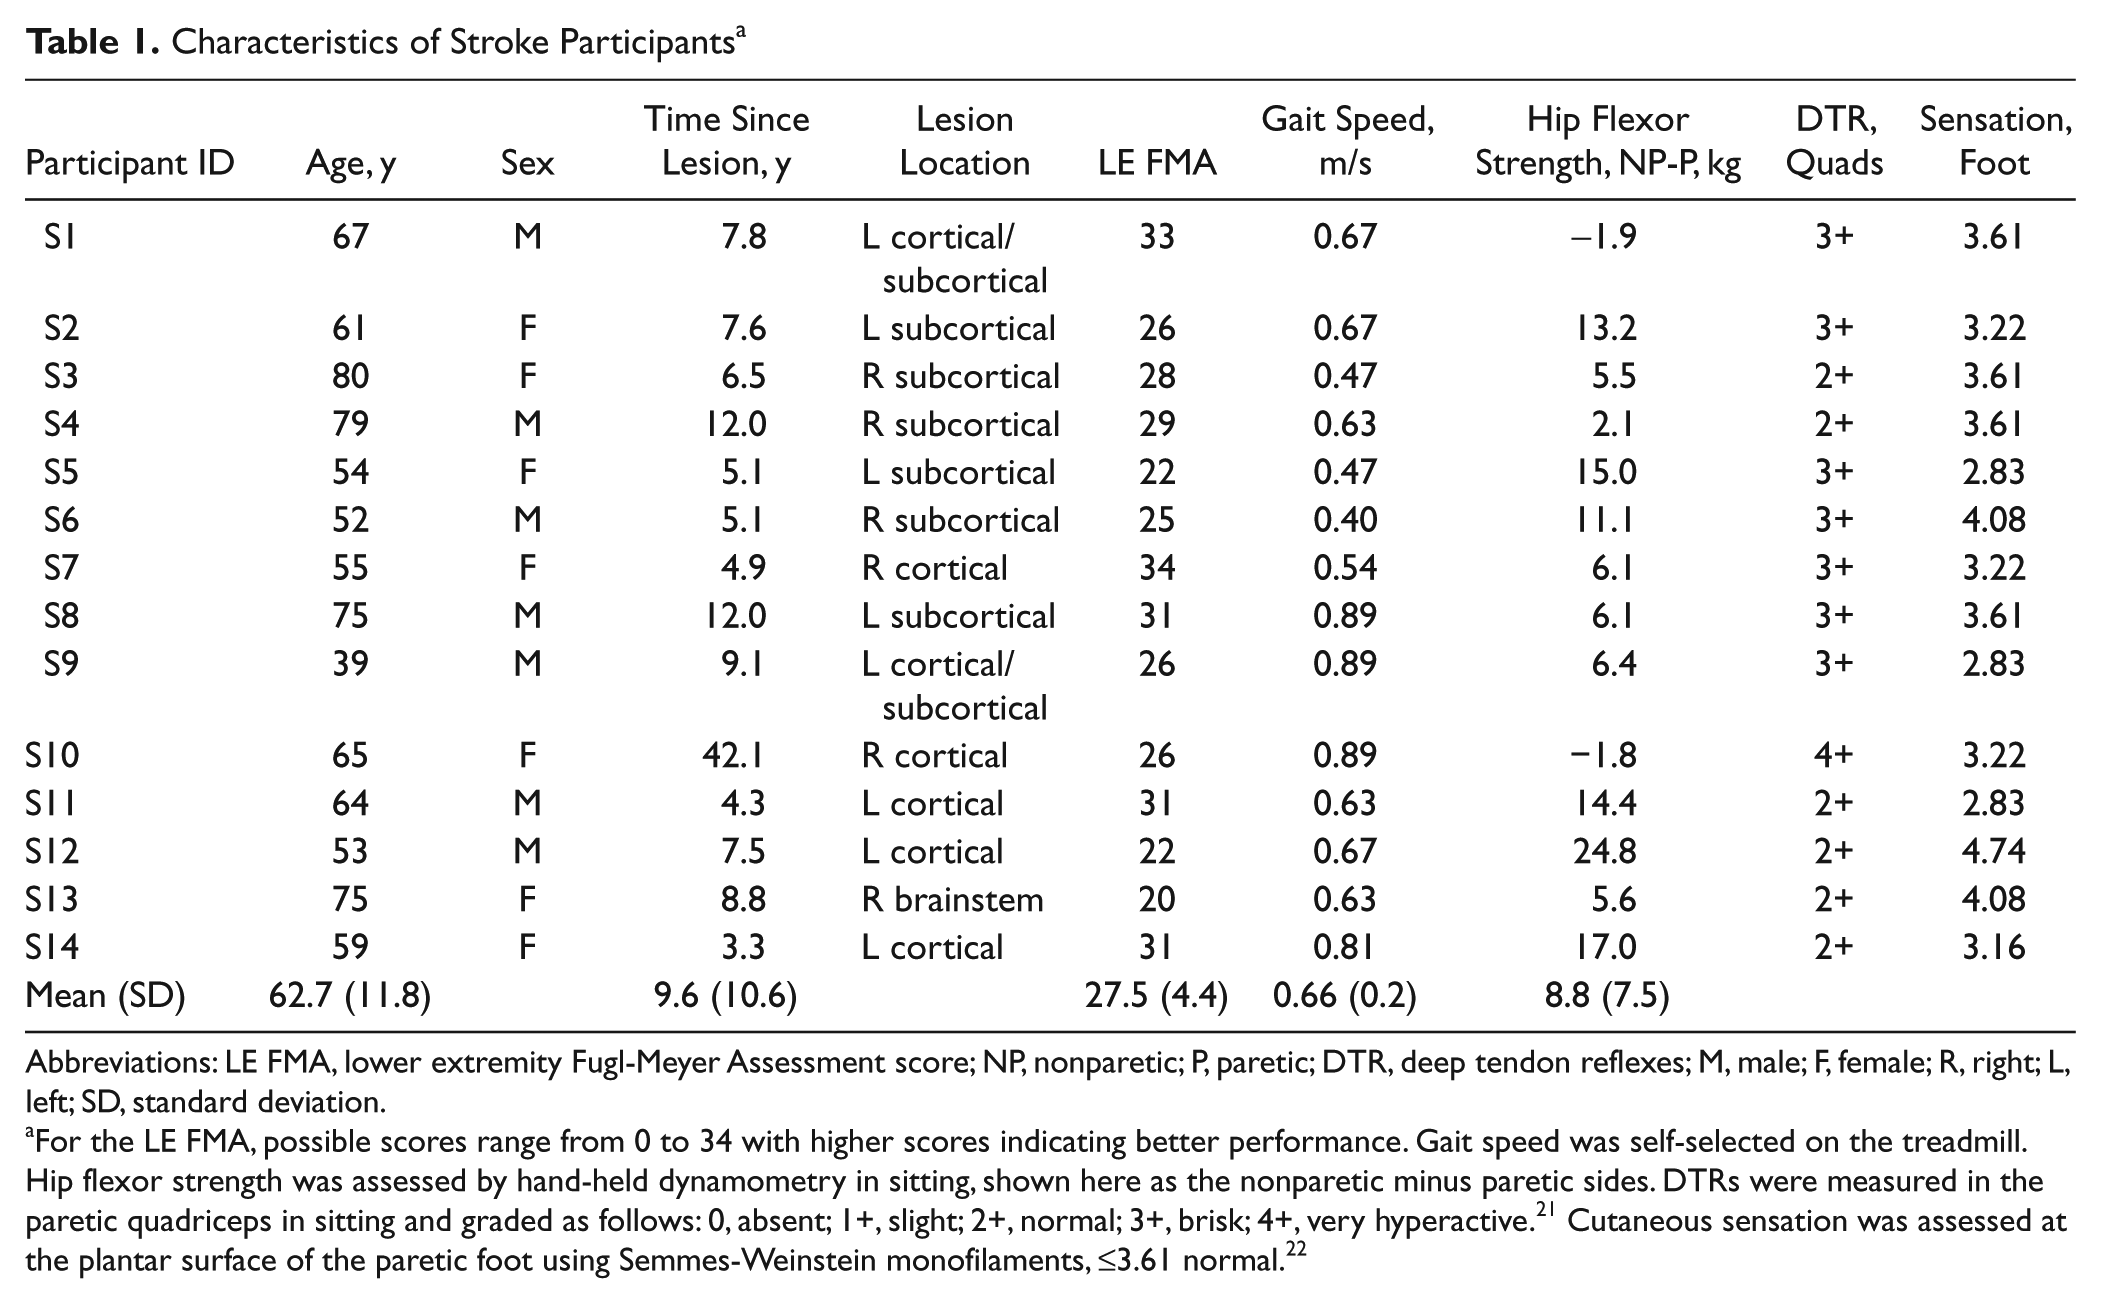
Abbreviations: LE FMA, lower extremity Fugl-Meyer Assessment score; NP, nonparetic; P, paretic; DTR, deep tendon reflexes; M, male; F, female; R, right; L, left; SD, standard deviation.
For the LE FMA, possible scores range from 0 to 34 with higher scores indicating better performance. Gait speed was self-selected on the treadmill. Hip flexor strength was assessed by hand-held dynamometry in sitting, shown here as the nonparetic minus paretic sides. DTRs were measured in the paretic quadriceps in sitting and graded as follows: 0, absent; 1+, slight; 2+, normal; 3+, brisk; 4+, very hyperactive. 21 Cutaneous sensation was assessed at the plantar surface of the paretic foot using Semmes-Weinstein monofilaments, ≤3.61 normal. 22
Paradigm
Details of the paradigm have been previously published. 16 Participants walked on a treadmill (Woodway, Waukesha, Wisconsin) during Baseline, Adaptation, and Postadaptation conditions, lasting 5, 10, and 10 minutes, respectively. A custom-made cuff was secured around one of the lower legs. Following Baseline, the cuff was connected to a pulley system via a rope, which provided a resistance (a hanging mass equal to approximately 1.25% of body weight) to that leg’s forward movement (Figure 1A). At the end of Adaptation, the rope was detached from the cuff. Participants with stroke walked at a self-selected speed without walking aids. Controls matched the speed of a participant with stroke for whom they were an age (±5 years) and sex match. All wore safety harnesses that did not provide body weight support. Participants were instructed to hold the front hand rail, avoid looking at their feet, and walk as normally as possible. Participants with stroke were tested twice, approximately 1 month apart. Assignment of the perturbed side was counterbalanced between paretic and nonparetic legs across the 2 sessions.
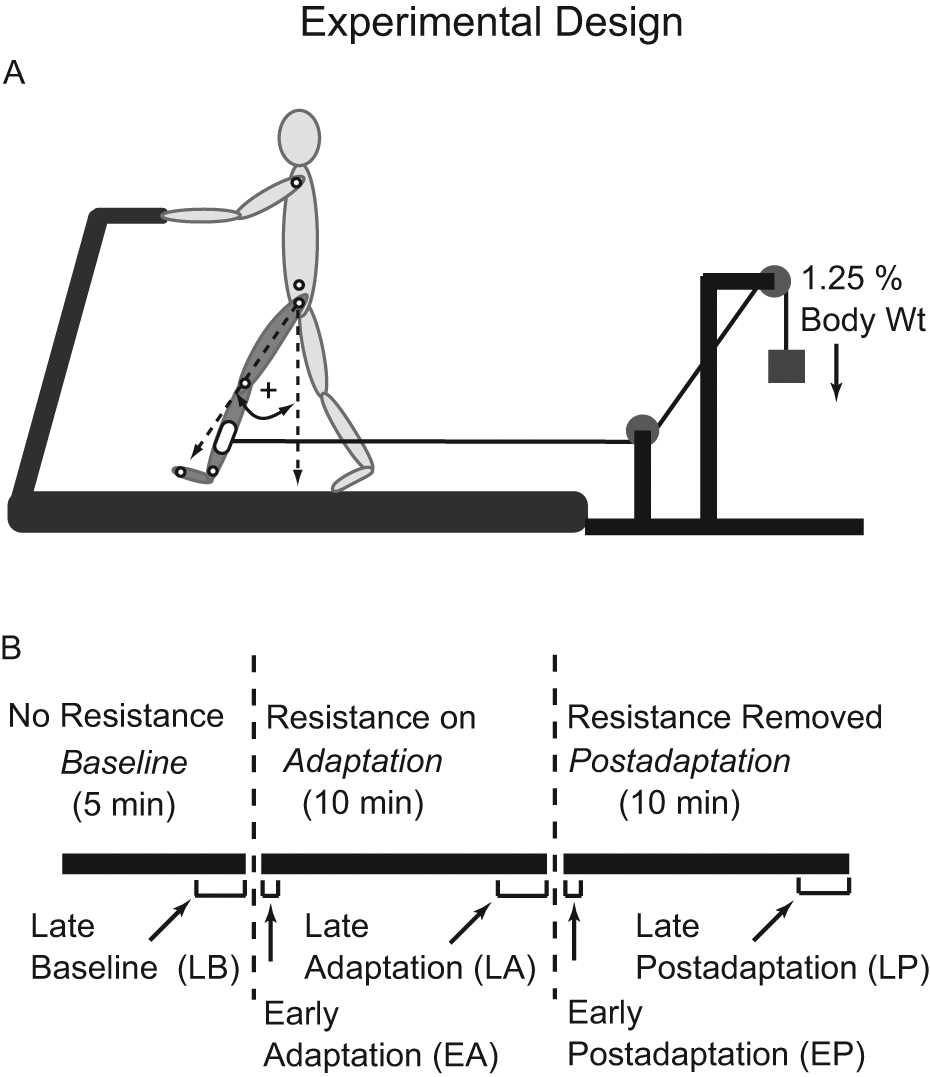
A. Treadmill setup showing application of the resistive force and the method for calculating limb angles. Small open circles indicate marker positions. B. Time course of experimental conditions and testing periods.
Data Collection
Leg kinematics were collected via 2 Optotrak Certus position sensors (Northern Digital Inc, Waterloo, ON, Canada) with infrared emitting diodes marking the metatarsophalangeal, ankle, knee, hip, and shoulder joints bilaterally and the pelvis (Figure 1A). Position data were recorded at 100 Hz.
Data Analysis
Data were analyzed with custom-written MATLAB software (MathWorks, Natick, Massachusetts). Position data were low-pass filtered at 6 Hz. Strides were identified as the time between 2 consecutive initial contacts on the same foot, then further separated into stance (initial contact to lift off) and swing (lift off to next initial contact) durations. Initial contact was defined as the ankle marker maximum forward position, and lift-off time was defined as the metatarsophalangeal marker maximal backward position. 24
We quantified gait adaptation with 2 kinematic measures frequently affected in poststroke hemiparesis: step length symmetry and SLS time symmetry. Step length was defined as the distance between ankle markers at initial contact. SLS time was the portion of stance when the contralateral leg was in swing, measured as a percentage of total stride time. Symmetry was calculated with a symmetry index,

where Xu is the value (eg, step length) for the unperturbed leg, and Xp is the value for the perturbed leg. 24
To parse step length adaptation into its pure spatial and pure temporal parameters, we calculated limb-angle center of oscillation (CoO) and interlimb phasing. 10 Limb angle was defined as the angle between a vector connecting the hip and metatarsophalangeal markers and a vertical line bisecting the hip marker. 25 CoO was the limb angle midpoint between initial contact and lift off about which each leg oscillated, 10 reported as the difference between the unperturbed and perturbed legs. Interlimb phasing was the lag time at the peak of the cross-correlation function of the limb angles of both legs during 2 consecutive strides.
We quantified the rate of adaptation of step length and SLS time data. First, stride-by-stride data for each participant were condensed by averaging every 3 strides. Then, because of the high degree of variability, the data were averaged across all participants in each group, creating a single composite result for each group. A unique double exponential curve was then fit to the averaged group data 26 using the general form,

where c and f are exponential decay constants, representing the number of strides required for the adaptation to asymptote during the initial, fast and later slow portions of adaptation, respectively. We selected a double exponential function because recent investigations have suggested that motor adaptation occurs in 2 distinct phases: an initial, fast period followed by a second slower period. 27
Statistical comparisons were completed using Statistica software (StatSoft, Tulsa, Oklahoma). We compared step length and SLS time symmetry, CoO, and phasing outcomes during the following 5 testing periods: Late Baseline, Late Adaptation, Late Postadaptation (averaged last 50 strides of each), Early Adaptation, and Early Postadaptation (averaged first 5 strides of each) (see Figure 1B). We used a factorial analysis of variance (ANOVA) with factors Group (control vs stroke paretic leg perturbed vs stroke nonparetic leg perturbed) and Testing Period. When appropriate, post hoc analyses were performed using Tukey honestly significant difference test. For all, statistical significance was set at P < .05. Because adaptation rates were measured as single values for each group, we determined statistical significance to be any stroke group rate falling outside the control group 95% confidence interval (CI) generated during curve fitting. The 95% CI indicates the boundaries beyond which there is a probability <.05 that an experimentally obtained adaptation rate could truly represent the healthy adult population. 28 In the text, group data are presented as means ± 1 SD.
Results
Figure 2A shows step length symmetry on a stride-by-stride basis for a control and a participant with stroke. Though the participant with stroke was asymmetric during Baseline walking, both adapted similarly. The perturbation initially caused step length symmetry indices to increase, but this gradually returned toward baseline levels as walking continued. Similarly, removing the perturbation initially resulted in negative aftereffects of decreased step length symmetry indices. Again, this was gradually restored back toward baseline levels. Figure 2B shows averaged results for all groups and testing periods. The ANOVA produced a main effect of testing period (P < .0001) but no significant group or interaction effects. Post hoc analysis indicated that the perturbation produced an immediate change in step symmetry (0.122 ± 0.122, Early Adaptation vs 0.008 ± 0.065, Late Baseline; P < .0001). This was because step lengths changed bilaterally for all groups (see Table 2). By Late Adaptation, step symmetry adjusted back toward but remained above Late Baseline values (0.058 ± 0.074; P < .01). When the perturbation was removed, a clear negative aftereffect was present (−0.110 ± 0.098, Early Postadaptation; P < .0001). This was again a result of step lengths changing bilaterally for all groups (Table 2). Step length symmetry returned to near-Baseline levels by the end of Postadaptation (0.002 ± 0.075). Note that participants with stroke were able to adjust step length symmetry in either direction.
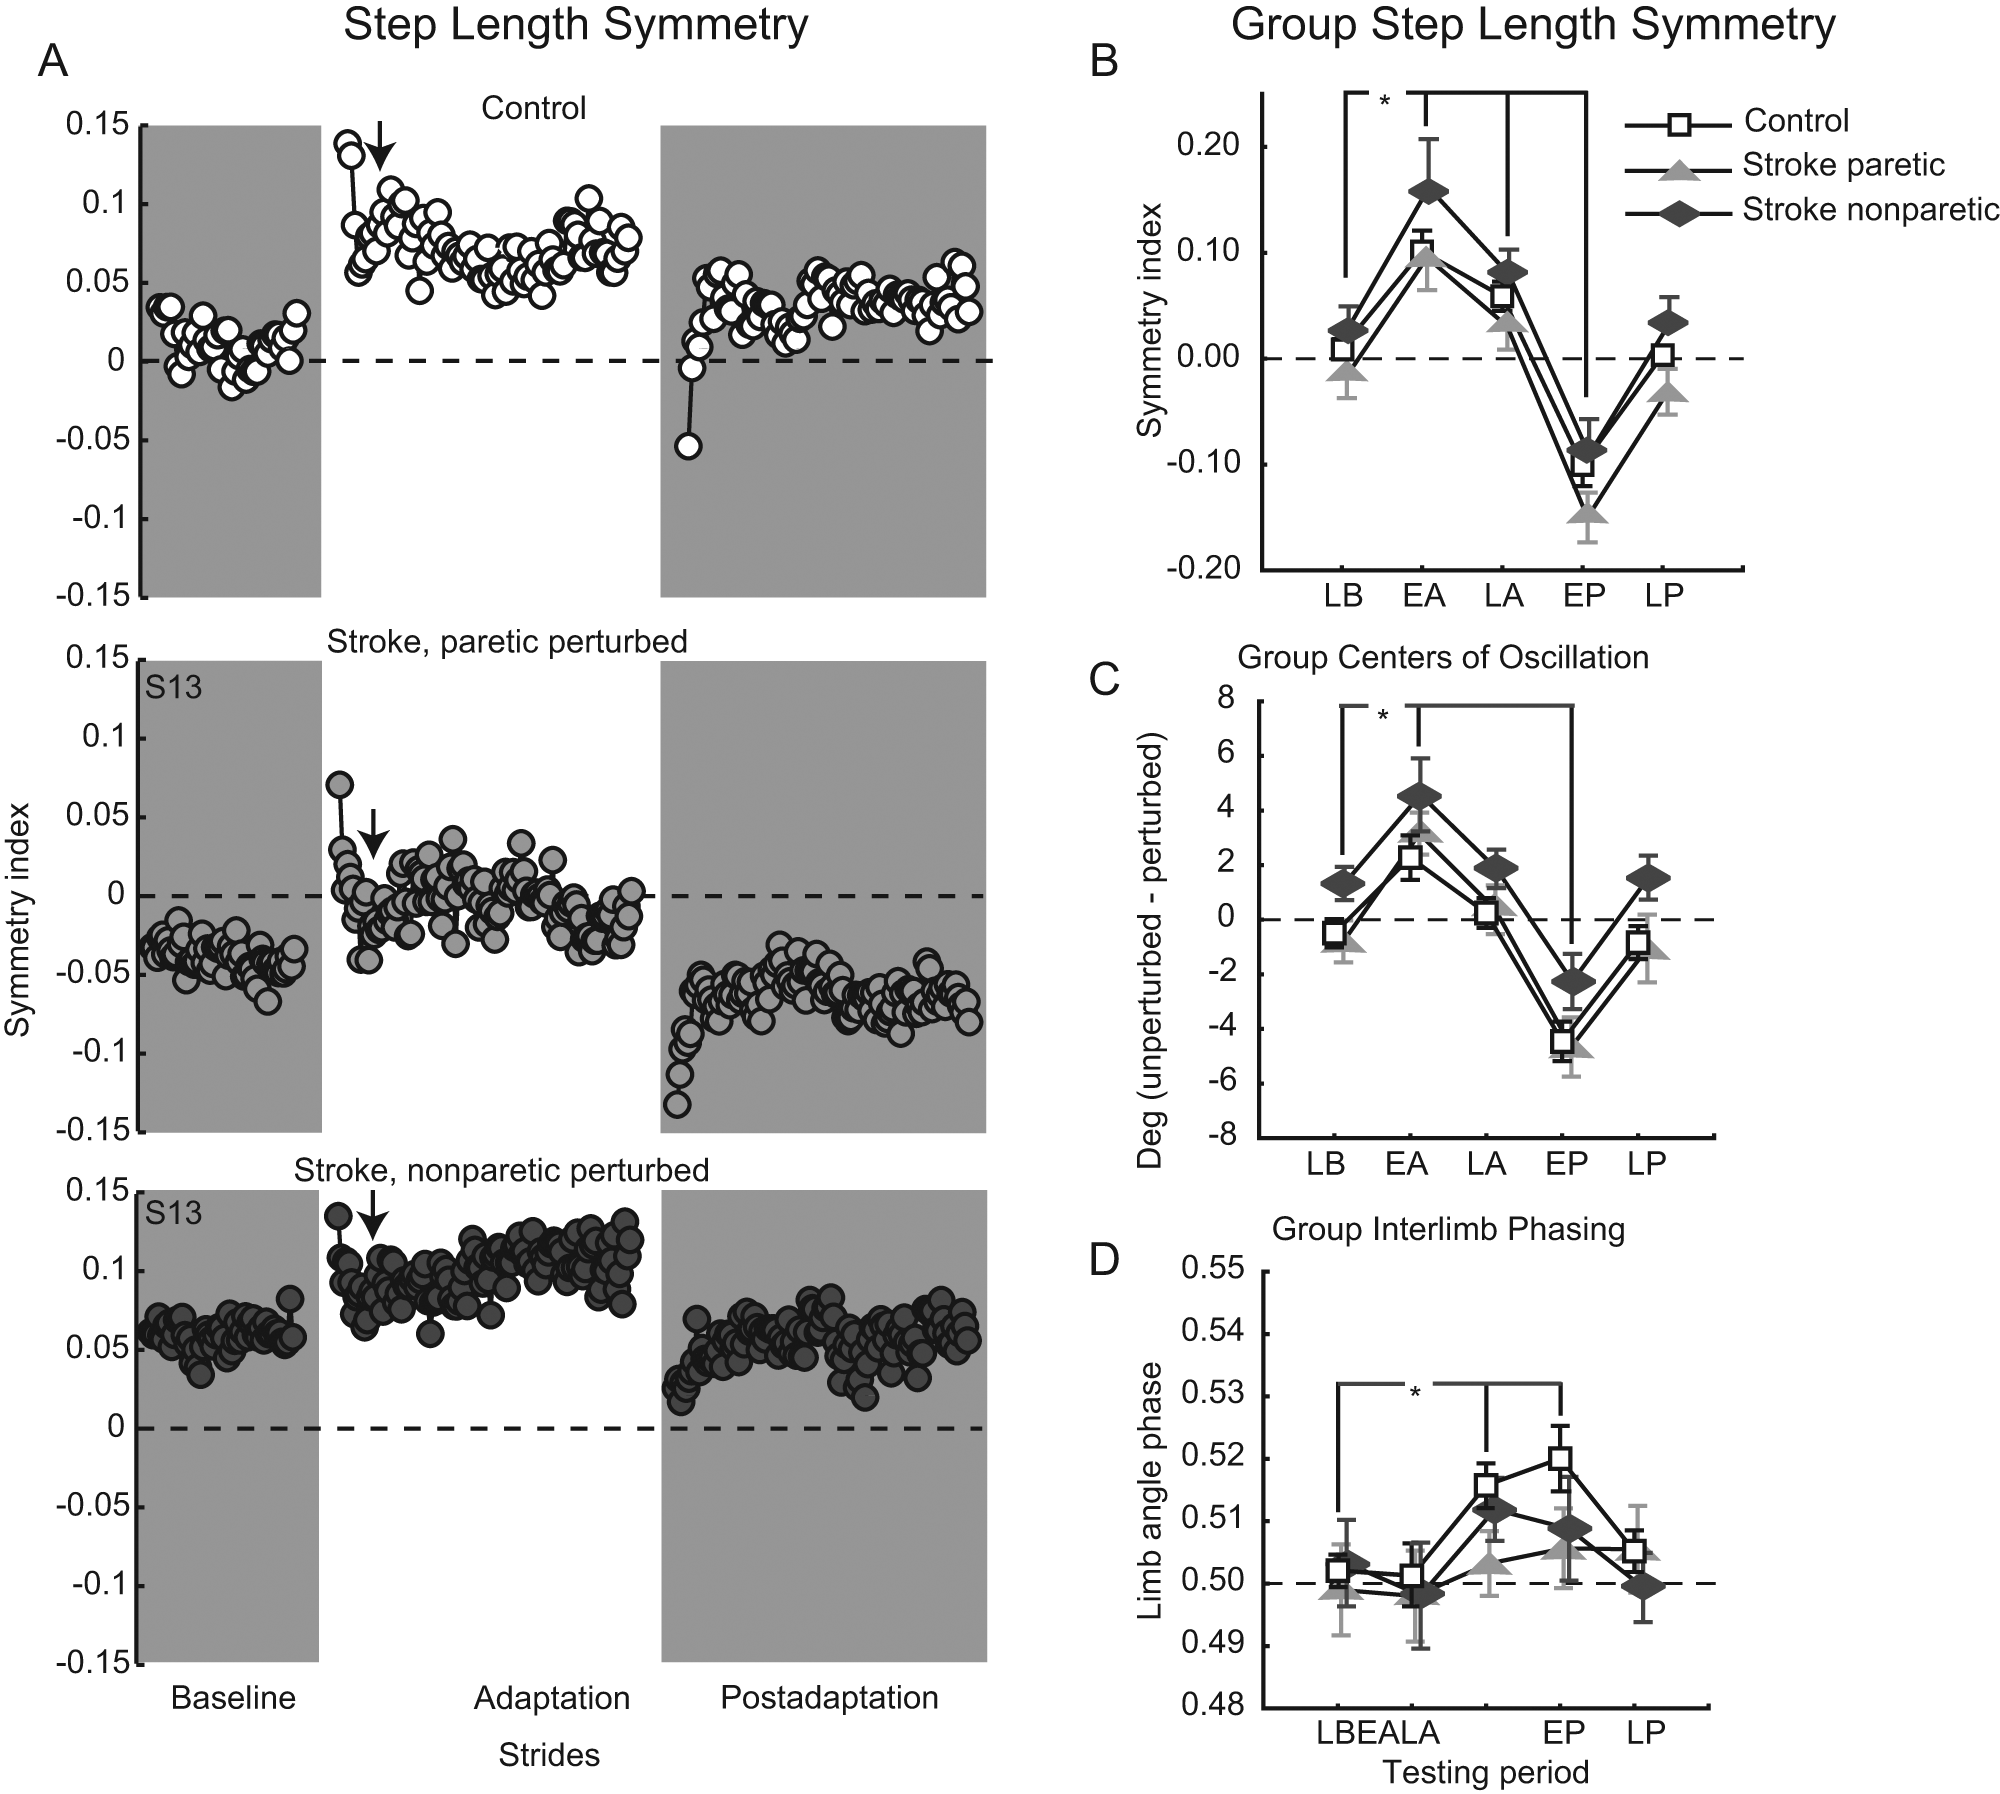
A. Step-length symmetry over all conditions for a typical control (top) and participant with stroke, paretic leg perturbed (middle), and nonparetic leg perturbed (bottom). Each circle represents the average step length symmetry index for 3 consecutive strides. Arrows indicate the approximate transition point between the initial, fast and late, slow adaptation components. B-D. Group average step length symmetry indices (B), center-of-oscillation differences (C), and interlimb phasing (D). Collapsing across participant groups, asterisks indicate a significance of P < .05 from the testing period post hoc comparison of each versus Late Baseline. Late Baseline (LB), Early Adaptation (EA), Late Adaptation (LA), Early Postadaptation (EP), Late Postadaptation (LP) are shown. Error bars, ± 1 standard error of the mean. For all panels, dashed horizontal lines represent perfect symmetry.
Group Results, Separated Out by Side a
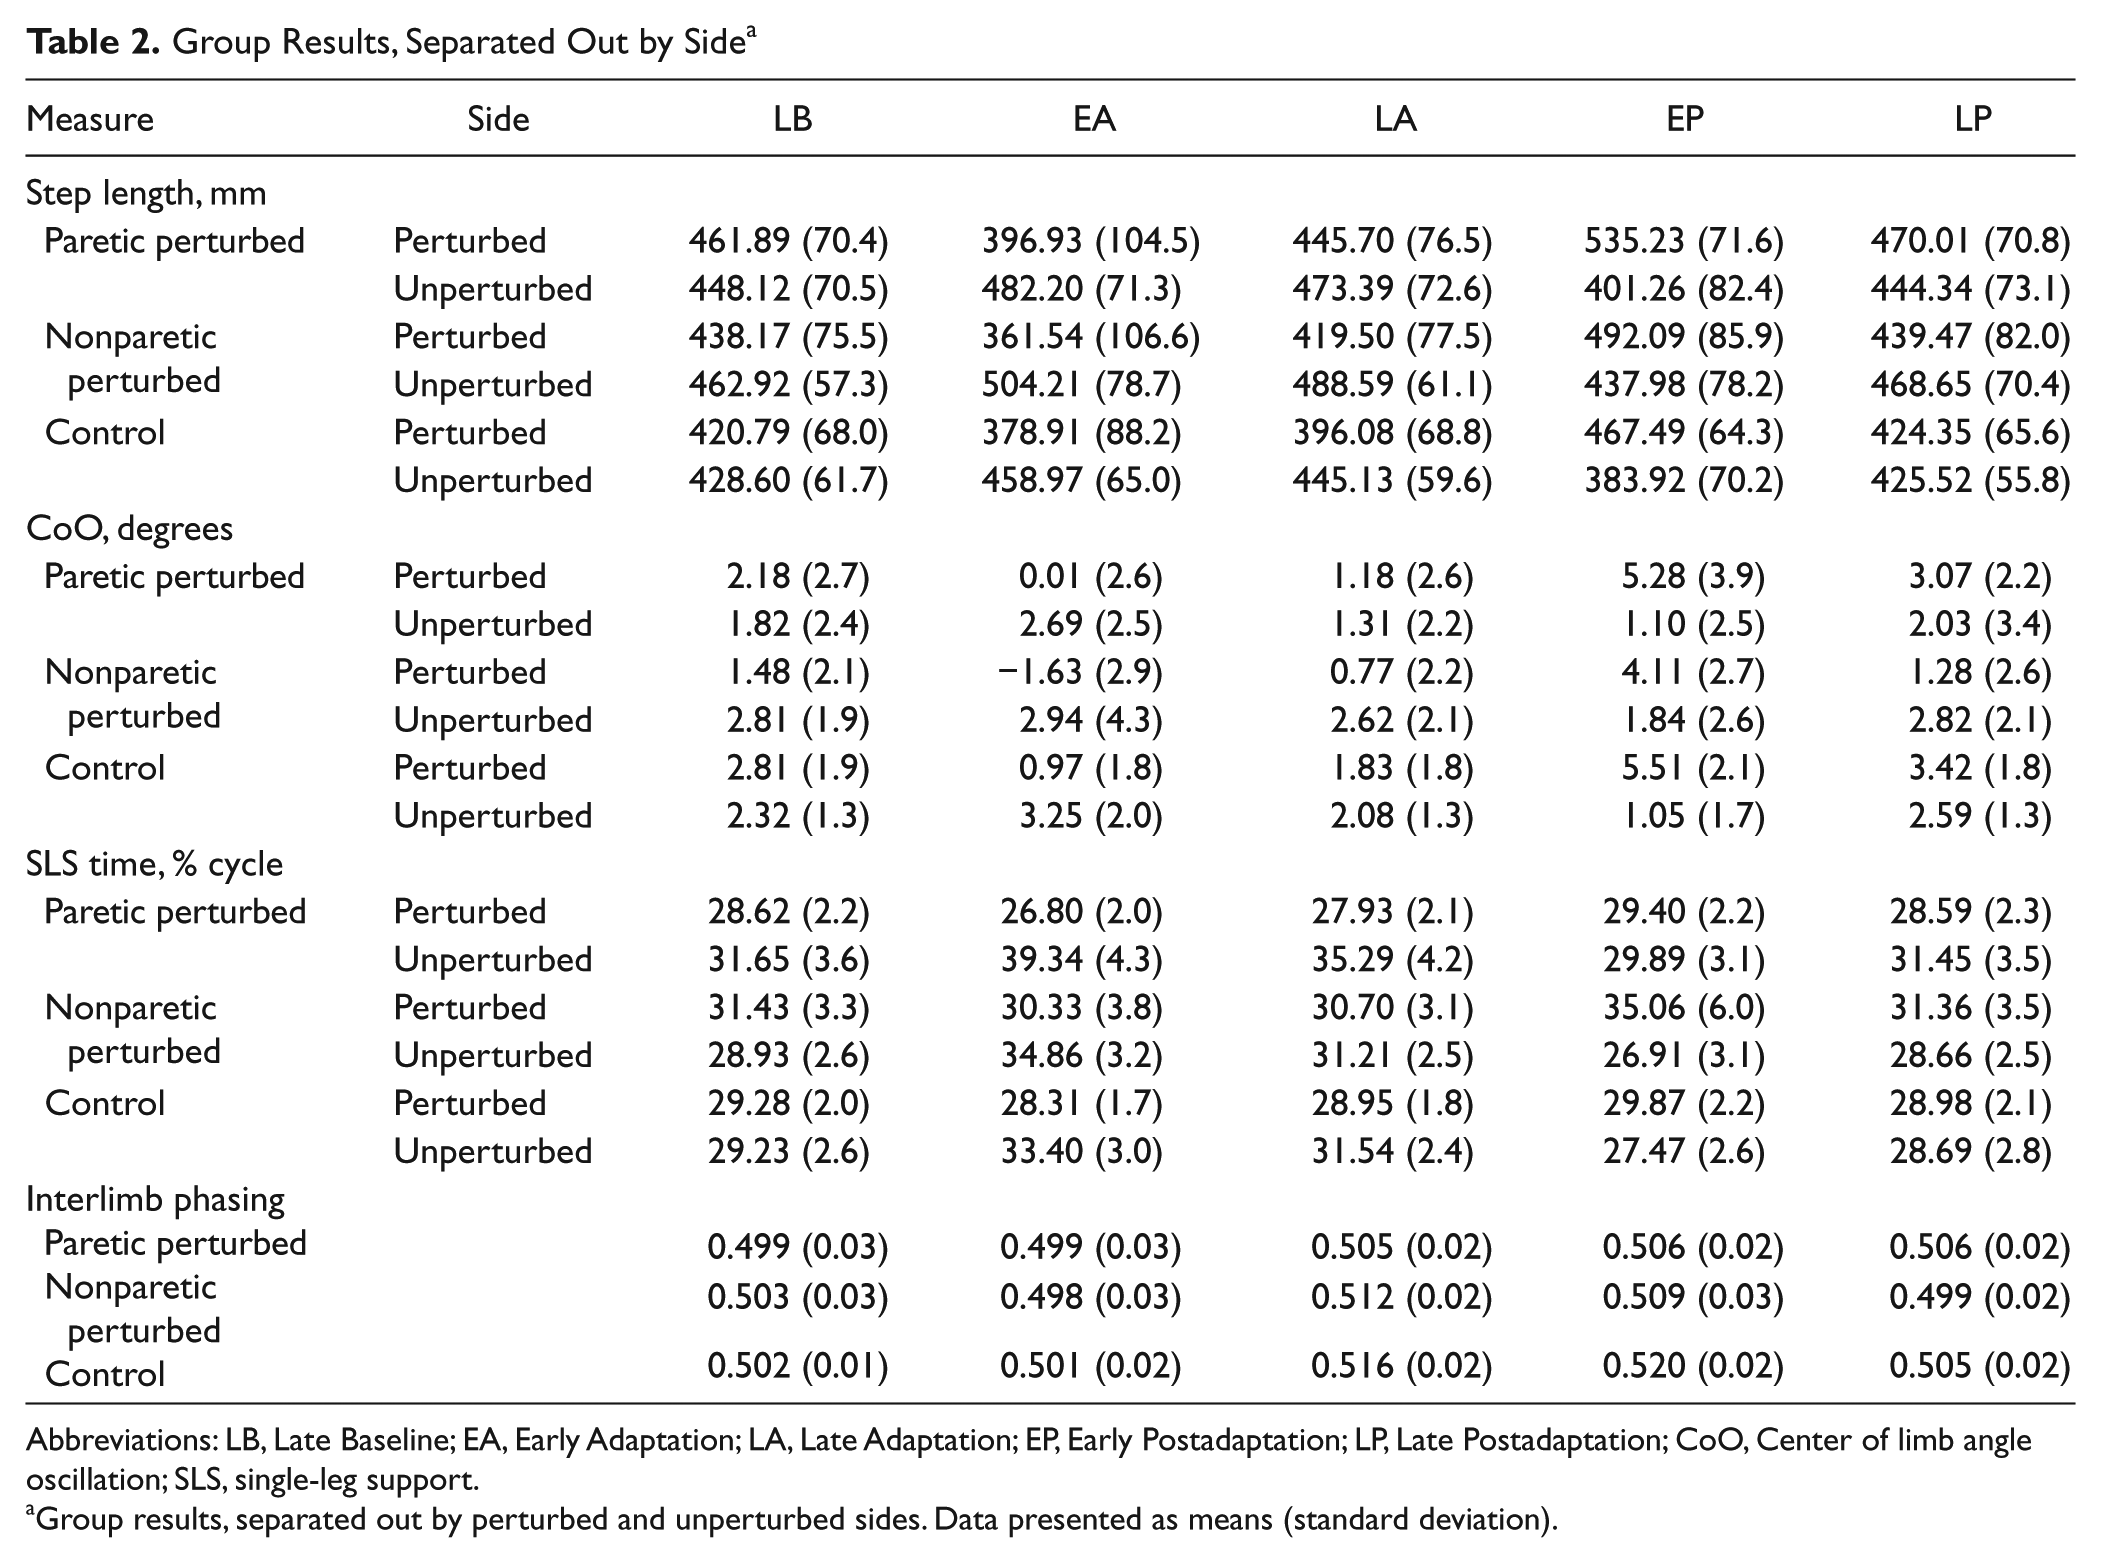
Abbreviations: LB, Late Baseline; EA, Early Adaptation; LA, Late Adaptation; EP, Early Postadaptation; LP, Late Postadaptation; CoO, Center of limb angle oscillation; SLS, single-leg support.
Group results, separated out by perturbed and unperturbed sides. Data presented as means (standard deviation).
Figures 2C to 2D show average CoO differences (pure spatial measure) and interlimb phasing (pure temporal measure) for all groups and testing periods. For CoO, there was a main effect of testing period (P < .0001) but no group or interaction effects (Figure 2C). The perturbation initially resulted in positive CoO differences (3.36 ± 3.73, Early Adaptation vs −0.11 ± 2.62, Late Baseline; P < .0001), which returned toward Late Baseline values during Adaptation (0.88 ± 2.68; P = .18). When the perturbation was removed, significant negative aftereffects were present (−3.73 ± 3.54, Early Postadaptation; P < .0001). The adaptive effects involved bilateral adjustments; see Table 2 for group result separated by side. Figure 2D shows average interlimb phasing values for all groups. There was a main effect of testing period (P < .0001) but no group or interaction effects. It was interesting to note that interlimb phasing did not change in Early Adaptation compared with Late Baseline (0.499 ± 0.03 from 0.501 ± 0.02; P = .96). However by Late Adaptation, perturbed limb angles were phase advanced relative to unperturbed ones (0.511 ± 0.02; P < .05) and remained so during Early Postadaptation (0.511 ± 0.03; P < .01).
Our other major variable of interest was SLS time symmetry. Figure 3A shows SLS time symmetry on a stride-by-stride basis for a control and a participant with stroke. Both show similar patterns of adaptation, despite the obvious baseline SLS time asymmetry in the participant with stroke. Figure 3B shows average group SLS time symmetry indices at each key testing period. Similar to step lengths, substantial stroke group asymmetry can be seen during Late Baseline, but all groups show the same general pattern of an initial perturbation (0.115 ± 0.08, Early Adaptation, vs 0.003 ± 0.05, Late Baseline), adaptation (0.056 ± 0.06, Late Adaptation), and aftereffects (−0.054 ± 0.08, Early Postadaptation). Statistically, there were main effects of group and testing period and an interaction effect (all P < .0001). However, post hoc analysis of the interaction effect showed no significant differences. The group effect is evident as the offset across the 3 groups caused by the initial baseline asymmetry in SLS times in the participants with stroke. Figure 3C shows SLS time symmetry values for all individuals in the stroke group, paretic perturbed and nonparetic perturbed, during 3 key testing periods. These data illustrate that all 14 participants with stroke demonstrated a normal adaptive response to the resistive force: a slight increase in SLS time symmetry index by the time of Late Adaptation and a large decrease (negative aftereffect) during Early Postadaptation. For 27 of the 28 adaptations, symmetry was more negative during Early Postadaptation compared with Late Baseline, showing that nearly all participants adapted to and stored the new walking pattern. Note that when the paretic leg was perturbed, the negative aftereffect improved SLS time symmetry (Figure 3C, top). However, when the nonparetic leg was perturbed, improved symmetry occurred during Late Adaptation, and the negative aftereffect worsened asymmetry (Figure 3C, bottom).
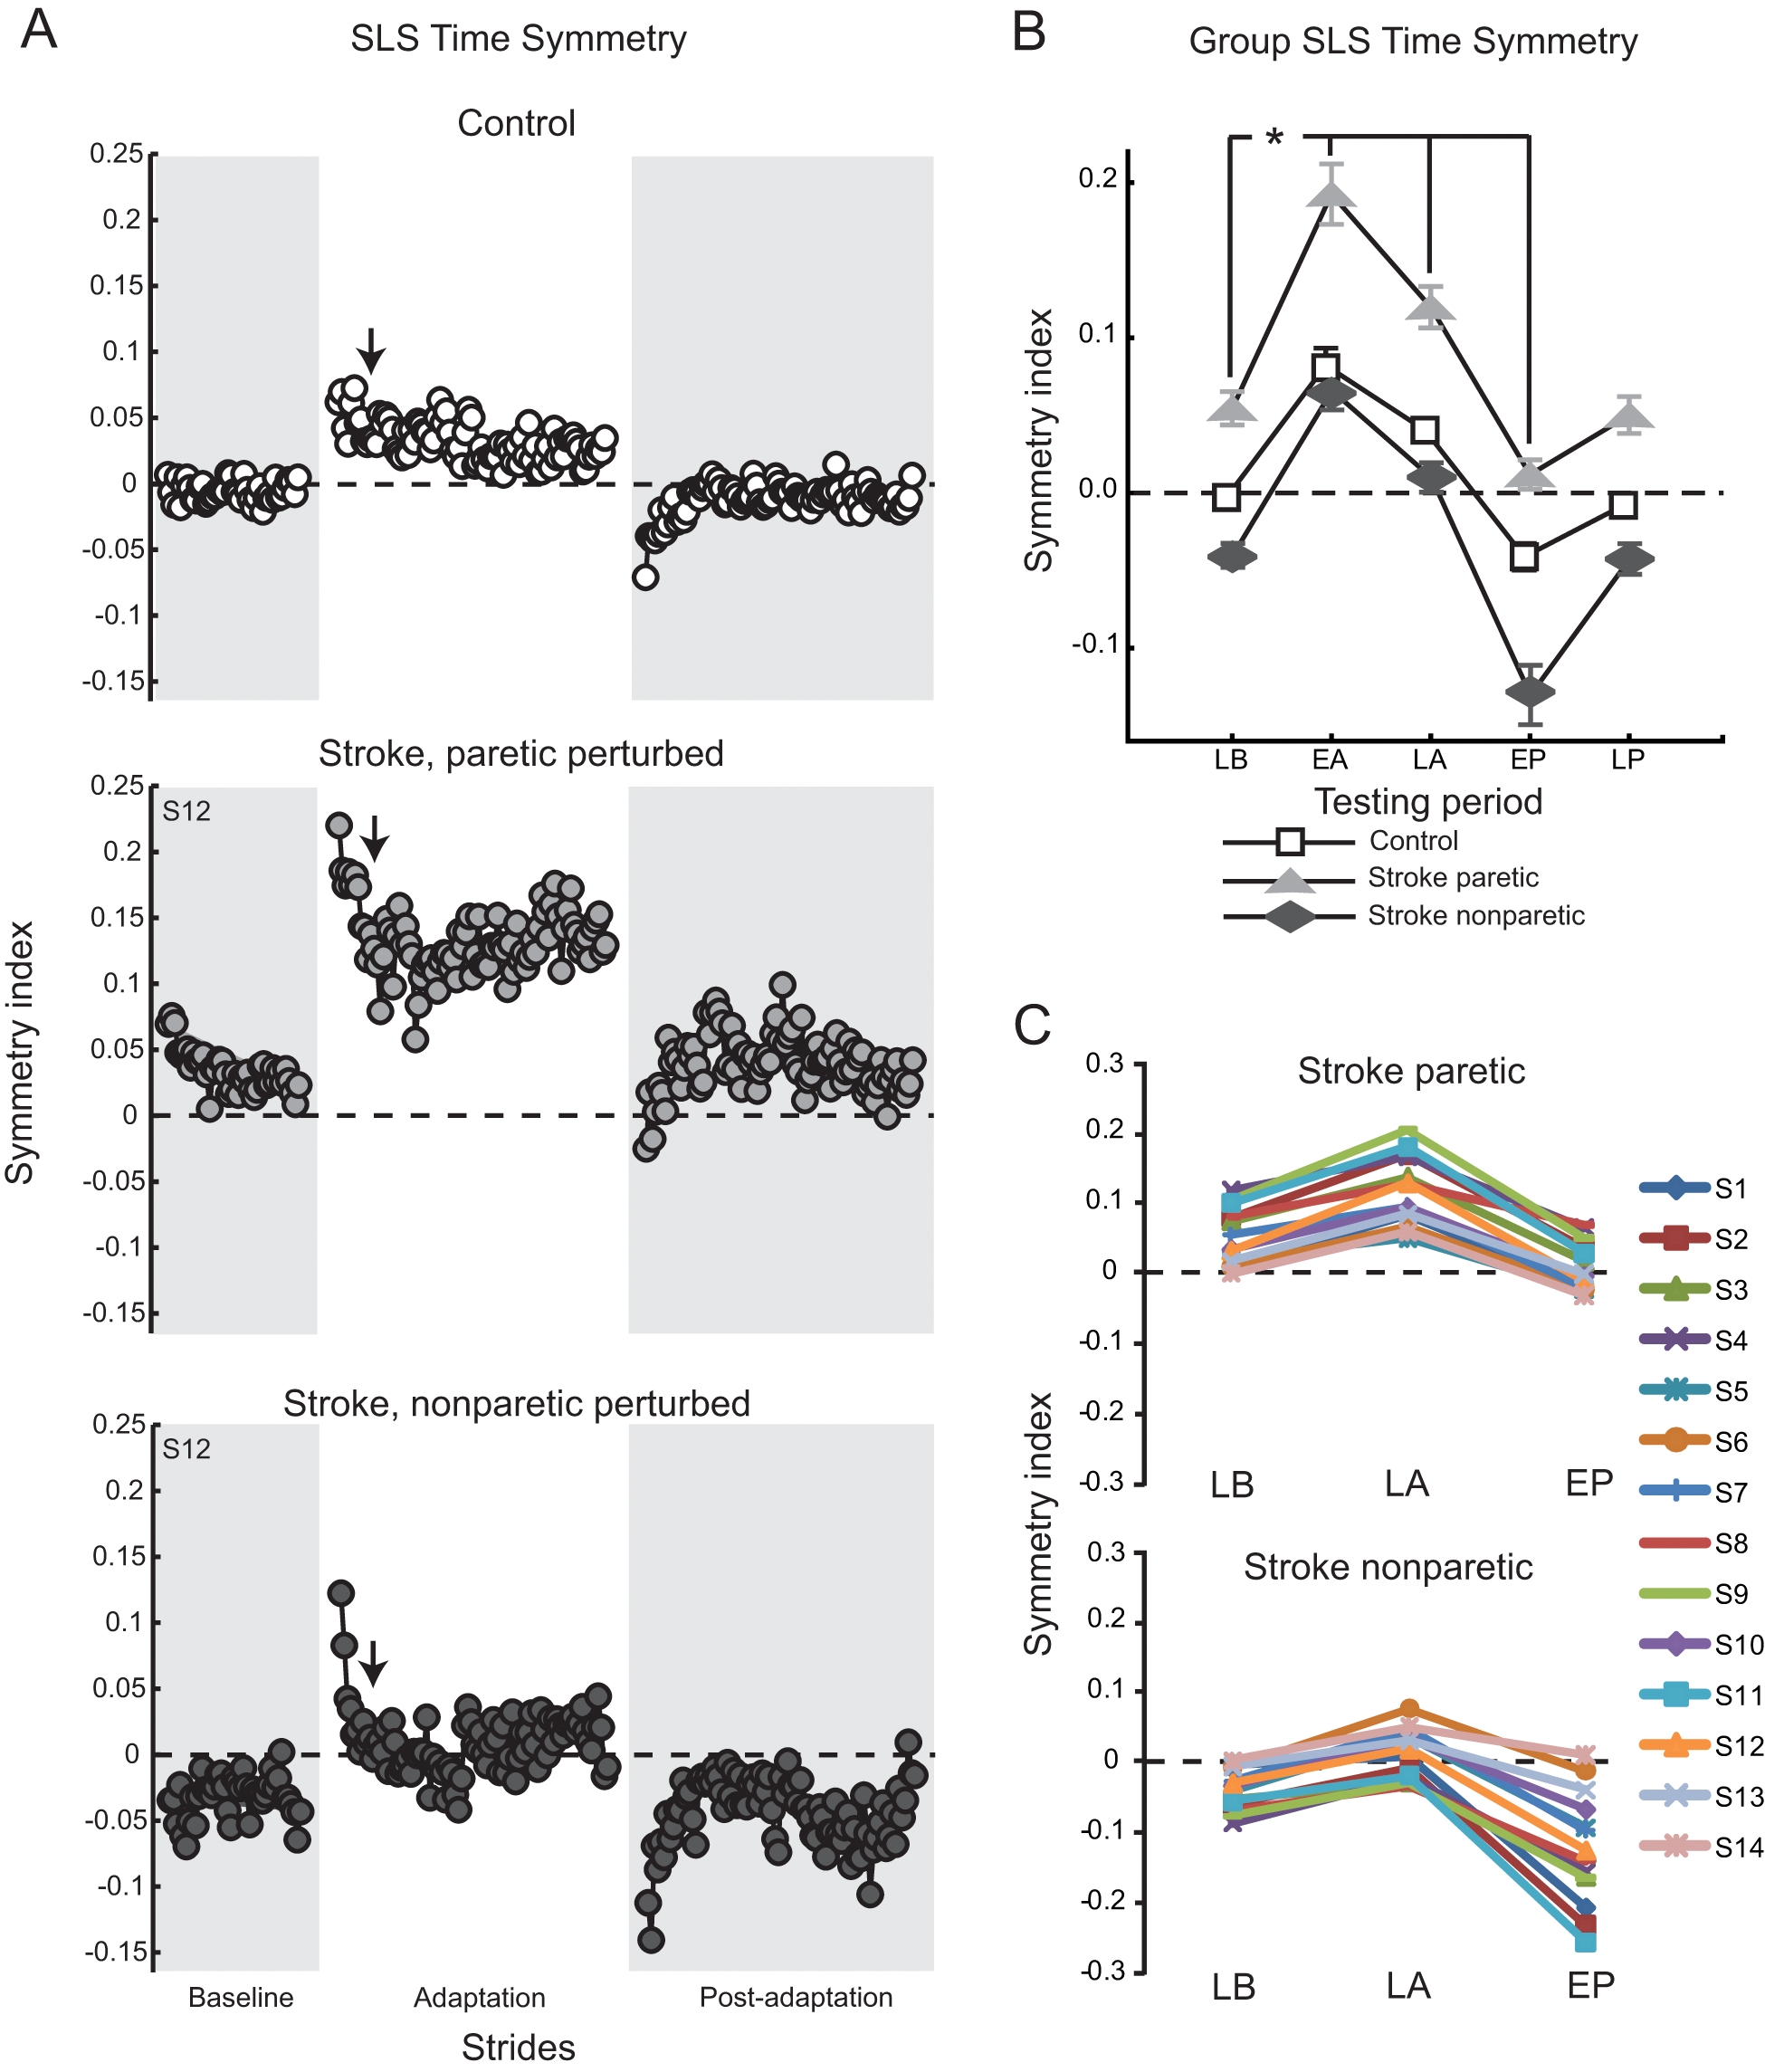
A. SLS time symmetry over all conditions for a typical control (top) and participant with stroke, paretic leg perturbed (middle) and nonparetic leg perturbed (bottom): each circle represents the average SLS time symmetry index for 3 consecutive strides. Arrows indicate the approximate transition point between the initial, fast and late, slow adaptation components. B. Group average SLS time symmetry indices: group differences are evident at Late Baseline. Collapsing across participant groups, asterisk indicates significance of P < .05 from the testing period post hoc comparison of each versus Late Baseline (error bars, ±1 SEM). C. SLS time symmetry indices shown for all participants with stroke, paretic leg perturbed (top) and nonparetic leg perturbed (bottom), at 3 key time periods. Late Baseline (LB), Early Adaptation (EA), Late Adaptation (LA), Early Postadaptation (EP), Late Postadaptation (LP) are shown. For all panels, the dashed horizontal line indicates perfect symmetry.
Rates of adaptation were generated by fitting a double exponential to each group’s averaged adaptation performance for step length symmetry, SLS time symmetry, and averaged CoO difference (goodness of fit, adjusted r2 >0.47 for all variables, and groups). We did not attempt curve fitting on interlimb phasing because none of the groups showed the rapid return of phasing to Baseline values during Adaptation that characterizes motor adaptation. Figure 4 shows the number of strides required to obtain the initial, fast (Figure 4A) and late, slow (Figure 4B) portions of adaptation for all variables. Generally speaking, the initial, fast adaptation rates were similar for all groups. Averages for the stroke paretic and nonparetic leg perturbed groups ranged from 4 to 9 and 4 to 8 strides, respectively, for step length, SLS time, and CoO symmetry measures. These averages all fell within the 95% CI for the control group (mean, 11; range 8-13 strides). In contrast, late, slow rates of adaptation were much greater for participants with stroke compared with controls. Step length symmetry late, slow adaptation required 45 (upper 95% CI = 97) strides for controls but 2001 and 22 959 strides for paretic perturbed and nonparetic perturbed stroke groups, respectively. SLS time symmetry late, slow adaptation required 9 (upper 95% CI = 445) strides for controls, but 29 997 and 74 strides for paretic perturbed and nonparetic perturbed stroke groups, respectively. CoO symmetry late, slow adaptation required 51 (upper 95% CI = 89) strides for controls but 759 and 2762 strides for paretic perturbed and nonparetic perturbed stroke groups. Thus, the paretic perturbed stroke group required significantly more strides to achieve the late, slow adaptation for all variables (ie, average performance fell outside the upper limit of the control group 95% CI). This was also true for the nonparetic perturbed stroke group for step length and CoO symmetry but not for SLS time symmetry.
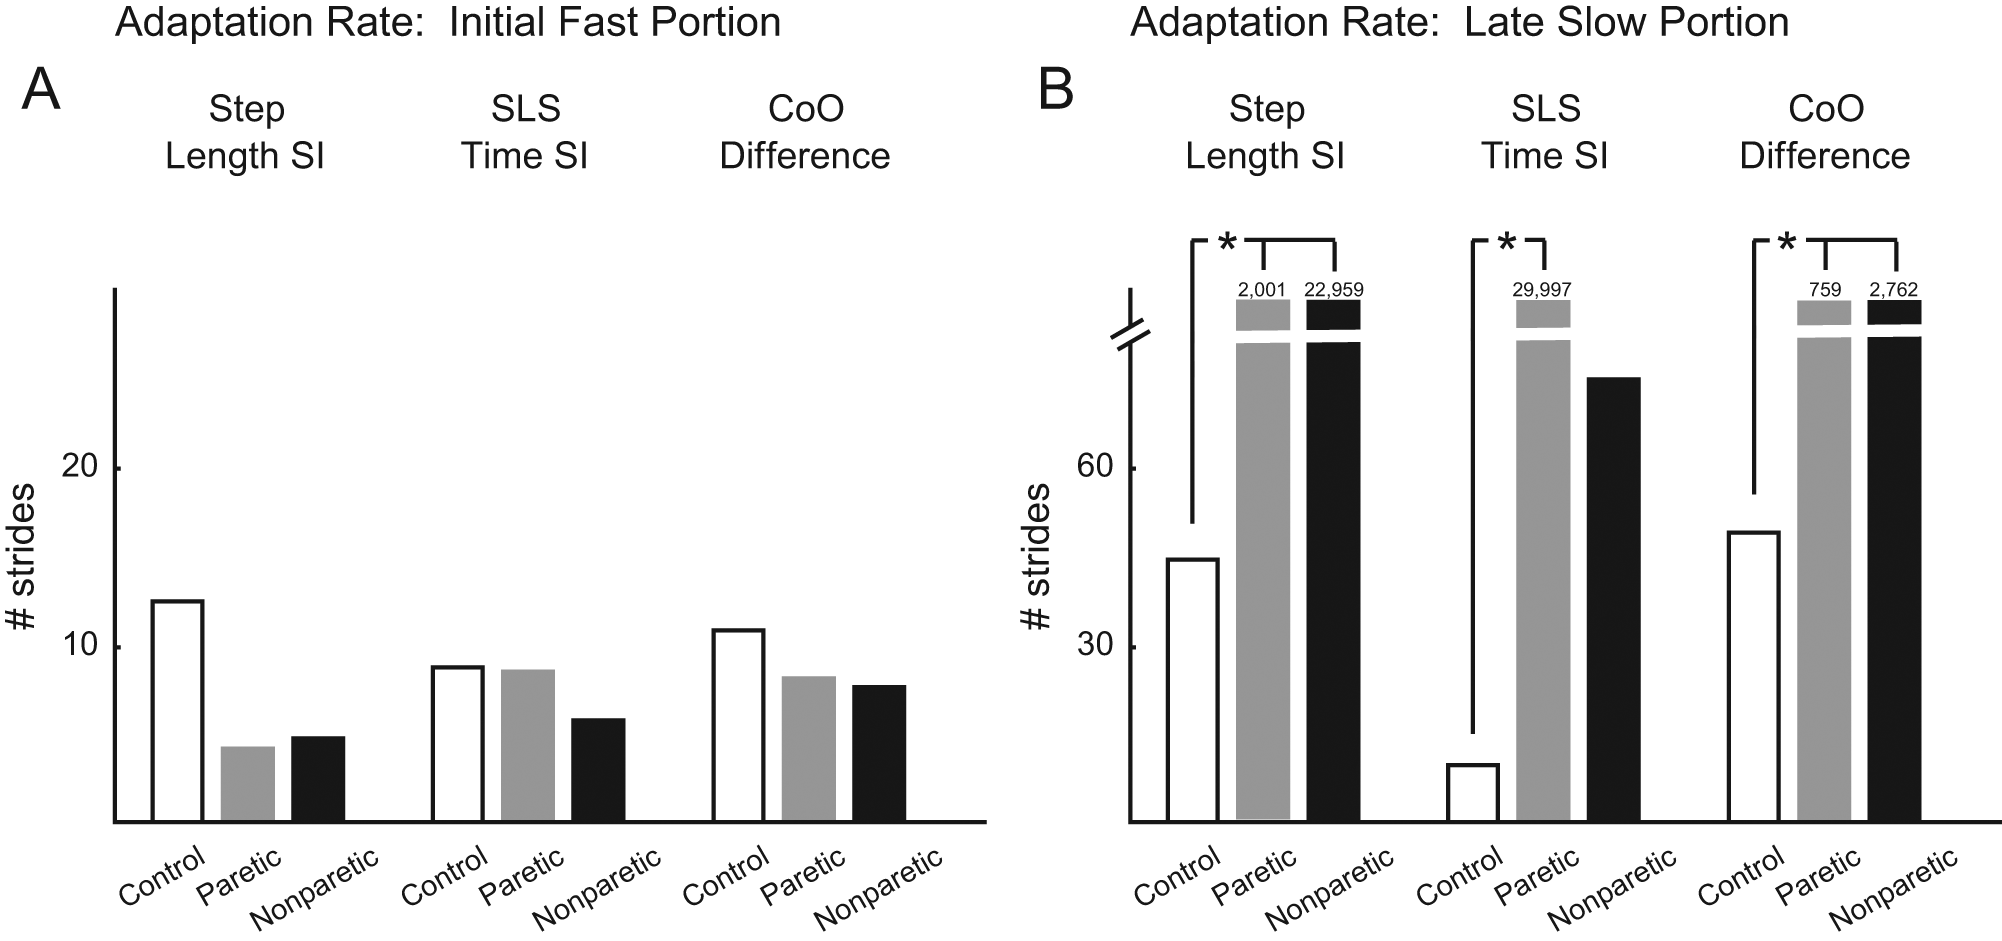
A, B. Rates of adaptation, derived from the double exponential curve fits of averaged group data, indicating the number of strides required to achieve the initial, fast portion of adaptation (A) and the late, slow portion of adaptation (B). Both are shown for the measures of step length symmetry, SLS time symmetry, and center-of-oscillation differences. Note the break in the y-axis. Numbers above some columns indicate the number of strides required for the late, slow adaptation. Asterisks indicate significance of P < .05 from the control group 95% confidence interval.
Discussion
The current results indicate that the magnitude of locomotor adaptation of both spatial and temporal parameters to a swing-phase resistance is not impaired in persons with chronic stroke and moderate hemiparesis. Adaptations and negative aftereffects in step length symmetry, SLS time symmetry, and limb angle CoO were similar for controls and participants with stroke, regardless of whether the paretic or nonparetic leg was perturbed. Likewise, for all groups, interlimb phasing, although not initially altered, changed by the end of the adaptation period so that the perturbed leg was phase advanced relative to the unperturbed leg. However, rates of adaptation were significantly reduced in both paretic perturbed (all 3 measures) and nonparetic perturbed (2 of 3 measures) stroke groups. It is interesting to note that it was only the late, slow component, not the initial, fast component, that was affected.
Adaptation of voluntary limb movements has been studied extensively, and it is widely accepted that arm and eye movement adaptations are dependent on cerebellar integrity,29,30 whereas other brain structures, such as the primary motor cortex or the basal ganglia, seem less critical.29,31,32 Only a few studies have examined adaptations of human locomotion, particularly in persons with neurological deficits. Thus, the circuitry controlling locomotor adaptation is less certain. Motor cortical areas and the descending corticospinal tract are known to play a role in walking. The motor cortex produces rhythmic activity during locomotion in intact animals 33 that increases when visual guidance is required and/or when walking becomes especially complex.34,35 In humans, motor cortical activity is likely even more important because of the increased complexity of bipedal walking. Yet the specific process of learning to modify walking via motor adaptation should not be assumed to be under similar control. Rather, locomotor adaptation may be dependent on cerebellar and not cerebral integrity.25,36,37 The current results are generally consistent with this idea: stroke and resultant hemiparesis do not appear to prevent novel locomotor pattern acquisition.
However, our results do suggest that stroke causing moderate hemiparesis may lead to significant delays in the rate of the late, slow component of adaptation. Recent evidence supports a model for motor adaptation occurring in 2 phases: an initial, rapid period of improvement in motor performance that is highly sensitive to errors but easily forgotten and a later, much slower improvement in motor performance that is less sensitive to error but resistant to forgetting.27,38 The rapid, error-sensitive component has been attributed to the cerebellum,25,39,40 whereas the slower component may be controlled by cortical areas, specifically the primary motor cortex41,42 or possibly the posterior parietal cortex. 43 Our findings support the existence of these 2 separate processes and indicate that stroke and chronic hemiparesis preferentially affect the late, slow portion of adaptation that is resistant to forgetting. This finding may indicate a deficit in the long-term “remembering,” or savings, of motor adaptations in persons with poststroke hemiparesis. Other studies in humans support this hypothesis, showing that disruption of the primary motor cortex by transcranial magnetic stimulation interferes with motor consolidation 44 and readaptation 24 hours later 45 of newly learned motor behaviors but does not disrupt the initial learning period.
The model for calculating initial, fast and late, slow adaptation rates generated values for the stroke group late, slow adaptation rate that were several orders of magnitude larger than those for the control group. It is important to recognize that the rates were modeled from adaptation periods that lasted between 200 and 300 consecutive strides. Late, slow rates exceeding 300 strides therefore are not likely to be estimated very well by the model, and so the very high values obtained for the stroke group late, slow adaptation rates should not be assumed to be realistic estimates. However, the interpretation is still legitimate: the stroke group late, slow adaptation rates were clearly longer than the total adaptation period and certainly greater than those of nondisabled controls (always <50 strides). A longer duration adaptation period would need to be tested in persons with stroke to determine a more accurate estimate of the late, slow adaptation rate. It is interesting to note that the late, slow rate of adaptation for SLS times (the temporal gait measure) was impaired only when the paretic leg was perturbed. When the nonparetic leg was perturbed, late, slow adaptation rates were not significantly different from those in controls. This may indicate that the slow phase of adaptation of temporal parameters is less impaired than the slow phase of adaptation of spatial parameters.
Generally, our results are in agreement with the only other study examining motor adaptation—as we have defined it here—during walking in persons with stroke and hemiparesis, in which it was shown that participants with stroke adapt step lengths normally during split-belt treadmill walking. 2 In another study, individuals with motor-incomplete spinal cord injury were also found to have largely intact adaptive walking capabilities, though the behavioral manifestations of the adaptation were different in the patients compared with controls. 46 Here we discovered no deficit in the magnitude of locomotor adaptation following stroke and hemiparesis for either spatial or temporal components of gait.
When first exposed to the perturbation, limb phasing was no different from that at baseline: that is, it remained symmetrical for participants in all groups. Thus, robust changes in step length symmetry during Early Adaptation were solely a result of changes in CoO. The result was that interlimb phasing did not show a true adaptation or return to near-baseline levels over the course of Adaptation. One possible explanation for this, and for the relatively small changes in interlimb phasing overall, is that phasing changes in Early Adaptation are limited by dramatic increases in swing time on the perturbed leg. The resistance has an immediate effect of slowing perturbed leg swing speed, increasing swing time on that side (in order to still advance the limb). With swing time increased, the perturbed side can phase advance only a small amount, to the point where lift off on the perturbed side occurs immediately after, or nearly simultaneously with, initial contact on the opposite side. Otherwise, the double support period would reduce to zero, and the gait pattern would shift from a walk to a run or gallop. It is interesting to note that once swing times are normalized (SLS times return to near symmetry, see Figure 3B), there is more time for a shift in interlimb phasing to occur, and that is what happened during Late Adaptation.
The ability of participants with stroke and hemiparetic gait to walk symmetrically may be important for rehabilitation, especially given the resistance of spatial and temporal asymmetries to change.3-6 Because asymmetrical gait is associated with an elevated risk for falls and serious injury,7,47,48 the ability to improve gait symmetry poststroke may facilitate hemiparetic gait safety and function. For a possible rehabilitation intervention using this paradigm, improved symmetry will have to be longer lasting. The temporary nature of aftereffects presents an obstacle to clinical implementation worthy of further investigation.
The decision of which leg to perturb is also an important consideration for rehabilitation. Recall that SLS time asymmetry poststroke almost invariably favors the nonparetic leg (SLS time, nonparetic > paretic).14,15 On the other hand, step length asymmetry varies among persons with stroke; approximately 8% to 17% have a significant step length increase on the nonparetic leg, whereas 42% to 53% show an increase on the paretic leg (and 30% to 49% have relatively symmetric step lengths).49,50 To achieve a temporary symmetry during Early Postadaptation, the ideal application of this paradigm would be to add resistance to the paretic leg of individuals who have a baseline step length asymmetry in which step lengths are longer on the nonparetic side. In this case, step length, limb angle CoO, and SLS time symmetry indices would all become temporarily more symmetric (index values less positive than during baseline).
The current study demonstrates that persons with chronic stroke and hemiparesis are capable of achieving gait symmetry during or immediately after a brief 10-minute adaptation to a novel unilateral resistive load. The magnitude of the adaptation is not impaired poststroke. Rather, adaptation facilitates a robust, temporary improvement in SLS time symmetry either at the end of Adaptation or the beginning of Postadaptation (aftereffect), depending on whether the paretic or nonparetic leg is perturbed. Nevertheless, analysis of adaptation rates suggests that poststroke hemiparesis may be linked to slower learning during the late, slow component of locomotor adaptation. Further studies involving long-term or repetitive use of this paradigm should investigate whether the slower rate of learning persists or can be corrected with repeated exposure.
Footnotes
Acknowledgements
The authors wish to thank S. Hartman for assistance with data collection and P. Viswanathan for thoughtful comments and suggestions regarding previous versions of this manuscript.
Declaration of Conflicting Interests
The author(s) declared no potential conflicts of interest with respect to the research, authorship, and/or publication of this article.
Funding
The author(s) disclosed receipt of the following financial support for the research, authorship, and/or publication of this article: This work was supported by a NIH K01 (HD050369), NIH R21 (NS067189), NIH T32 (HD041899), and a Veterans Affairs predoctoral fellowship award.