
Abstract
Background. Fatigue is a debilitating symptom in multiple sclerosis (MS). Previous studies showed no association between fatigue as perceived by the patient and physiological measures of fatigability. Objective. The authors investigated associations between perceived fatigue and measures of fatigability after correction for differences in maximal voluntary contraction (MVC). Methods. A total of 20 people with relapsing-remitting MS with an Extended Disability Severity Score less than 5.5 and 20 healthy controls filled out the Fatigue Severity Score questionnaire of perceived fatigue. The authors obtained the MVC from the first dorsal interosseus muscle, voluntary muscle activation, and force decline during a sustained MVC (124 s, muscle fatigue). Results. Patients perceived increased levels of fatigue compared with controls (P < .001). Although patients and controls developed similar amounts of muscle fatigue during the sustained contraction, a linear regression model that included both muscle fatigue and MVC was positively associated with perceived fatigue in patients only (R2 = 0.45; P = .01). Voluntary activation during the sustained contraction was negatively associated with perceived fatigue (R2 = 0.25; P = .02). Conclusion. The data indicate that fatigue perceived by MS patients is associated with measures of fatigability. This observation helps in the understanding of mechanisms underlying the increased levels of fatigue perceived by MS patients. These data also emphasize that for comparison of fatigue-related parameters between groups, correction for individual maximal force is essential.
Introduction
The Multiple Sclerosis (MS) Council for Clinical Practice defines fatigue as “a subjective lack of physical and/or mental energy that is perceived by the individual or caregiver to interfere with usual and desired activities.”1(p2) MS patients often report fatigue as one of their most disabling symptoms.2-6 Nevertheless, our understanding of mechanisms underlying fatigue in MS remains incomplete.
In physiological studies, fatigue is commonly defined as an exercise-induced reduction in the force-generating capacity. 7 Changes in the central nervous system (central fatigue) or peripheral nervous system and muscle (peripheral fatigue) both contribute to this decline in force. 8 Yet no association has been found between fatigue as perceived by MS patients and measures of fatigability.9-14
In controls, a sustained contraction at a percentage of maximal voluntary contraction (MVC) results in more fatigue for stronger participants than weaker ones. 15 Additionally, fatigability is also associated with gender.14,16 Although the initial strength in MS patients can be similar to that in controls,10,17,18 there is a tendency for lower MVCs.9,19-21 If the association between MVC and fatigability is also valid for MS patients, smaller MVCs would result in less muscle fatigue, and thus affect fatigue-related data contrary to what is expected. Therefore, one of the present aims is to investigate the association between MVC and fatigability in MS and to determine if this association attenuates the relation between perceived fatigue and muscle fatigue.
Given the nature of MS, it is expected that central fatigue contributes to fatigue perceived by MS patients. 22 Central fatigue is commonly measured with the twitch-interpolated technique during a maximal contraction. The underlying principle is relatively simple. 23 During an MVC, a stimulus is given to the appropriate nerve or muscle. If participants activate their muscles maximally, no increase in force is evoked by this stimulus. During a submaximal activation, however, an extra force is evoked. The size of the interpolated twitch gives a measure of the voluntary activation, and an increase over time reflects central fatigue. 8 However, during a sustained contraction, the evoked twitch tends to decline as a result of fatigue-related changes in the periphery. Because the amount of peripheral fatigue differs between MS patients and controls,10,14 it is necessary to correct for peripheral fatigue. Studies that investigated the association between perceived fatigue and central fatigue in MS patients did not always correct for peripheral fatigue.
The corticospinal tract is essential for human hand coordination. 24 In MS, it is likely that the corticospinal tract is affected, which can result in an increased sense of effort and increased perception of fatigue. We therefore included measures to evaluate the integrity of the corticospinal tract.
Methods
Study Population
A total of 20 patients (7 men; aged 20-58 years) with definite MS 25 and 20 controls (6 men, aged 21-57 years) participated. Only right-handed individuals were included. 26 A clinician or nurse practitioner examined each patient. Only patients diagnosed with relapsing-remitting MS and an extended disability severity score (EDSS 27 ) lower than 5.5 were included. Patients using medication that had possible effects on fatigability or force production were excluded (eg, amantadine, amitriptyline, pemoline, tizanidine, baclofen, benzodiazepines, potassium-channel blockers, and modafinil). Patients were tested at least 6 weeks after any steroid treatment. Additional exclusion criteria were major psychiatric disorder and other neurological illness.
Informed consent was obtained, and the study was approved by the institutional medical ethics committee. Participants received financial compensation for participation.
Force and Electromyography Recording
Participants sat with a force transducer in each hand (Figure 1A). The proximal interphalangeal joint of the index finger was taped to a wedge that was connected to the force transducer. 28 The fingers were taped to the thumb to prevent changes in hand position. The force signal was amplified and sampled (500 Hz) by a PC equipped with a data acquisition interface and accompanying software (CED 1401plus, Spike2; CED, Cambridge, UK).
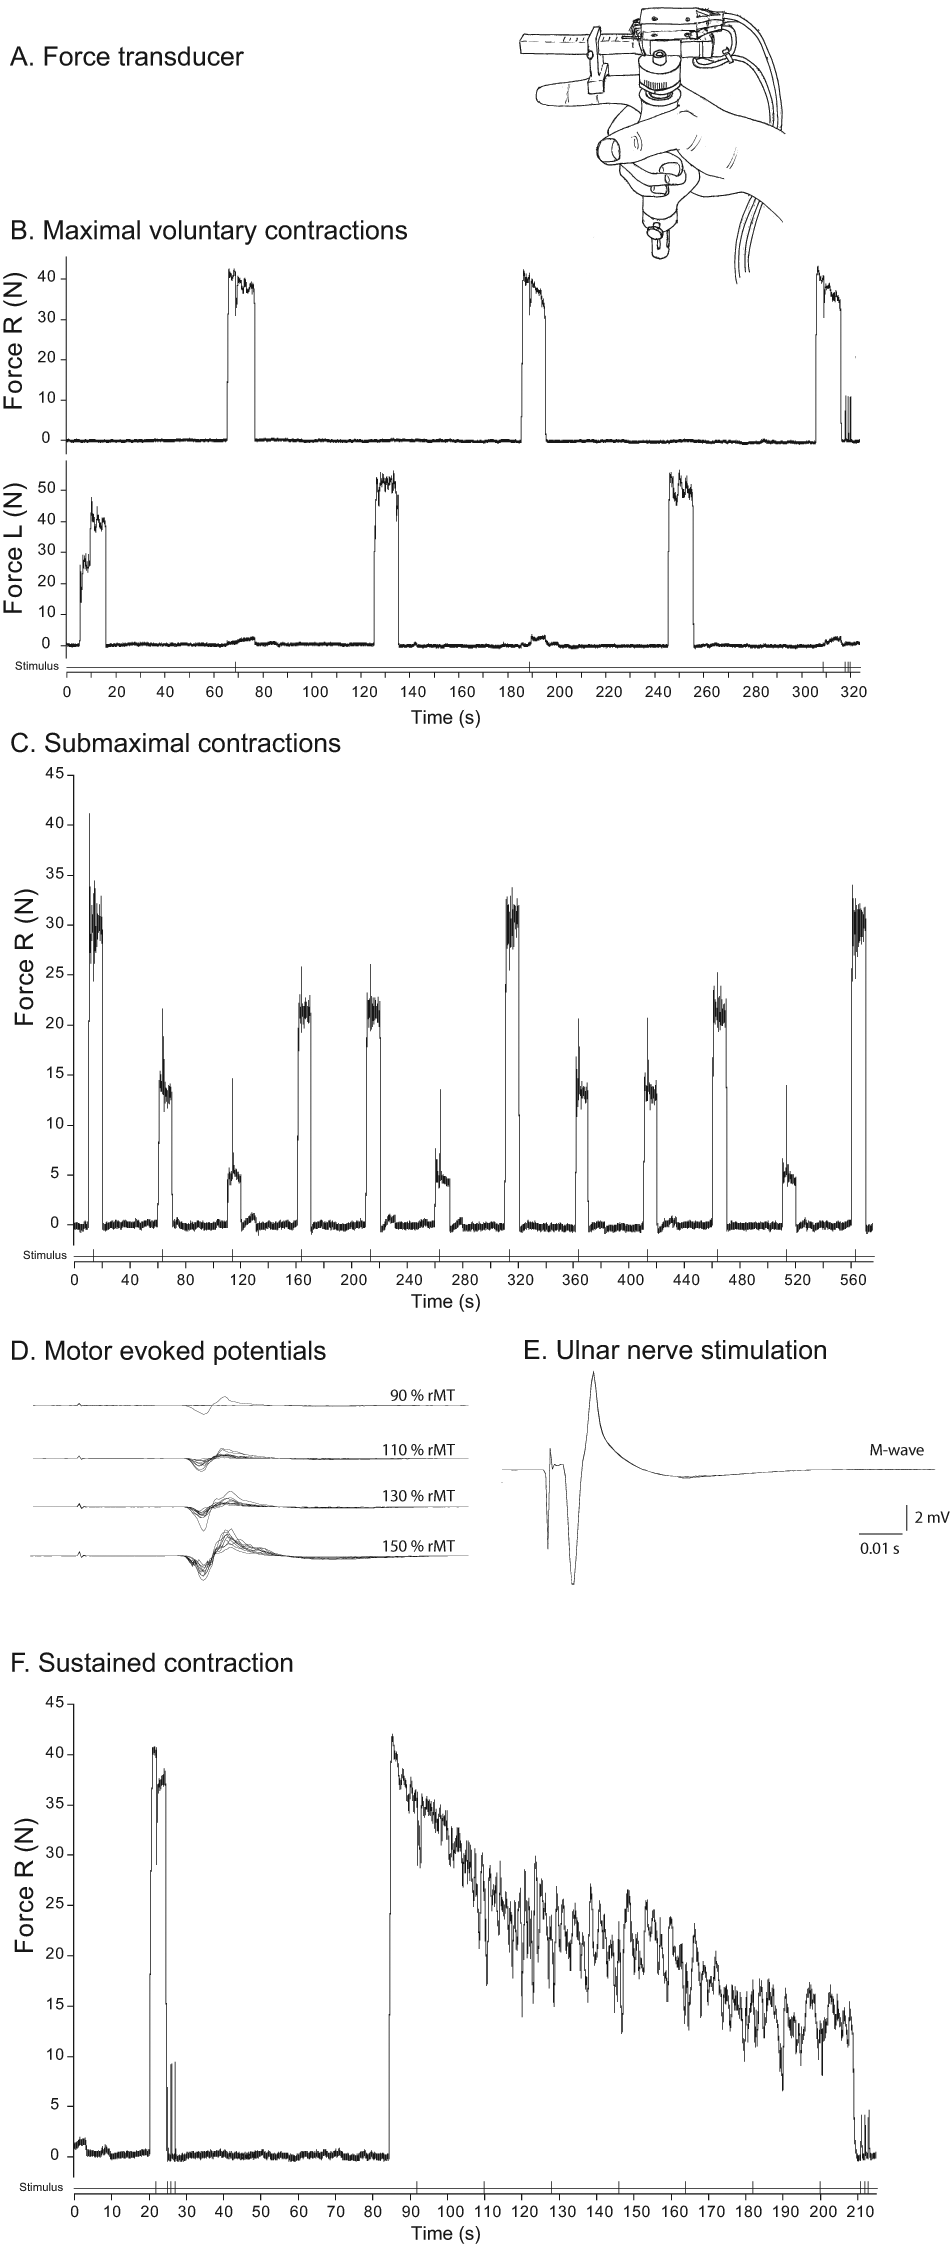
Overview of experimental tasks illustrated by recordings obtained in a male multiple sclerosis patient. (A) Schematic illustration of the position of the hand in the force transducer. (B) Maximal voluntary contractions (MVC) of the first dorsal interosseus (FDI) of the left and right hands. During each contraction with the right hand, the ulnar nerve was electrically stimulated with a paired pulse (interpolated twitch technique). (C) Submaximal contractions with the right FDI at 4 force levels (10%, 30%, 50%, and 70% maximum voluntary force [MVC]). During each contraction, the ulnar nerve was electrically stimulated with a paired pulse. (D) Motor-evoked potentials (n = 10) obtained by transcranial magnetic stimulation of the left primary motor cortex at different intensities (90%-150% of resting motor threshold). (E) Evoked potentials (M waves, n = 5) after electrical stimulation of the ulnar nerve (single pulse). (F) Short maximal contraction with electrical stimuli over the ulnar nerve during and after the MVC, followed by a sustained maximal voluntary contraction (124 s). During the sustained contraction, 7 stimuli were given to the ulnar nerve followed by 3 stimuli after the contraction
The electromyogram (EMG) of the right first dorsal interosseus muscle (FDI) was recorded using sintered silver/silver chloride surface electrodes. Before electrode placement, the skin of the hand was scrubbed and cleaned with alcohol. Electrodes were placed in a muscle belly-tendon arrangement with 1 electrode over the FDI and a second electrode near the metacarpophalangeal joint. A band-shaped reference electrode was strapped around the wrist. All electrodes were connected to an EMG amplifier (amplification: 200×; band pass filtered, 10-1000 Hz) and sampled at 2 kHz.
Transcranial Magnetic Stimulation (TMS)
A stimulator (Magstim 200) equipped with a flat circular coil (13 cm in diameter) was used to stimulate at spinal level (C8) and primary motor cortex (M1). The coil was positioned over M1 such that the largest motor evoked potentials (MEPs) were obtained in the right FDI. Resting motor threshold (rMT) was determined as the minimum stimulus intensity that evoked 3 small MEPs (>100 µV) out of 5 stimuli. Participants got feedback of the EMG of the right FDI and were instructed to relax.
As a measure of integrity of the corticospinal system, we determined the central motor conduction time (CMCT) and the corticospinal input–output relation. The corticospinal input–output relation is defined by the slope of the line of best fit between stimulation intensities and corresponding MEPs.29,30 The CMCT is defined as the difference in latency between the MEP evoked at cortical and spinal levels.
First, 5 MEPs were evoked at C8 at 105% rMT. Subsequently, 10 MEPs were evoked over M1 at 90%, 110%, 130%, and 150% rMT or up to a maximum of the stimulator output in a semirandomized order. The latency and average peak-to-peak amplitude of the MEPs were measured offline. The MEPs at 130% rMT at M1 and C8 were used to calculate the CMCT. The trimmed MEP amplitudes (40% trimming; the 2 highest and lowest values were excluded) were used for the corticospinal input–output relation.
Electrical Stimulation
Electrodes (Kendall Arbo, Tyco Healthcare Germany) were placed over the ulnar nerve close to the wrist of the right arm and connected to a stimulator (Digitimer DS7, Welwyn Garden City, UK). Stimulation intensity was increased until reaching the maximal EMG response (M wave) and set at 150% of that intensity. To obtain measures of voluntary activation, we used paired pulse stimulation (200 µs, interstimulus interval 10 ms). Paired pulse stimulation was given during MVCs, submaximal contractions, and the sustained maximal contraction. The reference twitch (paired pulse) was evoked during rest after the MVCs (potentiated twitch).
Experimental Tasks
The EDSS score was determined. Hand coordination and dexterity were measured using the Purdue Pegboard test (Lafayette Instrument, Lafayette, IN, USA). During the experiment, participants sat in front of a computer screen in a temperature-controlled room (18°C).
Figure 1 illustrates the tasks performed. For Task 1, participants performed 3 MVCs with their FDI (10 s followed by 50 s rest; Figure 1B) starting with the left hand, followed by the right hand (110 s between contractions with the same muscle). During the MVCs with the right FDI, an interpolated twitch was evoked. After the last MVC, 3 twitches were evoked at rest. The largest twitch was considered the reference twitch. For Task 2, participants performed 3 blocks of submaximal contractions (10 s) with their right FDI at different force levels (10%, 30%, 50%, and 70% MVC) followed by 40 s rest. The order of the contractions within a block was semirandomized (Figure 1C). During each submaximal contraction, 1 interpolated twitch was evoked. For Task 3, the position and threshold for TMS was determined, and the CMCT and corticospinal input–output relations were assessed (Figure 1D). Furthermore, 5 M waves (Figure 1E) were evoked. For Task 4, participants performed a brief MVC (4 s) with an interpolated twitch, followed by 3 twitches at rest (prefatigue twitch). After 1 minute of rest, a fatiguing sustained maximal contraction was performed (124 s) with the right FDI during which 7 interpolated twitches (every 18 s) were evoked. This contraction was followed by 3 twitches at rest (fatigued twitch, Figure 1F).
All twitches in tasks 1, 2, and 4 were evoked by paired pulse stimulation. Throughout the experiment, participants received continuous visual feedback of the FDI force and the target force.
Outcome Measures
A summary of the outcome measures is presented in Table 1.
Description of Outcome Measures
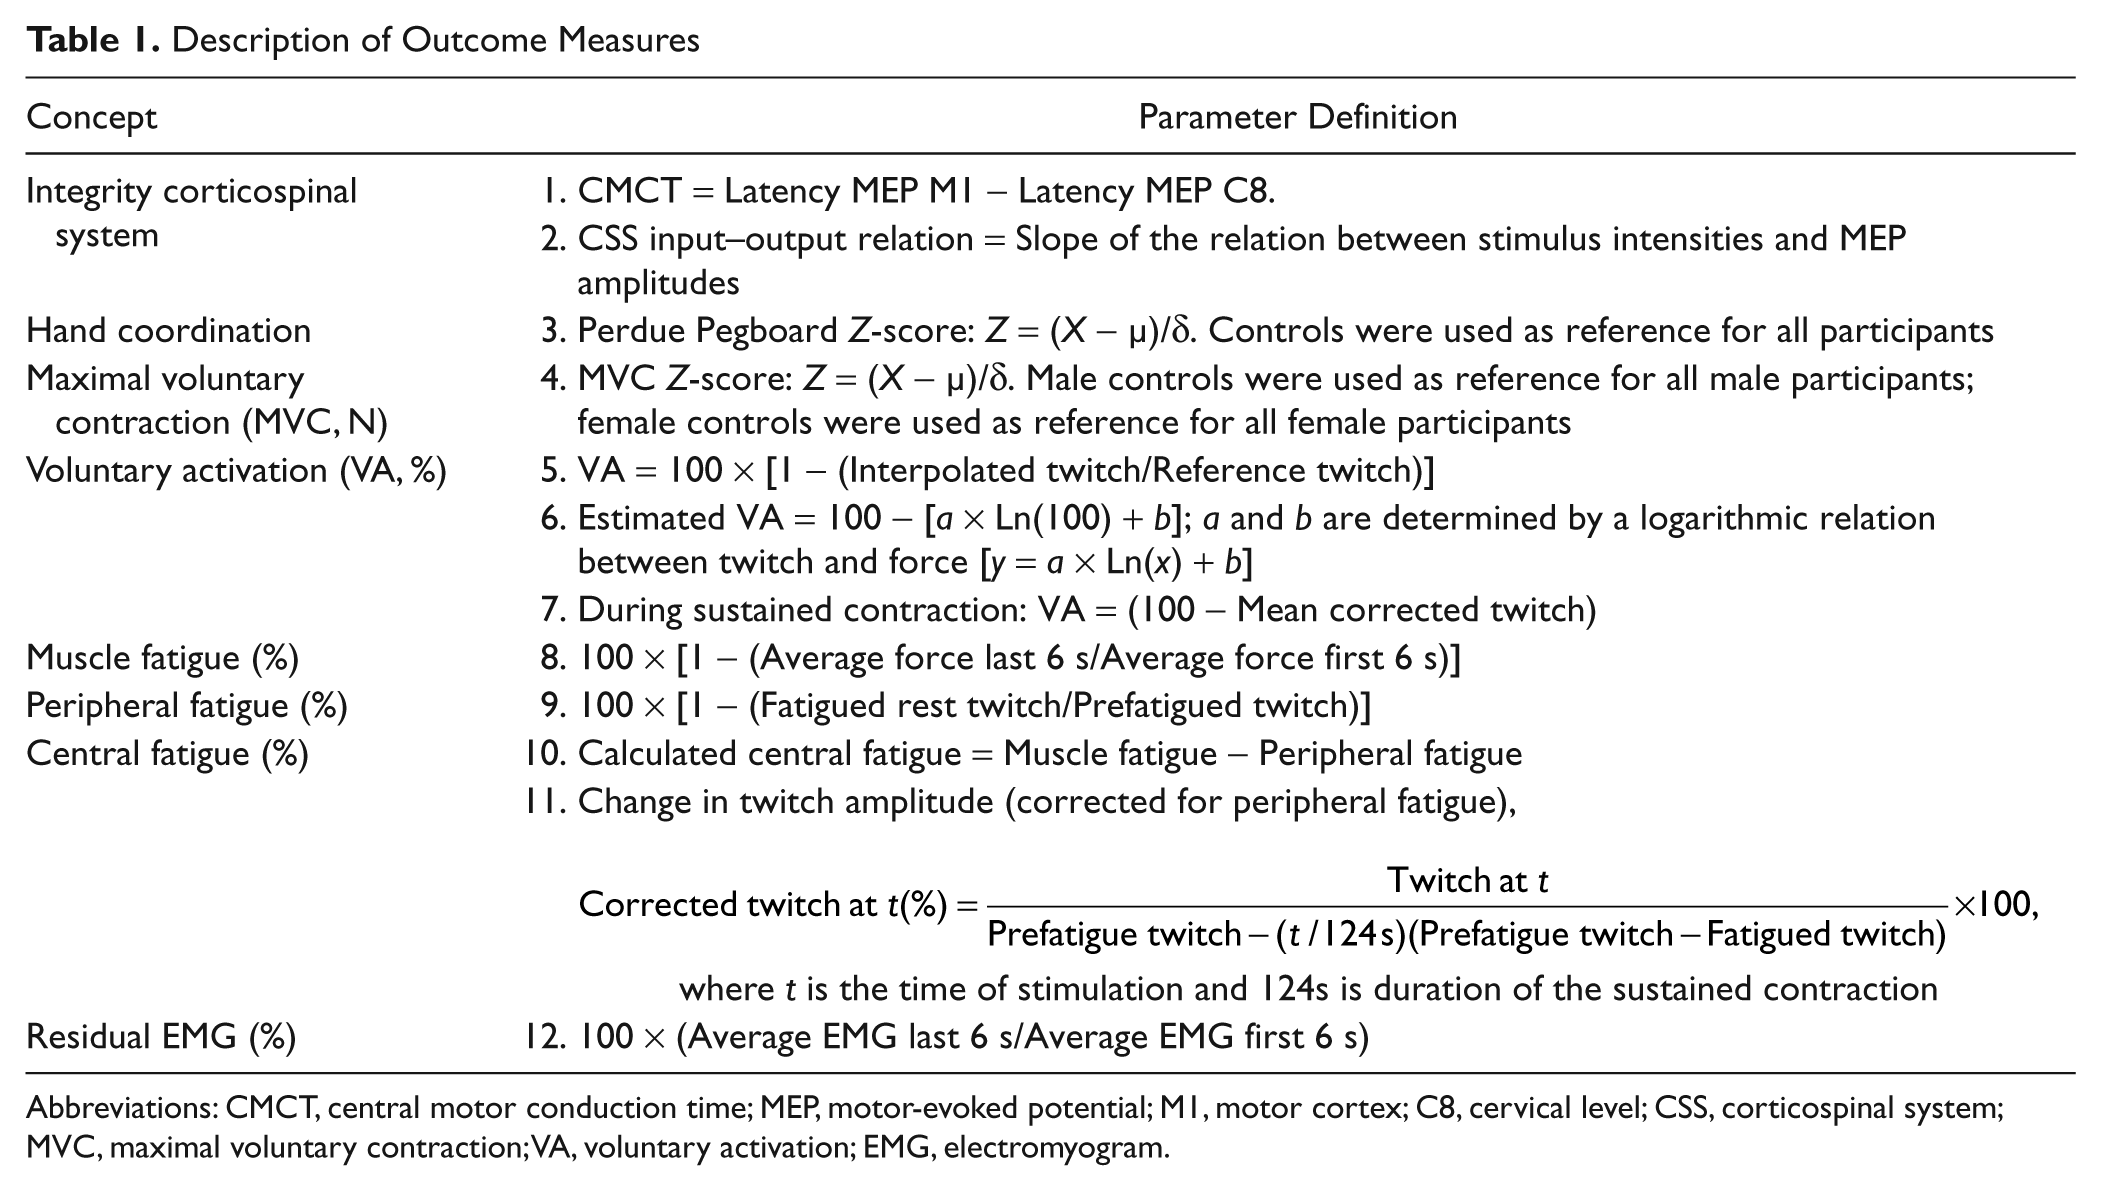
Abbreviations: CMCT, central motor conduction time; MEP, motor-evoked potential; M1, motor cortex; C8, cervical level; CSS, corticospinal system; MVC, maximal voluntary contraction; VA, voluntary activation; EMG, electromyogram.
Questionnaires
Perceived fatigue was measured using the Fatigue Severity Scale (FSS). 31 Mood was assessed using the depression subscore of the Hospital Anxiety and Depression Scale (HADS) questionnaire.32,33 Sensory dysfunction of the hands of patients was self-reported and was coded as present or not.
Force measurements
To compare MVCs between patients and controls (combined for male and female participants), we converted the force data into Z-scores. Male controls served as a reference for both male controls and male patients, and female controls as a reference for female controls and female patients. Thus, a female participant with a Z-score of −0.5 has an MVC that is 0.5 standard deviation (SD) smaller than the average MVC of female control participants.
Voluntary activation
Voluntary activation (VA) was determined using the twitch interpolation technique and calculated according to Equation 110,23:

In addition, we determined a logarithmic relation between twitch amplitude (% Reference twitch) and the force (% MVC) on which the twitch was superimposed during the submaximal contractions (tasks 1-2). With this model (Table 1, point 6), we estimated the twitch at 100% MVC. 34 This twitch was used to estimate the voluntary activation (eVA, %) in a manner similar to Equation 1.
Fatigue measurements
To quantify muscle fatigue, we expressed the mean force during the last 6 s of the sustained contraction as a percentage of the first 6 s. Peripheral fatigue was estimated by the twitch after the sustained contraction expressed as a percentage of the prefatigue twitch.
Central fatigue during the sustained contraction was determined in 2 ways. First, we calculated the difference between the force decline and the amount of peripheral fatigue (calculated central fatigue). Second, we determined the change in interpolated twitch at different moments during the sustained contraction. The twitches were corrected for peripheral fatigue (see Table 2, point 11) 35 :
Descriptive Variables for MS Patients and Controls
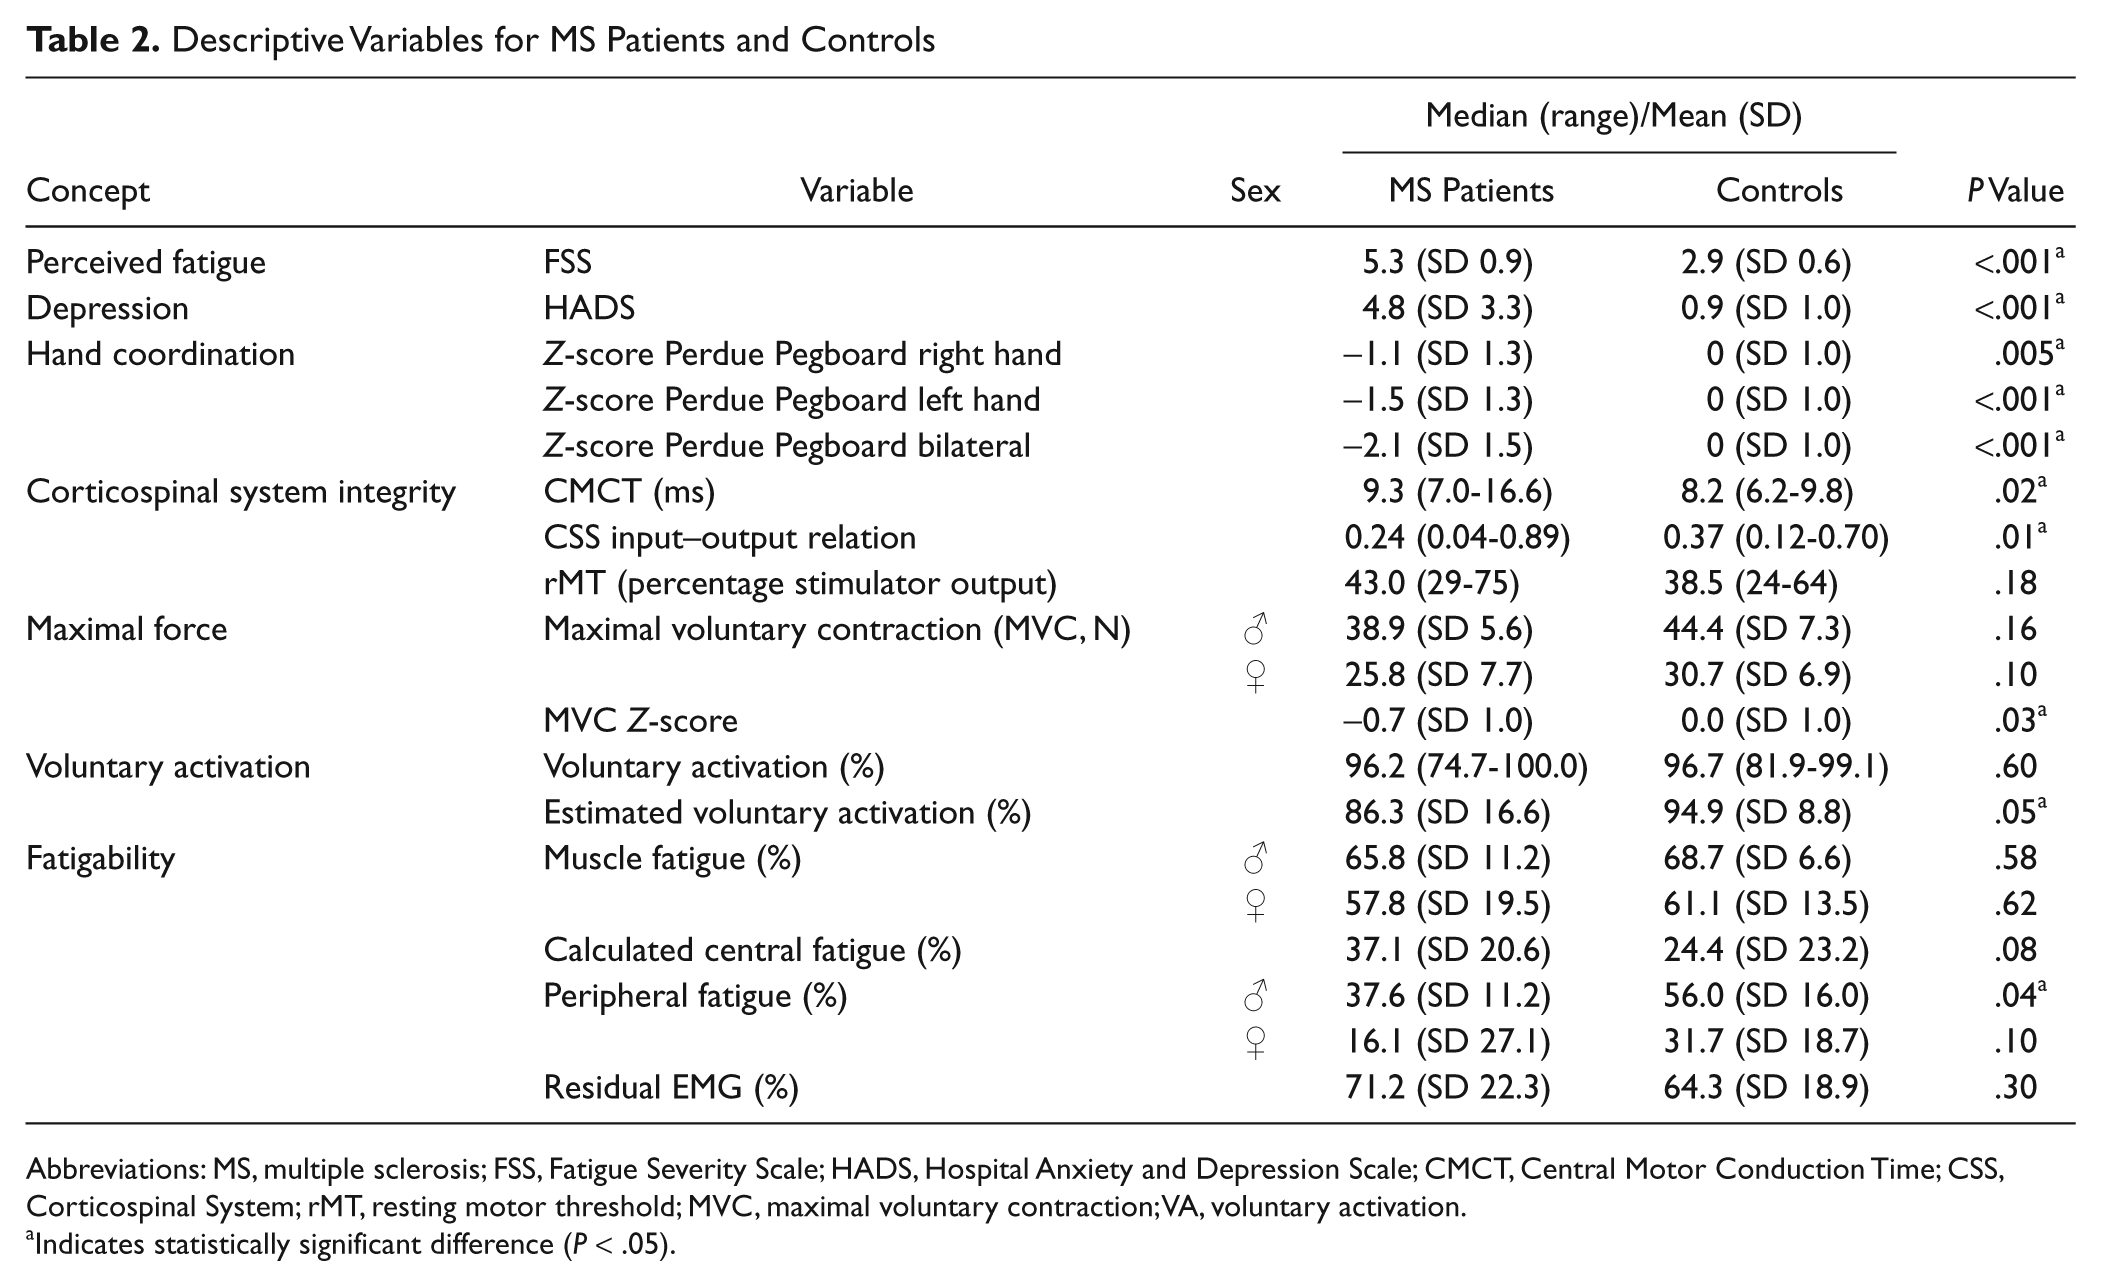
Abbreviations: MS, multiple sclerosis; FSS, Fatigue Severity Scale; HADS, Hospital Anxiety and Depression Scale; CMCT, Central Motor Conduction Time; CSS, Corticospinal System; rMT, resting motor threshold; MVC, maximal voluntary contraction; VA, voluntary activation.
Indicates statistically significant difference (P < .05).
Residual EMG was calculated as the average EMG during the last 6 s of the sustained MVC expressed as percentage of the average EMG during the first 6 s.
Statistical Analysis
Normality of the data was examined graphically and analytically (Kolmogorov-Smirnov test). Normally distributed variables were compared with independent t tests (FSS, MVC, eVA, muscle fatigue, calculated central fatigue, twitch, pegboard data, and EMG). The Mann-Whitney U test was used for nonnormally distributed variables (rMT, CMCT, corticospinal input–output relation, VA, and HADS). The twitches during the sustained contraction were tested using repeated measures analysis of variance (including the interaction between group and time).
The association between MVC Z-score and voluntary activation was determined using linear regression analysis. Separate linear regression analyses were performed for patients and controls with FSS as the dependent variable and the different measures of corticospinal system integrity, MVC, voluntary activation, and muscle fatigue each as an independent variable. In addition, a multivariable regression analysis was performed to investigate whether muscle fatigue, corrected for the MVC Z-score, could explain the variation in FSS in patients.
As it is known that depression is related to the FSS score in MS patients,12,36-40 we also determined the association between FSS score and the HADS depression subscore. Additionally, we analyzed the effect of the depression subscore on the observed associations with FSS using multivariable regression analysis.
Linear regression model assumptions were examined using analyses of the residuals and found to be met adequately. The level of statistical significance was set at .05 (2-sided). We did not correct for multiple testing for the different measures of one construct because of the correlation between these measures. 41
Results
In 1 patient, we did not obtain reliable twitches during the brief MVCs. In 2 participants (1 patient and 1 control), we could not obtain accurate twitches during the sustained contraction because of technical problems; their data were not included in the voluntary activation analysis.
Patient Characteristics
The median disease duration was 4 years (range 1-23); the median EDSS score was 2.5 (range 0-5). Hand coordination assessed by the Perdue Pegboard score was lower in MS patients than controls (Table 2). MS patients perceived significantly higher levels of fatigue (Table 2; a common cutoff value for fatigue is 436,38) and depression than controls (both parameters, P < .001). No relation between FSS and disease duration (P = .32) or EDSS (P = .25) was found. The reliability of the FSS was moderate to good (Cronbach’s α was .84 for patients and .63 for controls).
In the patients, a significant association between depression and FSS score was observed (R2 = 0.36, P = .003). One patient had a depression score above threshold. 42 This individual also had the highest FSS score; however, MVC, voluntary activation, and measures of fatigability did not differ from other patients. This participant also did not affect the association between depression and FSS score; therefore, we included this patient in our analysis.
TMS Data
Patients had increased central motor conduction times (median = 9.3 ms; Figure 2A) and a lower slope of the corticospinal input–output relation (median slope = 0.24) compared with controls (Table 2, Figure 2B). We found no significant difference in rMTs between the groups (Table 2).
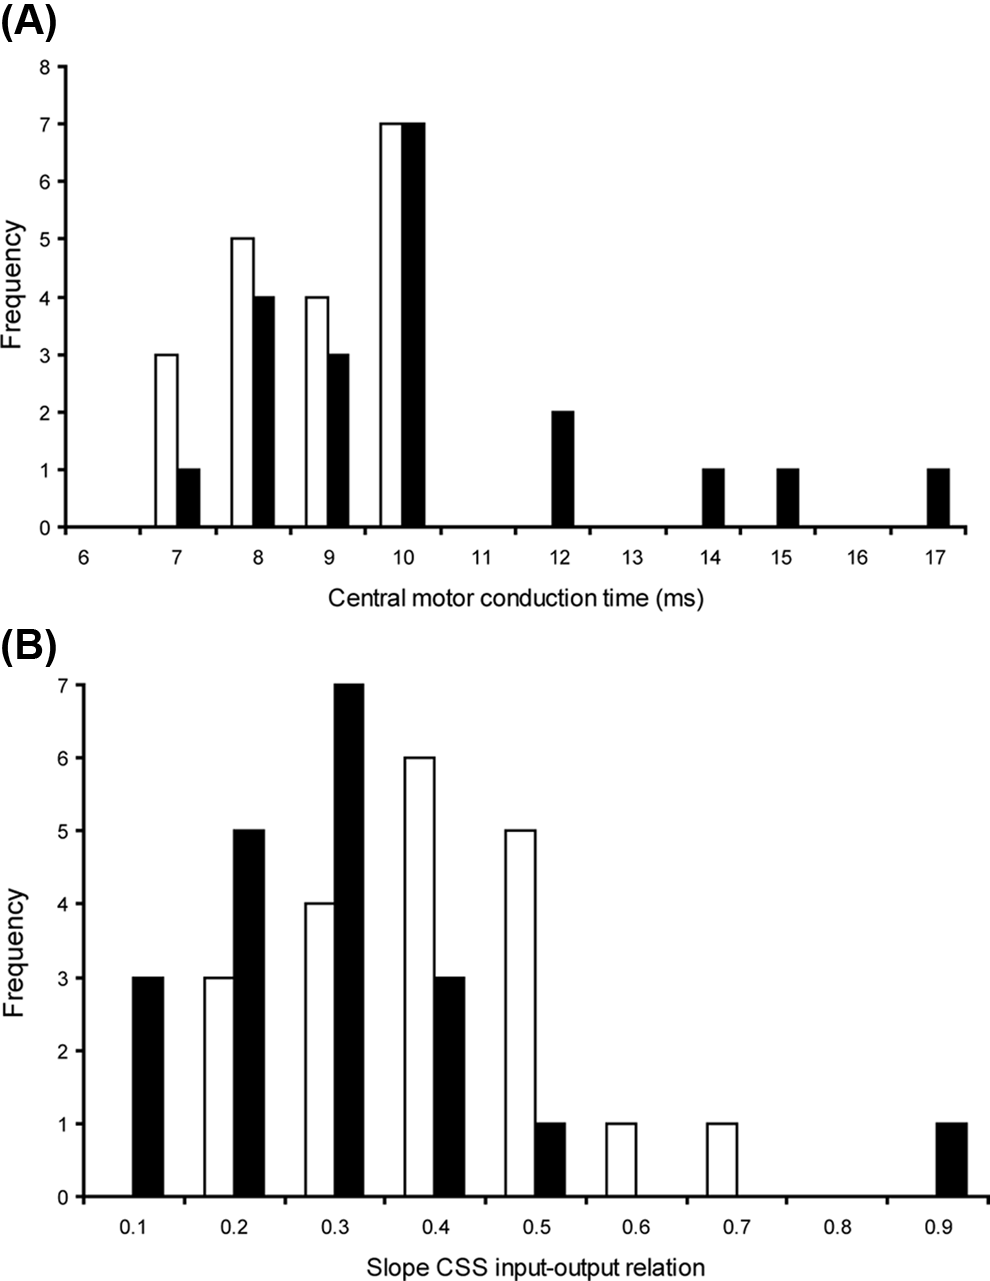
(A) The frequency distribution of the central motor conduction time (ms; latency motor-evoked potentials [MEPs] at M1—latency MEP at C8) is presented for patients (black bars) and controls (white bars). (B) The frequency distribution of the slope of the corticospinal input–output relation (patients, black bars; controls, white bars)
MVC Force and Voluntary Drive
The MVC of the right FDI was 30.6 N (SD = 9.4) for MS patients and 34.8 N (SD = 9.3) for controls. The MVC Z-score was significantly lower for MS patients (Table 2) than controls. Although voluntary activation was slightly more variable and included lower values for patients than for controls, only the estimated voluntary activation showed a small significant difference (P = .03; Table 2). In patients, a positive association was observed between MVC Z-scores and voluntary activation, indicating that the lower MVC Z-scores were accompanied by lower voluntary activation levels. The association between MVC Z-scores and voluntary activation was better for the estimated voluntary activation (R2 = 0.47) than for voluntary activation measured during MVCs (R2 = 0.33). No relation was found in the controls (both parameters P > .40).
Fatigue Measures
Force decline during the sustained contraction was similar for patients and controls (61%, SD = 17, and 63%, SD = 12; P = .58, Figure 3A). This decline was found to be associated with the MVC (partial R2 = 0.15, P = .02) but not with group (P = .99).
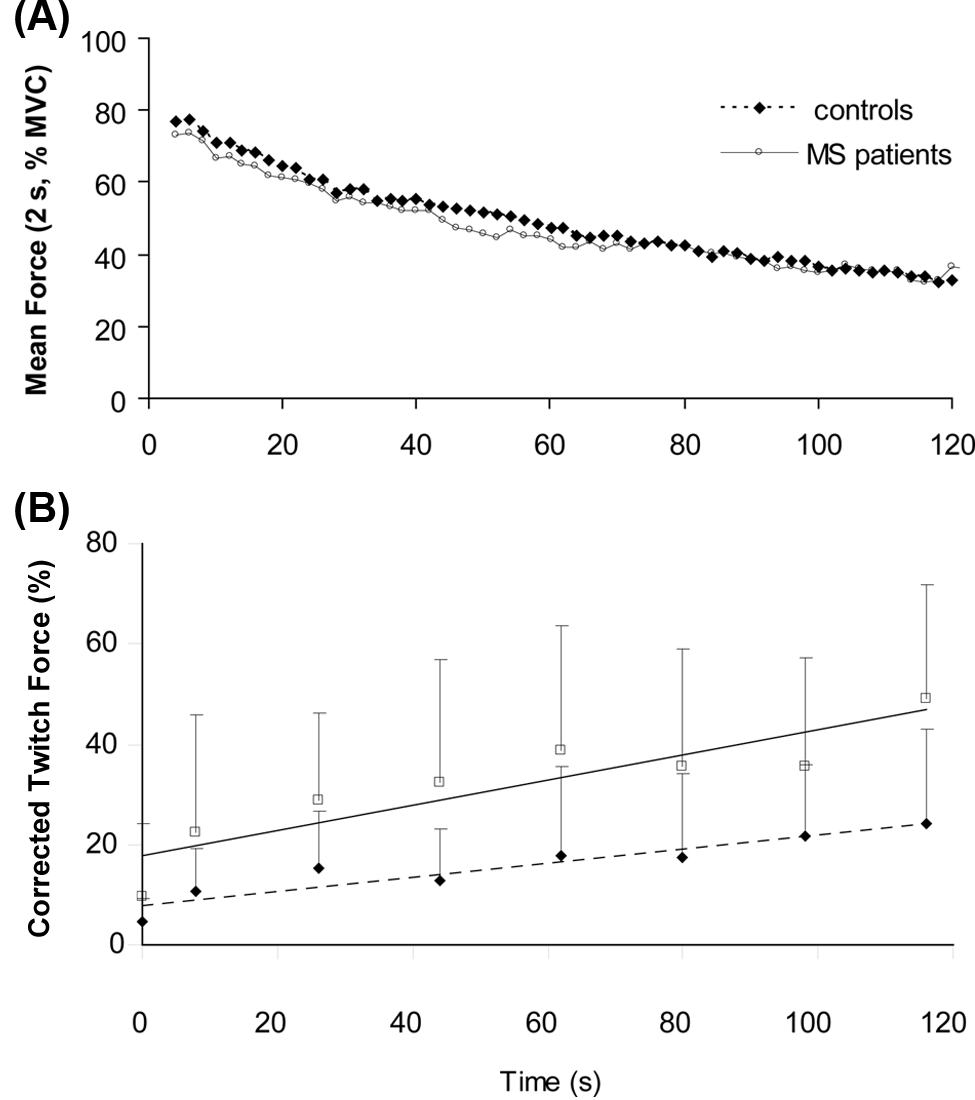
(A) Force of the first dorsal interosseus during a 2-minute maximal voluntary contraction. The continuous line represents mean force (averaged over 2 s) of MS patients, and the dashed line represents data of control participants. (B) Amplitude of the interpolated twitch forces (mean, standard deviation [SD]) during the experiment. The first data point shows the interpolated twitch during the brief MVC at the start of the experiment. Twitches 2 to 8 show the interpolated twitches during the sustained contraction; a twitch was evoked every 18 s. All twitches were evoked by double pulse stimulation, and the twitches during the sustained contraction were corrected for peripheral fatigue (see Methods section). Open squares show data obtained in MS patients, filled squares show data for controls. The continuous line represents the association for MS patients. The dashed line represents the association for controls. The twitch amplitude was significantly larger in the patients (P < .001). A significant increase in twitch amplitude was seen for both groups (P < .001) with a significant interaction between the groups (P < .03).
The corrected twitches during the sustained contraction increased for both groups (P < .001), reflecting an increase in central fatigue. The amplitudes were significantly larger in patients compared with controls (P < .001; Figure 3B). No significant interaction, however, was observed between group and time (P = .30). If we included the twitch obtained during the brief MVC at the start of the experiment, a significant interaction effect between the groups was obtained (F(5.3, 174) = 2.524, P = .03, Greenhouse-Geisser corrected). The calculated central fatigue also showed a small (nonsignificant) difference between patients and controls (Table 2; P = .08).
After the sustained contraction, the rest twitch declined less in patients than in controls (patients: 23%, SD = 25; controls: 39%, SD = 21; P = .04) and in female than in male participants (patients: P = .03; controls: P = .01), indicating less peripheral fatigue in patients and female participants. The decline in twitch was positively associated with the MVC Z-score (P = .03) but not with group (patients and controls, P = .25)—the difference between groups probably being caused by differences in MVC. Residual EMG was similar among groups (Table 2), indicating that the EMG was similarly affected by the sustained contraction in patients and controls.
Relation With FSS in MS Patients
The FSS score differed significantly between patients and controls; therefore, we analyzed the associations of the various parameters with FSS for patients and controls separately (Table 3). In the text, only significant associations between the analyzed variables and FSS are described. In controls, no significant associations were found.
Association Between Perceived Fatigue and Different Measures of Corticospinal Tract Integrity, Voluntary Activation, Maximal Force, and Fatigability in MS Patients and Controls
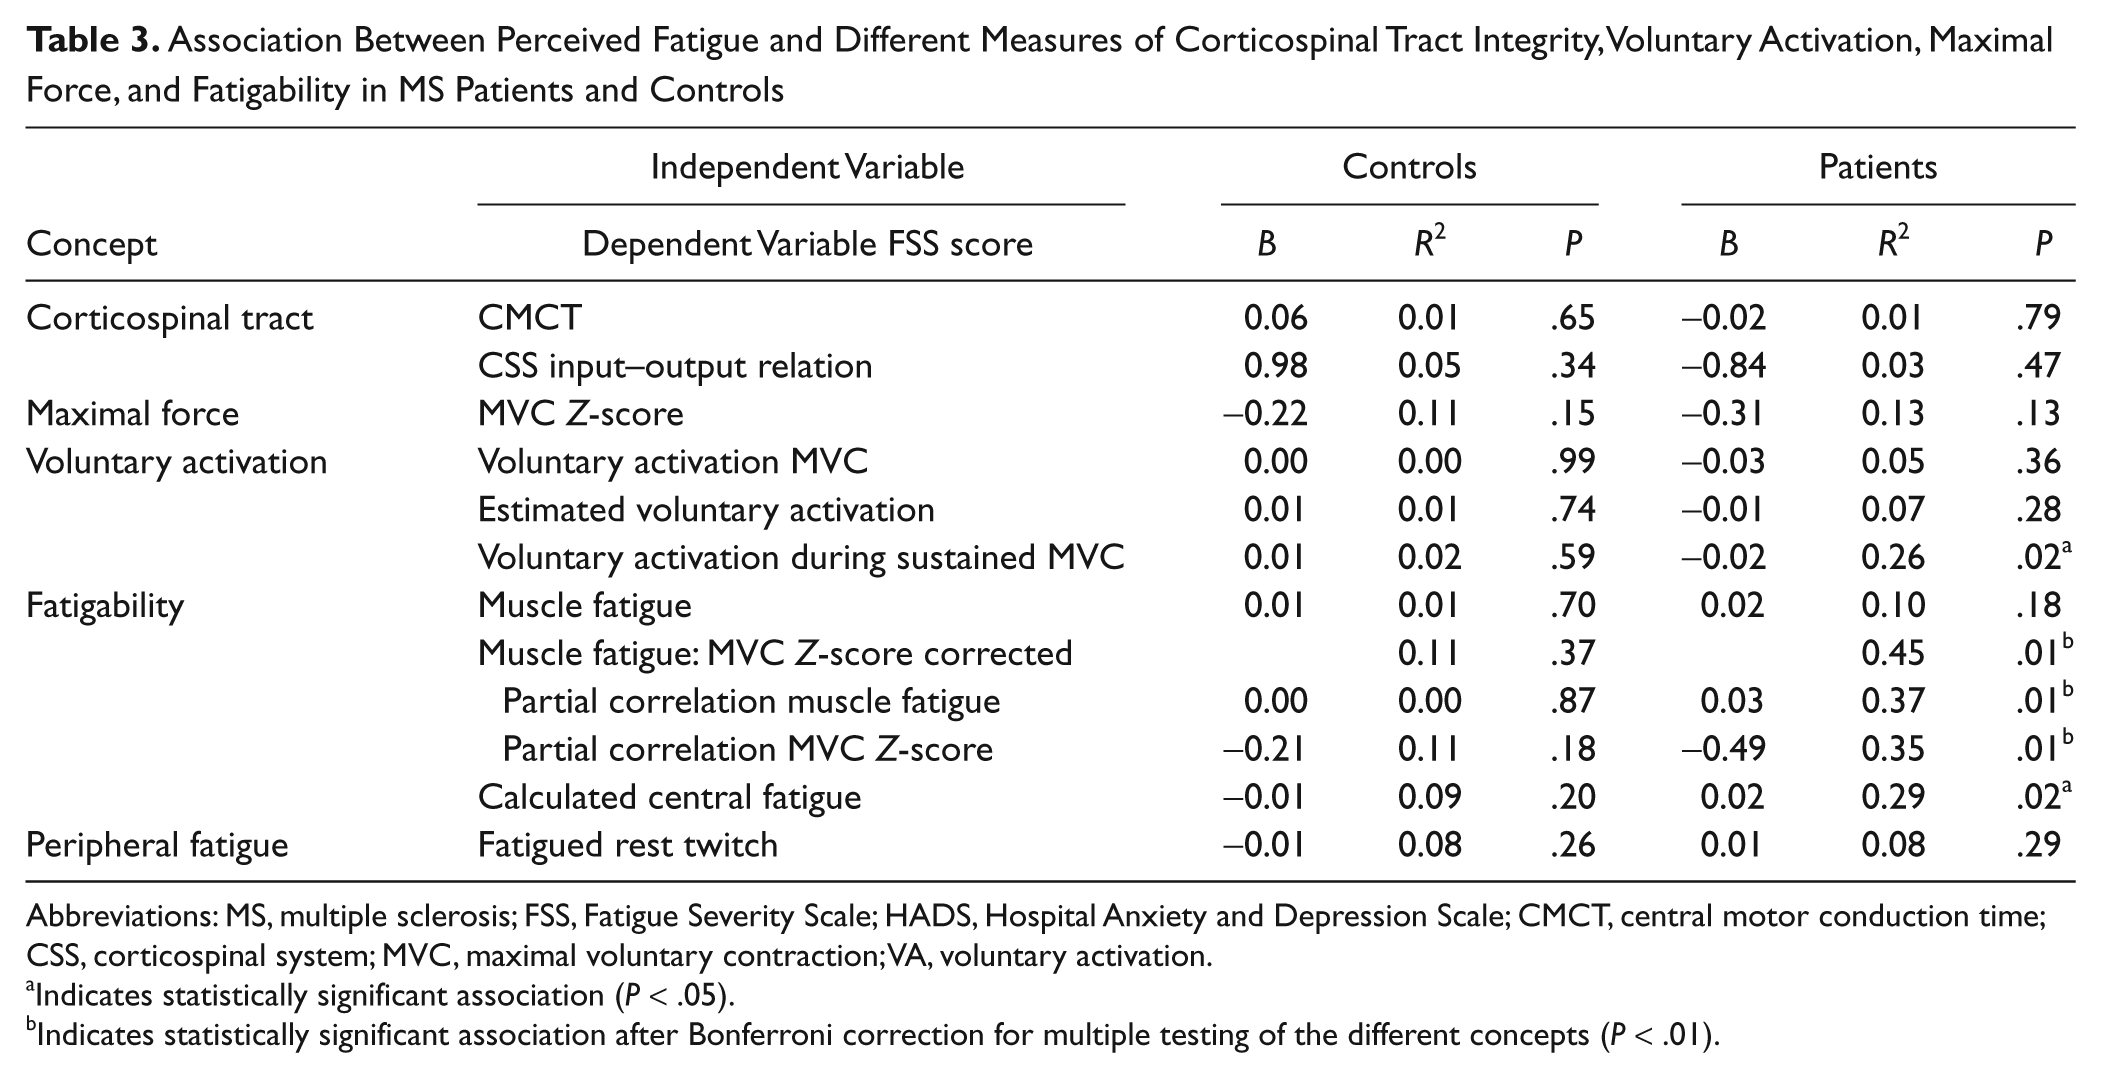
Abbreviations: MS, multiple sclerosis; FSS, Fatigue Severity Scale; HADS, Hospital Anxiety and Depression Scale; CMCT, central motor conduction time; CSS, corticospinal system; MVC, maximal voluntary contraction; VA, voluntary activation.
Indicates statistically significant association (P < .05).
Indicates statistically significant association after Bonferroni correction for multiple testing of the different concepts (P < .01).
FSS and muscle fatigue
The force decline was significantly associated with MVC. Therefore, we included the MVC Z-score in the analysis between FSS and fatigability. This analysis yielded a significant positive association (overall model: R2 = 0.45, P = .01; see Table 3 for partial correlation values), indicating that patients with higher FSS scores developed more muscle fatigue than was expected (on the basis of their MVC Z-score). Without correcting for the MVCs no association between FSS and muscle fatigue was found (Table 3).
FSS and central fatigue
A positive association was observed between FSS and the calculated value of central fatigue (R2 = 0.29; P = .02). During the sustained contraction, FSS was significantly associated with the corrected twitch amplitude (mean twitch R2 = 0.25; P = .03). However, no association was found with the change in twitch amplitude over time (P = .90).
FSS and peripheral fatigue
No association was present between FSS and the decline in twitch after the sustained contraction (P = .29), nor when correcting for MVC Z-score (P = .90).
Relation With FSS After Correction for Depression in MS Patients
Depression is positively associated with perception of fatigue.12,36-40,43 To control for possible confounding effects of depression, we analyzed the association between depression and the described parameters. Depression subscores only showed a significant association with muscle fatigue (R2 = 0.21; P = .05). After the inclusion of the HADS depression subscore in the models, the association of FSS with muscle fatigue and MVC Z-scores (R2 = 0.77; P < .001) and the models that included central fatigue (R2 = 0.54; P = .002) became stronger.
The MVC Z-scores at first did not show an association with the FSS; however, after inclusion of the HADS depression scores, the analysis resulted in a strong association with FSS (R2 = 0.64, P < .001; with a significant contribution of MVC Z-scores, P = .002). To check whether this strong association was coming from 1 or 2 participants, we randomly excluded 2 participants from the data set and repeated the analysis (we repeated this procedure 5 times). Every analysis showed a strong association between FSS scores (dependent variable) and MVC Z-scores and depression (independent variables; R2 varied between 0.59 and 0.68).
Discussion
The main results demonstrate a strong association between fatigue perceived by MS patients and (1) the decline in force during a sustained maximal contraction when correcting for maximal force values and (2) to a lesser extent, measures of voluntary activation during a sustained contraction. Stronger associations were observed when including depression scores in the multivariable analysis. Furthermore, we demonstrated that for comparison of fatigue-related parameters between patients and controls, correction for individual maximal force is essential.
Significant differences between MS patients and controls for measures of fatigability have been described.10,11,14,17,44-47 The present data, however, demonstrate significant associations between perceived fatigue and measures of fatigability in MS patients. The positive association between FSS and muscle fatigue could only be demonstrated after correcting for maximal force. This observation explains why several other groups who investigated this relation explicitly9-14 did not find such an association. The positive association between muscle fatigue and MVCs was described both in controls 15 and in MS patients. 13 However, to our knowledge, no other study that aimed to investigate the association between perceived and muscle fatigue has corrected for this association.
One point of concern is the relatively small number of patients that we have used in the multivariable analysis (ie, including depression scores), but the strong associations indicate that our data can serve as a starting point for further large population studies.
Mechanisms of Fatigue in MS Patients
The pathology of MS suggests that fatigue in MS patients has a central origin. This suggestion is further strengthened by results from TMS studies,18,44,45 functional MRI studies,48-50 and anatomical MR studies.51-53 However, there are scant data that actually show an association between parameters linked to functionality of the central nervous system and fatigue. Also, in our experiments, the integrity of the corticospinal system—as measured with CMCT and the corticospinal input–output relation—was not associated with FSS. 10 Thus, although we found indications of decreased integrity of the corticospinal tract, together with a decline in maximal force and voluntary activation in MS patients, increased perception of fatigue is not simply caused by a deterioration of the corticospinal tract.
We studied fatigue-related changes in a hand muscle instead of a leg muscle because lower-extremity muscles are more prone to show signs of deconditioning. Deconditioning or other changes in the periphery (muscle or connective tissue) related to diminished muscle usage and muscle weakness are likely to contribute to an increased perception of fatigue. Additionally, the corticospinal tract is more important for control of hand muscle than leg muscles. 24 It is noteworthy that the present associations were found in hand muscles, despite the lack of associations with parameters associated with the integrity of the corticospinal tract. The fact that the associations between the various parameters and FSS were still present after including depression scores in the analyses suggests that the associations are not the result of a confounding effect of depression. More likely, these data suggest that fatigue perceived by MS patients includes at least 2 dimensions—a motor-related part and a mood-related part. This is consistent with other studies that have emphasized the multifactorial cause of fatigue.54-56 Our study further shows that the study of fatigue is complicated by interactions between the involved parameters. However, the strong associations that we obtained indicate that using a sustained fatiguing contraction is a promising setup to study fatigue in MS patients.
Voluntary Activation
We used ulnar stimulation to measure voluntary activation of the FDI muscle. Ulnar stimulation tends to underestimate the twitch force because in addition to the FDI, it also activates the index finger adductor (ie, first palmar interosseus 57 ). This underestimation of the interpolated twitch results in an overestimation of the voluntary drive.58,59 In the present experiment, we used the interpolated twitch technique to compare voluntary activation between MS patients and controls. It is not expected that the aforementioned issues with this technique will affect controls and MS patients differentially, and therefore, this technique is still valuable for comparisons between groups. 60
In conclusion, our data show a strong association between fatigue perceived by MS patients and measures of fatigability. This association became apparent only after correction for maximal force. Fatigue-related data should therefore be corrected. The associations between physiological parameters and perceived fatigue exist independent of the association between depression and fatigue. Increased fatigue in MS participants is therefore likely to consist of both motor-related and mood-related dimensions.
Footnotes
Acknowledgements
We thank Tjalling Nijboer and Koen Vaartjes for their assistance in the preparation of the setup, Drs Rob Bakels and Daniel Kernell for their comments on the manuscript, Dr Huib Burger for his useful input for the data analyses, and Dr Han van der Hoeven for help with the TMS stimulation.
The author(s) declared no potential conflicts of interest with respect to the research, authorship, and/or publication of this article.
The author(s) received no financial support for the research, authorship, and/or publication of this article.