
Abstract
Background. Promoting whole body activities, such as walking, can help improve recovery after stroke. However, little information exists regarding the characteristics of daily walking in patients enrolled in rehabilitation poststroke. The objectives of this study were to: (1) examine the quantity of walking and duration of individual bouts of walking during an inpatient day, (2) compare standard laboratory symmetry measures with measures of symmetry captured throughout the day, and (3) investigate the association between quantity of walking and indices of stroke severity. Methods. The study examined ambulatory activity among 16 inpatients with subacute stroke who were bilaterally instrumented with a wireless accelerometer above the ankle for approximately 8 continuous hours. Results. On average, patients demonstrated 47.5 minutes (standard deviation [SD] = 26.6 minutes) of total walking activity and walking bout durations of 54.4 s (SD = 21.5 s). A statistically significant association was found between the number of walking bouts to total walking time (r = .76; P = .006) and laboratory gait speed (r = .51; P = .045) and between laboratory gait speed and balance impairment (r = .60; P = .013). Also, a significant increase in gait asymmetry was observed during day-long measurement compared with the standard laboratory-based assessment (P = .006). Conclusions. Rather modest amounts of daily walking were found for these ambulatory inpatients, consistent with previous reports about patients after stroke. Bouts of walking were short in duration, and the gait was more asymmetrical, compared with a standard gait assessment. Unobtrusive monitoring of daily walking exposes the characteristics and temporal qualities of poststroke ambulation.
Introduction
The extent to which physical activity is engaged in during everyday life is viewed as an important determinant of recovery and overall health status in individuals after stroke. 1,2 Developing a thorough understanding for the characteristics of physical activity (mandatory or volitional) remains an important frontier toward maximizing recovery and health after stroke. Toward this end, the focus of the present work was to develop a detailed understanding of the characteristics of walking activity within a rehabilitation facility among patients with subacute stroke.
The amount of walking performed by patients during their inpatient stroke rehabilitation day has been measured by pedometers as a step count for a primary outcome measure. 3-9 Although pedometer-based systems provide an overview of walking activity, many of these systems are limited in some regards such as: (1) difficulty in detecting periods of slow walking with stroke patients 10 ; (2) lack of specificity for walking, which means that nonstepping vertical motions have the potential to be coded as a walking event; and (3) lack of detail of the timing of the periods/bouts of walking. The latter two are of specific concern to the accuracy of characterizing patient walking activity. Therefore, to identify such measures of walking, the ABLE (accelerometry for bilateral lower extremities) system was developed and used in the present study over other commercially available activity monitors. 5 In addition, this system also has the potential to provide more detailed information of the characteristics of walking (eg, temporal characteristics of individual footfalls) that can be used to inform therapists about important gait characteristics such as gait symmetry.
The significance of walking activity requires an enhanced understanding of the characteristics of walking. For example, walking bout duration can be used as an index for the potential cardiorespiratory challenges linked to walking. 11,12 Duration of walking bouts may also provide a more natural reflection of a patient’s endurance and potential link to independence and participation. Furthermore, the use of walking as a method to practice and improve the control of walking (eg, gait symmetry) enables task-dependent gait retraining to facilitate recovery of walking. 13
The primary objectives in this study of subacute stroke inpatients were to: (1) quantify the total time of walking and individual walking bout duration during the course of an inpatient day, (2) compare temporal swing phase symmetry between a commonly used spatiotemporal gait assessment and walking performed throughout the day, and (3) investigate the link between characteristics of walking activity and stroke severity.
Materials and Methods
Patients
A total of 16 unilateral hemiparetic inpatients with stroke (12 male; mean age, 59.74 with standard deviation [SD] = 15.3; mean days poststroke, 37.8 with SD = 24.7) were consecutively recruited from a university rehabilitation hospital. All individuals provided informed consent as approved by the Research Ethics Board of Toronto Rehabilitation Institute, Toronto, Ontario. Potential participants were first evaluated by members of the hospital physical therapy team. Those who were able to walk independently with or without the aid of a single-point cane/rollator and could transfer without supervision were referred for participation in the study.
Measurements
Ambulatory data acquisition
The ABLE system 14 (Figure 1A) was used for ambulatory data collection. The system comprised 2 commercial triaxial accelerometers (Sparkfun Electronics, Boulder, Colorado; 46 g; 4.4 cm × 1.9 cm × 6.3 cm) and a PDA (Hewlett Packard hx2410). Custom ankle sleeves were used to secure the accelerometer units just proximal to the lateral malleolus bilaterally by the investigator, and a polyester belt and pouch were used to secure the PDA to the patient’s waist. Three-dimensional accelerometer data were wirelessly transmitted to the PDA from each accelerometer unit via Bluetooth at a sampling rate of 50 Hz. Data were transferred from the PDA to a computer for storage and offline data processing. Custom-developed software was used to acquire and log data from the accelerometers.
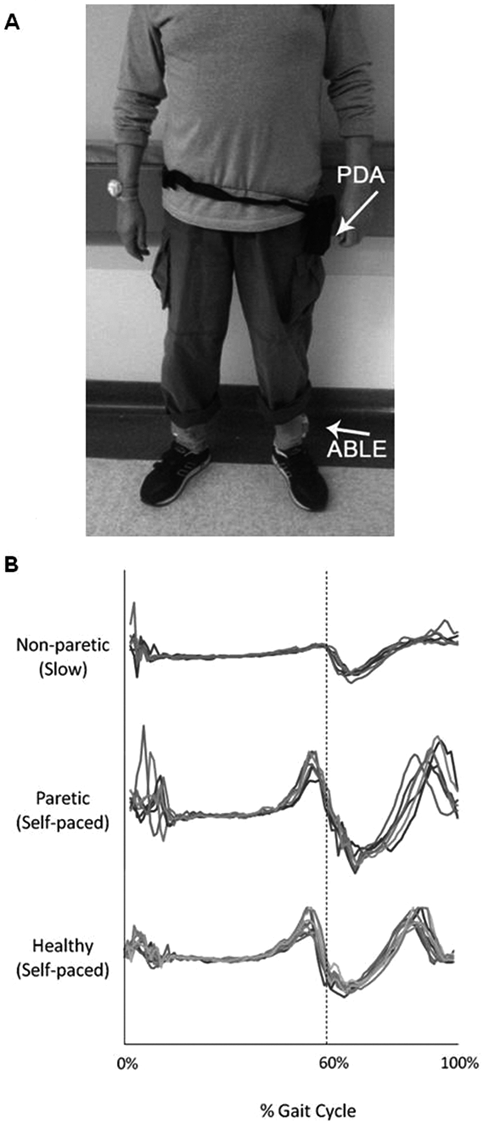
(A) Placement of ABLE system on a patient. A PDA data logger was placed around the waist. Custom ankle sleeves, housing each ABLE unit, were affixed to each ankle just proximal to the lateral malleolus (ABLE). (B) Comparison of acceleration output (in the vertical plane) during an entire gait cycle (FC-FO-FC) in a nonparetic (0.26 m/s), paretic (0.90 m/s), and healthy limb (1.21 m/s). Similar acceleration profiles are seen during an entire gait cycle—for example, a characteristic local maximum just prior to FO (60%) and a smaller local maximum at FC (0%)a
ABLE system validity and reliability
Work has been conducted to validate the use of this system to detail individual footfalls and bouts of walking. This was achieved by comparing the temporal foot-off and foot-contact (FO/FC) events determined by the ABLE system data with that determined from a gold-standard footswitch system. This has been conducted in both healthy young individuals and those with stroke to establish the predictive validity of our approach in revealing FO and FC times from the accelerometer. Overall, the pattern of acceleration (when normalized across time and amplitude) was found to be comparable across speeds and level of limb impairment (paretic and non-paretic). Figure 1B displays the normalized acceleration profile (Y-axis—vertical plane) for 3 individuals: (1) healthy young, (2) paretic limb of a stroke patient, and (3) slow walking of a stroke patient. Note that the data were normalized to the phases of the gait cycle (stance and swing), so that FO represents 0% of the cycle and FC represents 60% of the cycle. Table 1 highlights mean difference scores between accelerometer and footswitch data for both FO and FC in 6 healthy young participants. Difference scores were tabulated by comparing FC with FC and FO with FO (ie, stride time) between accelerometer and footswitch data. A difference score of 0 would indicate a perfect agreement between the 2 methods.
Differences in Timing, Comparing the ABLE System and Footswitches a
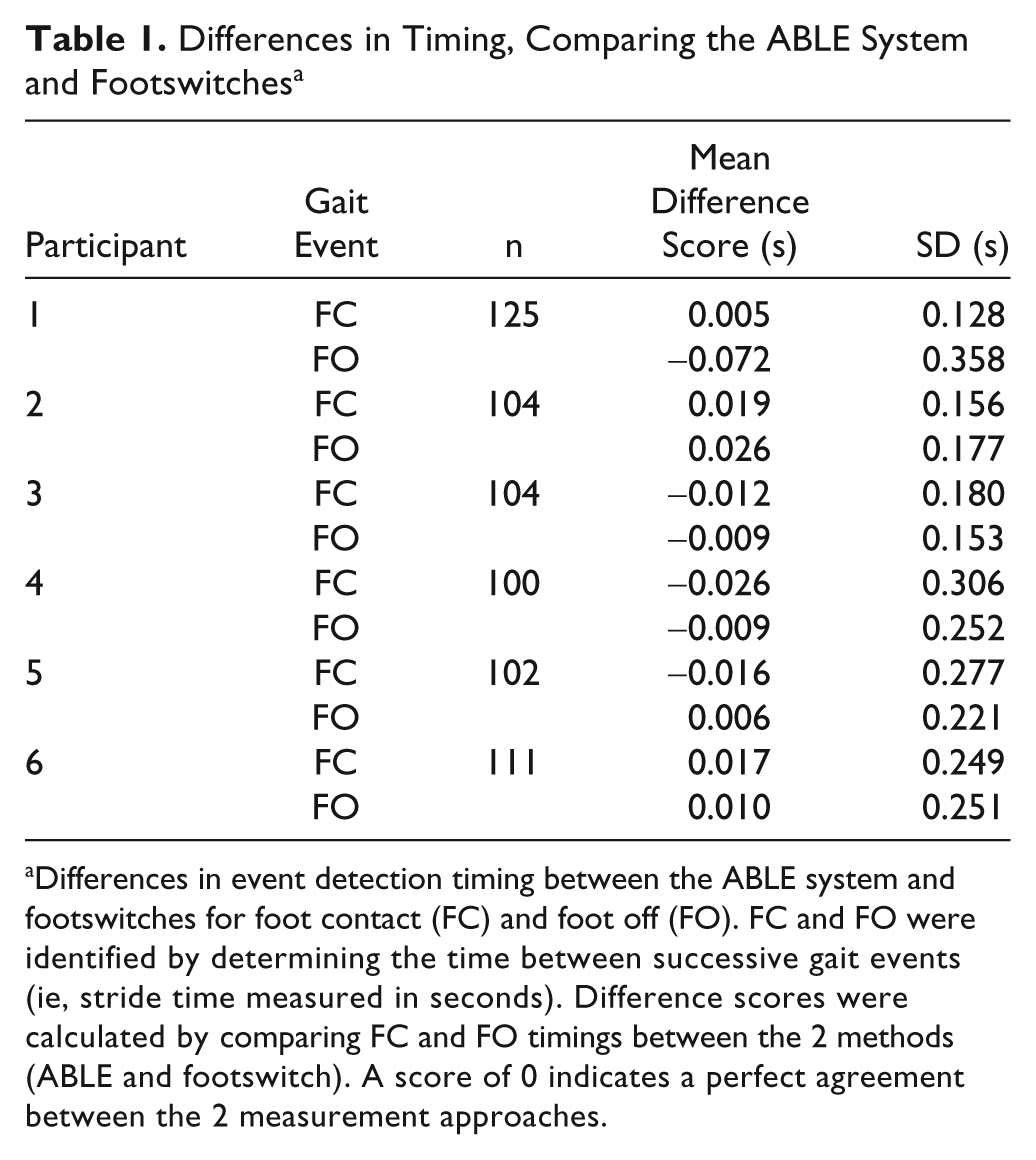
Differences in event detection timing between the ABLE system and footswitches for foot contact (FC) and foot off (FO). FC and FO were identified by determining the time between successive gait events (ie, stride time measured in seconds). Difference scores were calculated by comparing FC and FO timings between the 2 methods (ABLE and footswitch). A score of 0 indicates a perfect agreement between the 2 measurement approaches.
Gait assessment
Spatiotemporal characteristics of gait were collected using a GAITRite system (CIR Systems, Parsippany, New Jersey) sampled at 30 Hz. Patients walked across the mat at their preferred gait speed using their assistive devices. The number of walks over the mat was based on the objective to obtain at least 20 total strides. Severity of motor impairment was assessed using the Chedoke McMaster Stroke Assessment Scale (CMSA). 15 Balance was assessed using the Berg Balance Scale (BBS). 16
Protocol
Gait assessments were conducted 1 to 2 days prior to ambulatory monitoring. After routine morning activities were completed (eg, bathing, dressing, and breakfast), each patient was fitted with the ABLE system at approximately 9
Data Analysis
Detecting patterns of walking activity
Analysis of time series acceleration data was conducted to identify gait cycle events throughout the collection period. First, periods of reciprocal leg movement were identified to ensure that periods of unilateral nonwalking activities were omitted. Next, time series acceleration data were further examined to determine FC and FO times. This was done by matching the patient’s acceleration profile to a known profile for walking. The present study was specifically interested in bouts of walking rather than activities characterized by brief episodes of stepping (eg, transitions from bed to chair). Therefore, we selected a threshold of 5 consecutive bilateral strides to denote a bout of walking. This threshold was based on input from clinicians and preliminary data collection. Individual bouts of walking were also differentiated by having a pause of at least 5 s before the next period of walking.
Gait symmetry
During gait assessment, the GAITRite system permitted the evaluation of temporal symmetry. Symmetry was also calculated using FC and FO from each step taken during bouts of walking throughout the day, not including data from therapy. Both symmetry measures were calculated by taking the ratio between paretic swing time and nonparetic swing time. 17 We restricted the symmetry comparison to only periods of “steady-state” walking during the course of the day. Therefore, we only considered periods of walking in which the swing times were within the mean (± 1 SD) of swing time measured from our gait assessment. Wilcoxon’s t test was conducted between the 2 measures of symmetry. Statistically significant associations were denoted by P < .05.
Relationship to stroke severity
A correlation analysis (Pearson’s) was conducted for balance impairment (BBS) and gait symmetry during day-long collection to the total walking time and average bout duration and laboratory gait speed. A nonparametric correlation analysis (Spearman’s) was conducted for motor impairment (CMSA) to the total walking time and average bout duration and laboratory gait speed. Statistically significant associations were denoted by P < .05.
Results
Patient Characteristics and Use of the ABLE System
Patient characteristics are outlined in Table 2. Of the 16 patients, 9 required an assistive device to walk. In 1 case, a wheelchair was periodically used by a patient even though capability of walking independently existed. There were no reported cases of injury or discomfort to the proximal region of the ankles where the ABLE units were affixed. Total duration of data collected for patients 2 and 7 were shorter than for other patients because of periods of disconnection between the ABLE units and the data logger. As a result, there were some periods of the day for which data were not collected. All patients participated in daily physical and/or occupational therapy, with the exception of patient 16 who was not scheduled for therapy on the day of collection.
Summary of Patient Demographics and Clinical Information
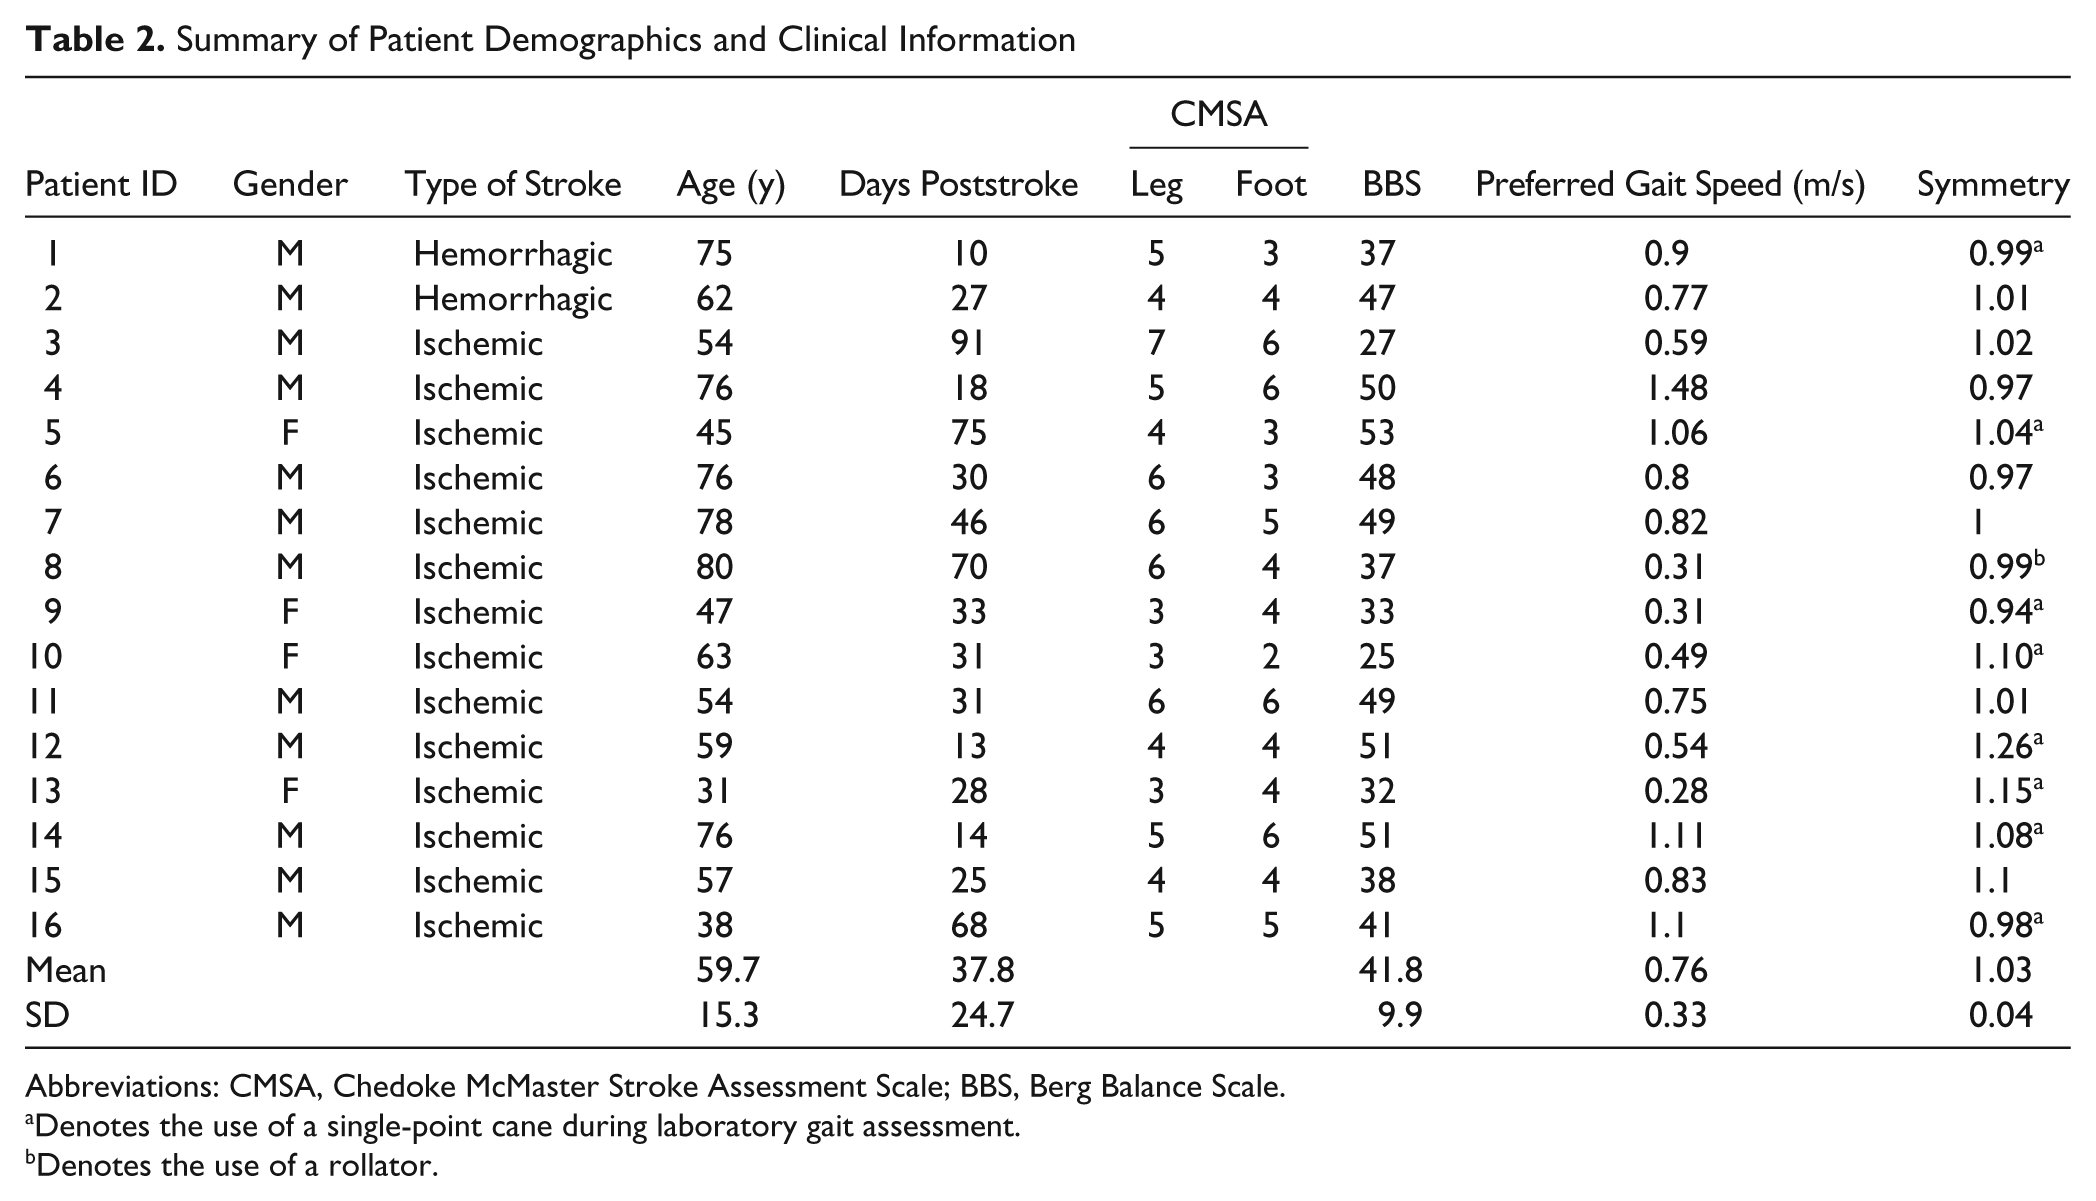
Abbreviations: CMSA, Chedoke McMaster Stroke Assessment Scale; BBS, Berg Balance Scale.
Denotes the use of a single-point cane during laboratory gait assessment.
Denotes the use of a rollator.
Quantity, Symmetry, and Pattern of Walking Activity
Measures of walking are presented in Table 3. On average, patients walked for 47.5 minutes (SD = 26.6), or 9.7% (SD = 5.4) of the total collection period. The average number of total steps taken during the collection period was 4257 steps (SD = 2857). Patient 5 performed the most amount of walking activity, with a total time of 112.7 minutes (20.8% of the collection time, total of 8730 steps); patient 8 performed the least amount of total walking activity, with 8.95 minutes (1.9% of collection time, total of 584 steps). This observation may be partly explained by the fact that patient 8 relied on a wheelchair when data were collected. This particular patient had only recently achieved the capacity to independently ambulate (within 3 days of data collection). All other patients had been independently walking for at least 7 days prior to collection.
Summary of Walking Quantity and Symmetry Measures Collected Throughout the Day
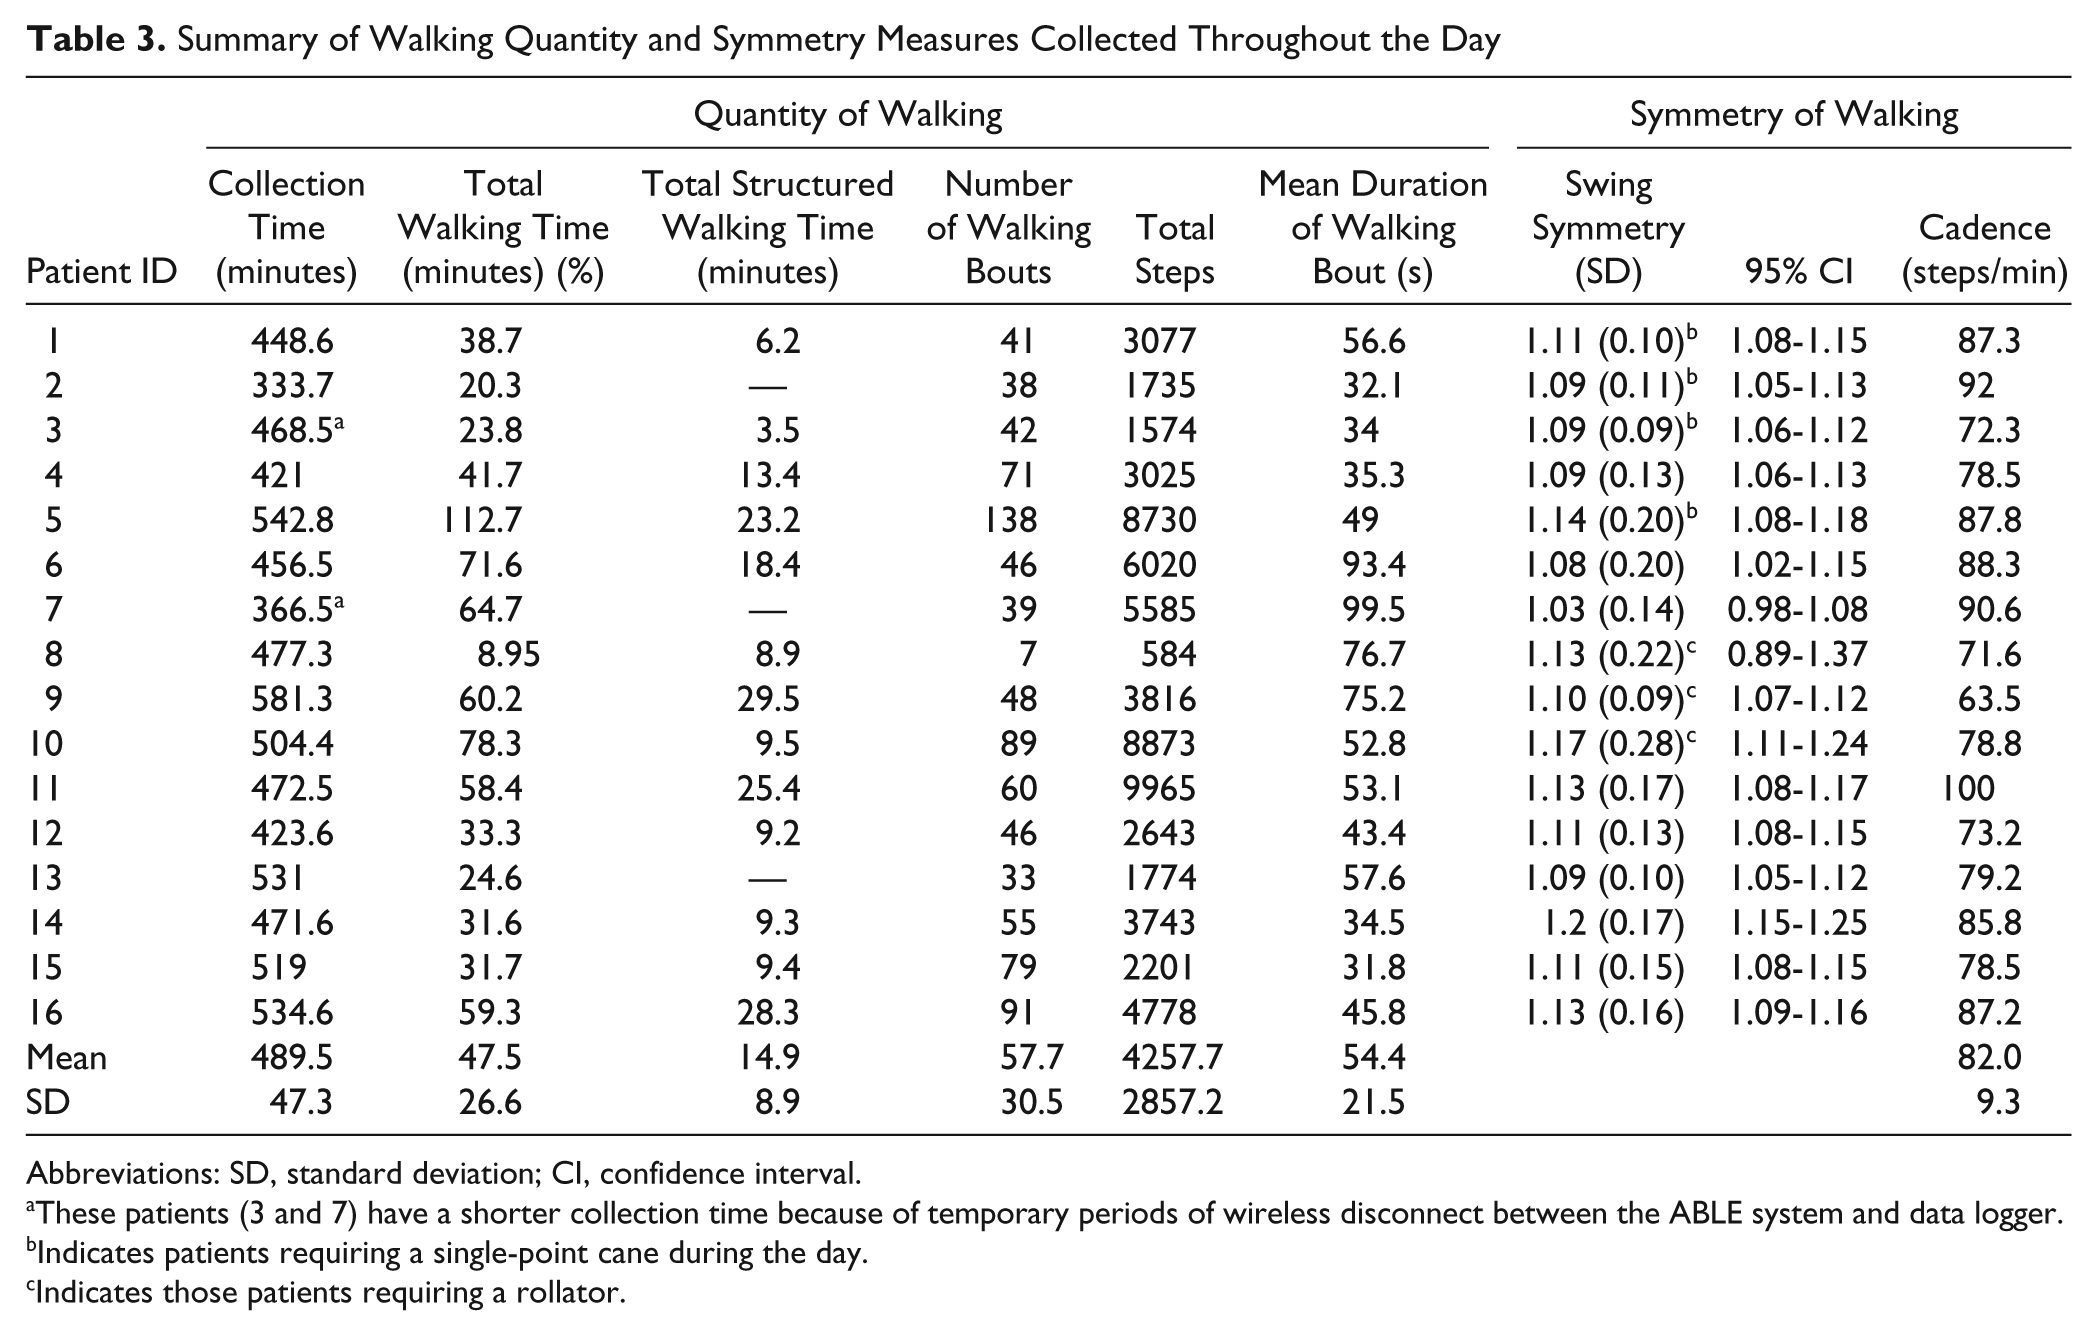
Abbreviations: SD, standard deviation; CI, confidence interval.
These patients (3 and 7) have a shorter collection time because of temporary periods of wireless disconnect between the ABLE system and data logger.
Indicates patients requiring a single-point cane during the day.
Indicates those patients requiring a rollator.
The average duration for bouts of walking performed by patients was 54.4 s (SD = 21.5 s). Patient activity logs were used to determine the total amount of therapeutic walking time, which ranged from 3.45 to 29.5 minutes. Patients 9 and 11 demonstrated the longest duration of therapeutic walking activity with 29.5 and 23.2 minutes, respectively. These observations were partly a result of the patients’ participation in an aerobic exercise program and testing in which patient 11 performed a 6-minute walk test (6MWT) once and patient 9 performed the 6MWT twice. Figure 2 illustrates the quantity of walking activity, including periods of therapy, using the frequency and duration of walking bouts for the most active patient (138 bouts) and least active patient (7 bouts). Both patients 2 and 11 self-reported walking out to a designated smoking area.
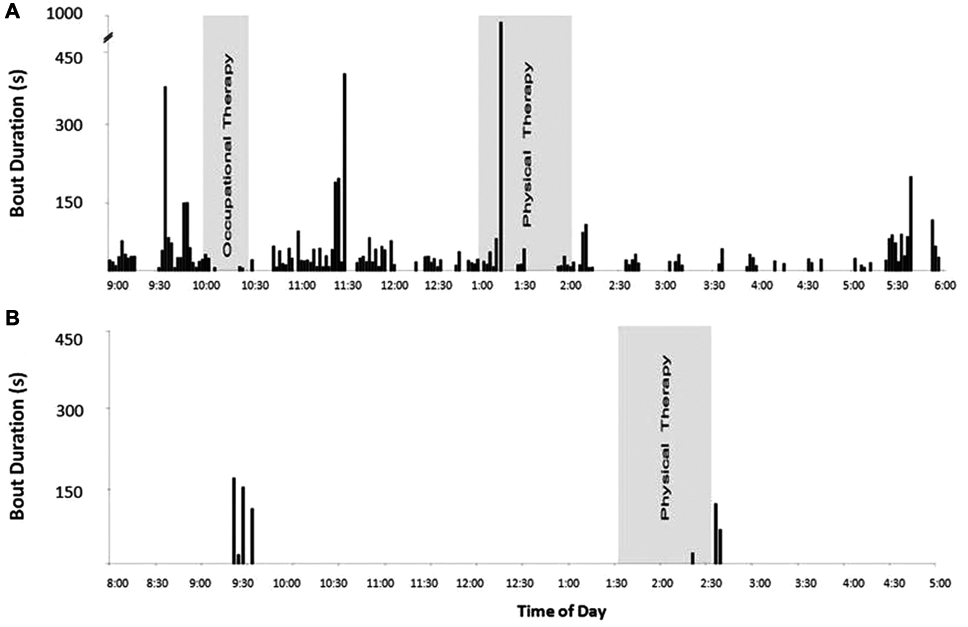
Frequency profile of walking activity from 2 different patients collected throughout the day: on the X-axis, time of day indicates when each individual bout of walking was performed. The relative durations of walking bout are represented by the Y-axis. Structured therapeutic sessions are shaded in gray. Panel A presents the walking profile of patient E who walked the most. In contrast, Panel B profiles patient H who walked the least
Across all individuals, a significant difference was observed between gait symmetry measured during the collection period and gait symmetry measured from the gait assessment (P = .006). More specifically, symmetry values revealed that 12 of the 16 patients were more asymmetrical during the course of the collection period compared with their gait during the clinical assessment (Figure 3). For 11 of these individuals, the mean value from clinical assessment was below the 95% confidence interval for ambulatory measurements of symmetry. Two remaining individuals had similar mean symmetry values, and the remaining 2 had symmetry values during clinical gait assessment that were greater than the ambulatory measurements.
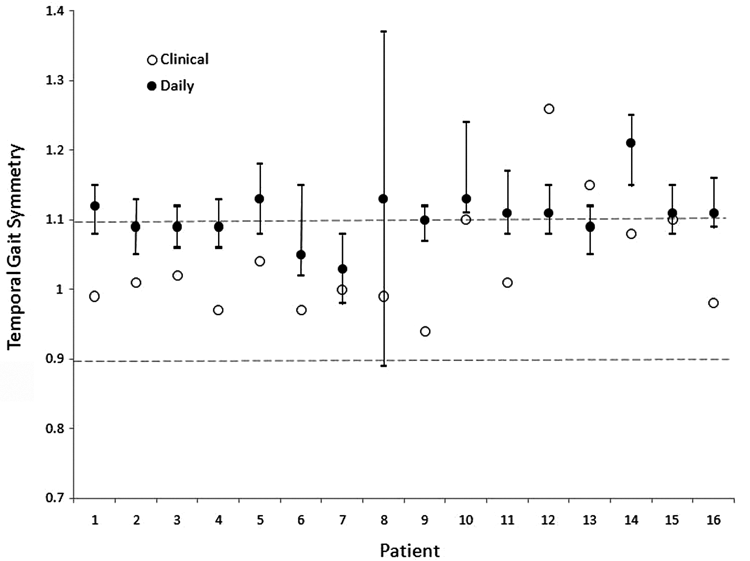
Comparison of gait symmetry collected during patient’s gait assessment (clinical) and walking performed during day-long data collection (daily). For each patient, temporal swing symmetry evaluated in the lab and the mean (95% confidence interval) for temporal swing symmetry observed during bouts of walking over the course of the day is shown. The range of normal temporal symmetry for healthy individuals is shown by the horizontal dashed lines
Association Between Stroke Severity and Quantity of Walking
A significant association was observed between the number of walking bouts and total walking time (r = .76; P < .006) and laboratory gait speed (r = .51; P < .045). Also, a significant association was observed between slower laboratory gait speed and lower BBS score (r = .60; P < .013).
Discussion
Only a few studies have examined ambulatory activity among patients with stroke 3-9 and fewer have specifically attempted to examine details regarding the quantity and symmetry of walking. 3,7,8 Revealing information about the quantity and pattern of individual footfalls provides a more complete understanding concerning patient walking behavior and its potential impact on recovery. For example, clinicians within the involved institution were particularly interested in the symmetry of gait “practiced” throughout the day to help guide training strategies for subsequent therapy sessions.
Consistent with previous reports, 3-9 the present study confirmed the relatively low quantity of walking performed by patients with stroke. However, with the additional walking parameters used in this study, it can be argued that conventional methods of walking activity classification can lead to a misinterpretation of actual patient walking levels. Based on an assessment of ambulatory activity just using step count as an outcome measure, 18 11 patients in the present study were classified as sedentary (<5000 steps/d), 2 patients were considered low active (5000-7499 steps/d), and 3 patients were considered somewhat active (7500-9999 steps/d). However, as shown in this study, patients were highly variable with respect to their frequency and duration of walking activity. For example, patients 9 and 11 were classified as sedentary and somewhat active, respectively, yet had similar total walking times (29.5 vs 25.4 minutes). With additional temporal walking information, we found that this difference was because the sedentary patient had a greater average bout duration and lower average cadence while walking than the “somewhat active” patient. Patient walking activity plotted against time (Figure 2) further characterizes walking activity by illustrating periods of the day spent walking and periods of ambulatory inactivity. Some individuals were engaged in walking bouts that occurred throughout the day (Figure 2A), whereas others appeared to restrict walking to essential activities (eg, going to meals/therapy; Figure 2B); the latter resulted in extended periods of ambulatory inactivity throughout the day. Given the importance of activity and exercise after stroke, the present study attempted to demonstrate the potential for patients to maximize the frequency or dose of walking while in rehabilitation. The current approach to monitor walking activity patterns provided important clinical information that can be used as feedback to guide activity prescription to avoid large periods of inactivity throughout the day.
Duration of walking bouts is also an important measure when characterizing walking activity because it may have an important link to endurance and fatigue. 9 Our patients walked on average less than a minute per bout, far lower than the mean 3.3-minute duration reported by Manns and Baldwin 9 in their stroke outpatients. The dissimilarity between our results and those previously reported may be because of different environments, how walking duration was defined, and the ability to specifically isolate bipedal walking from other events that would trigger walking activity (ie, seated/standing lower leg motion). Our approach relied both on the pattern of acceleration and the association between profiles from both lower limbs to confirm walking. Other methods of gait detection 5 have relied on single-limb measurement techniques, which may have been prone to misidentifications (false positives). One commercial device, composed of 5 triaxial accelerometers, does incorporate heel strike, toe-off, and swing accelerations to detect gait phases but is best at speeds >0.4 m/s. 19,20 Individual bout durations of 30 to 90 s, confirmed by patient activity logs, revealed that bouts of walking were primarily associated with completing basic functional goals necessary for daily living. This confirmed that patients may not be generating adequate frequency and intensity of walking to stimulate improvements and cardiovascular functioning. 3 Future work needs to identify the cardiovascular responses and possible benefits of daily walking limited to short bouts.
A unique finding was that patients had a greater level of asymmetry during their daily walking compared with a standard gait assessment. One possible explanation was that in the presence of a therapist, patients were on their “best behavior” and consciously altered their gait pattern during the standard laboratory-based assessment. Then, for the remainder of the day, patients may have adopted their preferred and likely more asymmetric gait pattern. The use of a preferred strategy that was more asymmetric during daily walking may be linked to the patient’s lack of attention to practicing a more symmetric pattern when outside the clinic. It was also possible that the challenges of daily walking (eg, distractions) limited the executive function capacity that can be directed to walking, thereby leading to a less attention-demanding gait (eg, more asymmetric). We attempted to avoid factors that may influence measured asymmetry by focusing only on periods of steady-state walking. This included periods of gait initiation/termination and/or turning where favoring one limb over the other is common. Locomotor adaptations to improve gait symmetry have been observed in prior studies of stroke. 19 However, these adaptations were observed following longitudinal unilateral step training. 21 Additional work is required to determine the capacity of patients to alter, maintain, and practice a more symmetrical gait pattern throughout the day.
It might be presumed that motor and balance impairments were a primary determinant of ambulatory activity; however, the variability in the quantity of walking activity did not seem to be accounted for by impairment levels. Other factors contributed to large variability in the pattern of walking, including the institutional environment (eg, distance from room to therapy areas), presence of visitors, and unique reasons for walking (eg, going outside to smoke). One of the more substantial limitations of the present study was the absence of healthy control data with respect to bout duration. Although no data on healthy controls were available for comparison, the mere presence of low bout duration in patients with stroke residing in rehabilitation units outweighs the absence of healthy control data. Maximizing activities that contribute to sensorimotor and cardiovascular recovery during an inpatient stay can be viewed as maximizing the opportunity for promoting recovery.
Beyond the objectives of the present study, there are several important clinical applications that are made possible by wireless accelerometry systems, such as the one presently used. First, it may be used to help therapists guide appropriate changes to therapy (eg, increased dose of walking activity). Second, such a system provides measures to monitor treatment outcomes. Finally, it can be operated as a “homework-checker” to ensure that prescribed amounts of daily walking are performed.
Conclusion
Wireless monitoring systems, such as the ABLE system, have the potential to provide additional, valuable temporal information regarding walking activity. Such information is beneficial for therapists and patients within an inpatient environment to promote and facilitate activity levels that are conducive to more practice and perhaps greater recovery.
Footnotes
Acknowledgements
The authors thank the physical therapists of Toronto Rehabilitation Institute for all of their assistance with patient recruitment. This study was supported by contributions made by the Natural Sciences and Engineering Research Council of Canada (NSERC), Canadian Institutes of Health Research and Collaborative Health Research and Development Program (#323492-06), and the Heart and Stroke Foundation Centre for Stroke Recovery. We acknowledge the support of the Toronto Rehabilitation Institute, which receives funding under the Provincial Rehabilitation Research Program from the Ontario Ministry of Health and Long Term Care. In addition, Dr Brooks holds a Canada Research Chair in Rehabilitation (tier 2).
SKP carried out patient recruitment and data collection, contributed to the design of the study and interpretation of results, and drafted the manuscript. WHG contributed to the conception and design of the study and interpretation of results, and helped draft the manuscript. DB contributed to interpretation of results and helped draft the manuscript. SEB contributed to the conception and design of the study and helped draft the manuscript. WEM contributed to the conception and design of the study and interpretation of results and helped draft the manuscript. All authors read and approved the final manuscript.
The author(s) declared no potential conflicts of interest with respect to the authorship and/or publication of this article.
The author(s) received no financial support for the research and/or authorship of this article.