
Abstract
Background. A goal of stroke rehabilitation is to harness the capacity of the brain to reorganize following neurological damage and enable restoration of function. Objective. To understand how neural oscillatory motor responses change following a therapeutic intervention and to illuminate whether these neurophysiological alterations correlate with improvements on behavioral measurements. Methods. Magnetoencephalography (MEG) was used to evaluate plasticity in motor networks following 2 weeks of intensive task-oriented therapy, which was paired with sham or peripheral nerve stimulation (PNS). Patients completed unilateral finger tapping before and 3 weeks after therapy as whole-head MEG data were acquired. MEG data were imaged using beamforming, and the resulting event-related synchronizations and desynchronizations (ERSs/ERDs) were subjected to region-of-interest (ROI) analyses. For each ROI, the authors compared the baseline and postintervention MEG response amplitude, volume, and peak location for premovement β ERD, movement-onset γ ERS, and postmovement β ERS. Results. Following therapy, all patients showed reduced postmovement β ERS response amplitudes in bilateral precentral gyri and reduced γ ERS amplitudes in the precentral gyrus of the affected hemisphere. This latter response also distinguished treatment groups, as the posttherapy γ reduction was greater in patients who received PNS. Finally, both β and γ response amplitudes were significantly correlated with improvement on several behavioral indices of motor function. Discussion. These case-series data indicate that oscillatory MEG responses may be useful in gauging plasticity in motor cortices following therapy in stroke patients.
Keywords
Introduction
Approximately 70% to 88% of persons with ischemic stroke have some degree of motor impairment. 1 A major objective in stroke rehabilitation research is to harness the capacity of the brain to reorganize after neurological damage and ultimately to increase restoration of function. A structured motor training paradigm can substantially enhance arm motor function in chronic stroke patients. 2-5 These clinically relevant improvements were associated with enlargement of motor maps in the affected hemisphere, indicating brain reorganization, when measured by transcranial magnetic stimulation (TMS). 2,6
Such changes in the cortical motor map volume are likely related to an increase in the population of motoneurons serving the affected limb or an expansion in the network’s local connectivity. Of potential clinical importance, the volume of topographic motor maps in the vicinity of a cortical lesion may shrink with inactivity and expand with physical activity involving the affected limb. 7,8 For example, Bastings et al 8 showed that stroke patients with good recovery also had larger TMS motor maps in the lesional hemisphere relative to age-matched controls. Such motor map expansion may be related to increased involvement of higher-order cortices such as the premotor and/or the supplementary motor area (SMA), but such conclusions remain tentative because TMS provides only bidimensional motor maps. Magnetoencephalography (MEG) is another noninvasive method for studying functional organization from outside the skull. The advantage of MEG over TMS is that the former can provide 3-dimensional subcentimeter mapping of cortical activity associated with recovery of motor function.
In the current study, high-density MEG was used to evaluate plasticity in motor networks following intensive motor training therapies in chronic stroke patients. 9,10 A recent larger-scale study of acute stroke showed significant improvement in motor function after an analogous motor training with peripheral-nerve-stimulation paradigm. 10 Each patient performed finger tapping with the affected hand during pretherapy/posttherapy MEG sessions, and the resulting β- and γ-frequency oscillatory responses were imaged using beamforming. The primary hypothesis was that patients would show altered γ-band activity (ie, plasticity) in motor cortices after the training program.
Methods
Participants
A total of 4 chronic patients (2 males) with unilateral lesions of the primary sensorimotor cortices following ischemic stroke of the middle cerebral artery participated. At study onset, their mean age was 58 years, and all were at least 2 years poststroke. All consented to participation in accordance with Wake Forest University Institutional Review Board guidelines.
MEG Paradigm and Therapy Program
During each MEG session, patients performed a unilateral finger tapping task using the second digit of the affected limb. Participants were seated within the magnetically shielded room with both arms resting on cushions attached to the chair body. A nonmagnetic button box was positioned under the affected limb to quantify movement onsets. Patients were instructed to fixate on a cross hair presented centrally and to perform a single response each time a dot reached the 12-o’clock position. This dot completed 1 full revolution, around a clock-like circle without numbers or tick marks, every 6 s. Each participant performed approximately 130 trials per session.
Patients initially underwent 2 consecutive baseline recording sessions (within 2-4 days) to assess the stability of MEG motor responses. All patients then completed a series of common baseline behavioral tests (described below) and immediately began a 2-week intensive task-oriented therapy program, which involved occupational therapy tasks aimed at improving functional use of the impaired hand. The tasks focused on skill acquisition and were selected because they were repeatable and had a functional goal such as pinching, grasping, reaching, release, and rotating. Patients also performed general activities related to daily living, coordination, and balance. Tasks and activities with progressive difficulty were applied, so that the extended motor ability could be kept just beyond the performance already achieved. Therapy was approached in a 1:1 trainer-to-patient ratio design, involving repetitive attempts to improve the motor deficit. Immediately preceding their 4-hour task-oriented therapy session, patients completed a 2-hour block of peripheral nerve stimulation (PNS; 2 patients) or sham stimulation each day. Group assignment was pseudorandom. The simulation intensity was adjusted to elicit small compound muscle action potentials of 50 to 100 µV in patients of the PNS group, whereas stimulation intensity was adjusted to 10% of the perceptual threshold for the sham group. Trains of electrical stimulation were delivered at 1 Hz, and each train consisted of 5 single pulses of 1 ms duration, 100 ms apart (10 Hz; 50% duty cycle). When patients completed the therapy program, they were reassessed with the same series of behavioral tests to quantify improvements in function. These tests included the Wolf Motor Function Test (WMFT), which is a timed test of upper-extremity movement, where lower scores mean better function; the Action Arm Research Test (ARAT), which assesses a client’s ability to handle objects differing in size, weight, and shape on a 57-point scale (higher numbers mean better function); and the Fugl-Meyer Assessment (FMA), which is a stroke-specific, performance-based impairment index. For the FMA, we used only the upper-extremity portion, where the maximum score is 66 (higher score means more improvement). Then, 2 to 3 weeks after completing therapy, patients returned for a postintervention MEG session. All patients completed 3 MEG sessions and the therapy program within a 5-week period.
MEG Data Acquisition
With an acquisition bandwidth of 0.25 to 150 Hz, neuromagnetic responses were sampled continuously at 600 Hz using a whole-cortex CTF 2005 neuromagnetometer system equipped with 275 first-order axial-gradiometer coils (CTF Systems Inc, Vancouver, BC, Canada). All MEG data were subjected to synthetic third-gradient balancing, which removed or strongly attenuated the external nonbiological noise sensed by the 29 MEG reference sensors located distant to the cortex.
Anatomical MRI Acquisition and MEG Coregistration
High-resolution neuroanatomical images were acquired using a 1.5T GE scanner. MRI-visible markers were placed on the 3 MEG fiducial locations (see below) prior to image acquisition. The T1-weighted axial images were obtained using a 3D spoiled gradient echo sequence with the following parameters: matrix, 256 × 256; field of view, 20 cm; slice thickness, 1.5 mm with no gap between slices; number of slices, 124; in-plane resolution, 0.78 × 0.78 mm2. The structural scans were aligned parallel to the anterior and posterior commissures and used for MEG coregistration.
Prior to MEG, 3 coils were attached to the patient following a conventional 3-point fiducial system (nasion and left/right periauricles). Once positioned for MEG, these coils were energized to induce a magnetic field, thereby allowing the coils to be localized in reference to the sensors. The electric current applied to the MEG coils was maintained throughout the recording, which enabled head position to be continuously monitored during each session. Because the coil locations were known in head coordinates, all MEG measurements could be transformed into a common coordinate system based on the spatial relationship of the fiducials to each gradiometer coil. Using this coordinate system, the raw MEG data were coregistered with the patient’s structural MRI volume before source analyses.
MEG Preprocessing
Artifact rejection was based on a fixed threshold method (exceeding ± 1.2 pT), supplemented with visual inspection. Epochs were of 6 s duration (−3 to 3 s), with 0 ms defined as the movement onset and the baseline being the −2700 to −1800 ms window. Artifact-free epochs from each condition were transformed into the time–frequency domain using complex demodulation, and the resulting spectral power estimations per sensor were averaged over trials to generate time–frequency displays of mean spectral density. These data were normalized by dividing the power value of each poststimulus time–frequency bin by the respective frequency’s baseline power, calculated as the mean power during the period preceding stimulus onset. This normalization procedure allowed task-related power fluctuations to be readily visualized in sensor space, and once identified, the neural regions generating these event-related synchronizations (ERSs; power increases) or desynchronizations (ERDs; power decreases) could be imaged by subjecting the data to a beamformer.
MEG Source Imaging
Cortical networks were imaged using synthetic aperture magnetometry, which is a nonlinear adaptive beamforming method that provides 3D source images reflecting the power of cortical currents. 11-14 In principle, the beamformer operator generates a spatial filter that passes signals without attenuation from a region of interest (ROI) while suppressing activity in all other brain areas. The filter properties arise from the forward solution (lead field) for each location on a volumetric grid specified by input voxel space and from the MEG data covariance matrix. Basically, for each target voxel, a set of beamformer weights is determined, which amounts to each MEG sensor being allocated a sensitivity weighting for activity in the particular voxel. This set of beamformer weights is the spatial filter unique to the target voxel, and this procedure is iterated until such a filter is computed for each voxel in the brain. Activity per voxel is derived by multiplying the signal in each MEG sensor with its corresponding beamformer weight and summing the weighted sensor signals. This is done independently and sequentially for each voxel to produce a volumetric map of electrical source activity with good spatial resolution.
To enhance the spatial resolution, differential synthetic aperture magnetometry was utilized, 13-15 which entails defining an active state and a passive state (or reference period), per trial, in the continuous time series data. The output image then reflects the source power difference between the 2 states in the specified frequency band of interest. Based on the sensor-level analyses (see above), the following time–frequency components (TFCs) were imaged in each patient: premovement β ERD (16-28 Hz; active: −300 to 400 ms; passive: −2650 to −1950 ms), postmovement β ERS (16-28 Hz; active: 1700 to 2400 ms; passive: −2650 to −1950 ms), and movement-onset γ ERS (74-86 Hz; active: 50 to 250 ms; passive: −2400 to −2200 ms). All passbands and time bins were chosen to focus on maximum responses (ie, MEG signal) across the sample, thus, sacrificing some precision on the single-subject, single-session level to achieve a consistent analytical approach across the study.
Activation estimates for the 3 TFCs were computed over the entire brain volume in the native space of each patient. Each patient’s images were then transferred into SPM5 (Statistical Parametric Mapping; Wellcome Department of Cognitive Neurology, London, UK), where the MRI volume was transformed into Montreal Neurological Institute standardized space. This transform was then applied to the native-space functional MEG images, which were coregistered to this structural volume prior to beamforming, and these spatially normalized functional images were resampled to 5 × 5 × 5 mm3 resolution. ROIs were then defined with the automated anatomical labeling template 16 implemented in the WFU Pickatlas. 17,18 ROIs included left- and right-precentral gyri, postcentral gyri, and SMA. To facilitate group analyses, the left/right parameter of each ROI was replaced by a non-affected or affected (ie, lesioned) parameter. For each ROI per patient, activation amplitude, volume, and peak voxel location were extracted for the 3 TFCs per MEG session using the WFU Pickatlas. 17,18
Results
Preliminary Analyses
Prior to examining neural changes associated with therapy, the 2 baseline scans were compared to assess the stability of MEG motor responses in each patient. For each ROI, paired-samples t tests were used to evaluate change unrelated to therapy over a 2- to 4-day period. No significant differences were found for any TFC in any ROI. For all further analyses, results of the 2 baseline scans were averaged and compared with the one follow-up scan.
Intervention Analyses
To evaluate the effect of motor training, initial analyses were collapsed across PNS and sham stimulation groups. As expected, we did not have the power to detect differences on measures of behavioral function, although scores trended in the predicted direction [eg, WMFT scores decreased following therapy; t(3) = 2.14, P = .06]. The MEG analyses indicated reduced postmovement β ERS activation after therapy in the affected [t(3) = −5.5; P < .01] and nonaffected [t(3) = −4.7; P < .02] precentral gyri as well as the affected SMA [t(3) = −3.1; P < .05]; see Figure 1. The movement-onset γ ERS activation was also of reduced amplitude after motor training in the affected precentral gyrus [t(3) = −5.7; P < .01] (see Figures 1-2). To examine the effect of PNS, these data were further interrogated with independent-samples t tests. These analyses indicated that the amplitude of γ ERS activation was more strongly decreased after therapy in the affected precentral gyrus of patients receiving PNS and motor training [t(2) = 9.2; P < .01]; see Figure 2.
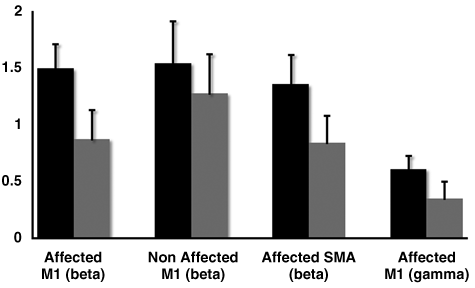
Peak β and γ ERS activity before and after task-oriented therapy: patients showed significant reduction in postmovement β synchronization at the posttherapy follow-up in bilateral precentral gyri and the affected SMA. Likewise, after therapy, the peak amplitude of the high-frequency γ synchronization that coincides with movement onset was reduced in the affected precentral gyrus (far right). The MEG baseline data are shown in black, whereas those from posttherapy are shown in gray. The ordinate indicates the synchronization magnitude in normalized units. Error bars represent 1 standard error of the mean
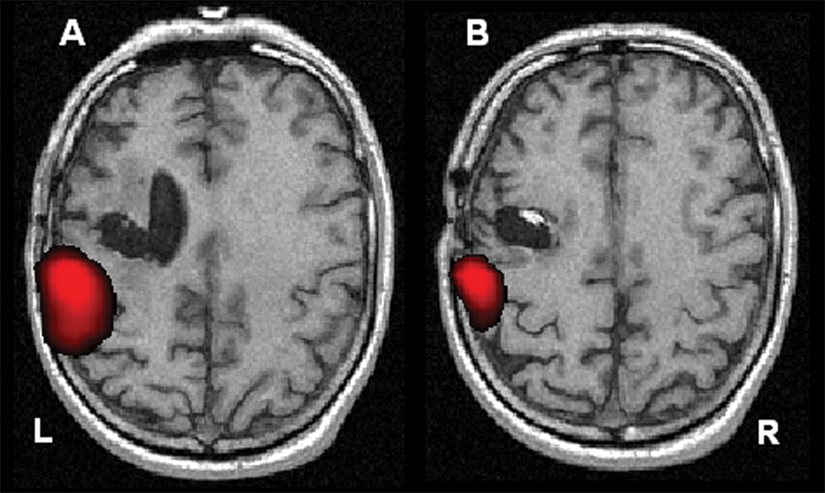
γ ERS activity in a single patient before and after therapy: in both images (A and B), the patient is finger tapping using the second digit of the affected hand. γ ERS responses at baseline (A) were stronger and of larger volume than those observed posttherapy (B) in this patient. To highlight the maxima in each image, the axial slice shown in (A) is 4 mm inferior to that of (B). Both images are shown at the same statistical threshold (P < .001) and in neurological convention (left = left). The therapy protocol for this patient consisted of PNS plus the 2-week task-oriented therapy. When using the affected hand, stronger γ ERS responses at baseline were observed in all patients, but the effect was significantly larger in those who received PNS therapy compared with those who received sham stimulation
In an effort to link MEG and behavioral indices of motor function, we computed Pearson correlation coefficients using the posttherapy MEG data from brain areas where significant pre-post findings were observed. These exploratory analyses indicated that improvement on the FMA was negatively correlated with the amplitude (after therapy) of postmovement β ERS activity in the affected precentral gyrus [r(4) = −0.936; P < .05] and that the same activity in the nonaffected precentral gyrus was negatively correlated with improvement on the ARAT scale [r(4) = −0.972; P = .01]. Finally, improvement on the WMFT was negatively correlated with the post-therapy amplitude of γ ERS activation in the affected precentral gyrus [r(4) = −0.962; P < .02]. Overall, these correlations indicate that greater improvements in motor function are associated with lower MEG activation amplitudes and thus dovetail with the significant findings from the pre-post MEG-only analyses.
Discussion
We used MEG to evaluate plasticity in the oscillatory dynamics of motor networks following 2 weeks of intensive task-oriented therapy, which was paired with either sham stimulation or PNS in a case series of chronic stroke patients. The results indicated that the amplitude of high-frequency γ ERS activity was reduced in the affected precentral gyrus after task-oriented therapy. Likewise, the amplitude of postmovement β ERS decreased in bilateral precentral gyri and the affected SMA after the motor training. The additive effect that PNS had on motor training was strongest for γ ERS activation in the affected precentral gyrus. The amplitude of these γ responses, which coincide with the movement onset, was significantly more reduced following the 2 weeks of motor training in patients who also received PNS. Thus, overall, therapy was associated with a reduction in the intrinsic synchronicity of motor cortices (ie, ERS activity) and not changes in the volume of activations or the location of peak neuronal activity before, during, or after movement onset. Likewise, behavioral measures of improvement in motor function were also significantly linked with the posttherapy amplitude of ERS activation in brain regions known to serve motor function.
Prior MEG/EEG studies in chronic stroke patients have not investigated therapy-related changes in oscillatory sensorimotor activity. Most MEG stroke studies have primarily looked at evoked activity and used dipole modeling to evaluate whether the center of activation changes with recovery. Such work has shown reduced activation in language areas of stroke patients during a receptive language task 19 and significant spatial shifts in the neural generators of the M20 response elicited by median nerve stimulation. 20,21 Such M20 spatial shifts were associated with good recovery of sensorimotor function, whereas normalization of activity in premorbid language areas was linked to better language recovery. 19 Although not their primary focus, several MEG studies have reported increased δ, θ, and/or α synchronicity in the affected hemisphere of patients when compared with matched controls. 20,22 One of these studies also linked significant decreases in δ and θ synchronization within the affected hemisphere with those that showed superior recovery, 20 whereas another found positive correlations between blood-level peroxides, motor upper-limb scores on the National Institutes of Health Stroke Scale (NIHSS), and θ synchronicity in the affected hemisphere. 22 There is also an EEG study linking broadband increases in α and β synchronicity with greater disability in chronic stroke patients. 23
In earlier work, we found TMS motor map size increases to be associated with better recovery, especially in the affected hemisphere. 2 Although the current study did not find a significant volume effect (increase or decrease), there was a trend for greater activation volume posttherapy, which was clearly stronger in the PNS patients. A recent functional MRI study showed similar results because the strongest effect was a reduction in the magnitude of activity (not volume) after therapy in the affected M1 cortices. 24 This decrease in magnitude was also associated with behavioral gains as indexed by the WMFT, 24 which parallels the current findings in regard to the movement-onset γ ERS. Such decreases in activation magnitude may reflect enhanced synaptic efficacy in perilesional areas, 24 but the precise mechanism(s) remain to be determined.
Conclusion
By applying frequency-domain beamforming to whole-head MEG data, we evaluated neuronal plasticity associated with a motor training program combined with sham stimulation and PNS in a case series of chronic stroke patients. The key findings were a reduction in post-movement β synchronization and during-movement γ synchronization in the affected primary motor cortices and SMA following therapy in both groups. In addition, the posttherapy decrease in γ synchrony was significantly stronger in the affected precentral gyrus of patients receiving PNS relative to the sham group. These reductions in cortical synchronization may indicate that the intervention brings inhibitory function back toward more homeostatic levels by modulating stellate cell-firing rates, local synaptic connectivity, or another mechanism, thereby enhancing network efficiency in motor cortices.
Footnotes
The author(s) declared no potential conflicts of interest with respect to the authorship and/or publication of this article.
This work was supported by the American Heart Association (AHA) [0530242N] and an intramural grant from Wake Forest University Health Sciences.