
Abstract
Background. Establishing prognosis in patients in a persistent vegetative state (VS) is still challenging. Neural networks underlying consciousness may be regarded as complex systems whose outputs show a degree of unpredictability experimentally quantifiable by means of nonlinear parameters such as approximate entropy (ApEn). Objective. The authors propose that the VS might be the result of derangement of the above neural networks, with an ensuing decrease in complexity and mutual interconnectivity: this might lead to a functional isolation within the cerebral cortex and to a reduction in the chaotic behavior of its outputs, with monotony taking the place of unpredictability. To test this hypothesis, the authors investigated whether nonlinear dynamics methods applied to electroencephalography (EEG) recordings may be able to predict outcomes. Methods. A total of 38 vegetative patients and 40 matched healthy controls were investigated. At admission, all patients were assessed by means of the Extended Glasgow Outcomes Coma Scale (E-GOS) and the Coma Recovery Scale–Revised (CRS-R). At the same time an EEG recording was performed and used for time series analysis and ApEn computation. Patients were clinically reassessed at 6 months from the first evaluation. Results. Mean ApEn values (0.73, standard deviation [SD] = 0.12 vs 0.97, SD = 0.02; P < .001) were lower in patients than in controls. Patients with the lowest ApEn values either died (n = 14) or remained in a VS (n = 12), whereas patients with the highest ApEn values became minimally conscious (n = 5) or showed partial (n = 4) or full recovery (n = 3). Conclusions. These findings suggest that dynamic correlates of neural residual complexity might help in predicting outcomes in vegetative patients.
Introduction
Vegetative states (VSs) and minimally conscious states (MCSs) are disorders of consciousness (DOCs) with preserved wakefulness: by definition patients in a VS are awake but not aware, and patients in a MCS demonstrate discernible but inconsistent evidence of consciousness. 1,2
Owing to the lack of a clear definition of consciousness itself and to the great variability of brain damages leading to DOCs, establishing a prompt and reliable prognosis remains very challenging. 3 Being able to predict neurological outcomes of these patients would allow us to better plan their management and meet the communication and information needs of caregivers. Nevertheless, specific key prognostic predictors have not been identified to date.
Basic electroencephalography (EEG) recordings allow us to explore wakefulness fluctuations both in normal (ie, sleep–wake cycles) and in pathological conditions (ie, coma). In contrast, the awareness recovery cannot be predicted reliably by routine EEG findings, which also fail to differentiate between vegetative and minimally conscious patients: these limitations are responsible for the low predictive value of traditional EEG analysis in patients with DOCs. 4-6
On the other hand, quantitative measurements of EEG characteristics may reveal a bulk of information hidden to the human eye, by means of both linear and nonlinear analysis: these analyses, respectively, quantify spectral frequency components in the time domain and complexity-related parameters that are inherent to dynamic and time-varying changes in the interconnections regulating functional binding/unbinding of neuronal assemblies. Linear analysis is aimed at calculating the amount of EEG signal in each major frequency band and is commonly used together with topographic mapping. On the other hand, nonlinear analysis quantifies the spontaneous EEG fluctuations, which as a consequence of neural network complexity, show nonlinear dynamics consisting of sudden, disproportional, and unpredictable changes.
For instance, linear and nonlinear quantitative EEG analysis has been recently proposed to monitor the effect of anesthetic drugs on the neural system, 7 to explore brain dysfunctions in Alzheimer’s disease, 8-10 and to predict the occurrence of epileptic seizures. 11 To date, this analysis has not even been formally proposed to assess prognosis in patients with DOCs.
In this regard, we recently reported about the predictive value of linear analysis findings in patients in a VS, based on the recognition of higher occipital source power of α1 and α2 in recovering patients with respect to nonrecovering ones. 12 However, although such analysis may contribute to prognosis evaluation, it provides no information about the preserved integrity of neural networks presumably underlying consciousness.
In this respect, additional data may be derived from nonlinear analysis. In this regard, we recently provided evidence about the predictive value of EEG nonlinear analysis in patients in a VS: nonlinear analysis applied to the EEG signal is able to discriminate not only patients from healthy controls but also patients who recover from those persisting in a VS. 13 Further information may also be obtained from EEG nonlinear analysis: in a pilot study, we recently investigated its validity in discriminating 10 vegetative patients from healthy controls without, at that time, focusing on its prognostic validity in predicting neurological outcomes. 14
Consciousness depends on the continuous interaction of wide neural networks, which may be regarded as complex systems whose outputs show a degree of unpredictability empirically quantifiable by means of nonlinear parameters such as approximate Entropy (ApEn). 15-18 The central assumption of the article is that DOCs might be the result of derangement of the above neural networks and mutual isolation with an ensuing decrease in overall complexity and mutual interconnectivity. 19 This might lead to a functional loss of loops involving cortical relays ending in a reduction in the chaotic behavior of its outputs, with monotony taking the place of unpredictability.
ApEn, a nonlinear parameter quantifying the degree of unpredictability in a time series, reflects the complexity of its source: reduction in ApEn values may be regarded as a measure of functional isolation within the source itself from other sources. 18,20
The aim of this study is to investigate whether EEG nonlinear analysis may be able to predict outcomes in severely brain-injured patients with a diagnosis of VS. We tested the hypothesis that the derangement of neural networks in patients in a VS with low or no progressive recovery of awareness may be reflected in a functional isolation within electric signals from cortical relays leading to an ensuing alteration of the EEG nonlinear dynamics as expressed by ApEn.
Materials and Methods
Participants
A total of 38 brain-injured patients with a diagnosis of VS and admitted to the Post-Coma Intensive and Rehabilitation Care Unit between January 1 and December 31, 2007, were included in the study (27 men and 11 women; mean age 43.5 years, standard deviation [SD] = 15.5 years). To be included, patients had to be free of any acute comorbidity such as respiratory failure, infections, fever or hypothermia, hydrocephalus, and severe dysautonomia. Patients with epileptic seizures or treated with neurotropic drugs such as tricyclic antidepressants, anticholinergics, benzodiazepines, barbiturates and neuroleptics were excluded, as were patients with decompressive craniectomy or cranial defects affecting the regional EEG amplitude.
Among study participants, the most frequent diagnosis was traumatic brain injury (n = 19), followed by intracerebral hemorrhage (n = 10), ischemic stroke (n = 5), subarachnoid hemorrhage (n = 2), cerebral infection (n = 1), and meningioma (n = 1).
All patients were assessed at admission and through a 6-month follow-up period by means of the Extended Glasgow Outcomes Coma Scale (E-GOS) and the Coma Recovery Scale Revised (CRS-R). 21,22 VS was diagnosed according to the criteria of the Multi-Society Task Force on PVS (persistent VS). 1 MCS was diagnosed in the presence of inconsistent but discernible evidence of consciousness. 2
At admission, an EEG recording with a 20-channel common reference montage was performed in all patients and controls. The control group consisted of 40 healthy participants who were recruited from a pool of volunteers and matched by age and sex with the patient group (27 men and 11 women; mean age = 45.5 years, SD = 13.4 years). To be selected as controls, they should not have had any past or present neurological disorders and should not have taken any medication.
A written consent was signed by legal representatives of the patients and by the healthy controls. The work was done in accordance with the Declaration of Helsinki, and an ethics committee review was not required.
EEG Recording
The EEGs were recorded from the 19 scalp loci of the international 10–20 system (channels Fp1, Fp2, F3, F4, C3, C4, P3, P4, O1, O2, F7, F8, T3, T4, T5, T6, Fz, Cz, and Pz), with all electrodes referenced to the chin. With the participants in a resting state, awake, and with closed eyes, more than 5 minutes of data were recorded from each one using the EEG monitoring system (E.B. NEURO, Florence, Italy). To monitor eye movements, an electrooculogram (0.3-70 Hz band-pass) was also collected. The EEG recordings were performed in the late morning in all participants. The controls were requested to be relaxed, awake, and with closed eyes and to be engaged in no specific mental activity during EEG recording. Conversely, a neurophysiology technician was asked to keep the fingertips on the patients’ eyes during the EEG recording because patients could not be asked to purposefully keep their eyes continuously closed for some minutes. To keep the level of vigilance constant, an experimenter controlled the participant and the EEG traces online to monitor signs of drowsiness and sleep onset (increase of ‘‘tonic” θ rhythms, K complexes, and sleep spindles in patients; behavior in controls). The participants were alerted any time there were signs of behavioral and/or EEG drowsiness. EEG data were first processed with a low-pass hardware filter at 100 Hz. Then, they were sampled at 256 Hz with a 12-bit A-to-D precision and processed with a high-pass filter at 70 Hz. Recordings were made under the eyes-closed condition to obtain as many artifact-free EEG data as possible. Each EEG record was judged by visual inspection to be free from electrooculographic and movement artifacts and to contain minimal electromyographic activity. In addition, EEGs were organized in epochs of 5 s (1280 points) that began when the recording was stable (ie, the noisy parts at the beginning of the recording were discarded). All data were digitally filtered with a band-pass filter with cutoff frequencies at 0.5 Hz and 40 Hz to remove electromyographic activity prior to the ApEn and relative power calculations. An average number of 30.0 ± 18.5 artifact-free epochs (mean ± SD) were selected from each electrode and each participant and copied as ASCII files for offline analysis on a personal computer (workstation Hewlett Packard, dual processor). The offline analysis was implemented in MATLAB language (release 6.5, The Mathworks, Natick, MA).
Calculation of Approximate Entropy
We choose ApEn as the main parameter for nonlinear analysis. ApEn quantifies the complexity (or irregularity) of a signal and offers robustness in case of short and noisy data. 18,20,23,24 It is scale invariant and model independent, evaluates both dominant and subordinated patterns in data, and discriminates series for which clear feature recognition is difficult. The algorithm for estimating ApEn of the heart rate was first reported by Pincus. 23 We explain that approach as applied to EEG data. ApEn is defined as the logarithmic likelihood that the patterns of the data that are close to each other will remain close for the next comparison within a longer pattern. Given a sequence of N numbers of EEGs—EEG(1), EEG(2), . . . , EEG(N)—to compute ApEn of each EEG data set, m-dimensional vector sequences p m (i) were constructed from the EEG series, such as [p m (1), p m (2), . . . , p m (N − m + 1)], where the index i can take values ranging from 1 to N − m + 1. If the distance between the 2 vectors p m (i) and p m (j) is defined as |p m (j) − p m (i)|,
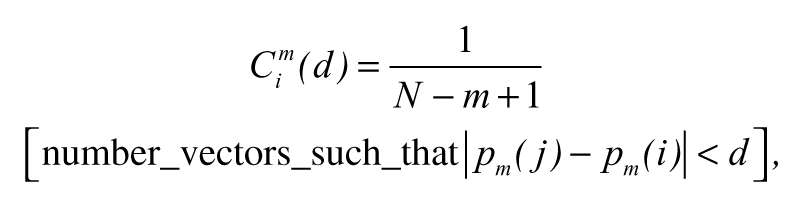
where m specifies the pattern length, which is 2 in this study, and d defines the criterion of similarity, which has been set at 20% of the SD of 400 EEG data that can produce reasonable statistical validity of ApEn. 23 Referring to theoretical analysis of ApEn statistics, Pincus and Goldberger 20 concluded that m = 2 and d = 10% to 25% of the SD of N values (100-900 data points) will yield statistically reliable and reproducible results. Cim(d) is considered as the mean of the fraction of patterns of length m that resemble the pattern of the same length that begins at index i. ApEn is computed using the following equation:
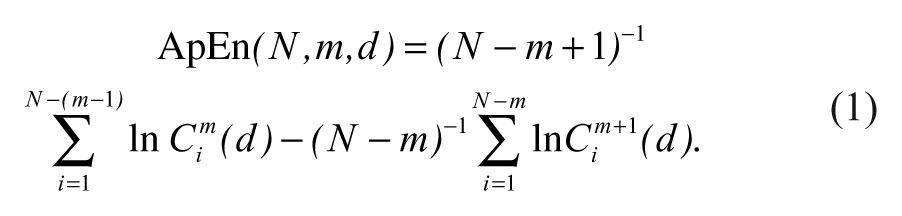
In our study, we used a data set of 400 adjacent EEG data points. We divided the data set into smaller sets of length m = 2. This amounts to 200 smaller subsets. The next step was to determine the number of subsets that are within the criterion of similarity d = 20% of the SD of 400 EEG points. ApEn is then calculated using Equation 1. Because of the nonlinear character of EEG signals, although m and r are critical in determining the outcome of ApEn, no guidelines exist for optimizing their values. In principle, the accuracy and confidence of the entropy estimate improve as the number of matches of length m and m + 1 increase. The number of matches can be increased by choosing small m (short templates) and large r (wide tolerance). However, there are penalties for criteria that are too relaxed. 18 Pincus has suggested that we estimate ApEn with parameter values of m = 1, 2 and r = 0.1, 0.15, 0.2, and 0.25 times the SD of the original data sequence EEG(N). Normalizing r in this manner gives ApEn a translation and scale invariance, in that it remains unchanged under uniform process magnification, reduction, or constant shift to higher or lower values. Moreover, several studies have demonstrated that these input parameters produce good statistical reproducibility for ApEn for time series of length N = 400, as considered herein. 18,20,23 For this study, ApEn was estimated with m = 2 and r = 20% times the SD of the original data sequence. Calculation of ApEn from the EEG signals was done with software developed with MATLAB. To quantify the study parameters, a specific software in MATLAB language (release 6.5, The Mathworks, Natick, MA) was developed by one of the authors (FS).
Statistical Analysis
ApEn was computed for each of the scalp loci of the international 10-20 system with 19 electrodes. Because the sample size of our study was 78 (40 healthy people and 38 patients), the ratio cases-per-variable was too low to perform a reliable multivariable group analysis to discriminate patients from controls, as well as to perform a reliable multivariable prognostic model to predict the outcome of patients. Thus, the first statistical procedure was to summarize the data matrix with 19 columns in a reduced matrix with fewer columns (ie, vectors resulting from a linear combination of original values). This objective was reached by means of a factor analysis. Principal component analysis based on the correlation matrix was chosen as the method of extraction. Although the cases-per-variable ratio was low in theory even for such a procedure, the application provided some useful insights. In fact, the Kaiser-Meyer-Olkin measure of sampling adequacy was 0.945 (“marvelous,” according to the heuristic classification of the index), indicating that the mean partial correlation was very high. In addition, PCA extracted only 1 factor with an eigenvalue higher than 1 (Kaiser’s criterion), and this factor was able to summarize the 66% of the total information provided by the 19 measures. Therefore, a single measure (the average) can be used to summarize the total amount of information. However, despite the fact that factor analysis could not be rigorously applied separately in each group because of the very low cases-per-variable ratio, we observed that the Kaiser-Meyer-Olkin measure was high (0.808, “meritorious”) for healthy participants but low (0.415, “unacceptable”) for patients. This finding was in agreement with the larger dispersion among electrodes observed in patients (dispersion mean = 0.115; dispersion SD = 0.036) versus controls (dispersion mean = 0.087; dispersion SD = 0.014), as indicated by a t test [t(47.1) = 4.457; P < .001]. In addition, the coefficient of variation (=SD/mean) was 9% in controls and 16.5% in patients, and the latter is a level that weakens the “representativeness” of the mean. All these findings suggest that a mean ApEn could be used for controls but could be a less precise index for patients.
Therefore, the minimum and the maximum ApEn were also considered as alternative indexes. Of course, such values were less representative than the mean (with respect to the 19 electrodes) but could be more sensitive/specific to discriminate patients from controls and more able to predict the outcome.
Results
Main Findings
At admission, all patients had a stable CRS-R score that was consistent with a diagnosis of VS: the score ranged from 4 to 9 with none of the items for MCS being satisfied. The diagnosis of VS was also confirmed by the E-GOS for all patients (E-GOS category 2). The mean time for PVS at the beginning of the evaluation was 2.5 months (mean ± SD = 2.5 ± 0.3 months). Mean ApEn values (0.73, SD = 0.12 vs 0.97, SD = 0.02; P < .001) were lower in patients than in healthy controls (Figure 1).
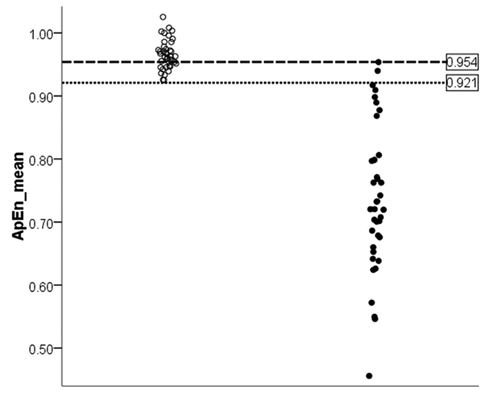
Individual values of ApEn_mean of healthy participants (open circles) and patients (closed circles): the cutoff of 0.921 (dotted line) is associated with a specificity of 100% and a sensitivity of 94.7%, whereas the cutoff of 0.954 (dashed line) is associated with a specificity of 70% and a sensitivity of 100%. Abbreviation: ApEn, approximate entropy.
At the 6-month follow-up, patients with the lowest ApEn values either died (n = 14) or persisted in VS (n = 12), whereas patients with the highest ApEn values became minimally conscious (n = 5) or showed partial (n = 4) or full recovery of consciousness (n = 3); (Figure 2).
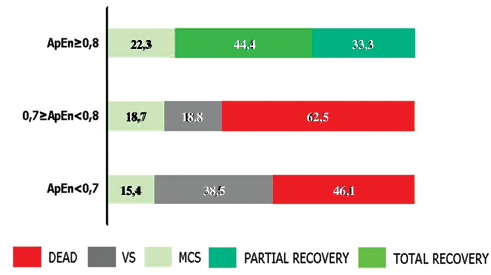
Clinical outcomes at 6 months follow-up evaluation (percentage of patients). Abbreviations: ApEn, approximate entropy; VS, vegetative state; MCS, minimally conscious state.
The relationship between ApEn_mean and E-GOS and CRS-R scores is described by an exponential model (Figures 3A and 3B). The correspondence between individual mean ApEn values and traditional EEG findings for each patient is shown in Table 1.
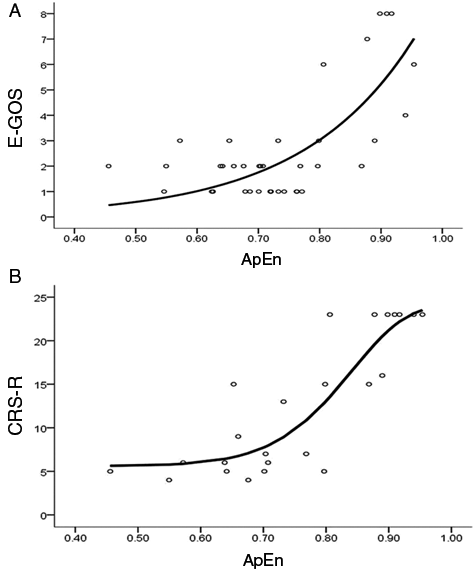
Relationship between ApEn values and E-GOS (A) and CRS-R scores (B) at the 6-month follow-up evaluation: the overall group (38 patients) was evaluated by means of the E-GOS, which also includes the death condition among outcomes (A). For patients who remained alive along the follow-up period (24 patients), CRS-R scores, which are better focused to consciousness transitions, are reported (B). Abbreviations: ApEn, approximate entropy; E-GOS, Extended Glasgow Outcomes Coma Scale; CRS-R, Coma Recovery Scale–Revised.
Correspondence Between Individual Mean ApEn Values and Traditional EEG Findings for Each Patient
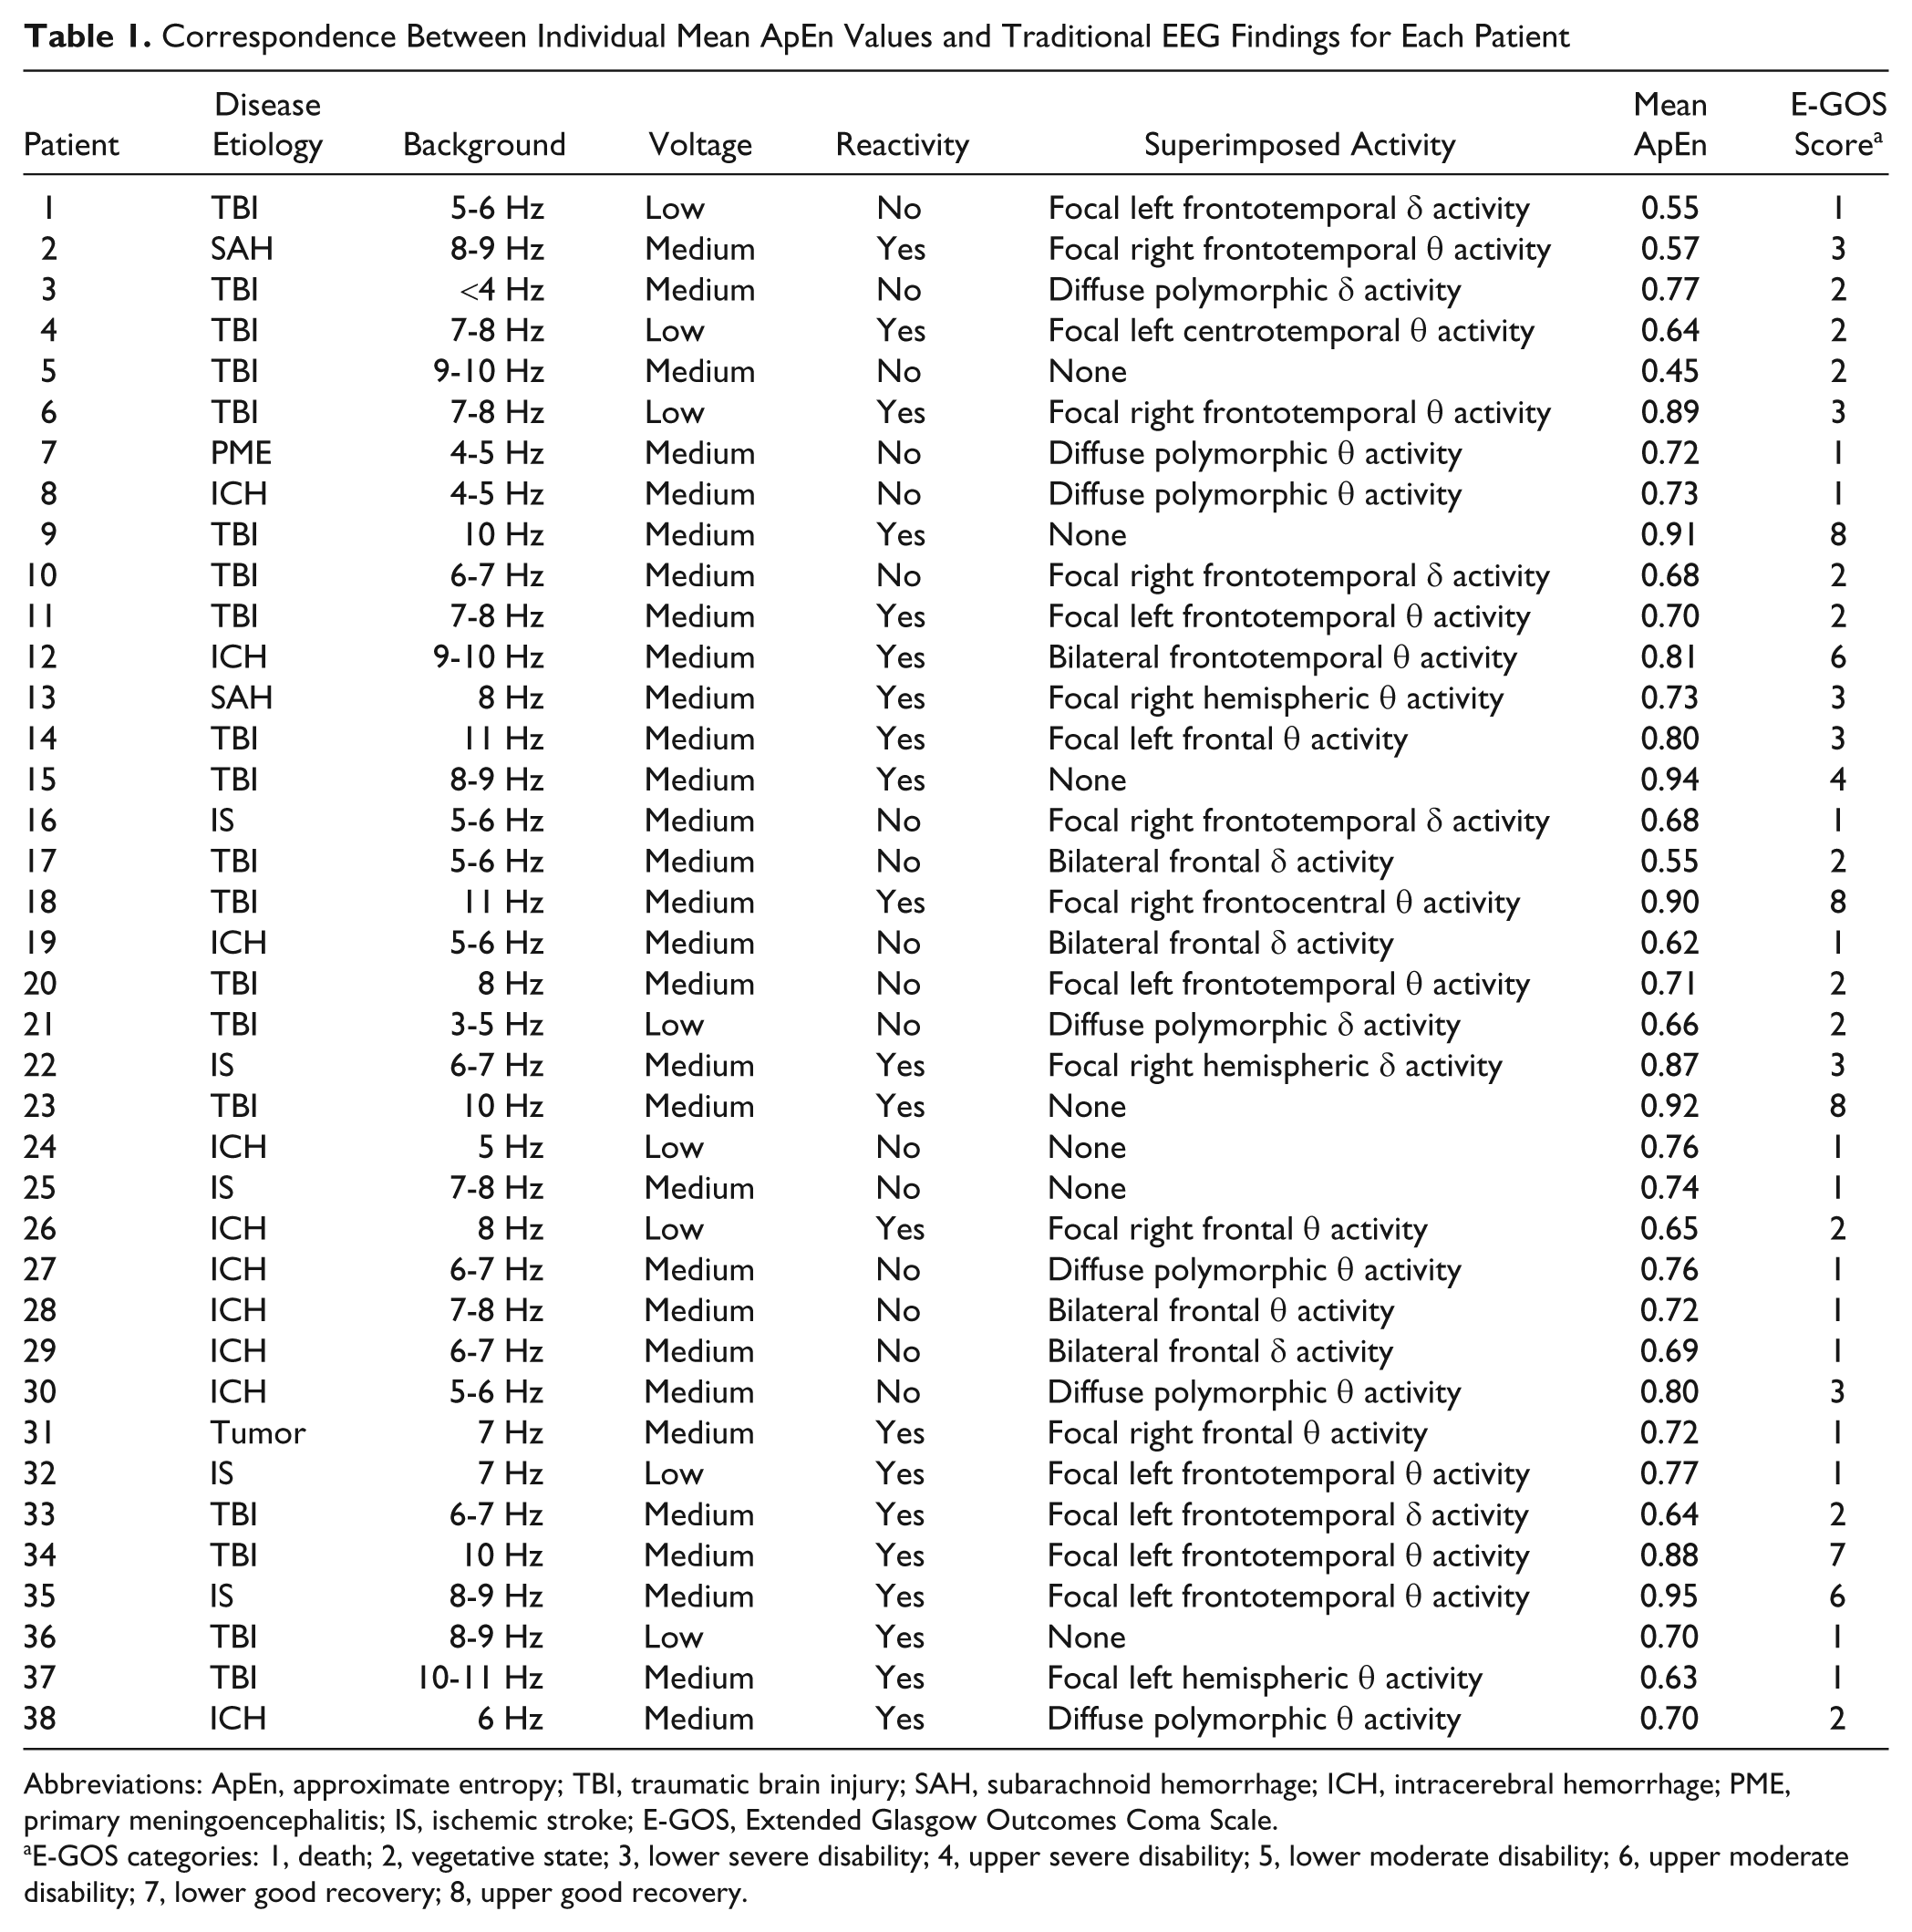
Abbreviations: ApEn, approximate entropy; TBI, traumatic brain injury; SAH, subarachnoid hemorrhage; ICH, intracerebral hemorrhage; PME, primary meningoencephalitis; IS, ischemic stroke; E-GOS, Extended Glasgow Outcomes Coma Scale.
E-GOS categories: 1, death; 2, vegetative state; 3, lower severe disability; 4, upper severe disability; 5, lower moderate disability; 6, upper moderate disability; 7, lower good recovery; 8, upper good recovery.
Discriminant Validity of ApEn
Logistic regression indicated that ApEn_mean, ApEn_min, and ApEn_max have a strong discriminative validity. Nagelkerke R 2 were 0.918, 0.875, and 0.939, respectively, indicating that the highest discriminative power was reached by ApEn_max. The odds ratio (OR) for ApEn_max was 2.11 (95% confidence interval [CI] = 1.38-3.23), indicating that for each 0.01 decrease, the odds of being patients versus controls increased more than twice. For ApEn_mean, OR was even higher (2.82), although less precise (larger 95% CI = 1.36-5.83). The OR for ApEn_min was 1.54 (95% CI = 1.08-2.18). ROC analysis (not performed for ApEn_min, being the worst discriminant index) indicated that for ApEn_mean a cutoff of 0.921 is associated with a sensitivity of 94.7% and specificity of 100% (no control had ApEn less than this value). To reach a sensitivity of 100% (no patient with ApEn_mean higher than cutoff), the limit should be set at 0.954 (but the specificity goes down to 70%). For ApEn_max a cutoff of 0.973 is associated with a low sensitivity (65.8%) and a specificity of 100% (no control has ApEn_max less than this value). However, to reach a sensitivity of 100% (no patient with ApEn_max higher than cutoff), the limit should be set at 1.043; the corresponding specificity was very high (97.5%) because only very few controls fell below this value.
Prognostic Validity of ApEn
The main end point of this study was the status, as measured by GOS-ext at 6 months after the beginning of VS. The relationships between ApEn_max, ApEn_mean, ApEn_min, and ApEn_Sd as potential predictors and GOS-ext as dependent variable were analyzed. Such relationships could not be represented by a linear regression, and the most simple yet satisfactory model for each of the three was an exponential model corresponding to the following equation:
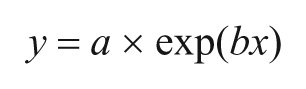
This model accounted for 54.5% of the GOS-ext variance when ApEn_mean was considered, for 35.7% with ApEn_max, and for 31.9% with ApEn_min. When the strongest predictor (ApEn_mean) was entered, the other measures did not add a significant contribution.
The relationship between ApEn_mean and GOS-ext is represented in Figure 3A, and the corresponding equation is as follows:

The null hypothesis of Gaussianity of residuals was not rejected (Shapiro-Wilk = 0.962; df = 38; P = .216) and confirmed by the Q-Q plot (graph not shown).
Because GOS-ext also included patients who died during the follow-up (scored 1), the CRS-R was also used to confirm the prognostic significance of ApEn in patients alive at the end of follow-up. The analysis was performed on 24 patients and, even with a reduced sample size, the relevance of ApEn as a prognostic factor was confirmed. In particular, the relationship between CRS-R and ApEn_mean could be described according to a Weibull model:

This model, shown in Figure 3B, accounted for 75.1% of CRS-R variance, and once again, satisfying statistics were obtained in terms of model validation.
Discussion
The present study reveals that EEG nonlinear analysis may provide reliable prognostic information in patients with DOCs: ApEn has been demonstrated to have a strong discriminative and prognostic validity because it discriminated patients from healthy controls and correlated significantly with the presence of recovery or the persistence of consciousness impairment.
Consciousness improvement has been evaluated along a longitudinal follow-up period by means of the CRS-R, which is the most sensitive and reliable tool to recognize even subtle changes in consciousness impairment: it is able to measure across the span of improvement to track an individual from coma to consciousness recovery. 22 It is divided into 6 subscales addressing auditory, visual, motor, oromotor, communication, and arousal processes with the lowest item on each subscale representing reflexive activity and the highest one representing cognitively mediated behaviors.
The follow-up timing was fixed at 6 months from the first evaluation to strike a balance between the need for a thorough evaluation of outcomes and the mean length of hospitalization within intensive and long-term care units: a more extensive follow-up might put us at risk of erratic and incomplete reporting or uncertain diagnoses. Nevertheless, the mean time for PVS at the beginning of the follow-up (mean ± SD = 2.5 ± 0.3 months) highlights the clinical stability of patients at the first evaluation.
The main advantage of using the EEG nonlinear approach in predicting outcomes lies in its independence from the extreme heterogeneity of lesions leading to consciousness impairment. The absence of specific brain area damage being associated in a causative way with VS suggests that consciousness, compared with other more specialized cognitive functions, is neither localized within a confined brain region nor linked to a given network functionality but depends on the synergy of widely interconnected cortical–subcortical networks. This is also in line with recent theories considering the VS as the result of a disconnection syndrome of different cortical networks rather than as a dysfunction of a single area or as the consequence of a global reduction in cortical metabolism. 19 Along this theoretical vein, the most suitable way to predict consciousness recovery should lie in investigating how different brain regions communicate with each other according to the concept of functional connectivity. 25 In this respect, DOCs might be considered to be the result of a neural network derangement, with an ensuing decrease in overall complexity and mutual interconnectivity: this might lead to a functional isolation within the cerebral cortex and to a reduction in the chaotic behavior of its outputs.
Neural networks may be regarded as complex systems whose outputs are under control of a large number of variables belonging to several hierarchical levels: such systems are characterized by a chaotic behavior in their outputs, consisting of unpredictable fluctuations. Because unpredictability is indirectly explored by ApEn, its computation allows us to estimate the degree of functional isolation of interlinked subdivisions within neural networks. ApEn when applied to EEG signals reflects the intracortical information flow in the brain. 26 Low values reflect a condition of functional isolation of single subdivisions independent of the fine anatomical structure governing the whole system itself. The functional isolation, in its turn, gives evidences about the amount of disconnection within the networks that are supposed to subserve consciousness.
Consequently, investigating the neural networks’ functional isolation from a dynamic output signal perspective might allow us to predict consciousness recovery in severely brain-injured patients, even if we know little about the localization of structural and functional damage provoking VS in individual cases. In addition, compared with other methods, ApEn computation is an easily applied technique, which attempts to reassume a complex condition into a simple adimensional measure. Although it is far from being considered as a measure of consciousness phenomena (as occurs for bispectral index with respect to arousal alternations and sleep transitions), ApEn may be considered as a useful prognostic tool, especially in longitudinal studies, which are often limited by the use of more invasive and difficult-to-manage techniques. A multiparameter-based approach, also including ApEn, might be a reliable way to investigate outcomes in patients with DOCs.
Clinical Implications
There is a consensus that wide cortical–subcortical neural networks give rise to consciousness, but no agreement exists regarding which are specifically involved. Putative networks are so wide and strictly interconnected that dissecting them into single anatomical pathways sounds improbable: for this reason, it is intriguing talking about ghost networks underlying consciousness. Moreover, the lack of a clear knowledge about this issue contributes to the difficulties we encounter in establishing prognosis in patients in a VS. ApEn, by reflecting the functional isolation within the source, represents an indirect proof of its integrity in terms of functional interconnectivity, just bypassing the unsolved problem of recognizing hidden consciousness-related networks. Because of its easy clinical applicability (noninvasive, low cost, widely available technology for EEG recording), the proposed nonlinear approach might provide useful information about the residual integrity of ghost networks underlying consciousness, thus significantly improving the prediction ability for functional outcomes in patients in a VS.
Footnotes
Acknowledgements
We are indebted to Lucia Fraioli for her technical help.
The author(s) declared no potential conflicts of interest with respect to the authorship and/or publication of this article.
The author(s) received no financial support for the research and/or authorship of this article.